High aboveground carbon stock of African tropical montane forests - ForestPlots.NET
←
→
Page content transcription
If your browser does not render page correctly, please read the page content below
Article

High aboveground carbon stock of African
tropical montane forests

https://doi.org/10.1038/s41586-021-03728-4        A list of authors and affiliations appears at the end of the paper.

Received: 20 December 2020
                                                  Tropical forests store 40–50 per cent of terrestrial vegetation carbon1. However,
Accepted: 14 June 2021                            spatial variations in aboveground live tree biomass carbon (AGC) stocks remain
Published online: 25 August 2021                  poorly understood, in particular in tropical montane forests2. Owing to climatic and
   Check for updates                              soil changes with increasing elevation3, AGC stocks are lower in tropical montane
                                                  forests compared with lowland forests2. Here we assemble and analyse a dataset of
                                                  structurally intact old-growth forests (AfriMont) spanning 44 montane sites in 12
                                                  African countries. We find that montane sites in the AfriMont plot network have a
                                                  mean AGC stock of 149.4 megagrams of carbon per hectare (95% confidence interval
                                                  137.1–164.2), which is comparable to lowland forests in the African Tropical
                                                  Rainforest Observation Network4 and about 70 per cent and 32 per cent higher than
                                                  averages from plot networks in montane2,5,6 and lowland7 forests in the Neotropics,
                                                  respectively. Notably, our results are two-thirds higher than the Intergovernmental
                                                  Panel on Climate Change default values for these forests in Africa8. We find that the
                                                  low stem density and high abundance of large trees of African lowland forests4 is
                                                  mirrored in the montane forests sampled. This carbon store is endangered: we
                                                  estimate that 0.8 million hectares of old-growth African montane forest have been
                                                  lost since 2000. We provide country-specific montane forest AGC stock estimates
                                                  modelled from our plot network to help to guide forest conservation and
                                                  reforestation interventions. Our findings highlight the need for conserving these
                                                  biodiverse9,10 and carbon-rich ecosystems.

Tropical forests cover less than 10% of the global land area yet store      old-growth forests found at ≥1,000 m a.s.l. (ref. 8). Mountain areas also
40–50% of terrestrial vegetation carbon1 and contribute more than           pose special challenges for remote-sensing approaches for estimating
one-third of primary productivity11, so they are a key component of the     carbon stocks, as radar data are affected by geometric distortions16 and
global carbon cycle12,13. There is substantial variation in carbon stocks   steep slopes bias spaceborne LiDAR estimates towards overestimating
across the biome, with lowland forests in Africa and Borneo storing         canopy height17. These issues are reflected in the limited correlation
more carbon per unit area than lowland forests in the Neotropics4,7.        between estimates of AGC stocks at mountain locations from differ-
This variation arises partly from structural differences: the signature     ent recent remote-sensing-derived carbon maps (Supplementary
feature of African forests is their low stem density but relatively high    Table 1).
abundance of large trees (>70 cm in diameter), which store large quanti-       Better understanding of montane carbon stocks is important for
ties of carbon, whereas Bornean forests are characterized by high stem      many African countries, particularly in eastern Africa where montane
density and basal area4,14,15.                                              forests represent most of the extant evergreen old-growth forest cover.
   Despite increased understanding of biogeographic differences in          Quantifying carbon stocks in these ecosystems is critical for estimating
tropical lowland forests, patterns of spatial variation in carbon stocks    national carbon losses from deforestation and forest degradation18.
remain poorly understood in the 880,000 km2 of tropical montane             Quantifying carbon stocks in old-growth montane forests also serves
forests located ≥1,000 m above sea level (a.s.l.)2. Montane forests are     to constrain potential carbon uptake by restored natural forests, given
expected a priori to have lower aboveground live tree biomass carbon        the high commitment of most African nations to the Bonn Challenge
(AGC) stocks than lowland forests because (1) temperature decreases         effort to restore 150 million hectares of degraded and deforested lands
with increasing elevation, reducing net primary productivity and            by 2020 (Table 1), and 350 million hectares by 2030.
slowing nutrient recycling, (2) long periods of cloud immersion in             Here we measured, compiled and analysed a new dataset of 226 plot
montane forests suppresses productivity, (3) soil waterlogging slows        inventories spanning 44 sites in 12 African countries, covering most
nutrient recycling, and (4) high epiphyte load, local wind exposure         major mountain regions on the continent (the ‘AfriMont’ dataset). Plots
in crests and nutrient-limited soils limit tree size and increase invest-   range from 800 m a.s.l. to 3,900 m a.s.l. to include submontane forests
ment in roots over shoots3. Although forest inventory plots provide         (800–1,000 m a.s.l.) in smaller mountains closer to the ocean19,20. For all
some support for these assumptions2, data from African mountain             plots, stem diameter and species were recorded for each tree ≥10 cm in
regions are exceptionally sparse. Indeed, in the most recent Inter-         diameter at breast height (or above buttress) following standard meth-
governmental Panel on Climate Change (IPCC) guidelines, there is no         ods21. Tree height was sampled in 23 montane sites, allowing variation
specific AGC default value for old-growth montane forests in Africa:        in height–diameter allometry to be incorporated into the calculation
the value given of 89.3 MgC ha−1 is simply a mean of secondary and          of aboveground biomass. A total of 72,336 stems with diameter ≥10 cm

536 | Nature | Vol 596 | 26 August 2021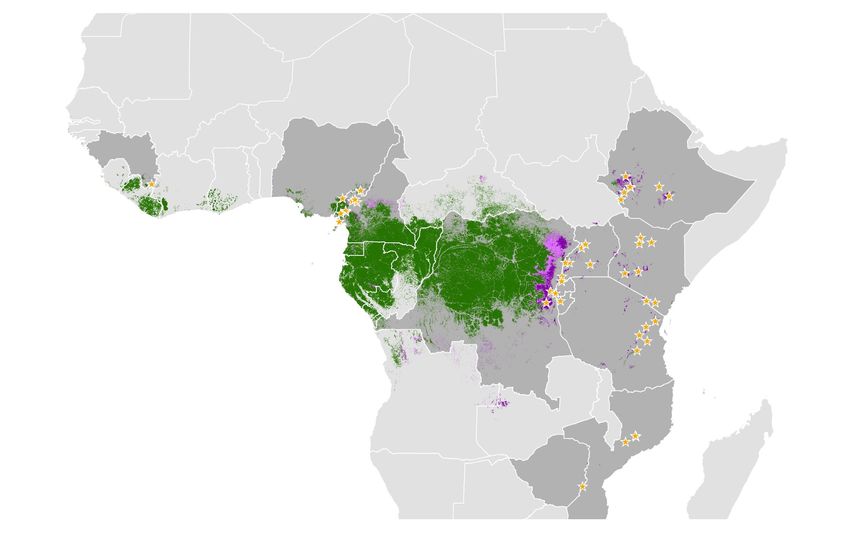
Table 1 | Remaining forest area and AGC estimates for montane and lowland tropical forests in Africa
Country Montane (ha) Montane lost Montane AGC Montane sites Lowland (ha) Lowland AGC Lowland Bonn Challenge
(ha) (Mg ha−1, 95% CI) (plots) (Mg ha−1, 95% CI) plots by 2020 (ha)
Burundi 25,000 300 94 (47–176) 1 (7) 0 0 2 million
Cameroon 840,000 30,200 153 (121–195) 7 (37) 17.7 million 166 (151–185) 72 12 million
Democratic Republic 10.2 million 536,500 129 (84–202) 2 (37) 90 million 158 (135–183) 48 8 million
of the Congo
Ethiopia 1.7 million 62,100 165 (124–215) 8 (25) 145,000 a
0 15 million
Guinea 29,000 1,700 314 (147–616) b
1 (2) 193,000 157 (122– 206)c 24 2 million
Kenya 568,000 44,100 104 (79–136) 8 (38) 37,000 0 5.1 million
Mozambique 18,000 6,600d 226 (146–384)b 3 (4) 93,000 e
0 1 million
Nigeria 42,000 1,400 120 (47–309) b
1 (1) 1.8 million 161 (105–262) 2 4 million
Rwanda 53,000 300 106 (65–168) 2 (11) 0 0 2 million
Tanzania 587,000 13,900 175 (129–234) 6 (29) 130,000 128 (101–163) 16 5.2 million
Uganda 427,000 64,600d 158 (111–209) 6 (23) 18,000 0 2.5 million
Zimbabwe 7,000 800d 203 (108–363) 1 (12) 70 cm in diameter) were not
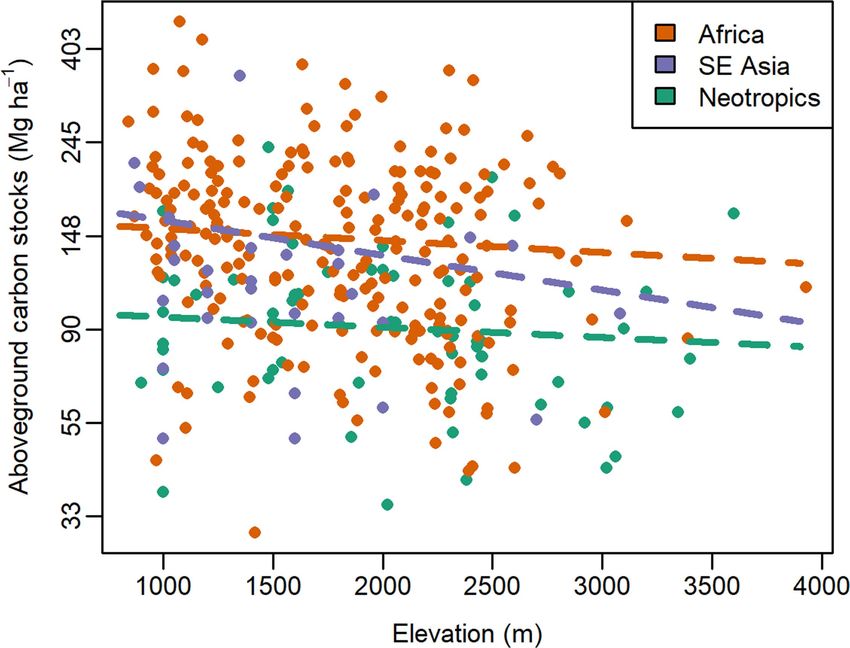
AGC stocks in montane and lowland forests in Africa contrasts with significantly related to elevation (Fig. 3, Supplementary Table 4).
the Neotropics and Southeast Asia, where carbon stocks are lower in Across sites, these non-significant relationships were all negative,
montane forests than lowland forests (albeit not significantly differ- although there was some variation in strength and direction among
ent in Southeast Asia due to the small sample size) (Fig. 1). These dif- sites (Fig. 3). Similarly, in the Neotropics and Southeast Asia montane
ferences are robust to accounting for differences in elevation among forest plot datasets, AGC was not significantly correlated with eleva-
montane datasets: removing African plots 800–1,000 m a.s.l. slightly tion (Extended Data Fig. 4).
reduces estimated montane forest AGC stock to 145.0 MgC ha−1 (95% CI To assess potential environmental drivers of AGC-stock variation
129.6–163.2), but observed differences in AGC stock among continents across the AfriMont plot network, we related AGC to climate, soil and
remain when plots are restricted to elevations that are well represented topography. We found that AGC stocks increased with annual precipi-
in all continents (Extended Data Fig. 3). tation (albeit not statistically significantly), decreased with soil fertil-
The characteristic structural properties of lowland African forests ity and were higher in plots that were locally at higher elevation than
(relatively low stem density and greater importance of large trees com- their surroundings (Extended Data Fig. 5). Relationships with other
pared with elsewhere in the tropics4) are also evident in the African environmental variables were non-significant (Extended Data Fig. 5).
montane forests we sampled. In these montane forests, the mean stem Although global datasets might not capture fine-scale variation in
density is 483.3 stems per hectare (±177.7 s.d.) and the mean basal area climate or soils in mountain regions23, leading to regression dilution24,
is 39 m2 ha−1 (±14.8 s.d.). We find a high density of large stems (>70 cm the general absence of strong climate effects combined with the lack
in diameter, 19.1 stems per hectare ± 15.4 s.d.), which contribute 35.3% of a significant effect of elevation on AGC stocks suggest that the high
(95% CI 29.6–41.8%) to plot-level AGC stock (Fig. 2). The contribution AGC stock of African montane forests is a pervasive phenomenon across
of large trees to plot-level AGC stock is also similar in montane and a wide environmental gradient.
lowland Africa (95% CI of difference in square-root transformed pro- Although the AfriMont dataset covers most major mountain areas
portional contribution of large trees between lowland and montane in tropical Africa (Fig. 4), some areas remain under-sampled relative
Nature | Vol 596 | 26 August 2021 | 537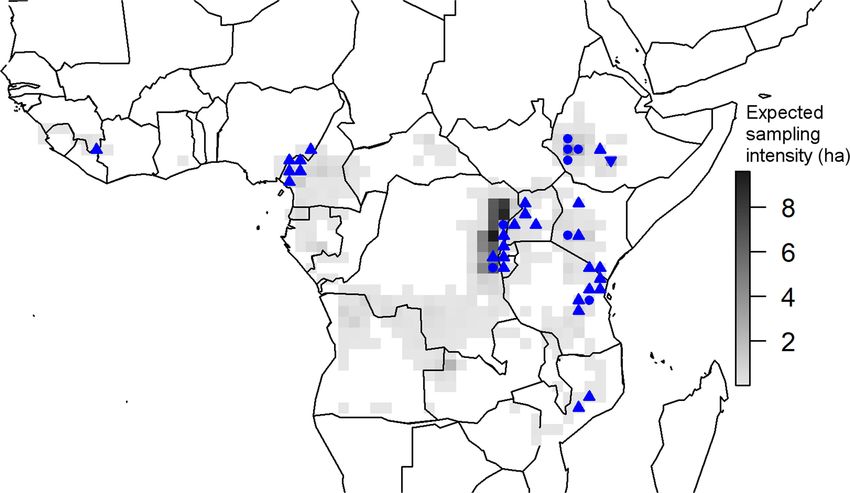
Article
                               d        d    bcd     b         a      c              stands to self-thin, as is seen in lowland African forests4. For exam-
                                                                     Montane         ple, tropical cyclones are largely absent in mainland Africa (except in
                                                                     Lowland         Mozambique28) and lava flows are limited even in the active volcano
                         400                                                         of Mount Cameroon29. Although fine-scale variability in landslide risk
                                                                                     limits comparisons across large spatial scales, there are fewer areas
                                                                                     with high landslide susceptibility in mountains in tropical Africa than
  AGC stocks (Mg ha–1)

                                                                                     in the Andes and most mountain ranges in Southeast Asia30. If forests
                         300
                                                                                     have been ecologically stable over evolutionary timescales, tree spe-
                                                                                     cies may be adapted to grow slowly but potentially reaching great
                                                                                     sizes31. On Mount Kilimanjaro Entandrophragma individuals reach
                         200                                                         enormous heights and ages32. This low frequency of large-scale abi-
                                                                                     otic disturbances contrasts with the Andes and several mountains in
                                                                                     Southeast Asia (for example, Barisian mountains in western Sumatra),
                         100                                                         which are tectonically active, so the trees there are adapted to sud-
                                                                                     den disturbance followed by intense competition to get established
                                                                                     and grow. Future monitoring of the AfriMont plot network will help to
                                                                                     determine the extent to which the high biomass of African tropical
                           0
                                                                                     montane forests results from them being dynamic and productive,
                                   Africa   Southeast Asia    Neotropics             or adapted to stability.
Fig. 1 | Pantropical variation in AGC stocks sampled by plot networks in                A third potential explanation could be the presence of conifers33.
montane (≥800 m a.s.l.) and lowland (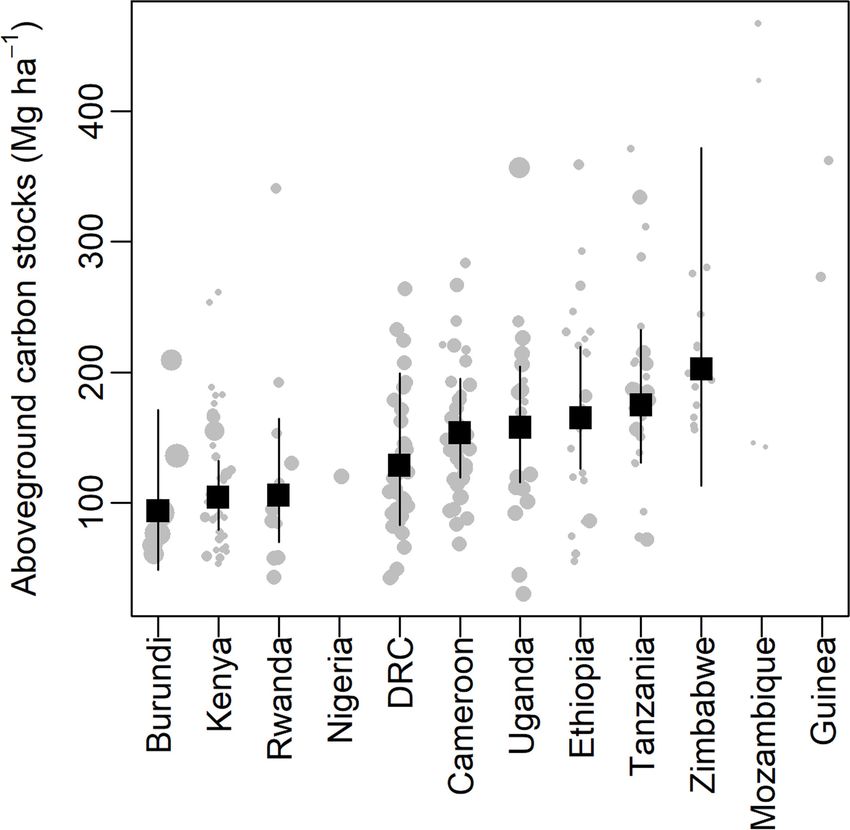
1.0    NS     NS             NS      NS             a
                                                                                                                                    403

                                     0.8

                                                                                               AGC stocks (Mg ha–1)
          Proportion of AGC stocks

                                     0.6                                                                                            148

                                     0.4
                                                                                                                                     55
                                     0.2

                                      0                                                                                                    1,000      2,000           3,000    4,000
                                                                                                                                                          Elevation (m)
                                           70
                                                                                         b
                                                         Size class

                                                                                               Stem density (number per hectare)
                                                                                                                                   1,097
                                     1.0
                                             *      *                  Montane
                                                                       Lowland
                                     0.8
                                                                                                                                    403
          Proportion of stems

                                                                  NS
                                     0.6
                                                                          NS
                                     0.4                                                                                            148

                                     0.2                                                                                                   1,000      2,000           3,000    4,000
                                                                                                                                                          Elevation (m)
                                                                                         c
                                      0
                                                                                          Large (DBH >70 cm) stem density

                                                                                                                                     54
                                           70
                                                         Size class
                                                                                                (number per hectare)

                                                                                                                                     19
Fig. 2 | Proportion of plot-level AGC stock and stems accounted for by each
size class in montane and lowland forests in Africa. Statistically significant
differences in the contribution of each size class between montane and lowland                                                        6
forest plot networks are shown by asterisks (linear mixed-effects model,
P < 0.05). NS, non-significant difference. Montane, n = 226; lowland, n = 132.                                                        2
The thick line shows the median, and boxes cover the interquartile range (IQR).
Values >1.5 times IQR away from the IQR are shown by points.

                                                                                                                                           1,000      2,000           3,000    4,000
to affect—these forests, for example, in Itombwe Mountains in the                                                                                         Elevation (m)

Democratic Republic of the Congo42. Protected areas are known to                  Fig. 3 | Variables as a function of elevation. a–c, Relationship between
help to reduce deforestation in the tropics43. Beyond protected areas,            elevation and plot-level AGC stock (a), stem density (b) and stem density of
other forest conservation mechanisms could be implemented, includ-                large stems (>70 cm diameter) (c) for the AfriMont dataset. Note the log scale of
ing effective carbon finance. Previous IPCC AGC-stock estimates for               y axis. Each response variable was log-transformed and modelled as a function
montane forests in Africa (89.3 MgC ha−1) may have contributed to low             of elevation with a linear mixed-effect models with random slopes. The dashed
incentives for carbon finance mechanisms in these ecosystems. Our                 line shows the relationship across sites (non-significant in all cases, P ≥ 0.3)
study shows the far greater carbon-storage potential in these tropical            (Supplementary Table 4) and the solid lines show the relationship within each
                                                                                  site. The point sizes are proportional to square-root plot area. A polynomial
montane forests, which will be even higher if soil carbon stocks are
                                                                                  model allowing a nonlinear relationship with elevation was also tested but not
considered (for example, >200 MgC ha−1 of organic carbon occurs in
                                                                                  supported over the linear model in any case (P ≥ 0.7) (Supplementary Table 4).
the top 0–30 cm of soil on Mount Cameroon44 and in the Usambara
                                                                                  The absence of a significant relationship with elevation is robust to removing
Mountains, Tanzania45).                                                           the two highest elevation sites, Rwenzori and Virunga (Supplementary Table 4).
   As well as conserving the remaining montane forests, efforts to                DBH, diameter at breast height.
restore them are critical. Forest restoration at one of our sites, Kibale
National Park in Uganda, indicates the potential for rapid AGC accu-
mulation46. Our study shows the high potential AGC stock these mon-               landscape scale, as not all forests are closed-canopy old-growth and
tane forests can attain. The possible co-benefits of forest restoration,          structurally intact. Remote-sensing or ancillary data (landcover maps
notably water regulation, control of soil erosion and landslides, and             and spatial environmental data) could be used to identify, for example,
biodiversity conservation should also be considered. Most African                 exotic plantations, degraded or bamboo forests, and thus help to create
nations are committed to the Bonn Challenge; Ethiopia leading with                detailed AGC maps at different spatial scales18,47. A closer collaboration
15 million hectares committed (Table 1). We provide country-specific              between airborne, spaceborne and ground approaches (such as the
estimates of potential AGC stocks based on forests sampled in the                 AfriMont and AfriTRON plot networks) is key for accurate quantifica-
AfriMont dataset to help guide such interventions (Table 1, Extended              tion and monitoring of landscape-scale tropical forest AGC stocks,
Data Fig. 10). Caution is needed when scaling-up our estimates to the             particularly in mountain regions.

                                                                                                                                                   Nature | Vol 596 | 26 August 2021 | 539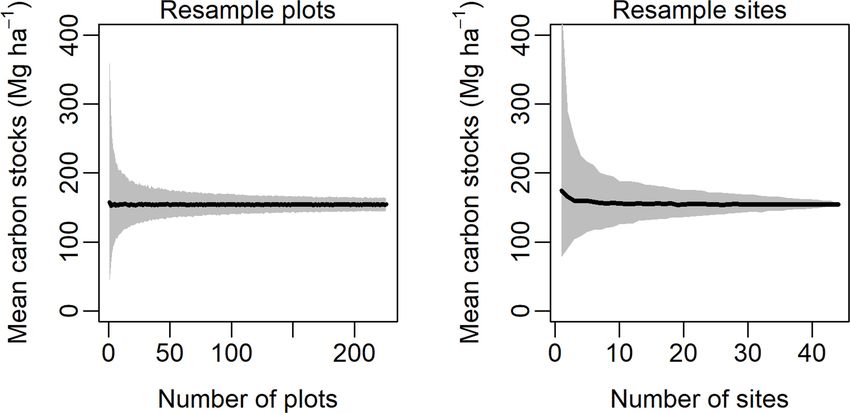
Article
100 30
75 20
100 30 50
10
75 25
20
50 0 0
10 Ethiopia 100 30
25
0 0 75 20
Uganda 50
100 30 10
25
75 20 0 0
50 Kenya
10
25
0 0
Guinea 100 30
100 30 75 20
75 100 30 50
20 10
50 75 25
10 20
25 50 0 0
0 0 10 Rwanda
25
Nigeria 0
0
Cameroon 100 30
75 20
50
100 30 10
25
75 20 0 0
50
10 Burundi
25
Primary humid tropical forests 0 0
Democratic Republic
of the Congo 100 30
Lowland forest circa 2018 75 20
Montane (including submontane) forest 50
10
25
Countries with montane plot data 0 0
100 30 100 30 Tanzania
Bars: % montane versus lowland (left axis) 75 75 20
20
Points: % lost since 2000 (right axis) 50 50
10 10
25 25
AfriMont plot network 0 0 0 0
Zimbabwe Mozambique
Fig. 4 | Old-growth evergreen humid forests in lowland and montane Ethiopia, Kenya, Rwanda, Tanzania, Uganda and Zimbabwe (included in
tropical Africa. Forest extent circa 2018. Montane includes submontane AfriMont); and Zambia, Malawi and South Sudan (no plot data available). Forest
forests (800–1,000 m a.s.l., light purple). Montane forests represent most (or cover extracted from ref. 38 and clipped to ‘primary humid forest’ using ref. 39.
all) evergreen humid old-growth forest in ten African nations: Burundi, See Table 1 for country-level absolute estimates.
8. Domke, G. et al. in 2019 Refinement to the 2006 IPCC Guidelines for National Greenhouse
Our newly compiled dataset and analysis provides a large-scale
Gas Inventories Vol. 4 (eds Calvo Buendia, E. et al.) Ch. 4, 48 (IPCC, 2019).
quantification of AGC stock in African tropical montane forests, 9. African Mountains Atlas (UNEP, 2014).
indicating it to be on average substantially higher than previously 10. Rahbek, C. et al. Humboldt’s enigma: what causes global patterns of mountain
biodiversity? Science 365, 1108–1113 (2019).
thought. Although there is variation around this mean AGC stock
11. Pan, Y. et al. A large and persistent carbon sink in the world’s forests. Science 333,
within and across sites, it is not systematically related to elevation. 988–993 (2011).
Apart from helping refine country-level estimates, IPCC guidelines 12. Booth, B. B. B. et al. High sensitivity of future global warming to land carbon cycle
processes. Environ. Res. Lett. 7, 024002 (2012).
and ground calibration of remote-sensing estimates, continued
13. Hubau, W. et al. Asynchronous carbon sink saturation in African and Amazonian tropical
on-the-ground monitoring of the AfriMont plot network will help forests. Nature 579, 80–87 (2020).
determine ecosystem dynamics and carbon residence time in these 14. Feldpausch, T. R. et al. Tree height integrated into pantropical forest biomass estimates.
Biogeosciences 9, 3381–3403 (2012).
extraordinarily carbon-rich forests, as well as their responses to 15. Bastin, J.-F. et al. Pan‐tropical prediction of forest structure from the largest trees.
climatic changes. Glob. Ecol. Biogeogr. 27, 1366–1383 (2018).
16. CCI BIOMASS Product User Guide Year 1 Version 1.0, https://climate.esa.int/sites/default/
files/biomass_D4.3_Product_User_Guide_V1.0.pdf (Aberystwyth University and GAMMA
Remote Sensing, 2019).
Online content 17. Lefsky, M. A., Keller, M., Pang, Y., de Camargo, P. & Hunter, M. O. Revised method for
Any methods, additional references, Nature Research reporting sum- forest canopy height estimation from the Geoscience Laser Altimeter System waveforms.
J. Appl. Remote Sens. 1, 013537 (2007).
maries, source data, extended data, supplementary information, 18. Willcock, S. et al. Quantifying and understanding carbon storage and sequestration
acknowledgements, peer review information; details of author contri- within the Eastern Arc Mountains of Tanzania, a tropical biodiversity hotspot. Carbon
butions and competing interests; and statements of data and code avail- Balance Manag. 9, 2 (2014); correction 12, 20 (2017).
19. Bussmann, R. W. Vegetation zonation and nomenclature of African Mountains—an
ability are available at https://doi.org/10.1038/s41586-021-03728-4. overview. Lyonia 11, 41–66 (2006).
20. Hamilton, A. Vegetation, climate and soil, altitudinal relationships on the East Usambara
Mountains of Tanzania. J. East Afr. Nat. Hist. 87, 85–89 (1998).
1. Erb, K. et al. Unexpectedly large impact of forest management and grazing on global 21. Phillips, O., Baker, T., Brienen, R. & Feldpausch, T. RAINFOR Field Manual for Plot
vegetation biomass. Nature 553, 73–76 (2018). Establishment and Remeasurement, http://www.rainfor.org/upload/ManualsEnglish/
2. Spracklen, D. V. & Righelato, R. Tropical montane forests are a larger than expected RAINFOR_field_manual_version_2016.pdf (Univ. Leeds, 2016)
global carbon store. Biogeosciences 11, 2741–2754 (2014). 22. Jarvis, A. & Mulligan, M. The climate of cloud forests. Hydrol. Process. 25, 327–343 (2011).
3. Fahey, T. J., Sherman, R. E. & Tanne, E. V. J. Tropical montane cloud forest: environmental 23. Platts, P. J., Omeny, P. A. & Marchant, R. AFRICLIM: high-resolution climate projections for
drivers of vegetation structure and ecosystem function. J. Trop. Ecol. 32, 355–367 (2016). ecological applications in Africa. Afr. J. Ecol. 53, 103–108 (2015).
4. Lewis, S. L. et al. Above-ground biomass and structure of 260 African tropical forests. 24. McInerny, G. J. & Purves, D. W. Fine‐scale environmental variation in species distribution
Phil. Trans. R. Soc. Lond. B 368, 20120295 (2013). modelling: regression dilution, latent variables and neighbourly advice. Methods Ecol.
5. Vilanova, E. et al. Environmental drivers of forest structure and stem turnover across Evol. 2, 248–257 (2011).
Venezuelan tropical forests. PLoS ONE 13, e0198489 (2018). 25. Poulsen, J. R. et al. Ecological consequences of forest elephant declines for Afrotropical
6. Álvarez-Dávila, E. et al. Forest biomass density across large climate gradients in northern forests. Conserv. Biol. 32, 559–567 (2018).
South America is related to water availability but not with temperature. PLoS ONE 12, 26. Berzaghi, F. et al. Carbon stocks in central African forests enhanced by elephant
e0171072 (2017). disturbance. Nat. Geosci. 12, 725–729 (2019); correction 12, 1050 (2019).
7. Sullivan, M. J. P. et al. Long-term thermal sensitivity of Earth’s tropical forests. Science 27. Enquist, B. J. et al. The megabiota are disproportionately important for biosphere
368, 869–874 (2020). functioning. Nat. Commun. 11, 699 (2020).
540 | Nature | Vol 596 | 26 August 2021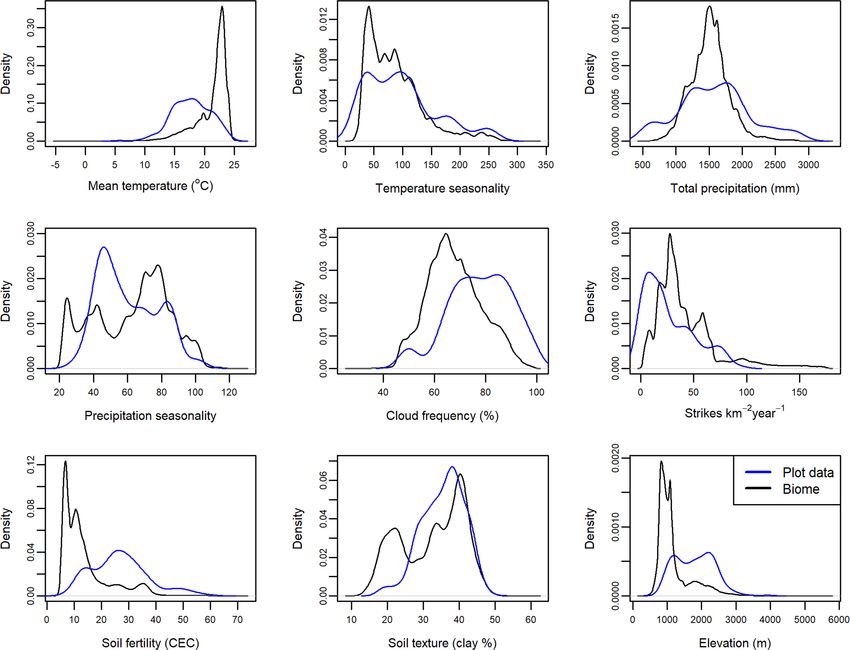
28. Lin, T.-C., Hogan, J. A. & Chang, C. T. Tropical cyclone ecology: a scale-link perspective. 1
Department of Environment and Geography, University of York, York, UK. 2Department of
Trends Ecol. Evol. 35, 594–604 (2020). International Environmental and Development Studies (NORAGRIC), Norwegian University of
29. Favalli, M. et al. Lava flow hazard and risk at Mt. Cameroon volcano. Bull. Volcanol. 74, Life Sciences, Ås, Norway. 3Department of Natural Sciences, Manchester Metropolitan
423–439 (2012).
University, Manchester, UK. 4School of Geography, University of Leeds, Leeds, UK.
30. Stanley, T. & Kirschbaum, D. B. A heuristic approach to global landslide susceptibility 5
Leverhulme Centre for Anthropocene Biodiversity, University of York, York, UK. 6Climate
mapping. Nat. Hazards 87, 145–164 (2017).
31. Lovett, J. C. Elevational and latitudinal changes in tree associations and diversity in the Change Specialist Group, Species Survival Commission, International Union for Conservation
Eastern Arc mountains of Tanzania. J. Trop. Ecol. 12, 629–650 (1996). of Nature, Gland, Switzerland. 7Department of Geography, University College London,
32. Hemp, A. et al. Africa’s highest mountain harbours Africa’s tallest trees. Biodivers. London, UK. 8Biology Department, Université Officielle de Bukavu, Bukavu, Democratic
Conserv. 26, 103–113 (2017). Republic of the Congo. 9Service of Wood Biology, Royal Museum for Central Africa, Tervuren,
33. Culmsee, H., Leuschner, C., Moser, G. & Pitopang, R. Forest aboveground biomass along Belgium. 10Department of Environment, Laboratory of Wood Technology (Woodlab), Ghent
an elevational transect in Sulawesi, Indonesia, and the role of Fagaceae in tropical University, Ghent, Belgium. 11University of Jos, Jos, Nigeria. 12Nigerian Montane Forest Project,
montane rain forests. J. Biogeogr. 37, 960–974 (2010). Yelwa Village, Nigeria. 13Department of Geosciences and Geography, University of Helsinki,
34. Enright, N. J. & Ogden, J. in Ecology of the Southern Conifers (eds Enright, N. J. & Hill, R. S.)
Helsinki, Finland. 14Department of Zoology, Faculty of Science, Charles University, Prague,
271–287 (Melbourne Univ. Press, 1995).
Czech Republic. 15Institute of Vertebrate Biology, Czech Academy of Sciences, Brno, Czech
35. Neale, D. B. & Wheeler, N. C. in The Conifers: Genomes, Variation and Evolution
(eds Neale, D. B. & Wheeler, N. C.) 1–21 (Springer, 2019). Republic. 16Institute of Botany of the Czech Academy of Science, Třeboň, Czech Republic.
36. Mill, R. R. Towards a biogeography of the Podocarpaceae. Acta Hortic. 615, 137–147
17
College of Natural and Computational Science, Addis Ababa University, Addis Ababa,
(2003). Ethiopia. 18Department of Natural Resource Management, College of Agriculture and Natural
37. Helmer, E. H. et al. Neotropical cloud forests and paramo to contract and dry from Resource, Wolkite University, Wolkite, Ethiopia. 19European Commission, Joint Research
declines in cloud immersion and frost. PLoS ONE 14, e0213155 (2019). Centre, Ispra, Italy. 20UK Centre for Ecology and Hydrology, Edinburgh, UK. 21Université du
38. Hansen, M. C. et al. High-resolution global maps of 21st-century forest cover change. Cinquantenaire Lwiro, Département de sciences de l’environnement, Kabare, Democratic
Science 342, 850–853 (2013).
Republic of the Congo. 22Isotope Bioscience Laboratory (ISOFYS), Ghent University, Ghent,
39. Turubanova, S., Potapov, P., Tyukavina, A. & Hansen, M. Ongoing primary forest loss in
Belgium. 23Plant Systematic and Ecology Laboratory, Higher Teachers’ Training College,
Brazil, Democratic Republic of the Congo, and Indonesia. Environ. Res. Lett. 13, 074028
(2018). University of Yaoundé I, Yaoundé, Cameroon. 24Institute of Tropical Forest Conservation,
40. Pellikka, P. K. E., Lötjönen, M., Siljander, M. & Lens, L. Airborne remote sensing of Mbarara University of Science and Technology, Mbarara, Uganda. 25Biodiversity and
spatiotemporal change (1955–2004) in indigenous and exotic forest cover in the Taita Landscape Unit, Gembloux Agro-Bio Tech, Université de Liege, Liège, Belgium. 26Institute for
Hills, Kenya. Int. J. Appl. Earth Obs. Geoinf. 11, 221–232 (2009). Geography, Friedrich Alexander University, Erlangen–Nuremberg, Germany. 27Département
41. Zeng, Z. et al. Deforestation-induced warming over tropical mountain regions regulated de Eaux et Forêts, Institut Supérieur d’Agroforesterie et de Gestion de l’Environnement de
by elevation. Nat. Geosci. 14, 23–29 (2021). Kahuzi-Biega (ISAGE-KB), Kalehe, Democratic Republic of the Congo. 28UN Environment World
42. Spira, C., Kirkby, A., Kujirakwinja, D. & Plumptre, A. J. The socio-economics of artisanal
Conservation Monitoring Center (UNEP-WCMC), Cambridge, UK. 29Computational and
mining and bushmeat hunting around protected areas: Kahuzi–Biega National Park and
Applied Vegetation Ecology (CAVElab), Faculty of Bioscience Engineering, Ghent University,
Itombwe nature reserve, eastern Democratic Republic of Congo. Oryx 53, 136–144
(2019). Ghent, Belgium. 30Department of Anthropology, George Washington University, Washington
43. Bebber, D. P. & Butt, N. Tropical protected areas reduced deforestation carbon emissions DC, USA. 31School of Life Sciences, University of KwaZulu-Natal, Pietermaritzburg, South
by one third from 2000–2012. Sci. Rep. 7, 14005 (2017); 8, 14845 (2018). Africa. 32Shaanxi Key Laboratory for Animal Conservation, Northwest University, Xi’an, China.
44. Tegha, K. C. & Sendze, Y. G. Soil organic carbon stocks in Mt Cameroon National Park 33
International Centre of Biodiversity and Primate Conservation, Dali University, Dali, China.
under different land uses. J. Ecol. Nat. Environ. 8, 20–30 (2016). 34
University of Canterbury, Canterbury, New Zealand. 35Inventory and Monitoring Program,
45. Munishi, P. K. T. & Shear, T. H. Carbon storage in afromontane rain forests of the eastern National Park Service, Fredericksburg, VA, USA. 36University of Ghent, Ghent, Belgium.
arc mountains of Tanzania: their net contribution to atmospheric carbon. J. Trop. For. Sci. 37
World Agroforestry (ICRAF), Nairobi, Kenya. 38Laboratory of Geo-Information Science and
16, 78–98 (2004).
Remote Sensing, Wageningen University, Wageningen, The Netherlands. 39Geography,
46. Wheeler, C. E. et al. Carbon sequestration and biodiversity following 18 years of active
tropical forest restoration. For. Ecol. Manage. 373, 44–55 (2016). Environment and Geomatics, University of Guelph, Guelph, Ontario, Canada. 40Faculty of
47. Avitabile, V., Baccini, A., Friedl, M. A. & Schmullius, C. Capabilities and limitations of Science, University of South Bohemia, České Budějovice, Czech Republic. 41AMAP Lab,
Landsat and land cover data for aboveground woody biomass estimation of Uganda. Université de Montpellier, IRD, CNRS, INRAE, CIRAD, Montpellier, France. 42Faculté de Gestion
Remote Sens. Environ. 117, 366–380 (2012). de Ressources Naturelles Renouvelables, Université de Kisangani, Kisangani, Democratic
48. Aneseyee, B. A., Soromessa, T. & Belliethathan, S. Carbon sock of Gambella National Republic of the Congo. 43College of Development Studies, Addis Ababa University, Addis
Park: implication for climate change mitigation. Int. J. Adv. Life Sci. 35, 41–56 Ababa, Ethiopia. 44Dendrochronology Laboratory, World Agroforestry Centre (ICRAF), Nairobi,
(2015).
Kenya. 45Missouri Botanical Garden, St Louis, MO, USA. 46Department of Biology, University of
49. Lisboa, S. N. et al. Biomass allometric equation and expansion factor for a mountain moist
Burundi, Bujumbura, Burundi. 47Smithsonian Institution Forest Global Earth Observatory
evergreen forest in Mozambique. Carbon Balance Manag. 13, 23 (2018).
(ForestGEO), Smithsonian Tropical Research Institute, Washington DC, USA. 48Kunming
Publisher’s note Springer Nature remains neutral with regard to jurisdictional claims in Institute of Botany, Kunming, China. 49Université Libre de Bruxelles, Brussels, Belgium.
published maps and institutional affiliations.
50
Division of Vertebrate Zoology, Yale Peabody Museum of Natural History, New Haven, CT,
USA. 51Institute for Atmospheric and Earth System Research, Faculty of Science, University of
© The Author(s), under exclusive licence to Springer Nature Limited 2021 Helsinki, Helsinki, Finland. 52Department of Plant Systematics, University of Bayreuth,
Bayreuth, Germany. 53Helmholtz Center Potsdam GFZ German Research Centre for
Geosciences, Section 1.4 Remote Sensing and Geoinformatics, Potsdam, Germany.
54
Helmholtz-Centre for Environmental Research (UFZ), Leipzig, Germany. 55Department of
Aida Cuni-Sanchez1,2 ✉, Martin J. P. Sullivan3,4, Philip J. Platts1,5,6, Simon L. Lewis4,7, Ecology, Faculty of Science, Charles University, Prague, Czech Republic. 56International
Rob Marchant1, Gérard Imani8, Wannes Hubau9,10, Iveren Abiem11,12, Hari Adhikari13, Gorilla Conservation Programme, Musanze, Rwanda. 57Department of Natural Resources,
Tomas Albrecht14,15, Jan Altman16, Christian Amani8, Abreham B. Aneseyee17,18, Karatina University, Karatina, Kenya. 58Department of Ecosystem Science and Sustainability,
Valerio Avitabile19, Lindsay Banin20, Rodrigue Batumike21, Marijn Bauters22, Hans Beeckman9, Colorado State University, Fort Collins, CO, USA. 59Eco2librium LLC, Boise, ID, USA.
Serge K. Begne4,23, Amy C. Bennett4, Robert Bitariho24, Pascal Boeckx22, Jan Bogaert25,
60
Department of Ecology, Université de Kisangani, Kisangani, Democratic Republic of the
Achim Bräuning26, Franklin Bulonvu27, Neil D. Burgess28, Kim Calders29, Congo. 61Environmental Change Institute, School of Geography and the Environment,
Colin Chapman30,31,32,33, Hazel Chapman12,34, James Comiskey35, Thales de Haulleville36, University of Oxford, Oxford, UK. 62Tropical Forests and People Research Centre, University of
Mathieu Decuyper37,38, Ben DeVries39, Jiri Dolezal16,40, Vincent Droissart23,41, the Sunshine Coast, Sippy Downs, Queensland, Australia. 63Flamingo Land Ltd, Malton, UK.
Corneille Ewango42, Senbeta Feyera43, Aster Gebrekirstos44, Roy Gereau45, Martin Gilpin4,
64
College of African Wildlife Management, Mweka, Tanzania. 65School of GeoSciences,
Dismas Hakizimana46, Jefferson Hall47, Alan Hamilton48, Olivier Hardy49, Terese Hart50, University of Edinburgh, Edinburgh, UK. 66Department of Geography and Environmental
Janne Heiskanen13,51, Andreas Hemp52, Martin Herold38,53, Ulrike Hiltner26,54, David Horak55, Sciences, University of Dundee, Dundee, UK. 67Independent Botanist, Harare, Zimbabwe.
Marie-Noel Kamdem23, Charles Kayijamahe56, David Kenfack47, Mwangi J. Kinyanjui57,
68
Department of Horticultural Sciences, Faculty of Applied Sciences, Cape Peninsula
Julia Klein58, Janvier Lisingo42, Jon Lovett4, Mark Lung59, Jean-Remy Makana60, University of Technology, Bellville, South Africa. 69Biology Department, University of Rwanda,
Yadvinder Malhi61, Andrew Marshall1,62,63, Emanuel H. Martin64, Edward T. A. Mitchard65, Kigali, Rwanda. 70Department of Biological and Environmental Sciences, University of
Alexandra Morel66, John T. Mukendi9, Tom Muller67, Felix Nchu68, Brigitte Nyirambangutse69,70, Gothenburg, Gothenburg, Sweden. 71Mountains of the Moon University, Fort Portal, Uganda.
Joseph Okello22,71,72, Kelvin S.-H. Peh73,74, Petri Pellikka13,75, Oliver L. Phillips4,
72
National Agricultural Research Organisation, Mbarara Zonal Agricultural Research and
Andrew Plumptre76, Lan Qie77, Francesco Rovero78,79, Moses N. Sainge80, Christine B. Schmitt81,82, Development Institute, Mbarara, Uganda. 73School of Biological Sciences, University of
Ondrej Sedlacek55, Alain S. K. Ngute62,83, Douglas Sheil84, Demisse Sheleme85, Southampton, Southampton, UK. 74Conservation Science Group, Department of Zoology,
Tibebu Y. Simegn86, Murielle Simo-Droissart23, Bonaventure Sonké23, Teshome Soromessa17, University of Cambridge, Cambridge, UK. 75State Key Laboratory of Information Engineering
Terry Sunderland87,88, Miroslav Svoboda89, Hermann Taedoumg90,91, James Taplin92, in Surveying, Mapping and Remote Sensing, Wuhan University, Wuhan, China. 76Key
David Taylor93, Sean C. Thomas94, Jonathan Timberlake95, Darlington Tuagben96, Biodiversity Areas Secretariat, BirdLife International, Cambridge, UK. 77School of Life
Peter Umunay97, Eustrate Uzabaho56, Hans Verbeeck29, Jason Vleminckx98, Göran Wallin70, Sciences, University of Lincoln, Lincoln, UK. 78Department of Biology, University of Florence,
Charlotte Wheeler65, Simon Willcock99,100, John T. Woods101 & Etienne Zibera69 Sesto Fiorentino, Italy. 79Tropical Biodiversity Section, Museo delle Scienze, Trento, Italy.
Nature | Vol 596 | 26 August 2021 | 541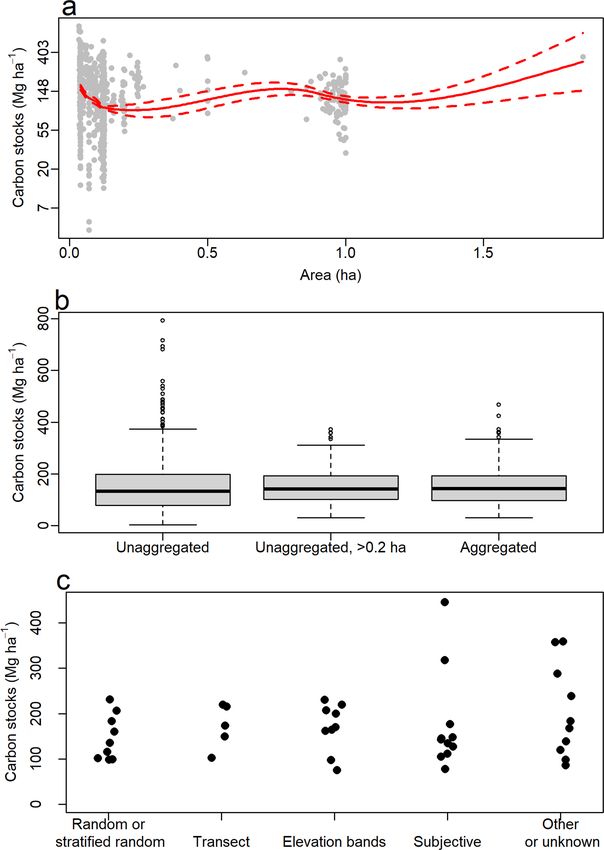
Article
80
  Tropical Plant Exploration Group (TroPEG), Mundemba, Cameroon. 81Center for                 Biology, Faculty of Sciences, University of Yaoundé I, Yaoundé, Cameroon. 91Bioversity
Development Research (ZEF), University of Bonn, Bonn, Germany. 82Conservation and             International, Yaoundé, Cameroon. 92UK Research and Innovation, London, UK. 93Department
Landscape Ecology, University of Freiburg, Freiburg, Germany. 83Applied Biology and Ecology   of Geography, National University of Singapore, Singapore, Singapore. 94Institute of Forestry
Research Unit, University of Dschang, Dschang, Cameroon. 84Forest Ecology and Forest          and Conservation, University of Toronto, Toronto, Ontario, Canada. 95Biodiversity Foundation
Management Group, Wageningen University, Wageningen, The Netherlands. 85Water and             for Africa, East Dean, UK. 96Forestry Development Authority of the Government of Liberia
Land Resources Center, Addis Ababa University, Addis Ababa, Ethiopia. 86African Wildlife      (FDA), Monrovia, Liberia. 97School of Forestry and Environmental Studies, Yale University, New
Foundation (AWF), Biodiversity Conservation and Landscape Management Program, Simien          Haven, CT, USA. 98Department of Biological Sciences, Florida International University, Miami,
Mountains National Park, Debark, Ethiopia. 87Faculty of Forestry, University of British       FL, USA. 99School of Natural Sciences, University of Bangor, Bangor, UK. 100Rothamsted
Columbia, Vancouver, British Columbia, Canada. 88Center for International Forestry Research   Research, Harpenden, UK. 101University of Liberia, Monrovia, Liberia.
(CIFOR), Bogor, Indonesia. 89Department of Forest Ecology, Faculty of Forestry and Wood       ✉e-mail: a.cuni-sanchez@york.ac.uk
Sciences, Czech University of Life Sciences, Prague, Czech Republic. 90Department of Plant

542 | Nature | Vol 596 | 26 August 2021
Methods                                                                        field measurements of height were available (typically ten stems per
                                                                               diameter class), we constructed a site-specific height–diameter model,
AfriMont or montane Africa dataset                                             using a Weibull equation following ref. 14. If no field measurements of
We compiled forest inventory plot data from AfriTRON (www.afritron.            height were available, we constructed a cluster-specific height–diam-
org), with data curated at www.ForestPlots.net50,51 and the TEAM net-          eter model, using a Weibull equation, as explained in Supplementary
work52, as well as from numerous site-specific publications detailed in        Table 7. The same approach was used to calculate aboveground biomass
Supplementary Table 5 and mapped in Fig. 4. Plots were selected for            for lowland forests. For these, height was estimated using a Weibull
the analysis when conforming to the following criteria: ≥800 m a.s.l.,         equation following ref. 14.
closed-canopy evergreen wet or moist tropical forest, geo-referenced,
old-growth and structurally intact (not affected by recent selective           Small plots and data subsampling
logging, fire or coffee cultivation), with no exotic species present (for      For 22 sites where plots were small (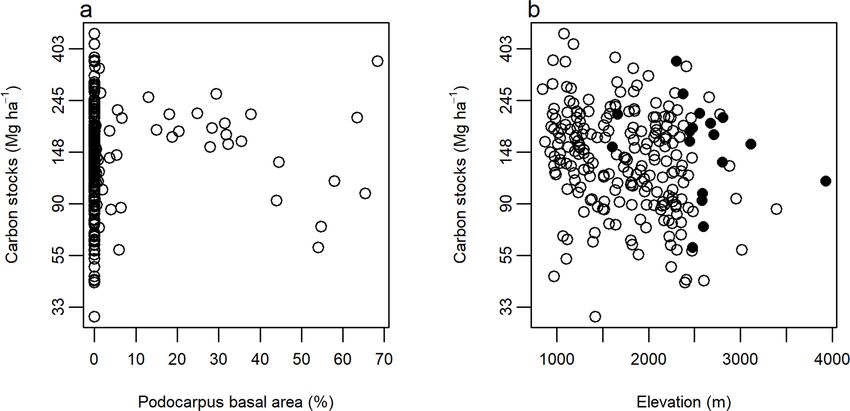
Article
of elephant ranges and elevation distribution at each site as of 2019.       log-transforming zeros) to meet assumptions of normality and avoid
Co-authors estimated that elephants were present in 2019 in 54 plots in      heteroscedacity. Likewise, the proportional contribution of each size
12 sites in five countries (Supplementary Table 5). For all plots that had   class was square-root transformed. Differences in AGC stocks between
at least one individual in the Podocarpaceae family (47 plots, 16 sites,     all combinations of lowland and montane forests among continents
7 countries), we computed the contribution of Podocarpaceae to plot          were assessed using Tukey post hoc tests implemented in the multcomp
basal area and AGC stock in terms of percentages.                            R package71. Relationships between AGC stocks and environmental
                                                                             variables were investigated by fitting all subsets of the full model with
Estimating forest cover and loss                                             all environmental covariates and averaging the best supported (differ-
We obtained estimates of forest cover and loss in the years 2000 to          ence in Akaike information criterion from the best supported model
2018, using the ‘loss year’ dataset of the Global Forest Change data-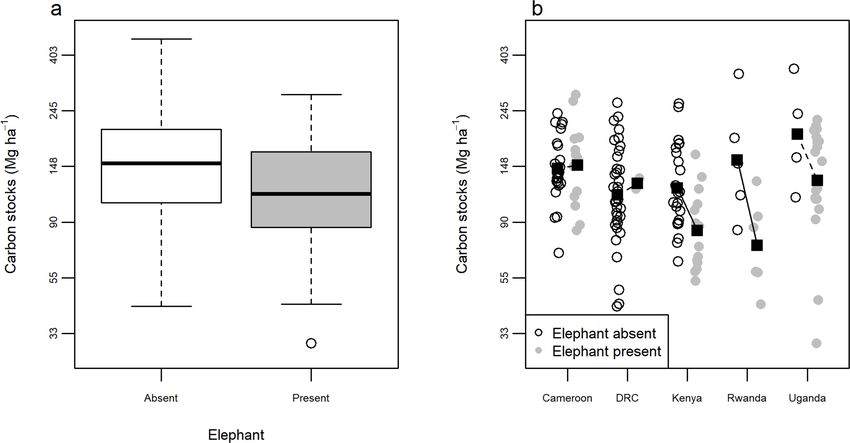
67. Avitabile, V. et al. An integrated pan-tropical biomass map using multiple reference          the National Herbarium of Yaounde (Cameroon), the University of Buea (Cameroon), Bioversity
    datasets. Glob. Change Biol. 22, 1406–1420 (2016).                                            International (Cameroon), Salonga National Park (Democratic Republic of Congo), The Centre
68. Pinheiro, J., Bates, D., DebRoy, S., Sarkar, D. & R Core Team nlme: linear and nonlinear      de Formation et de Recherche en Conservation Forestière (CEFRECOF, Epulu, Democratic
    mixed effects models. R package version 3.1-151 (2020).                                       Republic of Congo), the Institut National pour l’Étude et la Recherche Agronomiques (INERA,
69. Bates, D., Maechler, M., Bolker B. & Walker, S. Fitting linear mixed-effects models using     Democratic Republic of Congo), the École Régionale Postuniversitaire d’Aménagement et de
    lme4. J. Stat. Softw. 67, 1–48 (2015).                                                        Gestion intégrés des Forêts et Territoires tropicaux (ERAIFT Kinshasa, Democratic Republic of
70. Lüdecke, D., Ben-Shachar, M., Patil, I. & Makowski, D. Parameters: extracting, computing      Congo), WWF-Democratic Republic of Congo, WCS-Democratic Republic of Congo, the
    and exploring the parameters of statistical models using R. J. Open Source Softw. 5, 2445     Université de Kisangani (Democratic Republic of Congo), Université Officielle de Bukavu
    (2020).                                                                                       (Democratic Republic of Congo), Université de Mbujimayi (Democratic Republic of Congo), le
71. Hothorn, T., Bretz, F. & Westfall, P. Simultaneous inference in general parametric models.    Ministère de l'Environnement et Développement Durable (Democratic Republic of Congo), the
    Biom. J. 50, 346–363 (2008).                                                                  FORETS project in Yangambi (CIFOR, CGIAR and the European Union; Democratic Republic of
72. Barton, K. MuMIn: multi-model inference. R package version 1.43.17 (2020)                     Congo), the Lukuru Wildlife Research Foundation (Democratic Republic of Congo), Mbarara
                                                                                                  University of Science and Technology (MUST, Uganda), WCS-Uganda, the Uganda Forest
                                                                                                  Department, the Commission of Central African Forests (COMIFAC), the Udzungwa Ecological
Acknowledgements We thank the people of the many villages and local communities who               Monitoring Centre (Tanzania) and the Sokoine University of Agriculture (Tanzania). The
welcomed our field teams and became our field assistants, without whose support the               AfriTRION network has been supported by the European Research Council (291585,
AfriMont dataset would not have been possible. Cameroon: villages Elak-Oku, Bokwoango,            ‘T-FORCES’ – Tropical Forests in the Changing Earth System, Advanced Grant to O.L.P. and
Bakingili, Muandelengoh, Enyandong, Ekangmbeng, Ngalmoa, Dikome Balue, Muyange,                   S.L.L.), the Gordon and Betty Moore Foundation, the David and Lucile Packard Foundation and
Matamani; assistants E. Ndive, D. Wultof, F. Keming, E. Bafon, J. Meyeih, T. K. Konsum,           the European Union’s Seventh Framework Programme (283080, ‘GEOCARBON’). We are
J. Esembe, F. Luma, F. Teke, E. E. Dagobert, E. D. Ndode, N. F. Njikang; Democratic Republic of   grateful to A. Daniels, F. Mbayu, T. R. Feldpausch, E. Kearsley, J. Lloyd, R. Lowe, J. Mukinzi,
the Congo: Bunyakiri, J. Kalume, W. Gului, D. Cirhagaga, B. Mugisho. Kenya: assistants A. M.      L. Ojo, A. T. Peterson, J. Talbot and L. Zemagho for giving us access to their plot data. We also
Aide, H. Lerapo, J. Harugura, R. A. Wamuro, J. Lekatap, L. Lemooli, D. Kimuzi, B. M. Lombo,       thank C. Chatelain (Geneva Botanic Gardens) for access to the African Plants Database and to
J. Broas, J. Hietanen, V. Heikinheimo, E. Schäfer. Rwanda: assistants I. Rusizana,                H. Tang for helping to explore the use of GEDI data. Data from AfriTRON and most of AfriMont
P. Niyontegereje, J. B. Gakima, F. Ngayabahiga. Tanzania: TEAM staff and affiliates. Uganda:      are stored and curated by ForestPlots.net, a long-term cyberinfrastructure initiative hosted at
K. Laughlin, X. Mugumya, L. Etwodu, M. Mugisa. For logistical and administrative support, we      the University of Leeds that unites permanent plot records and their contributing scientists
are indebted to international, national and local institutions: SOPISDEW, Mt Cameroon             from the world’s tropical forests. The development of ForestPlots.net and curation of African
National Park, Tropical Plant Exploration Group (TroPEG), Institut Congolais de Conservation      data have been funded by many sources, including the ERC (principally from AdG 291585
de la Nature, Kahuzi-Biega National Park, Itombwe Nature Reserve, NEMA Marsabit Office, Taita     ‘T-FORCES’), the UK Natural Environment Research Council (including NE/B503384/1, NE/
Research Station, Kenya Forest Service, Rwanda Development Board, Nyungwe National Park,          F005806/1, NE/P008755/1, NE/N012542/1 and NE/I028122/1), the Gordon and Betty Moore
Conservation International, the Smithsonian Institution, Wildlife Conservation Society, Sokoine   Foundation (‘RAINFOR’, ‘MonANPeru’), the EU Horizon programme (especially ‘GEOCARBON’,
University of Agriculture, Tanzania Wildlife Research Institute, Tanzania National Parks          ‘Amazalert’) and the Royal Society (University Research Fellowship to S.L.L.).
Authority, Kilimanjaro National Park, Tanzania Commission for Science and Technology, Royal
Zoological Society of Scotland, Uganda Wildlife Authority, Makerere University Biological Field   Author contributions A.C.-S. conceived the study and assembled the AfriMont dataset. A.C.-S.
Station, Uganda National Forestry Authority and Uganda National Council for Science and           and M.J.P.S. analysed the plot data (with contributions from S.L.L.) and wrote the manuscript.
Technology. Field campaigns for AfriMont were funded by Marie Skłodowska-Curie Actions            P.J.P. analysed forest extents and contributed to writing. S.L.L. conceived and managed the
Intra-European Fellowships (number 328075) and Global Fellowships (number 74356),                 AfriTRON forest plot recensus programme. E.T.A.M. and V.A. helped compare plot data with
National Geographic Explorer (NGS-53344R-18), Czech Science Foundation (number                    remote sensing carbon maps. All co-authors read and approved the manuscript.
21-17125S), Rufford Small Grant Foundation (16712-B, 19476-D), Ministry of Foreign Affairs of
Finland (BIODEV project), the Academy of Finland (number 318645), Swedish International           Competing interests The authors declare no competing interests.
Development Cooperation Agency, the Leverhulme Trust, the Strategic Research Area
Biodiversity and Ecosystem Services in a Changing Climate, the German Research Foundation         Additional information
(DFG), Gatsby Plants, Natural Science and Engineering Research Council of Canada and              Supplementary information The online version contains supplementary material available at
International Development Research Centre of Canada. This paper is also a product of the          https://doi.org/10.1038/s41586-021-03728-4.
AfriTRON network, for which we are indebted to hundreds of institutions, field assistants and     Correspondence and requests for materials should be addressed to A.C.-S.
local communities for establishing and maintaining the plots, including the Forestry              Peer review information Nature thanks Nicolas Barbier and the other, anonymous, reviewer(s)
Development Authority of the Government of Liberia, the University of Liberia, University of      for their contribution to the peer review of this work. Peer reviewer reports are available.
Ibadan (Nigeria), the University of Abeokuta (Nigeria), the University of Yaounde I (Cameroon),   Reprints and permissions information is available at http://www.nature.com/reprints.
Article Extended Data Fig. 1 | Sensitivity of mean AGC stock estimates to data subsampling. AfriMont plot data were resampled at different sample sizes either at plot level (sampling with replacement) or at site level (sampling without replacement). N = 1,000 resamples for each sample size.
Extended Data Fig. 2 | Effect of plot area, aggregation procedure and plot        dot). Sampling strategies include random or stratified random, plots
design on estimates of AGC stocks across the AfriMont plot network.               positioned along transects, plots established within elevation bands,
a, Relationship between AGC stocks and plot area of plots before aggregation.     subjective measures such as choosing an area of forest considered
The red line shows the fit of a locally weighted regression model (span 0.75)     representative of the wider area, and other strategies (one plot sampled per
relating these variables, with dashed lines showing the standard errors.          site or unclear strategy). Carbon stocks (log transformed) did not differ
b, Variation in AGC stocks using either all plots before aggregation              significantly between sites with different sampling strategies (analysis of
(unaggregated), plots before aggregation but excluding those 0.2 ha) or the aggregated plots used in the main analyses         Supplementary Table 5.
(aggregated). c, Effects of plot design on AGC stocks (each site represents one
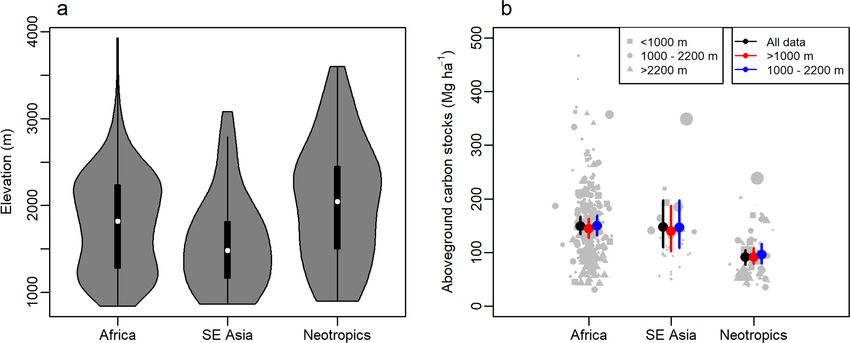
Article

Extended Data Fig. 3 | Robustness of differences in tropical montane forest        montane plot dataset) on AGC stocks in montane forests sampled by plot
AGC stocks among continents based on plot networks to differences in               networks in each continent. Mean AGC stocks and 95% CIs are shown as
elevation. a, Elevations of montane forests plots sampled in each continent.       estimated by models using all data, excluding plots 800–1,000 m and
Violin plots show the distribution of data, with boxplots showing the median       restricting plots to 1,000–2,200 m. Means for all plots differ from the analysis
and interquartile range of elevation in each continent. b, Effect of removing      in Fig. 1 as literature plots without elevation data (plots in Colombia) were
submontane plots (800–1,000 m a.s.l.) and high elevation plots                     excluded from this analysis. Point symbols are proportional to the square-root
(>2,200 m a.s.l., approximately the upper quartile of elevations for the African   plot area. N = 324 plots.
Extended Data Fig. 4 | Relationship between AGC stocks and elevation for         sites. Neither the overall relationship between elevation and AGC stocks
tropical montane forests in each continent based on plot networks. The           (slope −0.039 [95% CI = −0.127–0.057], P = 0.420) nor interactions between
dashed lines show relationships from a linear mixed-effects model of             elevation and continent (Southeast Asia, change in slope = −0.074 [−0.294–
log-transformed AGC stocks as a function of elevation, continent and their       0.149], P = 0.503; Neotropics, change in slope 0.006 [−0.132–0.149], P = 0.913)
interaction. Site was included as a random effect, and AGC stock–elevation       are statistically significant. N = 324 plots.
relationships allowed to vary among sites. The lines show fitted slopes across
Article

Extended Data Fig. 5 | Environmental drivers of AGC stocks across the                 asterisks. TPI refers to topographic position index (positive values indicate
AfriMont plot network. Coefficients are from a linear mixed-effects model             higher than surroundings and negative values indicate lower than
with site as a random intercept. Results are following all-subsets regression and     surroundings). T_mean, annual mean temperature; T_seasonality, temperature
model averaging, in which variables that do not appear in well supported              seasonality; Precip_total, annual precipitation; Precip_seasonality,
models are given coefficients of zero, leading to shrinkage in model                  precipitation seasonality.
coefficients. Statistically significant relationships (P < 0.05) are indicated with
Extended Data Fig. 6 | Expected sampling effort if effort was distributed in     between half and double expected effort. The extent of the tropical montane
proportion to the area of tropical montane forest biome in Africa. Data are      forest biome was defined as closed-canopy forests ≥800 m a.s.l. in December
summarized at 1° resolution. The upward triangles show grid cells where          2018, extracted from ref. 38 and clipped to ‘primary humid forest’ using ref. 39.
AfriMont sampling effort is more than double expected effort and the             This grided map differs from Fig. 4 as numerous grids have very little tropical
downward triangles show grid cells where AfriMont sampling effort is less than   montane forest.
half expected effort. The circles denote AfriMont sampling effort being
Article

Extended Data Fig. 7 | Differences in the environmental conditions      forests ≥800 m a.s.l. in December 2018, extracted from ref. 38 and clipped to
sampled by the AfriMont plot network and the tropical montane forest    ‘primary humid forest’ using ref. 39. Environmental variables for the biome were
biome in Africa. The extent of the biome was defined as closed-canopy   extracted at about 1-km resolution.
Extended Data Fig. 8 | Differences in AGC stocks in AfriMont plots located              shown by points. b, Differences in countries where elephants are present in at
in montane forests with and without elephants. a, Differences across all                least one of the montane sites studied. The black squares show means in each
plots. AGC stocks are statistically significantly lower in forests with elephants       country in forests with or without elephants and the solid lines denote
(t-test, t = 3.5, d.f. = 83.5, P = 0.001). The thick line shows the median, and boxes   statistically significant differences (t-tests, P < 0.05). Elephant presence in 2019
cover the interquartile range (IQR). Values >1.5 times IQR away from the IQR are        was estimated by the co-authors (Supplementary Table 5).
Article

Extended Data Fig. 9 | Relationship between AGC stocks and                             n = 226, P = 0.212). b, Distribution of plots with at least 20% basal area of
Podocarpaceae. a, Relationship between AGC stocks and Podocarpaceae                    Podocarpaceae (black points) in relation to elevation and AGC stocks. AGC
basal area across plots in the AfriMont network, expressed as a percentage of          stocks are not significantly related to elevation or Podocarpaceae basal area
total plot basal area. These variables are not significantly correlated (rs = 0.083,   (linear mixed effects model, P = 0.152 and P = 0.132, respectively).
Extended Data Fig. 10 | Within-country variation in AGC stocks based on the AfriMont plot network. Error bars show means and 95% CIs estimated by linear
mixed-effects models. Modelled means not shown for countries with fewer than five plots. Point size is proportional to plot area.
You can also read