Phosphorus solubility in aerosol particles related to particle sources and atmospheric acidification in Asian continental outflow - Atmos. Chem. Phys
←
→
Page content transcription
If your browser does not render page correctly, please read the page content below
Atmos. Chem. Phys., 19, 847–860, 2019
https://doi.org/10.5194/acp-19-847-2019
© Author(s) 2019. This work is distributed under
the Creative Commons Attribution 4.0 License.

Phosphorus solubility in aerosol particles related to particle sources
and atmospheric acidification in Asian continental outflow
Jinhui Shi1,2 , Nan Wang1 , Huiwang Gao1,2 , Alex R. Baker3 , Xiaohong Yao1,2 , and Daizhou Zhang4
1 Key Laboratory of Marine Environmental Science and Ecology, Ocean University of China,
Ministry of Education of China, Qingdao 266010, China
2 Laboratory for Marine Ecology and Environmental Science, Qingdao National Laboratory for Marine Science

and Technology, Qingdao 266237, China
3 Centre for Ocean and Atmospheric Sciences, School of Environmental Sciences, University of East Anglia,

Norwich, NR4 7TJ, UK
4 Faculty of Environmental and Symbiotic Sciences, Prefectural Kumamoto University,

Kumamoto 862-8502, Japan

Correspondence: Jinhui Shi (engroup@ouc.edu.cn)

Received: 29 August 2018 – Discussion started: 9 October 2018
Revised: 31 December 2018 – Accepted: 10 January 2019 – Published: 22 January 2019

Abstract. The continent-to-ocean supply of phosphorus (P)          RH was below 60 %, even when the content of acidic species
in the soluble state, recognized as bioavailable P, via the at-    and/or anthropogenic particles in the aerosols was high, sug-
mosphere is hypothesized to be crucial to the biological cy-       gesting humidity had a critical role in the production of TDP.
cle in offshore surface seawater. To investigate the solubil-      In addition, the proportion of DIP in TDP was high when the
ity of P in aerosol particles moving towards the northwest-        particles were predominantly anthropogenic, and the propor-
ern Pacific from the Asian continent, we measured the total        tion of dissolved organic P (DOP; quantified as TDP minus
P (TP), total dissolved P (TDP) and dissolved inorganic P          DIP) in TDP was high when the particles were dominated
(DIP) in aerosols at Qingdao (36◦ 060 N, 120◦ 330 E), a coastal    by natural dust. These results indicate that, as the contents
city in eastern China. The samples were collected in De-           of bioavailable P in Asian continent outflows are closely de-
cember 2012 and January 2013 (winter) and in March and             pendent on the aerosol particle origins, atmospheric acidic
April 2013 (spring), when the middle-latitude westerly wind        processes could convert P into a bioavailable state under cer-
was prevailing. On average, P solubility, i.e., the ratio of TDP   tain meteorological conditions. Therefore, the recent severe
to TP, was 32.9±16.7 % in winter and 21.3±9.8 % in spring,         air pollution over East Asia might have enhanced the input
and the TP concentrations in the two seasons were similar.         of bioavailable P to downwind marine areas.
This seasonal solubility difference is attributed to the aerosol
sources containing the P. Particles in winter were predomi-
nantly anthropogenic particles from local and regional areas,
and particles in spring were significantly influenced by natu-     1   Introduction
ral dust from the arid and semiarid areas in the inland part of
the continent. Moreover, acidification processes associated        Phosphorus (P) is one of the limiting nutrients for primary
with the formation of sulfate and nitrate in the winter sam-       production in marine ecosystems, affecting marine phyto-
ples enhanced P solubility, suggesting that the P in anthro-       plankton growth, community structure composition and ni-
pogenic particles was more susceptible to the production of        trogen fixation (Elser et al., 2007; Paytan and McLaughlin,
acidic species than that in natural dust particles. There was a    2007; Peñuelas et al., 2013). Atmospheric P deposition likely
strong positive correlation between P solubility and relative      has an important contribution to phosphate and induces the
humidity (RH). P solubility was usually less than 30 % when        growth of phytoplankton in surface seawater outside estu-
                                                                   ary areas, especially in offshore areas and regions where P

Published by Copernicus Publications on behalf of the European Geosciences Union.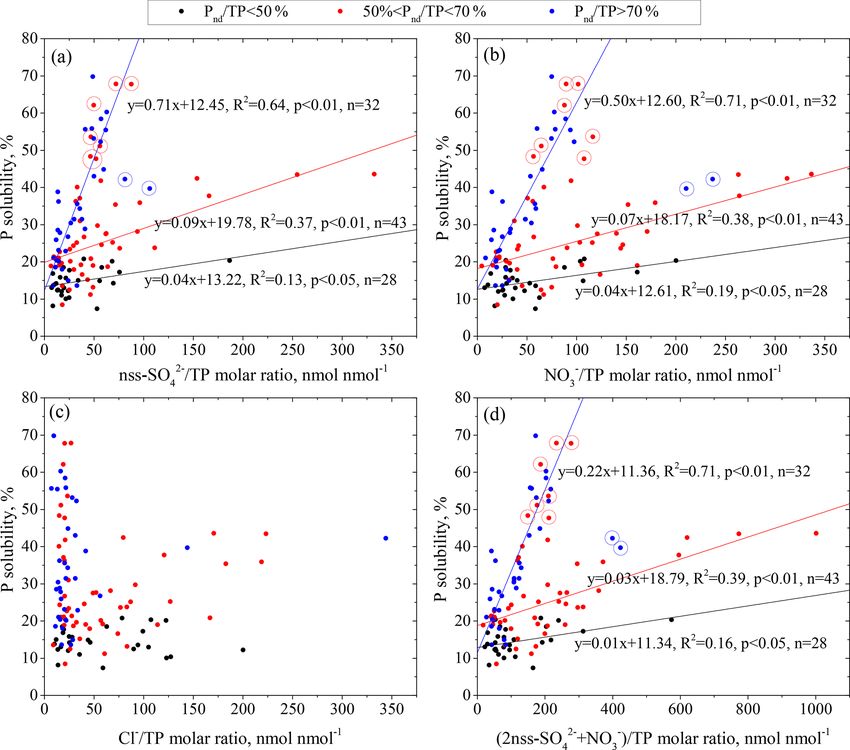
848                                                                       J. Shi et al.: Phosphorus solubility in aerosol particles

limits phytoplankton growth (Karl and Tien, 1997; Paytan                  P solubility in aerosols from different sources varies
and McLaughlin, 2007; Mackey et al., 2012a). Recent stud-              greatly and is generally low in particles from mineral sources
ies have found that the atmospheric input of anthropogenic N           and high in particles from anthropogenic sources. In the
to the North Pacific and its marginal sea is increasing (Kim et        Mediterranean atmosphere, P solubility ranges from 2 % to
al., 2013, 2014), while the P concentration in the surface sea-        20 % with an average of 10 % in aerosols affected by Saha-
water has been declining for nearly 40 years (Kodama et al.,           ran dust, whereas P solubility ranges from 30 % to 79 % with
2016), indicating that the nutrient structure of marine ecosys-        an average of 50 % in aerosols with anthropogenic sources
tems is changing to P limitation.                                      (Herut et al., 2002). Similar results were also observed in the
   Atmospheric P is derived from natural and anthropogenic             Atlantic atmosphere, where the P solubility in aerosols af-
sources, including mineral dust, sea salt, primary biogenic            fected by Saharan dust is approximately 8 % and can be up
sources, volcanic eruptions, biomass burning, fossil fuel              to 87 % in aerosols originating from terrestrial air masses in
combustion and agricultural fertilizers (Mahowald et al.,              South America (Baker et al., 2006a, b). In the South China
2008; Anderson et al., 2010; Tipping et al., 2014; Weinberger          Sea, P solubility in aerosols related to biomass combustion
et al., 2016). It has been widely recognized that mineral dust         is around 50 ± 14 % (Hsu et al., 2014). These results imply
is the main source of atmospheric P. Based on a combina-               that an increase in the relative amounts of aerosols from an-
tion of model simulations and field observations, Mahowald             thropogenic sources might lead to the increase in bioavail-
et al. (2008) reported that mineral aerosols contributed to ap-        able P. In addition, atmospheric acidic processes associated
proximately 82 % of atmospheric P at a global scale, while             with anthropogenic pollutants may transform unreactive P to
anthropogenic P contributed to approximately 5 % of atmo-              bioavailable P. Recent model studies predict that the acid dis-
spheric P globally. Recent studies have highlighted the con-           solution process increases the fraction of bioavailable P from
tributions of anthropogenic sources. Weinberger et al. (2016)          ∼ 10 % globally at labile pools to 42 % in the Pacific Ocean,
suggested that coal combustion is a substantial source of at-          with the mean value of 22% in the global marine atmo-
mospheric P and that the relative content of P in coal fly ashes       sphere (Herbert et al., 2018). Myriokefalitakis et al. (2016)
could be as high as 3500 µg g−1 . Srinivas and Sarin (2015)            estimated that acid-driven solubilization flux of P from min-
studied the sources of P in the atmospheric aerosols of Ben-           eral dust contributed about one-third to the global TDP at-
gal Bay in the northern Indian Ocean and found that 75 % of            mospheric source.
aerosol P was from agricultural fertilizers and biomass burn-             The Yellow Sea is a marginal sea of the Pacific Ocean that
ing. A recent estimation by Wang et al. (2015) showed that             is frequently affected by both Asian dust from arid and semi-
combustion-related emissions could contribute more than                arid areas in inland regions of the Asian continent and an-
50 % of the global atmospheric P. These results suggest that           thropogenic pollutants from urban agglomerations in north-
anthropogenic emissions of P have likely increased consid-             ern China (e.g., Zhang and Gao, 2007; Zhang et al., 2018;
erably in recent years and that the states of P in atmospheric         Shi, et al., 2012; Wang et al., 2013). For example, a dust
aerosols need to be carefully quantified.                              storm that occurred in May 2017 moved across the North
   P solubility, i.e., the ratio of total dissolved P (TDP) to total   Pacific within a week and deposited 5.3 Tg of aeolian dust
P (TP), is usually used to characterize the bioavailability of         across the North Pacific Ocean (Zhang et al., 2018). In re-
atmospheric P (Anderson et al., 2010) because the soluble              cent years, anthropogenic emissions have rapidly increased
fraction of P in aerosols is believed to be the form that can be       with the acceleration of industrialization and urbanization
directly assimilated by marine phytoplankton (Mackey et al.,           over northern China. Prevailing westerly winds in the North-
2012b). Unfortunately, observational data on the solubility of         ern Hemisphere middle latitudes can carry anthropogenic
atmospheric P are very limited, and the available data show            aerosols traveling over the North Pacific (Lyu et al., 2017;
a wide range of P solubility, ranging from 2 % to 100 % in             Joos et al., 2017). Over the last 30 years, the structure of
different sea areas (e.g., Baker et al., 2006a, b; Mahowald et         nutrients in the Yellow Sea water has exhibited an alterna-
al., 2008).                                                            tion from N limitation to potential P limitation (Wei et al.,
   Dissolved P in aerosols includes dissolved inorganic P              2015). However, there are no data on P solubility in the at-
(DIP) and dissolved organic P (DOP). Only DIP has been                 mospheric aerosols outflowing from the Asian continent to-
frequently analyzed by previous studies of P solubility in             wards the Yellow Sea and the northern Pacific, which hinders
aerosols (Srinivas and Sarin, 2015) because DIP is consid-             further understanding of the influence of P deposition on the
ered directly available to marine phytoplankton and the pre-           biological cycles in the surface seawater of those ocean areas.
dominant component of TDP (Mahowald et al., 2008). How-                   In this study, we investigated TP and TDP, including DIP
ever, some studies have found that DOP can be converted to             and DOP, in aerosols collected at Qingdao. The city of Qing-
bioavailable P by enzymatic reactions (Mackey et al., 2012a)           dao is located in the coastal area of the Yellow Sea. In winter
and accounts for 20 %–83 % of TDP in global atmospheric                and spring, when westerly winds prevail, aerosol particles
depositions (Kanakidou et al., 2012), although the contribu-           originating from the Asian continent, including natural dust
tion of DOP to TDP is sometimes very low (Izquierdo et al.,            and anthropogenic particles, are frequently blown from the
2012; Myriokefalitakis et al., 2016).                                  continent and enter the marine air over the Yellow Sea and

Atmos. Chem. Phys., 19, 847–860, 2019                                                    www.atmos-chem-phys.net/19/847/2019/
J. Shi et al.: Phosphorus solubility in aerosol particles                                                                       849

subsequently over the northern Pacific (Zhang et al., 2005,         tion of TP. For the analysis of soluble P, another piece of the
2018; Joos et al., 2017; Qi et al., 2018). The objectives of this   sample filter was ultrasonically extracted with 15 mL Milli-
paper are to characterize (1) the concentrations of TP, TDP,        Q water (≥ 18.2 M cm) for 20 min at 0 ◦ C. The extract was
DIP and DOP in aerosols in the coastal areas of the Yellow          then filtered through a microporous membrane (pore size of
Sea, (2) the relative contribution of DOP and DIP to TDP,           0.45 µm). The extraction was repeated once, and then the fil-
(3) P solubility in aerosols in the Asian continental outflow,      ter was rinsed three times with Milli-Q water. All the ex-
and (4) the influences of dust loads, particle sources, atmo-       tractive solutions were combined and finally made up to a
spheric acidification and ambient relative humidity (RH) on         volume of 50 mL. The filtered extract was divided into two
P solubility.                                                       equal parts: one directly for the determination of DIP and the
                                                                    other autoclaved with 2.5 mL alkaline potassium persulfate
                                                                    solution (0.375 mol L−1 NaOH, 0.185 mol L−1 K2 S2 O8 and
2     Methods                                                       0.484 mol L−1 H3 BO3 mixed solution) at 120 ◦ C for 30 min
                                                                    for the determination of TDP. DOP was obtained by the dif-
2.1    Sample collection
                                                                    ference between TDP and DIP.
Aerosol samples of total suspended particulates (TSP) were             Phosphorus in the prepared sample solutions was mea-
collected between 1 December 2012 and 31 January 2013               sured by the molybdenum blue technique with colorimetric
(winter) and between 1 March and 30 April 2013 (spring).            detection. A color reagent comprising a mixture of sulfu-
The aerosol sampler used for collection was a high-volume           ric acid, ammonium molybdate, ascorbic acid and antimony
TSP sampler (KC-1000, Laoshan Electron Ltd., Qindao,                potassium tartrate was added into the solutions, and P in the
China) set up on the roof of a building at the Ocean Uni-           solutions was quantified using a UV spectrophotometer (T-6
versity of China in Qingdao (36◦ 060 N, 120◦ 330 E). The roof       new century, Beijing general analysis) with a 5 cm quartz cell
was approximately 65 m above sea level, and the building            at 880 nm once the color was developed. The detection limit
was < 1000 m from the coast of the Yellow Sea. In total,            was 0.07 µmol L−1 (approximately 0.6 ng m−3 ), defined as 3
112 samples were collected, of which 60 were collected in           times the standard deviation of the blanks. The values for the
the winter period and 52 were collected in the spring pe-           blanks (i.e., blank filters and reagents) were below the detec-
riod. Each aerosol sample was collected onto an acid-washed         tion limit. The relative standard deviations of replicate anal-
fiber filter (Whatman-41, 20.3 cm × 25.4 cm) at a flow rate         ysis of the sample extracts were within 3 %. The accuracy of
of 1.05 m3 min−1 for 24 h, and the total sampling air was           the TP analysis procedure used in this study was checked us-
approximately 1500 m3 . Operational filter blanks were also         ing a soil sample standard reference material as a substitute
collected. All samples were sealed in polyethylene bags and         (GBW07408, provided by the Geophysical and Geochemical
stored in a freezer at −20 ◦ C until subsequent analyses.           Survey Institute, China). GBW07408 was included in all an-
   During the sampling periods, the particle concentrations         alytical runs with the same treatment as sample filters, and
in six size ranges were measured using a laser optical par-         the P recoveries were 95 %–105 % with an average of 98 %
ticle counter (OPC, ARTI model HHPC-6). The OPC had                 (n = 10).
six channels (i.e., 0.3, 0.5, 0.7, 1.0, 2.0 and 5.0 µm) and was        Total and soluble trace elements, including Al, Fe, Mn, Ba,
run at a flow rate of 2.83 L min−1 with a 15 min time res-          Ca, Zn, Ni, As, Cd, Pb and K, in samples were analyzed using
olution. Meteorological conditions, including temperature,          an Agilent 7500c octopole-based inductively coupled plasma
RH, wind speed and direction, and visibility were obtained          mass spectrometer (ICP-MS). Water-soluble inorganic ions,
from the MICAPS meteorology data provided by the China              including Na+ , K+ , Mg2+ , NH+           2+    −      −
                                                                                                        4 , Ca , Cl , NO2 , NO3
                                                                                                                                  −

Meteorological Administration. The 24 h average values of           and SO2−4 , were analyzed using a Dionex ICS-3000 ion chro-
these variables during the sampling periods are illustrated in      matograph. The full details of the sample extraction and ana-
Fig. S1 in the Supplement.                                          lytical procedures for aerosol trace element and ion analyses
                                                                    are described in Shi et al. (2012, 2013).
2.2    Sample analysis
                                                                    2.3   Aerosol-specific surface area calculation
The sample filters and blank filters were subdivided into por-
tions using an acid-cleaned ceramic knife under a class-100         The specific surface areas of aerosol particles were calcu-
laminar flow hood. For the analysis of TP, a piece of the           lated to investigate the possible dependence of P solubility on
filter was digested with 4 mL of 70 % HNO3 and 1 mL of              chemical conversions occurring in the aerosol surface layer.
49 % HF (all ultra-pure grades) in a high-pressure Teflon           The specific surface area of an aerosol sample was defined
jar at 180 ◦ C for 48 h. Then, the digested sample solution         as the ratio of the surface area of the particles to the particle
was heated on an electrothermal board at 160 ◦ C until the          mass loading. The aerosol surface area was estimated from
acid fumes dissipated. After being cooled to room tempera-          the size-segregated number concentrations of aerosol parti-
ture, the residue was redissolved, transferred to a colorimet-      cles measured by the OPC in the sample collection period.
ric tube and made up to a volume of 25 mL for determina-            We made a simplistic assumption of spherical particles, and

www.atmos-chem-phys.net/19/847/2019/                                                    Atmos. Chem. Phys., 19, 847–860, 2019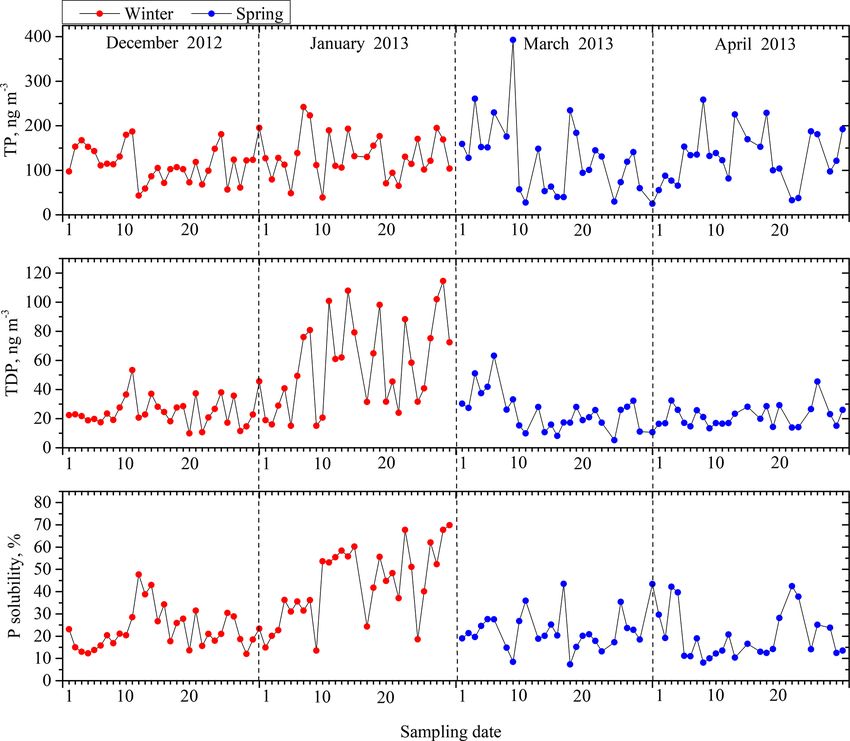
850 J. Shi et al.: Phosphorus solubility in aerosol particles
hence of Aqaba and Miami, USA (Hsu et al., 2014; Chen et al.,
n
" 2 # 2007; Zamora et al., 2013), but was lower than the values re-
X dj ported in Singapore and the Indian Ocean (He et al., 2011;
Si = Ci,j · 4π · , (1)
j =1
2 Srinivas and Sarin, 2012). In fact, DOP was not measured in
those studies (Table 1). Chen et al. (2007) studied DOP in
where Si is the total surface area of the particles in the ith aerosols over the Gulf of Aqaba and reported a DOP concen-
aerosol sample, Ci,j is the average number concentration tration and contribution of DOP to TDP that were similar to
of the corresponding aerosol sample in the j th size range, the results of this study.
and dj is the diameter of the particulates in the j th size There was a difference in the concentrations of total and
range. Although the smallest detectable diameter of the par- dissolved P between the winter and spring (Figs. 1, 2).
ticle counter was 0.3 µm, we consider the estimated specific The average TP concentration in the spring was 128.6 ±
areas to represent the areas associated with P in the samples 73.2 ng m−3 , slightly higher than that in the winter, i.e.,
because more than 90 % of TP is in the > 0.32 µm particles 122.9 ± 45.6 ng m−3 . However, there was no statistically sig-
(Vicars et al., 2010). The particle mass loading was estimated nificant difference between the TP values of the two seasons
from Al contents by assuming that all aerosol Al was derived (p > 0.05). Guo et al. (2014) also found that the atmospheric
from mineral dust, in which Al comprises 8 % of the mineral TP concentration in spring was higher than that in other sea-
aerosol mass (Taylor, 1964). sons at Huaniao Island in the East China Sea. In contrast,
over the Gulf of Aqaba, a higher aerosol TP concentration
3 Results and discussion occurred in winter than in other seasons, although there were
no statistically significant seasonal variations in TP (Ander-
3.1 P concentration son et al., 2010).
In contrast to the small seasonal difference in TP, TDP was
The concentration of TP ranged from 24.7 to 392.6 ng m−3 , higher in winter, with an average concentration of 40.5 ±
and the mean TP concentration was 125.5 ± 59.8 ng m−3 27.7 ng m−3 , and lower in spring, with an average concen-
(Fig. 1, Table 1). The highest and second highest values tration of 23.0 ± 11.0 ng m−3 . In TDP, the DIP in winter
were observed in the samples on 9 March and 8 April when averaged 31.9 ± 23.4 ng m−3 , significantly higher than that
dusty weather occurred and the concentration of both total Fe in spring, which had an average of 10.0 ± 10.2 ng m−3 ; in
and total Al, the representative elements of mineral dust, ex- contrast, DOP in spring, with an average concentration of
ceeded 10 000 ng m−3 . The TDP concentration ranged from 13.0±7.5 ng m−3 , was higher than that in winter, with an av-
5.1 to 114.6 ng m−3 , and the mean TDP concentration was erage concentration of 8.6±7.4 ng m−3 . Furthermore, the ra-
32.4 ± 23.2 ng m−3 . Unlike TP, the highest concentration of tio of DOP to TDP in spring was approximately 61 %, which
TDP did not appear in the two dust samples and was instead was significantly higher than that in winter, i.e., 23 %. This
measured in the samples collected during the haze and foggy result was probably caused by the release of primary biolog-
days, mostly in January. ical particles and agriculture activities in spring (Mahowald
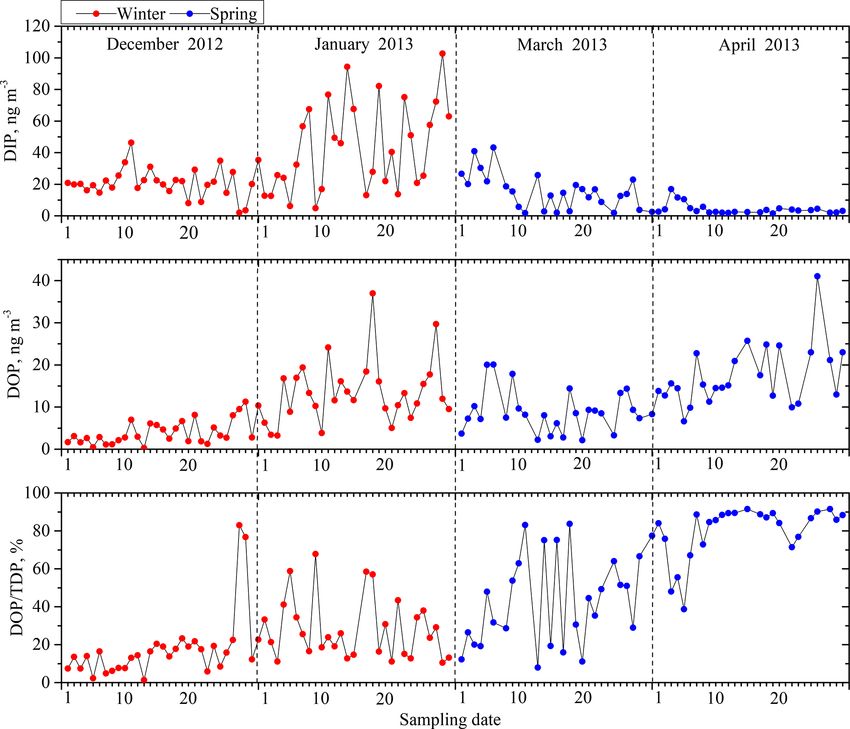
The DIP concentration in the TDP ranged from 1.5 to et al., 2008; Kanakidou et al., 2012; Paytan and McLaugh-
102.6 ng m−3 , with an average concentration of 21.8 ng m−3 , lin, 2007). Chen et al. (2006) also reported that, among all
accounting for 8.5 %–98.7 % of the TDP (Fig. 2). The DOP seasons, aerosols in spring had the largest percentage of or-
concentration in the TDP ranged from below the detec- ganic P loads, a result potentially associated with terrestrial
tion limit to 41.0 ng m−3 , with an average concentration of and marine biological activity.
10.7 ng m−3 , accounting for 1.3 %–91.5 % of the TDP. DIP TP was closely correlated with Al, Fe, Ca, Mn and Ba (Ta-
and DOP accounted, on average, for approximately 60 % and ble S1 in the Supplement). This is consistent with the fact that
40 % of the TDP, respectively, indicating an appreciable con- mineral particles from surface soils are the main origin of P.
tribution of DOP to the TDP. TP was also correlated with heavy metals of Cd, As, Ni, Zn
Table 1 also shows the results of previous studies on and Pb and with K. These results again support that the TP
coastal and marine aerosol P concentrations. The TP con- was derived from natural mineral dust, anthropogenic par-
centration we observed in this study was lower than that ob- ticles, biogenic particles and emissions from biomass burn-
served in Singapore in spring (He et al., 2011) but slightly ing. Moreover, the correlation coefficients between TP and
higher than the values obtained at Huaniao Island in the East crustal elements (Al, Fe, Ca, Mn and Ba) were larger in
China Sea (Guo et al., 2014) and higher than those observed spring than in winter, while the close correlation between the
at coastal sites of Spain and the USA (Izquierdo et al., 2012; TP and anthropogenic elements was observed in winter. This
Zamora et al., 2013). The TP concentration at Qingdao was result suggests that a large proportion of TP in the winter was
approximately 1 order of magnitude higher than that in the from anthropogenic sources. In contrast, the TP in the spring
marine atmosphere (Baker et al., 2006b; Hsu et al., 2014; aerosols was substantially from crustal origins.
Sun et al., 2015). The DIP concentration in this study was The DIP fraction in the TP also showed a significant cor-
obviously higher than those in the South China Sea, the Gulf relation with Cd, As, Ni, Zn, Pb, K, non-sea salt (nss)-SO2− 4
Atmos. Chem. Phys., 19, 847–860, 2019 www.atmos-chem-phys.net/19/847/2019/Table 1. Comparison of the concentrations of various forms of P and P solubility in aerosols from the coastal Yellow Sea (this study) and other previously studied coastal and marine
sites.
Region Period Type TP (ng m−3 ) DIP (ng m−3 ) DOP (ng m−3 ) P solubility (%) Reference
Coastal site
Qingdao, China December 2012–April 2013 TSP 125.5 ± 59.8 21.8 ± 21.4 10.7 ± 7.7 27.5 ± 15.0 This work
www.atmos-chem-phys.net/19/847/2019/
December 2012–January 2013 TSP 122.9 ± 45.6 31.9 ± 23.4 8.6 ± 7.4 32.9 ± 16.7
March–April 2013 TSP 128.6 ± 73.2 10.0 ± 10.2 13.0 ± 7.5 21.3 ± 9.8
Huaniao Island, East China Sea 2–30 April 2010 TSP 15–307 0.6–58 Guo et al. (2014)
29 July–27 August 2010 TSP 14–115 6.9–14
12 November–11 December 2010 TSP 14–159 1.8–63
J. Shi et al.: Phosphorus solubility in aerosol particles
4–30 March 2011 TSP 2.6–113 4.5–56
Singapore April 2007–March 2008 TSP 430 ± 320 120 ± 120 38 He et al. (2011)
Mediterranean coast March 2002–December 2003 TSP 22.9 ± 1.1 Izquierdo et al. (2012)
Miami, Florida, USA January 2007–August 2008 Bulk aerosols 11.8 ± 10.8 3.1 ± 2.8 23 Zamora et al. (2013)
Barbados, West Indies July 1988–September 2008 Bulk aerosols 11.8 ± 9.7 2.6 ± 1.3 21
Gulf of Aqaba August 2003–November 2004 TSP 15–30 Anderson et al. (2010)
Gulf of Aqaba August 2003–September 2005 TSP 12.4 ± 6.2 6.2 ± 3.1 Chen et al. (2007)
Marine site
East China Sea and Japan Sea June–September 2008 TSP 7.9 ± 6.4 Sun et al. (2015)
South China Sea 18 February–8 March 2013 TSP 10 ± 11 5.6 ± 4.7 55 ± 14 Hsu et al. (2014)
17–30 June 2013 TSP 36 ± 22 16 ± 12 45 ± 17
Western North Pacific June–September 2008 TSP 6.9 ± 6.6 Sun et al. (2015)
Atlantic Ocean 10 September–24 October 2001 Bulk aerosols 0.1–5.6 0.01–87 Baker et al. (2006b)
Indian Ocean January 2009 PM10 40.3 ± 15.5 Srinivas and Sarin (2012)
March–April 2006 PM10 34.1 ± 12.4
Arctic Ocean June–September 2008 TSP 7.0 ± 6.8 Sun et al. (2015)
Atmos. Chem. Phys., 19, 847–860, 2019
851852 J. Shi et al.: Phosphorus solubility in aerosol particles Figure 1. Time series of total and dissolved P concentrations (TP and TDP) and P solubility. and nss-K+ but had a minuscule correlation with Al, Fe, 3.2 P solubility Ca and Ba (Table S1). This suggests that the DIP mainly originated from anthropogenic sources (particularly fossil fuel combustion and biomass burning) and biogenic sources P solubility ranged from 7.3 % to 69.8 % (Fig. 1). Two low (Weinberger et al., 2016; Zamora et al., 2013). Aerosol DOP solubility values occurred in the dust samples due to the high is considered to be mainly derived from primary biological concentration of TP and low concentration of TDP. High val- particles and biomass burning (Chen et al., 2006), which is ues occurred in the haze and foggy day samples, mostly in supported by the correlation between DOP and K and nss-K+ January. The average P solubility was 27.5 %, which is in in the samples. We found that the DOP had a significant cor- agreement with the values reported at various coastal sites relation with crustal source indicators (Al, Fe, Mn, Ba) and (Table 1). Anderson et al. (2010) reported that 15 %–30 % of anthropogenic source indicators (Cd, As, Zn, Pb). Therefore, P in Gulf of Aqaba aerosols was soluble. Guo et al. (2014) re- soil dust and anthropogenic emissions are potential sources ported that the solubility of P was 0.6 %–63 % in the aerosols of atmospheric DOP. Myriokefalitakis et al. (2016) reported collected at the Huaniao Island of the East China Sea, and the that, on the global scale, approximately 50 % of secondary median value was 21 % in spring. He et al. (2011) studied the DOP was attributed to the ageing of biological P primarily atmospheric dry and wet deposition of P in Singapore and re- contained in aerosols, and the contributions of soil dust, an- ported that DIP comprised 38 % of TP in aerosols. In the dust thropogenic combustion and biomass burning ageing to sec- samples of this study, however, the P solubility was approxi- ondary DOP were approximately 25 %, 15.6 % and 9.4 %, mately 8 %, which was close to the value of 10 % measured respectively. In addition, bioaerosols were enriched in long- in dust aerosols collected at the Mediterranean coast (Carbo range-transported dust plumes in Beijing and the northwest- et al., 2005; Herut et al., 2002; Nenes et al., 2011) but was ern Pacific for Asian dust and in the Mediterranean and the considerably lower than the value of 20 % measured in Asian Atlantic for African dust (Yuan et al., 2017; Hara and Zhang, dust at the coastal site of the East China Sea and in African 2012; Griffin et al., 2007; Kanakidou et al., 2018). Therefore, dust in the western subtropical North Atlantic (Guo et al., the observed correlation between DOP and crustal elements 2014; Zamora et al., 2013). There are few available data for could be the consequence of the presence of bioaerosols in P solubility in the marine atmosphere (Hsu et al., 2014; Baker dust plumes. et al., 2006a, b), and the limited data show that the solubility Atmos. Chem. Phys., 19, 847–860, 2019 www.atmos-chem-phys.net/19/847/2019/
J. Shi et al.: Phosphorus solubility in aerosol particles                                                                        853

Figure 2. Time series of dissolved inorganic and organic P concentrations (DIP and DOP) and the percentage of DOP in TDP.

of P in marine aerosols is generally higher than that in coastal     3.3     Factors influencing P solubility
aerosols (Table 1).
   The ratio of DIP / TP has frequently been used as a proxy         3.3.1    Aerosol sources and mineral dust loading
for P solubility in previous studies with no consideration of
the contribution of DOP. The fraction of DOP in TDP was              Mineral dust aerosols are generally considered the domi-
approximately 40 % in this study (Fig. 2) and 31 % in the            nant sources of atmospheric TP (Mahowald et al., 2008). As
aerosols at the Gulf of Aqaba (Chen et al., 2007). Our DOP           mentioned above, TP had statistically significant correlations
results indicate that using the DIP / TP ratio as a proxy for        with the contents of mineral elements. We choose Al as the
the solubility of P could largely underestimate the real P sol-      indicator of the mineral origin of aerosols to investigate the
ubility in aerosols by approximately 30 %–40 %.                      effect of aerosol sources and dust loading on P solubility.
   Seasonally, the P solubility in winter was 32.9 ± 16.7 %,         Because the content of Al in mineral particles is stable, Al
which was much higher than the value of 21.3 ± 9.8 % for P           has few sources other than mineral particles (Arimoto et al.,
solubility in spring (Fig. 1, Table 1). In winter, the P solu-       2006). TP showed a strong linear relationship with total Al
bility was negatively correlated with Al (Table S1) and pos-         (Fig. 3a), and all data points were significantly above the line
itively correlated with anthropogenic elements such as Zn,           of P/Al = 0.013, which is the ratio of P to Al in the crust
As, Cd, and Pb and ions such as nss-K+ , nss-SO2−            −       (Taylor, 1964). Therefore, there were sources of TP other
                                                  4 and NO3 .
The correlations likely result from the effects of crustal and       than the crustal source.
anthropogenic sources, as well as the effects of atmospheric            The concentration of non-dust P (Pnd ) was estimated with
processes on P solubility. However, in spring, P solubility did      the following formula (2):
not have a clear relationship with anthropogenic source indi-                           Pcrust
cators, i.e., Cd, As, Zn, Pb, nss-SO2−          −                    Pnd = TP − TAl ·           ,                                (2)
                                    4 and NO3 , but was still                           Alcrust
negatively correlated with crustal elements such as Al, Fe,
Ca, Mn and Ba. Therefore, the variation in P solubility could        where TP is the total P concentration, TAl is the total Al con-
also be caused by changes in the dominant aerosol particles.         centration and Pcrust /Alcrust is the ratio of P to Al in con-
                                                                     tinental crust. We consider the excess P relative to P/Al in
                                                                     the mineral dust to represent the fraction of P derived from
                                                                     anthropogenic activities because atmospheric P is mainly

www.atmos-chem-phys.net/19/847/2019/                                                     Atmos. Chem. Phys., 19, 847–860, 2019
854 J. Shi et al.: Phosphorus solubility in aerosol particles
Figure 3. Correlations of TP with total Al (a) and TDP with soluble Al (b). The line of P/Al = 0.013 represents the ratio of P to Al in the
crust.
caused by anthropogenic activities and natural dust in addi-
tion to a small fraction of biological P (Wang et al., 2015).
Results show that the maximum concentration of anthro-
pogenic P was about 75.8 ng m−3 , as shown by the intercept
of the regression line in Fig. 3a, and the maximum contribu-
tion of anthropogenic P to TP was as high as 60 % on aver-
age. Part of the TP was also from primary biological sources,
especially in spring. Therefore, the value 60 % overestimates
the P contribution of anthropogenic sources.
Aerosol P from anthropogenic sources usually has a higher
solubility than that from mineral sources. The reason is that
anthropogenic P tends to associate loosely with particulates,
dissolve more readily than mineral P and, consequently, in-
teract easily with acid gases to produce more bioavailable P
(Herut et al., 2002; Baker et al., 2006a, b; Anderson et al.,
2010; Hsu et al., 2014; Herbert et al., 2018). Our results in-
dicate that the P solubility was approximately 35 % in the
aerosols when the fraction of anthropogenic P in the TP was Figure 4. Relationships of P solubility against total Al. Data in the
more than 70 %. In contrast, the value was approximately South China Sea are from Hsu et al. (2014) (triangles), and data in
15 % in the aerosols when the fraction of anthropogenic P the East China Sea are from Guo et al. (2014) (squares). Different
in the TP was less than 50 %. Therefore, the high fraction of color symbols are used to highlight different observation periods.
P from anthropogenic sources in the TP in winter is likely The green and red triangles represent the averages of observations
one reason that winter P solubility was higher than spring P in the South China Sea during cruises in February–March 2013
and June 2013, respectively; the blue triangles represent the ob-
solubility.
served values of the samples affected by biomass burning in the
Total dissolved P also showed a correlation with soluble
June cruise. The blue, green, yellow and red squares represent the
Al (Fig. 3b). The slope of the regression line between P and averages of observations over Huaniao Island in the East China
Al was 0.13 in the soluble fraction, which was higher than Sea during April, July–August and November–December 2010, and
that in the total fraction. This result is reasonable because the March 2011, respectively.
solubility of P is considerably higher than that of Al (Hsu
et al., 2014) and/or because anthropogenic sources directly
contribute to more soluble-fraction P (Anderson et al., 2010). the East China Sea in July and August 2010, when the air
The P solubility and total Al concentration (as dust load- mass was mainly from the open ocean (Guo et al., 2014).
ing) displayed an inverse power-law relationship (Fig. 4). These results indicate the potential to extrapolate the discus-
The data in the South China Sea and the East China Sea from sion of this study to the marginal sea areas of eastern China.
the literature also conform to this fitting relationship (Hsu et A characteristic inverse relationship with Al has also been
al., 2014; Guo et al., 2014), except for the data observed over observed for aerosol Fe over large regions of the global ocean
Atmos. Chem. Phys., 19, 847–860, 2019 www.atmos-chem-phys.net/19/847/2019/J. Shi et al.: Phosphorus solubility in aerosol particles 855
(Sholkovitz et al., 2012). Similarly, the relationship between
P and Al can be attributed to the mixing of two end-members,
i.e., mineral dust with a low P solubility and high Al loading
and anthropogenic aerosols with a high P solubility and low
Al loading.
For the samples with high Al loading, i.e., a concentration
of more than 6000 ng m−3 , the P solubility was frequently
below 15 %. The TP in these samples was mainly derived
from mineral dust, which contributed more than 60 % of the
TP. The 72 h back trajectories for samples with high Al load-
ing indicate that the air masses originated from the arid and
semiarid areas in the inland Asian continent, where aerosol
particles are dominated by natural mineral dust (Fig. S2).
Moreover, the air masses were rapidly transported in the el-
evated layer; the average highest altitude was approximately
2600 m during the transport of these air masses, and the av-
erage transport speed in the 36 h before arrival at Qingdao
was 47 km h−1 . These air masses passed populated areas in
a short period of time and experienced little interference by Figure 5. Relationships between P solubility and the specific sur-
anthropogenic pollutants; therefore, the high Al loading and face area of particles.
low P solubility end-member exhibited a relatively high min-
eral dust characteristic.
For samples with a low Al loading below 2000 ng m−3 , the ing more anthropogenic particles. This result suggests that
P solubility was usually above 25 %, and the average P solu- the two end-member mixtures of mineral dust and anthro-
bility was approximately 35 %. The TP in these samples was pogenic particles could not completely explain the P solubil-
mainly from anthropogenic sources, which contributed ap- ity. Nenes et al. (2011) proposed that the atmospheric acidifi-
proximately 70 % of TP. The 72 h back trajectories for the cation processes that mineral aerosols experience could be a
samples indicated that, very different from the air masses primary mechanism to enhance aerosol P solubility. Nenes
with high Al loading, these air masses moved slowly at a et al. (2011) found that the solubility of P in the Sahara
low altitude (Fig. S3). The highest altitude during the air surface soil and dust aerosols was 10–40 times higher af-
mass transport was approximately 1300 m on average, and ter acid treatment using a pH 2 sulfuric acid solution. Stock-
the transport speed in the 36 h prior to arrival at Qingdao dale et al. (2016) also found that the amount of P dis-
was an average of 23 km h−1 . The air masses passed pop- solved is directly proportional to the amount of H+ con-
ulated areas and were influenced directly by anthropogenic sumed at H+ > 10−4 mol g−1 of dust. Similar processes have
pollutants. Therefore, the low Al loading and high P solubil- been demonstrated to affect the fraction of soluble Fe in min-
ity end-member exhibited a relatively high concentration of eral dust (e.g., Baker and Croot, 2010; Shi et al., 2015; Longo
anthropogenic aerosols. et al., 2016; Li et al., 2017). However, a corroboration of di-
The inverse relationship between P solubility and total Al rect observational data on aerosol P solubility remains insuf-
loading may also reflect the effects of particle size, similar ficient. Hsu et al. (2010) reported that soluble P correlated
to aerosol Fe (Baker and Jickells, 2006; Baker and Croot, well with nss-SO2− −
4 and NO3 in aerosols collected over the
2010). A dust population with a small modal size has a East China Sea and implied that the dissolution of aerosol P
large surface area, which more efficiently serves as a sink was enhanced by the presence of acidic constituents. In the
for acidic constituents and easily leads to an increase in the present study, we confirmed that both soluble P and P solu-
solubility of dust-derived elements. There was a clear linear bility were statistically correlated with nss-SO2− −
4 , NO3 and
−
correlation between the P solubility and the specific surface Cl , indicating the potential enhancement of the dissolution
areas of the aerosols, and the solubility increased with de- of aerosol P by acid processing and the consequent increase
creases in the particle size (Fig. 5). This result is consistent in P solubility.
with previously reported results on this subject (Baker et al. Following Hsu et al. (2014), who used the ratio of acids
2006a, b). to total Fe to investigate the influence of aerosol acidifica-
tion on the Fe solubility, we use the ratio of acids / total P to
3.3.2 Atmospheric acidification processing investigate the influence of aerosol acidification on the P sol-
ubility. We found that both the nss-SO2− 4 /TP and NO3 /TP
−
Some data points, for P solubility against total Al and the spe- molar ratios were statistically correlated with P solubility
cific surface area, deviated from the fitting curves (Figs. 4, 5), in all samples (r = 0.36, p < 0.01) (Fig. 6a, b). In contrast,
and most of these points presented in the samples contain- there was no such relationship between the Cl− /TP molar ra-
www.atmos-chem-phys.net/19/847/2019/ Atmos. Chem. Phys., 19, 847–860, 2019856 J. Shi et al.: Phosphorus solubility in aerosol particles
Figure 6. Correlations between P solubility and the nss-SO2− − −
4 /TP molar ratio (a), NO3 /TP molar ratio (b), Cl /TP molar ratio (c) and
2− −
(nss-SO4 +NO3 ) / TP neq / molar ratio (d) in aerosols with different relative contributions of non-dust P (Pnd ) to TP (Pnd /TP). Data points
within the circle were not included in the regression fitting.
tio and P solubility (Fig. 6c). The combination of nss-SO2− 4 thropogenic P in the aerosols had an intrinsically higher sol-
and NO− 3 , the two major acidic constituents in atmospheric ubility than the soil-derived mineral P (Baker et al., 2006a,
aerosols, was further examined (Fig. 6d). The samples were b). This means that changes in the dominant aerosol particles
classified into three groups based on the relative contribu- could also cause differences between the slopes of the two
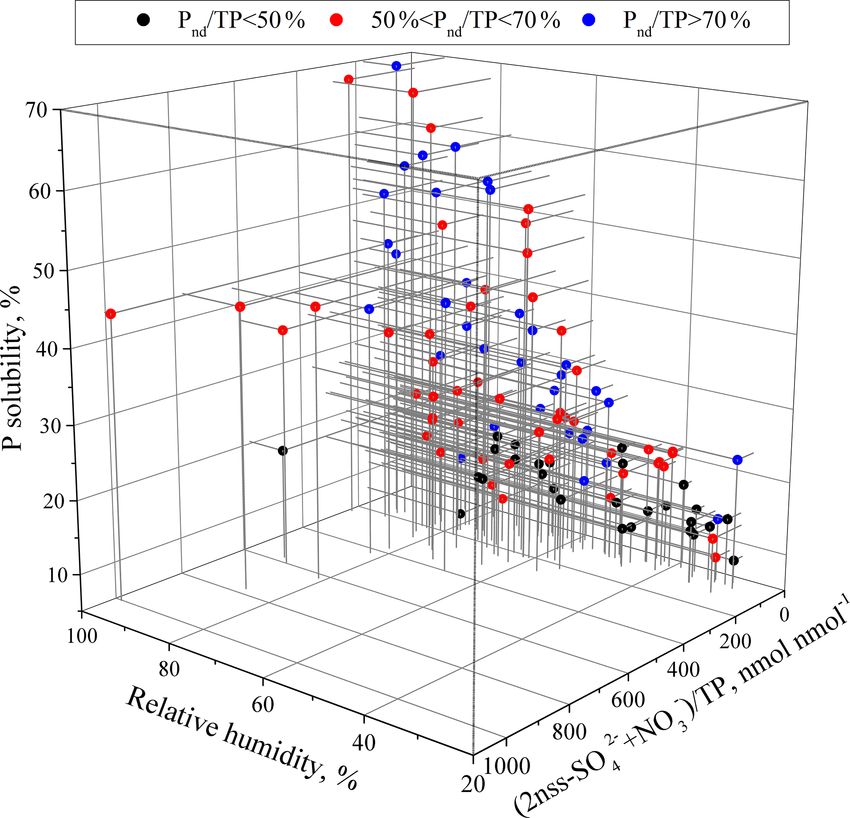
tion of non-dust P (Pnd ) to TP (Pnd /TP) (Fig. 6). The P sol- fitting curves. Hsu et al. (2014)Palso found that the relation-
ubility increases with the acidification degree (the molar ra- ship of aerosol P solubility vs. (nss−sulfate + nitrate)/TP
tio of [2nss−SO2− −
4 + NO3 ]/TP) of aerosols. However, the in a February–March cruise and June cruise over the South
P solubility versus the acid / TP ratio followed different re- China Sea followed two regression curves. They attributed
gression curves corresponding to the ranges of Pnd /TP, e.g., the discrepancy to the discernible dominance of the respec-
the slope of 0.22 in samples with Pnd /TP > 70 % and of 0.01 tive sources vs. the susceptibility to acidic processes.
in samples with Pnd /TP < 50 %. The aerosol specific surface Two data points largely deviated from the fitting curve of
area in the samples with Pnd /TP > 70 % was 4.54 m2 g−1 , 3 the Pnd /TP > 70 % samples (Fig. 6). Analysis of the charac-
times larger than that of the samples with Pnd /TP < 50 %, i.e., teristics of the two samples revealed that their DOP content
1.45 m2 g−1 . The samples with Pnd /TP > 70 % had more ar- was relatively high and was approximately 21 % of the TP,
eas to react with acidic constituents, leading to more TDP. while the DOP value for other samples was 7 % of the TP.
However, this explanation can only explain approximately Aerosol organic P is originally associated with organic mat-
15 % of the difference between the slopes of the two fitted ter in biological sources rather than anthropogenic sources
curves. The remaining difference should be due to the dif- (Chen et al., 2006). Kanakidou et al. (2012) provided an or-
ferent natures of P in the aerosols; therefore, P in anthro- ganic phosphorus budget showing a relatively large marine
pogenic particles should be more susceptible to acidic pro- source (almost 80 % with large uncertainties in magnitude).
cessing than that in natural mineral dust. Notably, the an- The organic P in the two samples with a high Cl− /TP molar
Atmos. Chem. Phys., 19, 847–860, 2019 www.atmos-chem-phys.net/19/847/2019/J. Shi et al.: Phosphorus solubility in aerosol particles 857
layers on the aerosol particles can enhance insoluble trace el-
ements, such as Fe, to dissolve under acidic conditions (Shi
et al., 2015). This was likely caused by the acidification of
particles as they cycled from cloud droplets to wet aerosols
and back (Nenes et al., 2010; Stockdale et al., 2016). We fur-
ther investigated the relationship of RH with P solubility and
confirmed that the two factors showed a significant correla-
tion (r = 0.62, p < 0.01), suggesting the significance of RH
as one of the factors influencing aerosol P solubility.
The coordinated effect of RH, aerosol sources and acid-
ity on P solubility was further investigated (Fig. 7). Be-
cause the threshold of RH for particle conversion from the
semisolid to liquid state was frequently approximately 60 %
(Liu et al., 2017), we used 60 % RH as the threshold of
wet aerosol formation. The P solubility was frequently lower
than 30 % when RH < 60 %, even in samples with a relatively
high acidification degree or a large fraction of anthropogenic
P. On average, the P solubility was approximately 13 % in
the aerosols of Pnd /TP < 50 %, while the value was approx-
imately 21 % in the aerosols of Pnd /TP > 50 %. The aerosol
Figure 7. Relationships of P solubility with the relative humidity acidification had little effect on the P solubility when the RH
and acidification degree in aerosols with different ranges of Pnd /TP. was less than 60 %.
At RH > 60 %, the P solubility ranged from approximately
10 % to approaching 70 %. To examine the influence of acid-
ratio might be, at least partly, caused by the contribution from ity or humidity on P solubility, the samples were classi-
marine biological sources in addition to terrestrial biological fied into two groups according to the acidification degree
sources. Therefore, the contribution of anthropogenic P to of 150 nmol nmol−1 , which was close to the average acid-
TP was significantly overestimated in the two samples due ification degree of all aerosol samples. For the aerosols of
to the high organic P content. In addition, insoluble organic Pnd /TP < 50 %, the P solubility was higher than 13 %. Un-
P could be converted to DOP due to the uptake of oxidants der similar acidic conditions, P solubility increased with the
and the formation of large chains of soluble multifunctional increase in RH. However, the increase was not significant
groups (Ariya et al., 2009; Myriokefalitakis et al., 2016). The and was only approximately 2 % when the RH changed from
conversion mechanism of organic P from insoluble to solu- < 60 % to > 60 %. For the aerosols of 50 % < Pnd /TP < 70 %,
ble, which is different from the acid solubilization of P, may the P solubility was frequently higher than 21 %. P sol-
also be responsible for the deviation of the two samples from ubility increased with the increase in RH. When RH in-
the fitted curve. creased from less than 60 % to more than 60 %, the P sol-
ubility increased from, on average, 20 % to 30 % under
3.3.3 Relative humidity and the coordinated effect of the acid/TP < 150 nmol nmol−1 condition and approximately
aerosol sources and acidity 20 % to 35 % under the acid / TP > 150 nmol nmol−1 condi-
tion. For the aerosols of Pnd /TP > 70 %, the P solubility was
The data points of P solubility against acids / total P for the higher than 21 %. Under similar acid conditions, the P solu-
samples of 50 % < Pnd /TP < 70 % were frequently between bility was in the range of 40 %–60 % at RH > 80 % and in the
the two fitted curves of Pnd /TP > 70 % and Pnd /TP < 50 % range of 20 %–40 % at 60 % < RH < 80 %.
(Fig. 6) and had a statistically significant correlation at the Overall, the enhancement of P solubility by RH increase
99 % confidence (r = 0.383, p = 0.006). Some data points in the mineral aerosols was much lower than in the anthro-
largely deviated from the fitted curves, showing high P solu- pogenic aerosols, in which P was more susceptible to acidi-
bility at low degrees of acidification. We focused on the seven fication, e.g., at RH > 60 %. All of these results indicate that
deviating data points at P solubility > 45 % and acid / TP RH is also likely one of the factors significantly impacting
< 200 nmol nmol−1 (the Pnd /TP in the samples was approxi- aerosol P solubility; high humidity could facilitate the dis-
mately 60 %, and these data points are highlighted in red cir- solution of aerosol P under acidic conditions and hence in-
cles in Fig. 6). The RH during the collection of these samples crease its solubility.
was approximately 80 % on average, much higher than the
value of 65 % for the other samples in this group. Elevated
RH can result in particle phase conversion from a semisolid
to a liquid state (Liu et al., 2017). The presence of aqueous
www.atmos-chem-phys.net/19/847/2019/ Atmos. Chem. Phys., 19, 847–860, 2019858 J. Shi et al.: Phosphorus solubility in aerosol particles
4 Conclusions Development Program of China (2016YFC0200504), the Na-
tional Nature Science Foundation of China (41876131) and the
National Key Basic Research Program of China (2014CB9537001).
In this study, we quantified the levels and seasonal vari-
ability in TP, TDP, DIP, DOP and P solubility at Qingdao, Edited by: Maria Kanakidou
a coastal city of the Yellow Sea, China, aiming to demon- Reviewed by: two anonymous referees
strate the solubility of P in aerosol particles from Asian con-
tinental outflow. The P solubility in Qingdao aerosols was
7.3 %–69.8 %, which overlapped with the range of values re-
ported in other coastal areas. P solubility in winter was sig-
nificantly higher than that in spring, which was related to References
the aerosol sources, atmospheric acidification processes and
Anderson, L. D., Faul, K. L., and Paytan, A.: Phosphorus associa-
ambient RH. Our data indicated that the P in aerosols from tions in aerosols: What can they tell us about P bioavailability?,
anthropogenic sources had a higher solubility than the P in Mar. Chem., 120, 44–56, 2010.
aerosols from mineral sources. The acid processing associ- Arimoto, R., Kim, Y. J., Kim, Y. P., Quinn, P. K., Bates, T. S., An-
ated with sulfate and nitrate formation could increase the sol- derson, T. L., Gong, S., Uno, I., Chin, M., Huebert, B. J., Clarke,
ubility of P, with P from anthropogenic sources demonstrat- A. D., Shinozuka, Y., Weber, R. J., Anderson, J. R., Guazzotti, S.
ing a greater susceptibility to acid processing than P from A., Sullivan, R. C., Sodeman, D. A., Prather, K. A., and Sokolik,
mineral dust. In addition, we found that DOP has an impor- I. N.: Characterization of Asian dust during ACE-Asia, Global
tant contribution to dissolved P, with an average contribution Planet. Change, 52, 23–56, 2006.
of 40 % in some cases. Furthermore, ambient RH was an im- Ariya, P. A., Sun, J., Eltouny, N. A., Hudson, E. D.,
portant factor influencing P solubility. At RH < 60 %, it was Hayes, C. T., and Kos, G.: Physical and chemical
characterization of bioaerosols – Implications for nu-
difficult for P solubility to exceed 30 %, even with a high
cleation processes, Int. Rev. Phys. Chem., 28, 1–32,
aerosol acidity and anthropogenic P contribution. High RH https://doi.org/10.1080/01442350802597438, 2009.
levels increased the dissolution of aerosol P to a greater de- Baker, A. R. and Croot, P. L.: Atmospheric and marine controls on
gree under acidic conditions, consequently increasing P sol- aerosol iron solubility in seawater, Mar. Chem., 120, 4–13, 2010.
ubility. These results imply and support that anthropogenic Baker, A. R. and Jickells, T. D.: Mineral particle size as a con-
inputs could provide more soluble P to the ocean via the at- trol on aerosol iron solubility, Geophys. Res. Lett., 33, L17608,
mosphere, thus increasing the bioavailable P in the ocean and https://doi.org/10.1029/2006GL026557, 2006.
potentially impacting ocean biogeochemistry. Baker, A. R., French, M., and Linge, K. L.: Trends in
aerosol nutrient solubility along a west–east transect of
the Saharan dust plum, Geophys. Res. Lett., 33, L07805,
Data availability. The data of this paper are available upon request https://doi.org/10.1029/2005GL024764, 2006a.
(Jinhui Shi, engroup@ouc.edu.cn). Baker, A. R., Jickells, T. D., Witt, M., and Linge, K. L.: Trends in
the solubility of iron, aluminium, manganese and phosphorus in
aerosol collected over the Atlantic Ocean, Mar. Chem., 98, 43–
58, 2006b.
Supplement. The supplement related to this article is available
Carbo, P., Krom, M. D., Homoky, W. B., Benning, L. G., and Herut,
online at: https://doi.org/10.5194/acp-19-847-2019-supplement.
B.: Impact of atmospheric deposition on N and P geochemistry
in the southeastern Levantine basin, Deep-Sea Res. Pt. II, 52,
3041–3053, 2005.
Author contributions. JS designed the research. NW conducted the Chen, Y., Street, J., and Paytan, A.: Comparison between pure-water
sample analysis. JS, NW and DZ wrote the paper. JS and DZ revised and seawater soluble nutrient concentrations of aerosols from the
the paper. NW prepared all the figures. HG, ARB and XY provided Gulf of Aqaba, Mar. Chem., 101, 141–152, 2006.
useful comments. All authors contributed toward improving the pa- Chen, Y., Mills, S., Street, J., Golan, D., Post, A., Jacobson, M., and
per. Paytan, A.: Estimates of atmospheric dry deposition and associ-
ated input of nutrients to Gulf of Aqaba seawater, J. Geophys.
Res., 112, D04309, https://doi.org/10.1029/2006JD007858,
Competing interests. The authors declare that they have no conflict 2007.
of interest. Elser, J. J., Bracken, M. E. S., Cleland, E. E., Gruner, D. S., Harpole,
W. S., Hillebrand, H., Ngai, J. T., Seabloom, E. W., Shurin, J. B.,
and Smith, J. E.: Global analysis of nitrogen and phosphorus lim-
Acknowledgements. We thank Xiaoyu Ben for his assistance itation of primary producers in freshwater, marine and terrestrial
in sample collection and part of the chemical analysis. We ecosystems, Ecol. Lett., 10, 1135–1142, 2007.
appreciate the two anonymous reviews and the editor for their Griffin, D. W., Kubilay, N., Kocak, M., Gray, M. A., Borden, T.
helpful comments and suggestions, due to which the readership C. and Shinn, E. A.: Airborne desert dust and aeromicrobiology
largely increased compared to the initial submission. This re- over the Turkish Mediterranean coastline, Atmos. Environ., 41,
search received support from the National Key Research and 4050–4062, 2007.
Atmos. Chem. Phys., 19, 847–860, 2019 www.atmos-chem-phys.net/19/847/2019/J. Shi et al.: Phosphorus solubility in aerosol particles 859
Guo, L., Chen, Y., Wang, F., Meng, X., Xu, Z., and Zhuang, G.: Kodama, T., Igeta, Y., Kuga, M., and Abe, S.: Long-term de-
Effects of Asian dust on the atmospheric input of trace elements crease in phosphate concentrations in the surface layer of
to the East China Sea, Mar. Chem., 163, 19–27, 2014. the southern Japan Sea, J. Geophys. Res., 121, 7845–7856,
Hara, K. and Zhang, D.: Bacterial abundance and viability in long- https://doi.org/10.1002/2016JC012168, 2016.
range transported dust, Atmos. Environ., 47, 20–25, 2012. Li, W., Xu, L., Liu, X., Zhang, J., Lin, Y., Yao, X., Gao, H., Zhang,
He, J., Balasubramanian, R., Burger, D. F., Hicks, K., Kuylen- D., Chen, J., Wang, W., Harrison, R. M., Zhang, X., Shao, L.,
stierna, J. C., and Palani, S.: Dry and wet atmospheric deposition Fu, P., Nenes, A., and Shi, Z.: Air pollution-aerosol interactions
of nitrogen and phosphorus in Singapore, Atmos. Environ., 45, produce more bioavailable iron for ocean ecosystems, Sci. Adv.,
2760–2768, 2011. 3, e1601749, https://doi.org/10.1126/sciadv.1601749, 2017.
Herbert, R. J., Krom, M. D., Carslaw, K. S., Stockdale, A., Mor- Liu, Y., Wu, Z., Wang, Y., Xiao, Y., Gu, F., Zheng, J., Tan, T., Shang,
timer, R. J. G., Benning, L. G., Pringle, K., and Browse, J.: The D., Wu, Y., Zeng, L., Hu, M., Bateman, A. P., and Martin, S. T.:
effect of atmospheric acid processing on the global deposition of Submicrometer particles are in the liquid state during heavy haze
bioavailable phosphorus from dust, Global Biogeochem. Cy., 32, episodes in the urban atmosphere of Beijing, China, Environ. Sci.
1–19, https://doi.org/10.1029/2018GB005880, 2018. Technol. Lett., 4, 427–432, 2017.
Herut, B., Collier, R. W., and Krom, M. D.: The role of dust in sup- Longo, F., Feng, Y., Lai, B., Landing, W. M., Shelley, R. U., Nenes,
plying nitrogen and phosphorus to the southeast Mediterranean, A., Mihalopoulos, N., Violaki, K., and Ingall, E. D.: Influence of
Limnol. Oceanogr., 47, 870–878, 2002. atmospheric processes on the solubility and composition of iron
Hsu, S.-C., Wong, G. T. F., Gong, G. C., Shiah, F. K., Huang, Y. T., in saharan dust, Environ. Sci. Technol., 50, 6912–6920, 2016.
Kao, S. J., Tsai, F., Lung, S. C. C., Lin, F. J., Lin, I. I., Hung, C. Lyu, Y. L., Liu, L. Y., Guo, L. L., Yang, Y. Y., Qu, Z. Q., Hu,
C., and Tseng, C. M.: Sources, solubility, and dry deposition of X., and Zhang, G. M.: Deposited atmospheric dust as influenced
aerosol trace elements over the East China Sea, Mar. Chem., 120, by anthropogenic emissions in northern China, Environ. Monit.
116–127, https://doi.org/10.1016/j.marchem.2008.10.003, 2010. Assess., 189, 1–14, https://doi.org/10.1007/s10661-017-6093-1,
Hsu, S.-C., Gong, G.-C., Shiah, F.-K., Hung, C.-C., Kao, S.-J., 2017.
Zhang, R., Chen, W.-N., Chen, C.-C., Chou, C. C.-K., Lin, Y.- Mackey, K. R. M., Mioni, C. E., Ryan, J. P., and Paytan, A.:
C., Lin, F.-J., and Lin, S.-H.: Sources, solubility, and acid pro- Phosphorus cycling in the red tide incubator region of Mon-
cessing of aerosol iron and phosphorous over the South China terey Bay in response to upwelling, Front. Microbiol., 3, 1–14,
Sea: East Asian dust and pollution outflows vs. Southeast Asian https://doi.org/10.3389/fmicb.2012.00033, 2012a.
biomass burning, Atmos. Chem. Phys. Discuss., 14, 21433– Mackey, K. R. M., Roberts, K., Lomas, M. W., Saito, M. A., Post,
21472, https://doi.org/10.5194/acpd-14-21433-2014, 2014. A. F., and Paytan, A.: Enhanced Solubility and Ecological Impact
Izquierdo, R., Benítez-Nelson, C. R., Masqué, P., Castillo, S., of Atmospheric Phosphorus Deposition upon Extended Seawater
Alastuey, A., and Àvila, A.: Atmospheric phosphorus deposition Exposure, Environ. Sci. Technol., 46, 10438–10446, 2012b.
in a near-coastal rural site in the NE Iberian Peninsula and its role Mahowald, N., Jickells, T. D., Baker, A. R., Artaxo, P., Benitez-
in marine productivity, Atmos. Environ., 49, 361–370, 2012. Nelson, C. R., Bergametti, G., Bond, T. C., Chen, Y., Co-
Joos, H., Madonna, E., Witlox, K., Ferrachat, S., Wernli, H., hen, D. D., Herut, B., Kubilay, N., Losno, R., Luo, C.,
and Lohmann, U.: Effect of anthropogenic aerosol emissions Maenhaut, W., McGee, K. A., Okin, G. S., Siefert, R. L.,
on precipitation in warm conveyor belts in the western North and Tsukuda, S.: Global distribution of atmospheric phos-
Pacific in winter – a model study with ECHAM6-HAM, At- phorus sources, concentrations and deposition rates, and an-
mos. Chem. Phys., 17, 6243–6255, https://doi.org/10.5194/acp- thropogenic impacts, Global Biogeochem. Cy., 22, GB4026,
17-6243-2017, 2017. https://doi.org/10.1029/2008GB003240, 2008.
Kanakidou, M., Duce, R. A., Prospero, J. M., Baker, A. R., Benitez- Myriokefalitakis, S., Nenes, A., Baker, A. R., Mihalopoulos, N., and
Nelson, C., Dentener, F. J., and Sarin, M.: Atmospheric fluxes of Kanakidou, M.: Bioavailable atmospheric phosphorous supply to
organic N and P to the global ocean, Global Biogeochem. Cy., the global ocean: a 3-D global modeling study, Biogeosciences,
26, GB3026, https://doi.org/10.1029/2011GB004277, 2012. 13, 6519–6543, https://doi.org/10.5194/bg-13-6519-2016, 2016.
Kanakidou, M., Myriokefalitakis, S., and Tsigaridis, K.: Aerosols in Nenes, A., Krom, M. D., Mihalopoulos, N., Van Cappellen, P., Shi,
atmospheric chemistry and biogeochemical cycles of nutrients, Z., Bougiatioti, A., Zarmpas, P., and Herut, B.: Atmospheric
Environ. Res. Lett., 13, 063004, https://doi.org/10.1088/1748- acidification of mineral aerosols: a source of bioavailable phos-
9326/aabcdb, 2018. phorus for the oceans, Atmos. Chem. Phys., 11, 6265–6272,
Karl, D. M. and Tien, G.: Temporal variability in dissolved phos- https://doi.org/10.5194/acp-11-6265-2011, 2011.
phorus concentrations in the subtropical North Pacific Ocean, Paytan, A. and McLaughlin, K.: The oceanic phosphorus cycle,
Mar. Chem., 56, 77–96, 1997. Chem. Rev., 107, 563–576, 2007.
Kim, I. N., Lee, K., Gruber, N., Karl, D. M., Bullister, J. L., Peñuelas, J., Poulter, B., Sardans, J., Ciais, P., Velde, M., Bopp,
Yang, S., and Kim, T. W.: Increasing anthropogenic nitro- L., Boucher, O., Godderis, Y., Hinsinger, P., Llusia, J., Nardin,
gen in the North Pacific Ocean, Science, 346, 1102–1106, E., Vicca, S., Obersteiner, M., and Janssens, I. A.: Human-
https://doi.org/10.1126/science.1258396, 2014. induced nitrogen-phosphorus imbalances alter natural and man-
Kim, S. K., Chang, K. I., Kim, B., and Cho, Y. K.: Contribution aged ecosystems across the globe, Nat. Commun., 4, 2934,
of ocean current to the increase in N abundance in the north- https://doi.org/10.1038/ncomms3934, 2013.
western Pacific marginal seas, Geophys. Res. Lett., 40, 143–148, Qi, J., Liu, X., Yao, X., Zhang, R., Chen, X., Lin, X., Gao, H., and
https://doi.org/10.1029/2012GL054545, 2013. Liu, R.: The concentration, source and deposition flux of ammo-
nium and nitrate in atmospheric particles during dust events at a
www.atmos-chem-phys.net/19/847/2019/ Atmos. Chem. Phys., 19, 847–860, 2019You can also read