Stranding trends of Steller sea lions - Eumetopias jubatus 1990 2015
←
→
Page content transcription
If your browser does not render page correctly, please read the page content below
Vol. 38: 177–188, 2019              ENDANGERED SPECIES RESEARCH
                                                                                                 Published April 11
 https://doi.org/10.3354/esr00945             Endang Species Res

                                                                                                  OPEN
                                                                                                  ACCESS

                   Stranding trends of Steller sea lions
                      Eumetopias jubatus 1990−2015
                                    Janessa Esquible, Shannon Atkinson*
College of Fisheries and Ocean Sciences, Fisheries Department, University of Alaska Fairbanks, Juneau, Alaska 99801, USA

       ABSTRACT: Distinct population segments of Steller sea lion (SSL) Eumetopias jubatus have ex-
       perienced different population trends over the last 5 decades, rendering the need for retrospective
       study. By identifying long-term stranding trends of SSLs we can develop a better understanding
       of factors contributing to mortality that may affect SSL population dynamics. We characterized
       spatial and temporal trends of SSL strandings (n = 1507) in Alaska, Oregon, and Washington, USA,
       over a 25 yr period. Stranding reports were obtained from the Alaska and Northwest Region’s
       Marine Mammal Stranding Networks. Temporal trends were assessed by identifying seasonal
       patterns across all years (1990−2015), analyzing sex, age class, body length, and characterizing
       signs of human interaction including factors contributing to mortality. An apparent increase in
       strandings occurred after 2000, likely due to increased stranding response effort resulting from
       increased federal grant awards. Adult males were the most frequently stranded sex and age class
       in the Alaska (AK) and Northwest (NW) Regions. Clear seasonality trends were evident, with the
       greatest reported stranding occurrences during the spring and summer. Gunshot wounds and
       fishery interactions accounted for a large proportion (90%) of human interaction cases. In Alaska,
       the southeast region had the highest number of strandings. In the NW Region, Oregon had the
       highest documented strandings. Despite caveats associated with stranding data, our findings sug-
       gest rapid timing of continued stranding response is imperative for a better understanding of
       cause-specific mortality trends and other factors contributing to stranding events.

       KEY WORDS: Steller sea lions · Eumetopias jubatus · Strandings · Mortality trends ·
       Alaska Region · Northwest Region

                  1. INTRODUCTION                             US Endangered Species Act (Loughlin & York 2000,
                                                              Miller et al. 2005, Atkinson et al. 2008). Despite nu-
  Steller sea lions (SSLs) Eumetopias jubatus inhabit         merous proposed hypotheses, researchers have yet
areas along the North Pacific rim from California,            to determine a sole cause that led to the decline
USA, to Japan, with about 70% of the population               (National Research Council 2003, Hennen 2006,
dwelling in Alaskan waters (National Research                 Atkinson et al. 2008). Disease, malnutrition, preda-
Council 2003). The eastern and western SSL stocks             tion, climate change, entanglement in marine debris,
are federally recognized as being separated at Cape           and other factors may have contributed; however,
Suckling, 144° W longitude (see Fig. 1) (Allen &              there are limitations on assessing the myriad of pos-
Angliss 2013). Many studies conducted after the               sibilities affecting SSL populations (Loughlin 1998,
well-known decline that began in the 1960s resulted           Trites & Donnelly 2003, Burek et al. 2005, Atkinson et
in the listing of the western SSL stock as endangered         al. 2008). The divergent population trajectories of the
and the eastern SSL stock as threatened under the             eastern and western SSL stocks, including lack of a
                                                              © The authors 2019. Open Access under Creative Commons by
*Corresponding author: skatkinson@alaska.edu                  Attribution Licence. Use, distribution and reproduction are un-
                                                              restricted. Authors and original publication must be credited.
                                                              Publisher: Inter-Research · www.int-res.com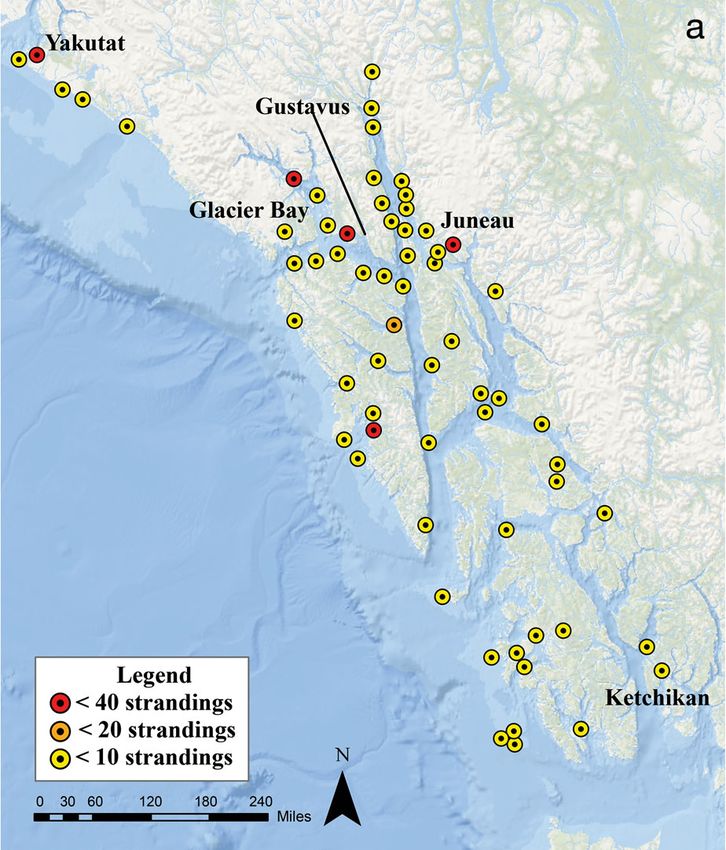
178                                   Endang Species Res 38: 177–188, 2019

robust recovery of the western SSL stock and more            The present study aimed to reveal the occurrence
recently recovered and delisted eastern SSL stock,        and overall distribution of SSL stranding incidents over
demonstrate the need for further analyses of multiple     a broad geographic range by compiling and synthesiz-
factors driving SSL population dynamics over large        ing SSL stranding data collected between 1990 and
spatial and temporal scales.                              2015 from Alaska, Washington, and Oregon. These
  We used SSL stranding data collected from 1990−         data were obtained from the Alaska (AK) Region and
2015 to better understand trends in the spatial and       the Northwest (NW) Region National Marine Mammal
temporal distribution of strandings across coastal        Stranding Networks and the Alaska Department of
Alaska, Washington, and Oregon. A stranding refers        Fish & Game. The main objectives of this study were to
to an individual or group of animals found on a           (1) map spatial trends in SSL strandings to aid in identi-
shore that are unable to return to their natural habi-    fying geographic areas that may need improved
tat or that are observed dead on shore (Geraci &          stranding surveillance systems due to their lack of rep-
Lounsbury 2005). Stranding data may be utilized to        resentation in the stranding reports, or detect high fre-
complement annual census surveys, by providing            quency stranding occurrences and locations; (2) identify
seasonal information on population distribution           annual and seasonal trends across a 25 yr period for
(Maldini et al. 2005) and potential issues occurring      both geographic regions; and (3) identify signs of hu-
in nearshore environments, as the bulk of these           man interaction in strandings across the AK and NW
strandings occur close to shore (Flint et al. 2015).      Regions, some of which may be categorized as con-
Therefore, the present study contributes to our           tributing factors to SSL stranding mortalities.
understanding of unknown SSL mortality trends                These objectives may aid in refining our current
and may give rise to conservation concerns associ-        understanding of potential impediments to the recov-
ated with anthropogenic interactions or specific          ery of the western SSL stock. The robust period en-
locations (Bossart 2011).                                 compassed in these reports enables a thorough char-
  The National Marine Fisheries Service (NMFS)            acterization of trends in SSL strandings, as typified in
provides oversight of marine mammal stranding             other stranding studies (MacLeod et al. 2004, Maldini
activities facilitated by the National Marine Mam-        et al. 2005).
mal Stranding Network, which appoints stranding
coordinators in 5 regions within the United States
to assist with coordination of reporting stranded                   2. MATERIALS AND METHODS
animals and identification of mass mortalities or
strandings caused by disease, toxins, or other prob-                   2.1. Animals and study area
lems (NOAA 2019). Reporting of marine mammal
strandings requires all members of stranding net-           Level A stranding data for SSLs (n = 1507) from
works to collect Level A data, which includes ani-        1990−2015 were obtained from the AK Region (n =
mal ID, location of stranding, condition at examina-      544) and NW Region (n = 963) Marine Mammal
tion, demographic information such as age class           Stranding Networks. Data included date and location
and sex, standard length, information on the pur-         of stranding, standard length (tip of snout to tip of
pose of samples collected, reasons for the stranding      tail, measured in cm; Geraci & Lounsbury 2005), sex,
response, and details associated with the stranding       age class, and details on signs of human interaction.
event (NOAA 2017). Despite study constraints due          The date of reported strandings was used as a proxy
to limited detail of pathological and histological        for time of death (Flint et al. 2015), and seasons were
data, Level A reports do provide the information          defined as summer (June−August), fall (Septem-
needed to detect basic information on life history,       ber−November), winter (December−February), and
biology, and general health of a population (NOAA         spring (March−May) for summarizing trends. If coor-
2017). An additional human interaction form is            dinates were not provided, the centroid of the town
encouraged to be completed, but only required for         closest to the stranding was used. Strandings oc-
marine mammal species listed as endangered/               curred from as far northwest as St. Paul Island,
threatened species, and large toothed whales,             Alaska (57.1867° N, 170.2575° W), to as far south as
baleen whales and all cetaceans that strand as            Medford, Oregon (42.3265° N, 122.8756°W), encom-
alive, fresh dead or in a state of moderate decom-        passing both eastern and western SSL stocks. We
position (NOAA 2017). Cause of stranding or death         compared data obtained from the AK Region, which
cannot always be determined from this information         included strandings from both stocks, with data from
alone.                                                    the NW Region, which only contained strandings
Esquible & Atkinson: Stranding trends in Steller sea lions                       179

from the eastern SSL stock. However, it should be             or it was unknown whether the animal was found
recognized that the location of a stranding does not          alive or dead upon initial observation.
necessarily reflect its stock of origin. Age class (n =
1120), sex (n = 955), and standard length (n = 969)
were documented for the majority of strandings, but                               2.2. Data analysis
decomposition of some carcasses prevented us from
obtaining these data for all strandings. The AK                  Age class used for analyses included pups, sub-
Region data contained fetal cases solely as a result of       adults, and adults. Yearling data were excluded
more specific stranding reports submitted by the              because they were not available for the AK Region.
Alaska Department of Fish & Game. The basic                   All statistical analyses were conducted with R v.3.4.0
detailed Level A information was the only informa-            (R Core Team 2018). The 1-sample proportion z-test
tion included in this data set from fetal cases. Fetal        with continuity correction was used to determine if
cases were not routinely identified as a category in          there was a significant difference between propor-
Level A reports, which is why this category was               tions of male and female strandings across both
excluded in the NW Region. One case was excluded              regions. Pearson’s chi-squared test with Yate’s conti-
from the NW Region stranding records because it               nuity correction was used to determine significant
occurred outside of US boundaries (i.e. British               differences in the proportion of carcasses between
Columbia, Canada). Age class was subdivided into 5            regions that were of unknown age class or unknown
categories in each region, including fetuses, pups,           sex, and the differences in the proportion of strand-
sub-adults, adults, and unknown in the AK Region;             ings that occurred in the spring/summer and fall/
and pups, yearlings, sub-adults, adults, and un-              winter between seasons.
known in the NW Region. Age class in the NW
Region was defined using the NMFS examiners
guide (NOAA 2017, p. 17): ‘Pup: Animal is smaller than                  2.3. Spatial and temporal analysis
yearling size, or estimated to be younger than one
year old. Yearling: Animal is judged to be approxi-             A geographic information system (ArcGIS v.10.2.1;
mately between one and two years old. Sub-adult:              ESRI) was used to map all strandings. An adjusted
Animal is judged to be greater than two years old,            scale and corresponding markers were used to docu-
but not yet mature. Adult: Animal is judged to be an          ment strandings using the best available information
adult; or found upon necropsy to be sexually mature.          on location of stranding occurrence. As strandings
Unknown: Unable to determine the age class.’                  are often reported based on a general location, if
   Because stranding reports are only an index of a           geographic coordinates were not available, the clos-
sighting/event, it would be less accurate to specify an       est township was used. Strandings were grouped
age class as yearling, and therefore any cases that           where the occurrence of 10 or more strandings were
may have been yearlings were identified as sub-               located in a given area, which was usually associated
adults in the AK Region (K. Savage pers. comm.). Sex          with a town or human population center. Temporal
was categorized as female, male, or unknown by ob-            trends were illustrated in a line chart using the
serving external genitalia.                                   annual number of strandings per year. Box plots were
   Carcass condition upon examination was defined             used to examine seasonal trends in each region (R
using the NMFS examiner’s guide (NOAA 2017):                  Core Team 2018). Five generalized linear models
Alive: The animal was found alive at initial observa-         (GLMs) were used to determine if the probability of a
tion. Fresh Dead: The animal was in good condition            stranding occurrence in the spring/summer versus
with normal appearance, but may have had some                 fall/winter differed based on all combinations of 2
evidence of scavenger damage. Moderate Decompo-               categorical covariates: age class (pups, sub-adults,
sition: The carcass was in fair condition and most            and adults) and region (AK and NW Region). There
organs were intact. Advanced Decomposition: The               was no control for the group of covariates because
carcass was in poor condition with a strong odor, skin        the study was purely observational. For the binary
sloughing, severe scavenger damage and liquefied              logistic regression model, season was represented by
muscles. Mummified: The only remains were skele-              0 for fall/winter months (September−February) and 1
tal and the remaining tissues were desiccated. Con-           for spring/summer months (March−August). Five
dition Unknown: The stranded animal was found                 GLMs were constructed to represent all subsets of
dead upon initial observation but additional informa-         age class and season. Akaike’s information criterion
tion on the condition of the carcass was unavailable,         (AIC) was used for model selection.
180                                     Endang Species Res 38: 177–188, 2019

 2.4. Signs of human interaction and contributing           Table 1. Percentages and sample size of each sex from
              factors to SSL mortality                      stranded Steller sea lions in Alaska (AK) and Northwest
                                                            (NW) Regions (1990−2015). (*) Significant difference from
                                                                        females in each region (p < 0.0001)
   Signs of human interaction were categorized for all
cases and placed into the following 2 categories: yes
                                                             Sex                     AK stranding       NW stranding
or no. Cases where sign of human interaction could                                   incidents (%)      incidents (%)
not be determined were categorized appropriately as
‘CBD’. Human interactions do not imply cause of              Unknown                  56.4 (n = 307)     25.4 (n = 245)
stranding or death; however, certain signs of human          Female                   11.2 (n = 61)      33.7 (n = 326)
                                                             Male                     32.4 (n = 176)*    40.7 (n = 392)*
interactions were considered contributing factors to         Total no. stranded           544                963
morality, including boat collisions, gunshot wounds,
fishery interactions, and other human interactions (i.e.
ingested plastic, debris entanglement, wounds from          Region had a higher percentage of unknown age
other weapons, non-boat vessel related injuries, muti-      classes at 49% (n = 265) in comparison to the NW
lation, etc; NOAA 2017). The data synthesized in this       Region with 13% (n = 122, χ2 = 191.79, df = 1, p <
study provided very little information on other details     0.0001; Table 2). Due to inconsistency in age classes
of human interaction.                                       identified between the regions, as well as varying
                                                            sample sizes, a robust comparison of standard length
                                                            across each age class was not possible. There was
                2.5. Stranding effort                       great variation across all age classes, with exception
                                                            of the fetal age class (Table 2).
  The present study attempted to normalize the
stranding data by accounting for effort following the       Table 2. Number of Steller sea lion strandings in each age class
distribution of the John H. Prescott Marine Mammal          and their mean (± SD) standard lengths occurring in the Alaska
Rescue Assistance Grant Program in 2001. An over            (AK) and Northwest (NW) Regions. Note that the age classes are
                                                            defined slightly differently in each region, explaining the missing
dispersed Poisson regression model was used to com-                               cells. NA: not applicable
pare the number of stranding reports before and after
the Prescott grant was awarded. Furthermore, Prescott
                                                             Age                     AK                    NW
grant recipients changed following 2010, and similar         class       Stranding     Standard Stranding Standard
data from 2011−2015 were unable to be obtained for                       incidents    length (cm) incidents length (cm)
the purpose of this study. Although not all stranding
data effort was accounted for in this study, quantifi-       Fetus            4          78 ± 0.0
                                                             Pup             25        89.4 ± 24.6       66     127.9 ± 19.1
cation of effort did provide some explanation for            Yearling                                   136     100.6 ± 17.3
observed temporal trends.                                    Sub-adult       76       187.0 ± 46.0      120     191.2 ± 41.8
                                                             Adult          174       265.3 ± 53.7      519     241.7 ± 51.3
                                                             Unknown        265           NA            122         NA
                                                             Total          544           NA            963         NA
                     3. RESULTS

   The proportion of male strandings in both regions        Table 3. Percentages and sample size of Steller sea lion (SSL) car-
                                                            cass condition at examination in the Alaska (AK) and the North-
was significantly greater than female strandings (p <       west (NW) Regions. The percentage of stranding incidents to
0.0001; Table 1). A greater percentage of carcasses         categorize carcass condition was based on observation at the time
defined as unknown sex (56%, n = 307) were col-                                        of stranding
lected from the AK Region than in the NW Region, in
which 25% (n = 245) of cases were defined as un-             Initial condition              AK stranding      NW stranding
known sex (χ2 = 142.52, df = 1, p < 0.0001; Table 1). Of                                    incidents (%)     incidents (%)
the carcasses identified as unknown sex in the AK
                                                             Alive                          23.7 (n = 129)     9.1 (n = 88)
Region, 40% were in a state of moderate or advanced          Fresh dead                     24.2 (n = 132)    20.7 (n = 199)
decomposition upon initial sighting, which con-              Moderate decomposition         22.2 (n = 121)    27.1 (n = 261)
tributed to the difficulty in identifying the sex of the     Advanced decomposition         16.4 (n = 89)     35.9 (n = 346)
stranded animal.                                             Mummified                       3.9 (n = 21)      2.7 (n = 26)
                                                             Condition unknown               9.6 (n = 52)      4.5 (n = 43)
   For cases where age class was determined, adults
                                                             Total no. of SSL stranding          544               963
were the highest reported stranding age class in both         incidents
the AK (32%) and NW (54%) Regions. The AK
Esquible & Atkinson: Stranding trends in Steller sea lions 181
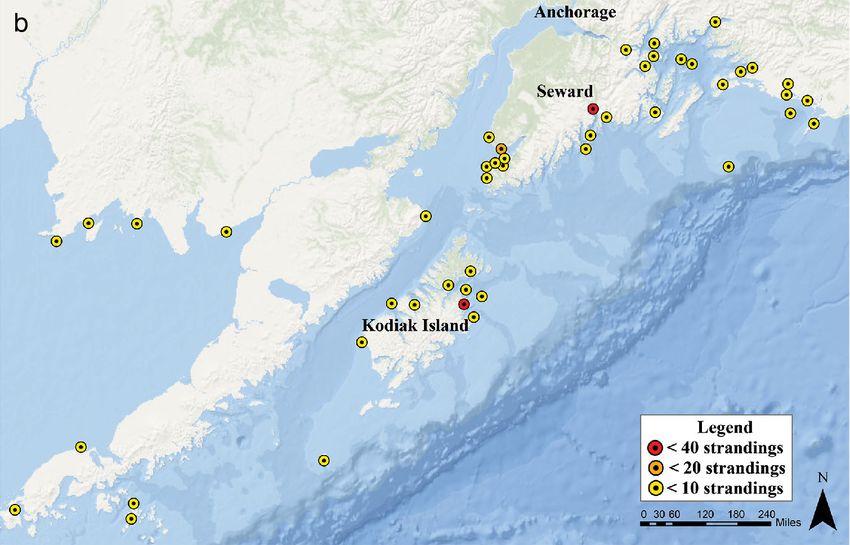
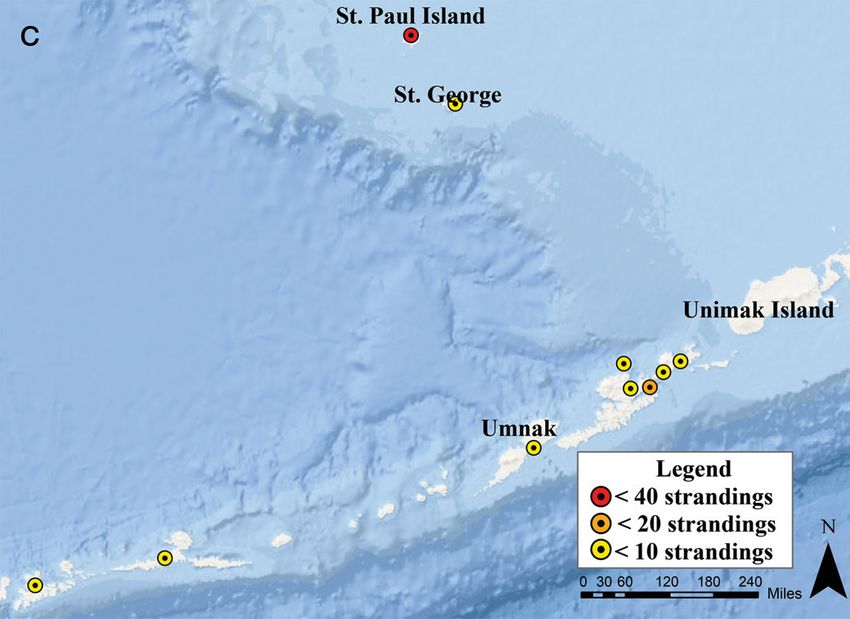
Fig. 1. Study area of the
Alaska (AK) Region, en-
compassing stranding
counts for the (a) eastern
Steller sea lion (SSL)
stock in southeast AK,
and western SSL stock
in (b) southcentral and
western AK and (c) the
Aleutian Islands and Be-
ring Sea. Markers iden-
tify stranding locations,
and colors indicate areas
of high and low strand-
ing counts
3.1. Spatial maps
Stranding events in AK region ranged from as far
north and west as St. Paul (57.1225° N, 170.2799° W),
to as far east as Ketchikan, and as far south as Umnak
on the Aleutian archipelago (53.2238° N, 168.4319° W;
Fig. 1a−c). There were 292 (54%) strandings reported
The initial condition upon examination of the from the eastern SSL stock in the AK Region and 252
stranded SSLs varied by region (Table 3). In the AK (46%) strandings reported within the western SSL
Region, the initial condition of the majority of strand- stock; however, stranded animals may or may not
ings was alive (24%), fresh dead (24%), or in a state have originated from these stocks. The areas of Juneau
of moderate decomposition (22%). In the NW Region, (58.3019° N, 134.4197° W), Glacier Bay (58.6658° N,
36% of carcasses were in a state of advanced decom- 136.9002°W), and Gustavus (58.4133° N, 135.7369°W)
position and 27% of carcasses were in a state of mod- accounted for the highest number of strandings in the
erate decomposition, with a smaller percentage of AK Region (Fig. 1a). Kodiak (57.7900° N, 152.4072°W),
strandings reported as alive (9%; Table 3). St. Paul, and Seward (60.1042° N, 149.4422° W)182 Endang Species Res 38: 177–188, 2019
had the second highest numbers of strandings
(Fig. 1b,c).
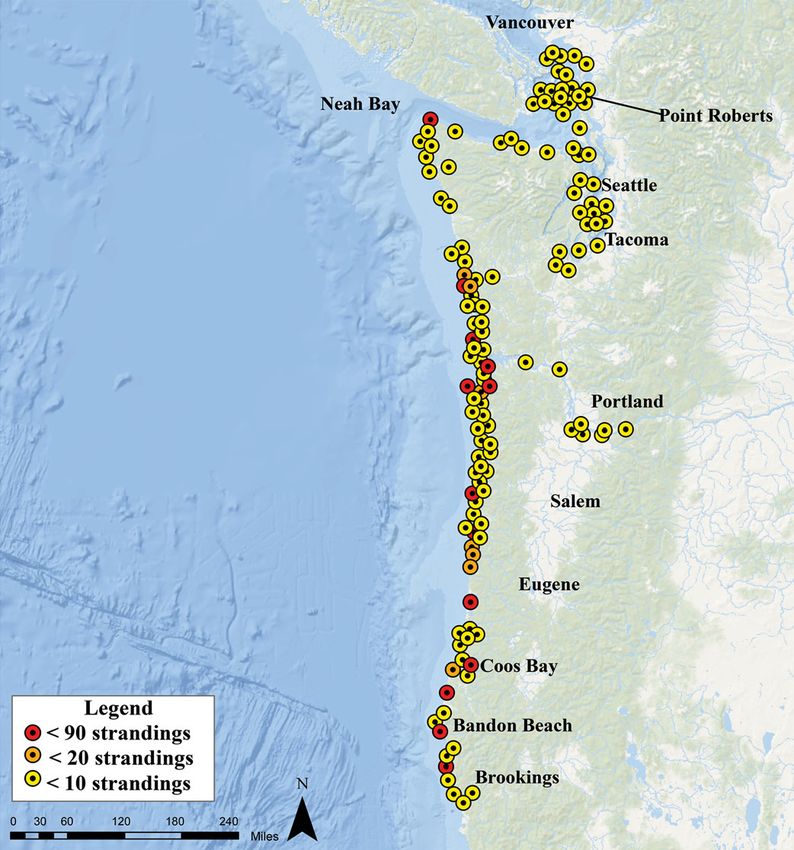
The most northern location of strandings in the
NW Region was near the town of Point Roberts,
Washington (48.5912° N, 123.0528° W); the most
southern stranding location was near the town
of Brookings, Oregon (42.327° N, 124.1711° W;
Fig. 2). The highest frequency of strandings was
in Bandon Beach, Oregon, with 89 strandings,
which was 9% of the total number of strandings
occurring in the NW Region (Fig. 2). The second
highest frequency of strandings occurred in
Neah Bay, Washington, representing roughly
3% of the total number of stranding incidents. In
the NW Region more strandings occurred on the
Oregon coastline (67.6%) than the Washington
coastline (32.4%).
3.2. Temporal analysis
There was no apparent increase in annual
strandings reported from 1990−2004; however,
beginning in 2005, there was an overall increase
Fig. 2. The NW Region study area, including a portion of the east-
ern stock of the Steller sea lion population that extends from north- in the annual number of strandings in both the
ern Washington to southern Oregon. Markers identify stranding lo- AK and NW Regions (Fig. 3). Analysis of the pro-
cations, and colors indicate areas of higher and lower density portion of strandings by age class indicated that
strandings over the entire time 25 yr time period (1990−2015). The
adults accounted for the largest proportion of
study area includes stranding incidents from as far north as Point
Roberts, Washington (48.5912° N, 123.0528° W) and as far south as strandings across all years, with the exception of
Brookings, Oregon (42.327° N, 124.1711° W) 1998−2000 in the AK Region (Fig. 4). Across all
25 yr, the mean number of month-
ly strandings was 0.42 ± 0.11 mo−1
in the AK Region and 3.10 ±
0.4 mo−1 in the NW Region. There
was an increase in mean number
of monthly strandings, from 1.83
± 1.75 in 2005 to 10.25 ± 2.63 in
2007 (W = 2, p < 0.05) in the NW
Region.
There was a significant differ-
ence in the proportion of strand-
ings in spring and summer
between the AK Region (78%)
and the NW Region (66%) (p <
0.0001). However, there was no
significant difference between
the percentage of pups (73%),
sub-adults (68%), and adults
Fig. 3. Annual number of Steller sea lion strandings from 1990−2015. Data encom- (69%) stranding in spring and
pass the Alaska (AK) Region (solid circles), which includes stranding incidents summer (p > 0.05). The number
from the Gulf of Alaska and the Bering Sea, and the Northwest (NW) Region (open
circles), which includes strandings in the north eastern Pacific Ocean, along the of stranding reports in the spring
coast of Oregon and Washington. Data are not corrected for surveillance and and summer months was signifi-
stranding response effort cantly higher than the number ofEsquible & Atkinson: Stranding trends in Steller sea lions 183
with 98 strandings. In Juneau, 45% of the strand-
ings were reported in the summer months.
The NW Region also had clear seasonal trends,
with the number of stranding reports in the spring
and summer months significantly higher than in the
fall and winter (χ2 = 103.04, df = 1, p < 0.0001;
Fig. 5b). Raw data from the NW Region indicated the
highest number of stranding occurrences (149 in July
and 111 in August) across the time series. AIC analy-
ses showed that Model 1 had the best fit (AIC =
1351.94), carrying 57% of the model weight, indica-
ting that region was more important than age at
explaining variability and timing of stranding. The
estimated relationship for Model 1 was: logit(p) = (βo)
+ 0.77 (region), where p is the probability of strand-
ings occurring in the spring and summer for region βo
is the log odds of strandings in spring and summer,
pooled, in AK (Table 4).
3.3. Signs of human interaction
Overall, signs of human interaction could not be
determined for the majority of cases (AK: n = 339,
Fig. 4. Proportion of Steller sea lion strandings in (a) Alaska
(AK) and (b) Northwest (NW) Regions for each age class NW: n = 681; Table 5); 50% of these cases in the AK
across years where data were available. Sample size of Region and 67% of these cases in the NW Region
known age classes is presented above each bar. Age class were categorized as being in a state of moderate or
was unknown for all strandings from 1993−2000 in the advanced decomposition. However, 81% of human
NW Region
interactions were identified between 2008 and 2015
in both regions. Human interaction accounted for
stranding reports in the fall and winter months (χ2 = 27% in the AK Region and 18% of strandings in the
21.17, df = 1, p < 0.0001; Fig 5a), with the highest NW Region and included boat collisions, gunshot,
stranding occurrences documented in the summer fishery interactions, and other interactions (Table 5).
(max. = 21) and the lowest in winter (max. = 5; In both regions, gunshot and fishery interactions
Fig. 5a). Raw data from the AK Region indicated the accounted for 90% of strandings identified as ex-
highest total number of strandings across all 12 mo hibiting signs of human interaction. A smaller pro-
occurred in July with 118 strandings and in June portion exhibited signs of other human interactions,
●
35 ●
20 a b
30
Number of strandings
15 25
● ●
●
20 ●
10 ●
15
●
●
● ●
10
5 ●
●
● ● 5
0 0
Winter Spring Summer Fall Winter Spring Summer Fall
Season
Fig. 5. Variability in the total number of Steller sea lion stranding events occurring each season over a 25 yr period from
1990−2015 in the (a) Alaska (AK) and (b) Northwest (NW) Region. Horizontal line: median184 Endang Species Res 38: 177–188, 2019
Table 4. Five generalized linear models for Steller sea lion strandings, in- southeast Alaska, with the second highest
cluding the covariates age class and region, where p = probability of a being in the southcentral area which in-
stranding occurring in the spring/summer as opposed to fall/winter for re-
gion i. Akaike’s information criterion (AIC) was used for model selection
cludes Seward and Kodiak (NOAA 2016).
Despite the higher number of stranding
reports in Oregon, Washington had more
Model AIC ΔAIC AIC weight
stranding agreement holders and covered
logit(p) = B0 + B1 × Region 1351.94 0 0.57 participants than Oregon (NOAA 2016).
logit(p) = B0 + B1 × Region + B2 × Age 1353.00 1.06 0.33 The higher number of strandings in Ore-
logit(p) = B0 + B1 × Region + B2 1355.43 3.48 0.10 gon may be due to the higher number of
× Age + B3 × Region × Age
logit(p) = B0 1372.69 20.75 0
haulouts and rookeries in Oregon com-
logit(p) = B0 + B1 × Age 1375.10 23.16 0 pared to Washington.
Table 5. Percentages and sample size of Steller sea lion−human interac-
4. DISCUSSION
tion cases in the Alaska (AK) and Northwest (NW) Regions. Total number
of stranding incidents does not equal the sum of interactions in the NW
Region as some cases had more than one interaction The age class of stranded marine mam-
mals is an important parameter when
Human interaction type AK stranding NW stranding evaluating abundance trajectories of en-
incidents incidents dangered or depleted populations. Elastic-
ity analyses conducted by Maniscalco et
Boat collisionEsquible & Atkinson: Stranding trends in Steller sea lions 185
males have more extensive and variable movements on the Oregon coastline. This suggests that increased
(Raum-Suryan et al. 2002), which may help to explain response effort did not result in increased number of
the higher frequency of male strandings. The higher stranding reports in Washington. The California cur-
number of male strandings may also be attributed to rent flows south from Washington through Oregon
higher nutritional requirements by larger males and and may have contributed to the greater abundance
male−male competition during active reproduction of strandings in Oregon due to carcass drift (NOAA
and time spent on rookeries (Hogg & Forbes 1997, 2016). In addition, there is only one SSL rookery com-
Clutton-Brock & Isvaran 2007). Although prior re- plex in Washington, which could account for the low
search findings provide support for observed strand- occurrence of strandings as there would be fewer
ing trends in sex and age class, Peltier et al. (2014) aggregations of SSL and pups in the summer. The
stressed the need for information on physical compo- high number of strandings occurring around Coos
nents that include processes which will determine Bay, Oregon, could be a result of increased anthro-
carcass drift, including tides, currents, and winds. pogenic interaction considering that Coos Bay has a
large population center with an associated commer-
cial fishing hub and, perhaps, increased likelihood of
4.1. Spatial analysis strandings being reported (Lee 2016). The second
highest number of strandings occurred along the
The greatest number of strandings occurred in coastal zone of Curry County, Oregon, in relatively
southeast Alaska, which is also where the highest close proximity to Pyramid Rock, Long Brown, and
number of agreement holders are located. The sec- Seals Rock, which are sites that were designated
ond highest number of strandings was in south- as critical habitat for SSL, and should be further
central AK, again reflective of the second highest monitored post-delisting for elevated numbers of
number of agreement holders in the AK Region. strandings (NMFS 2008). Further investigation of dis-
Although the distribution and number of stakehold- tribution of prey persistence and correlated SSL
ers in Alaska is not known for the entire time series, movement patterns may help to better interpret the
it was known for a substantial portion of the time spatial trends observed in the NW Region (Womble
series (2001−2010), including an increase of 5 strand- et al. 2009).
ing stakeholders in this region following 2010. We
would expect to see a higher number of strandings in
waters inhabited by the eastern stock due to their 4.2. Temporal analyses
increasing population abundance and distribution at
> 3% yr−1 since the 1970s (Pitcher et al. 2007) and Temporal analyses revealed that the mean number
more recent delisting of the stock’s prior ‘threatened’ of stranding reports increased after 2002, which is
status (Fritz et al. 2014). The uneven distribution of likely a result of the distribution of federal funds
stranding stakeholders and tourist destinations across through the Prescott Awards and not reflective of
Alaska influences the effort of finding stranded SSLs, SSL population changes. However, the apparent
and thus may not reflect true SSL abundance and steep incline in the mean number of annual stranding
distribution. Therefore, the spatial trends observed reports from 2005−2007 in the NW Region is difficult
appear to be reflective of SSL population abundance, to interpret. Many of these carcasses were catego-
stranding effort distribution, and human population rized as being in a state of advanced decomposition,
proximity to the marine environment. Due to differ- causing difficulty with identifying potential signs of
ences in stranding response effort across the AK human interaction and carcass examination to deter-
Region, the sample size for the western SSL stock mine possible causes of death. Although the present
was relatively low. This did not allow for comparisons study did not analyze oceanographic or atmospheric
between SSL stocks, but did allow for robust compar- data relative to SSL stranding frequencies, it did con-
isons between the 2 regions. sider that stranding occurrences and mortalities were
The distribution of strandings in the NW Region associated with storm surges and El Niño events
did not reflect stranding response effort when con- (Greig et al. 2001, Maniscalco et al. 2008). Prior stud-
sidering the number of stranding stakeholders pres- ies have shown a correlation between El Niño events
ent in Oregon and Washington, which was contrary and a higher number of California sea lion strandings
to the patterns observed in the AK Region. More (Greig et al. 2005), which may not necessarily be the
stakeholders were present in Washington, yet nearly same effects found in the Pacific Northwest. Fritz &
68% of the NW Region’s stranding reports occurred Hinckley (2006) examined data and found little sup-186 Endang Species Res 38: 177–188, 2019
port for the hypotheses that the shift in prey was Region and gunshot in the NW Region. Other studies
responsible for the decline in the western population have indicated that the most common cause of seri-
of SSL. A weak El Niño did occur during the time ous injuries for the eastern and western SSL stocks in
period of increased SSL strandings (2006−2007), but Alaska, Oregon, and Washington waters was some
likely had little effect on food availability considering type of fishery interaction, including entanglement in
it was a weak event. Therefore, the cause of the in- marine debris and injuries related to ingestion of var-
crease in stranding events remains unknown. Fur- ious fishing gear (Helker et al. 2017). One notable
thermore, during the moderate El Niño period from finding from our study was that 40% of the cases had
2009−2010, there was no apparent increase in mean gunshot wounds in 2015, and a high proportion
number of annual SSL strandings, suggesting weak (88%) of them occurred during the summer and
and moderate El Niño events have little influence on spring months in one particular area. These cases
SSL strandings observed in these data sets. Future were not part of a unique survey, and likely repre-
research on other oceanographic and atmospheric sent an ongoing problem for this species that is
anomalies that may have contributed to the temporal under-reported, especially considering that pinni-
trend observed here is encouraged. peds with gunshot wounds reported to NMFS Alaska
Additional temporal analyses indicated clear sea- Regional Stranding Network are assumed to be
sonal patterns, with higher strandings occurring dur- struck and lost animals associated with an Alaska
ing summer (June−August) across both regions. Native subsistence hunt unless there is evidence
These findings are consistent with Lee (2016), who indicating the animal was unlawfully shot (Helker et
also identified that the highest number of SSL strand- al. 2017). More detailed reports were obtained from
ings occurred in July and August for 2006−2014 in the Alaska Department of Fish & Game (ADF&G)
the Pacific Northwest. In the present study, the pro- and revealed 7 of the 11 cases to be considered part
portion of strandings in spring and summer was sig- of a group event that occurred in Cordova, near the
nificantly higher in the AK Region versus the NW Copper River commercial salmon drift gillnet fishery.
Region, suggesting region, or latitude, may account Five of these cases were males, 4 were identified as
for the observed seasonal variation. If we consider adults, and 3 as juvenile/sub-adults. In that same
the expansive coastlines in Alaska and lower ability year, a climate anomaly was documented, also known
to have coverage year-round in comparison to Wash- as the marine heatwave (Bond et al. 2015, Di Lorenzo
ington and Oregon, we would expect a higher num- & Mantua 2016). This has been identified as a caus-
ber of strandings to be reported in Alaska in the ative agent of a major shift in the forage food base
spring and summer. In the NW Region, milder cli- and subsequent changes in prey availability and dis-
mates and higher, more equally distributed human tribution (NMFS unpubl. data), which may have af-
populations inhabiting coastal areas allow for more fected SSL behavior and resulted in increased num-
consistent stranding effort to occur, during 3 seasons bers of SSL targeting fishing nets.
(spring, summer, fall) or year-round.
4.4. Continued utilization of the stranding
4.3. Signs of human interaction database and implications for conservation
Signs of human interaction were not determined Although the eastern SSL stock was recently de-
for a substantial percentage of cases in both regions listed, the present study provides information about
due to carcass condition. This is likely a direct result some threats and encourages future post-delisting
of the condition many of these carcasses were in monitoring through the stranding network. The use
upon initial examination, making it difficult to ob- of the NW Region and AK Region stranding data
serve signs of human interaction. Across the entire allows us to investigate and illustrate patterns in SSL
25 yr time period of the study, a large proportion of stranding trends to better understand how character-
human interaction cases (i.e. 81%) were identified istics of stranding incidents may change over space
between 2008 and 2015 in both regions. It is difficult and time, and how stranding response efforts may
to ascertain reasons for this increase in reporting directly affect these changes. This may have implica-
other than it being a result of increased effort and tions for managers when assessing the costs and ben-
public awareness. In stranding cases where human efits of mitigating documented anthropogenic haz-
interaction was identified, fishery interaction was the ards to endangered species populations (Chaloupka
most common human interaction type in the AK et al. 2008).Esquible & Atkinson: Stranding trends in Steller sea lions 187
Level A stranding reports were not designed to surveillance programs, improve and standardize
elucidate cause-specific mortality trends. The degree data collection and reporting processes, and increase
of confirmed biometric data included in our study is the amount of post-mortem examinations. With im-
associated with varying levels of uncertainty. The proved surveillance and quality of stranding data,
inability to distinguish between cases associated researchers can better understand both short- and
with low, moderate, or high levels of effort across long-term factors affecting SSL mortality.
time and space prevents us from making strong con-
clusions about these data. When considering the Acknowledgements. Many thanks to Kate Savage and Ale-
large amount of funding given to stranding networks, ria Jensen with the AK Region Stranding Network and
the need for refinement and standardization of data Kristin Wilkinson with the NW Region Stranding Network
collection is recommended to reduce biases. Studies for providing the data utilized in this study; Alaska Depart-
ment of Fish & Game staff Mandy Keogh, Lauri Jemison,
such as ours would benefit from stranding networks
and Michael Rehberg for their assistance in obtaining
organizing the data to account for annual effort and reports; our undergraduate mentee Cole Deal who assisted
consistent reporting templates for data to minimize with organization of the data and construction of the maps;
uncertainty. Ben Staton and Amy Bishop for providing assistance with
As revealed in other studies, an apparent increase statistical analyses; Kathy Burek-Huntington, Keith Cox,
and Sherry Tamone for on-going support and guidance; and
in strandings and subsequent reporting may be Angie Kameroff-Steeves for help with manuscript prepara-
directly linked to increased observational effort, and tion. Rasmuson Fisheries Research Center provided support
not an accurate representation of a true increase in for this project.
strandings (Berrow & Rogan 1997, Evans et al. 2005,
Danil et al. 2010). In order to make any definitive, LITERATURE CITED
conclusive statements in regards to Level A strand-
ing data, we must have a better measurement of Allen BM, Angliss RP (2013) Alaska marine mammal stock
effort. Supplementary reports produced from post- assessments, 2013. NOAA Tech Memo NMFSAFSC- 277
Atkinson S, DeMaster DP, Calkins DG (2008) Anthropogenic
mortem examinations are of great value when at- causes of the western Steller sea lion Eumetopias jubatus
tempting to identify cause-specific trends. However, population declines and their threat to recovery. Mam-
necropsies were performed in only 26% of the cases mal Rev 38:1−18
in the present study, despite the Endangered Species Berrow S, Rogan E (1997) Review of cetaceans stranded on
the Irish coast, 1901–95. Mammal Rev 27:51−56
Act (ESA) listing. We recognize that this can prove to Bond NA, Cronin MF, Freeland H, Mantua N (2015) Causes
be very difficult in view of the vast size of Alaska and and impacts of the 2014 warm anomaly in the NE Pacific.
the small human population in many parts of the Geophys Res Lett 42:3414−3420
state, and appreciate the role limited funding may Bossart GD (2011) Marine mammals as sentinel species for
oceans and human health. Vet Pathol 48:676−690
play.
Burek KA, Gulland FMD, Sheffield G, Keyes E and others
For the purpose of conservation efforts and the (2005) Disease agents in Steller sea lions in Alaska: a
desire to utilize stranding data to inform manage- review and analysis of serology data from 1975-2000.
ment of SSL, we have a few specific recommenda- J Wildl Dis 41:512−524
tions. We stress the need for increased stakeholders Calkins D, Pitcher K (1979) Population assessment, ecology
and trophic relationships of Steller sea lions in the Gulf of
in western Alaska. This would allow for minimization Alaska. Alaska Department of Fish and Game, Division
of bias when analyzing temporal and spatial trends in of Game, Anchorage, AK
SSL strandings. The western SSL stock that inhabits Chaloupka M, Work TM, Balazs GH, Murakawa SKK, Mor-
waters west of Samalga Pass (~170° W) is in a state of ris R (2008) Cause-specific temporal and spatial trends in
green sea turtle strandings in the Hawaiian Archipelago
decline, and reasons for this are not clear (Fritz et al.
(1982–2003). Mar Biol 154:887−898
2013). Annual field efforts should prioritize the col- Clutton-Brock TH, Isvaran K (2007) Sex differences in age in
lection and analysis of stranded SSL across their geo- natural populations of vertebrates. Proc R Soc B Biol Sci
graphic range. Due to the limited human population 274:3097−3104
Colegrove KM, Greig DJ, Gulland MD (2005) Causes of live
west of Samalga Pass, and stranding response in that
strandings of northern elephant seals (Mirounga angu-
area, it is unlikely that stranding data will be inform- stirostris) and Pacific harbor seals (Phoca vitulina) along
ative to management plans without increased sur- the central California coast, 1992–2001. Aquat Mamm
veillance efforts. In contrast, stranding effort in the 31:1−10
NW Region is more uniformly distributed and likely Danil K, Chivers SJ, Henshaw MD, Thieleking JL, Daniels
R, St. Leger JA (2010) Cetacean strandings in San Diego
representative of the eastern SSL stock population County, California, USA: 1851–2008. J Cetacean Res
distribution. Our study has highlighted the need to Manag 11:163−184
support marine mammal stranding monitoring and Di Lorenzo E, Mantua N (2016) Multi-year persistence of the188 Endang Species Res 38: 177–188, 2019
2014/15 North Pacific marine heatwave. Nat Clim Chang Causes and extent of natural mortality among Steller sea
6:1042−1047 lion (Eumetopias jubatus) pups. Aquat Mamm 34:
Evans K, Thresher R, Warneke RM, Bradshaw CJA, Pook M, 277−287
Thiele D, Hindell MA (2005) Periodic variability in Maniscalco JM, Springer AM, Adkison MD, Parker P (2015)
cetacean strandings: links to large-scale climate events. Population trend and elasticities of vital rates for Steller
Biol Lett 1:147−150 sea lions (Eumetopias jubatus) in the eastern Gulf of
Flint J, Flint M, Limpus CJ, Mills PC (2015) Trends in marine Alaska: a new life-history analysis. PLOS ONE 10:
turtle strandings along the east Queensland, Australia e0140982
coast, between 1996 and 2013. J Mar Biol 2015:848923 Miller AJ, Trites AW, Maschner HDG (2005) Ocean climate
Fritz LW, Hinckley S (2006) A critical review of the regime changes and the Steller sea lion decline. Antarct J US 19:
shift — ‘junk food’ — nutritional stress hypothesis for the 54−63
decline of the western stock of Steller sea lion. Mar National Research Council (2003) The decline of the Steller
Mamm Sci 21:476−518 sea lion in Alaskan waters: untangling food webs and
Fritz LW, Sweeney KS, Johnson DS, Lynn M, Gilpatrick J fishing nets. The National Academies Press, Washington,
(2013) Aerial, ship, and land-based surveys of Steller sea DC
lions (Eumetopias jubatus) in Alaska, June and July NMFS (National Marine Fisheries Service) (2008) Recovery
2008–2012. NOAA Tech Memo NMFS-AFSC-251 plan for the Steller sea lion: eastern and western distinct
Fritz LW, Towell R, Gelatt TS, Johnson DS, Loughlin TR population segments. https://alaskafisheries.noaa.gov/
(2014) Recent increases in survival of western Steller sea sites/default/files/sslrpfinalrev030408.pdf (accessed 24
lions in Alaska and implications for recovery. Endang March 2019)
Species Res 26:13−24 NOAA (2016) Research in the California Current. https://
Geraci JR, Lounsbury VJ (2005) Marine mammals ashore: a swfsc.noaa.gov/textblock.aspx?id=1051 (accessed 24
field guide for strandings, 2nd edn. National Aquarium March 2019)
in Baltimore, Baltimore, MD NOAA (2017) Examiners Guide. https://www.fisheries.
Greig AB, Secchi ER, Zerbini AN, Dalla RL (2001) Stranding noaa.gov/national/marine-mammal-protection/level-data-
events of southern right whales, Eubalaena australis, in collection-marine-mammal-stranding-events (accessed
southern Brazil. J Cetacean Res Manag (Spec Issue) 2: 24 March 2019)
157−160 NOAA (2019) Marine Mammal Health and Stranding Res
Greig DJ, Gulland FMD, Kreuder C (2005) A decade of live ponse Program. https://www.fisheries.noaa.gov/national/
California sea lion (Zalophus californianus) strandings marine-life-distress/marine-mammal-health-and-strand
along the central California coast: causes and trends, ing-response-program (accessed 24 March 2019)
1991-2000. Aquat Mamm 31:11−22 Norman S, Huggins J, Carpenter TE, Case JT, Lambourn
Helker VT, Muto MM, Savage K, Teerlink S, Jemison LA, DM, Rice J (2012) The application of GIS and spatiotem-
Wilkinson K, Jannot J (2017) Human-caused mortality poral analyses to investigations of unusual marine mam-
and injury of the NMFS-managed Alaska marine mam- mal strandings and mortality events. Mar Mamm Sci 28:
mal stocks, 2011-2015. NOAA Tech Memo NMFS- E251−E266
AFSC-354 Peltier H, Jepson PD, Dabin W, Deaville R, Daniel P, Van
Hennen D (2006) Associations between the Alaska Steller Canneyt O, Ridoux V (2014) The contribution of strand-
sea lion decline and commercial fisheries. Ecol Appl 16: ing data to monitoring and conservation strategies for
704−717 cetaceans: developing spatially explicit mortality indica-
Hogg J, Forbes S (1997) Mating in bighorn sheep: frequent tors for common dolphins (Delphinus delphis) in the east-
male reproduction via a high-risk ‘unconventional’ tac- ern North-Atlantic. Ecol Indic 39:203−214
tic. Behav Ecol Sociobiol 41:33−48 Pitcher KW, Olesiuk PF, Brown RF, Lowry MS and others
Holmes EE, Fritz LW, York AE, Sweeney K (2007) Age-struc- (2007) Status and trends in abundance and distribution
tured modeling reveals long-term declines in the natality of the eastern Steller sea lion (Eumetopias jubatus) pop-
of western Steller sea lions. Ecol Appl 17:2214−2232 ulation. Fish Bull 107:102−115
Lee K (2016) Stranding mortality patterns in California sea R Core Team (2018) R: a language and environment for sta-
lions and Steller sea lions in Oregon and southern Wash- tistical computing. R Foundation for Statistical Comput-
ington, 2006 to 2014. MSc thesis, Portland State Univer- ing, Vienna
sity, Portland, OR Raum-Suryan KL, Pitcher KW, Calkins DG, Sease JL,
Loughlin TR (1998) The Steller sea lion: a declining species. Loughlin TR (2002) Dispersal, rookery fidelity and meta-
Biosph Conserv 1:91−98 population structure of Steller sea lions (Eumetopias
Loughlin TR, York AE (2000) An accounting of the sources of jubatus) in an increasing and a decreasing population in
Steller sea lion mortality. Mar Fish Rev 62:40−45 Alaska. Mar Mamm Sci 18:746−764
MacLeod CD, Pierce GJ, Santos MB (2004) Geographic and Shuert C, Mellish J, Horning M (2015) Physiological predic-
temporal variations in strandings of beaked whales tors of long-term survival in juvenile Steller sea lions
(Ziphiidae) on the coasts of the UK and the Republic of (Eumetopias jubatus). Conserv Physiol 3:cov043
Ireland from 1800-2002. J Cetacean Res Manag 6:79−86 Trites AE, Donnelly CP (2003) The decline of Steller sea
Maldini D, Mazzuca L, Atkinson S (2005) Odontocete lions in Alaska: a review of the nutritional stress hypoth-
stranding patterns in the main Hawaiian islands (1937– esis. Mammal Rev 33:3−28
2002): How do they compare with live animal surveys? Womble JN, Sigler MF, Willson MF (2009) Linking seasonal
Pac Sci 59:55−67 distribution patterns with prey availability in a central-
Maniscalco JM, Calkins DG, Parker P, Atkinson S (2008) place forager, the Steller sea lion. J Biogeogr 36:439−451
Editorial responsibility: Brendan Godley, Submitted: October 18, 2017; Accepted: January 26, 2019
University of Exeter, Cornwall Campus, UK Proofs received from author(s): March 26, 2019You can also read