Exploring Bebras Tasks Content and Performance: A Multinational Study - Mii
←
→
Page content transcription
If your browser does not render page correctly, please read the page content below
Informatics in Education, 2017, Vol. 16, No. 1, 39–59                                           39
© 2017 Vilnius University
DOI: 10.15388/infedu.2017.03

Exploring Bebras Tasks Content and Performance:
A Multinational Study

Cruz IZU1, Claudio MIROLO2, Amber SETTLE3
Linda MANNILA4, Gabrielė STUPURIENĖ5
1
  The University of Adelaide, Adelaide, Australia
2
  University of Udine, Udine, Italy
3
  DePaul University, Chicago, USA
4
  Linköping University, Linköping, Sweden
5
  Institute of Mathematics and Informatics, Vilnius University, Vilnius, Lithuania
e-mail: cruz@cs.adelaide.edu.au, claudio.mirolo@uniud.it, asettle@cdm.depaul.edu,
linda.mannila@liu.se, gabriele.stupuriene@mii.vu.lt

Received: October 2016

Abstract. Although there is no universal agreement that students should learn programming,
many countries have reached a consensus on the need to expose K-12 students to Computational
Thinking (CT). When, what and how to teach CT in schools are open questions and we attempt to
address them by examining how well students around the world solved problems in recent Bebras
challenges. We collected and analyzed performance data on Bebras tasks from 115,400 students
in grades 3–12 in seven countries. Our study provides further insight into a range of questions ad-
dressed in smaller-scale inquiries, in particular about the possible impact of schools systems and
gender on students’ success rate.
    In addition to analyzing performance data of a large population, we have classified the con-
sidered tasks in terms of CT categories, which should account for the learning implications of the
challenge. Algorithms and data representation dominate the challenge, accounting for 75–90% of
the tasks, while other categories such as abstraction, parallelization and problem decomposition
are sometimes represented by one or two questions at various age groups. This classification can
be a starting point for using online Bebras tasks to support the effective learning of CT concepts
in the classroom.
Keywords: computational thinking, Bebras challenge, task difficulty, gender issues.

1. Introduction

Regardless of the variety of approaches, there seems to be “a convergence towards com-
putational thinking as a core idea of the K-12 curricula” (Hubwieser et al., 2014). The
term computational thinking (CT) was coined by Papert (Papert, 1980) but gained in-
creased attention beginning in the 2000s after Wing published her seminal article posi-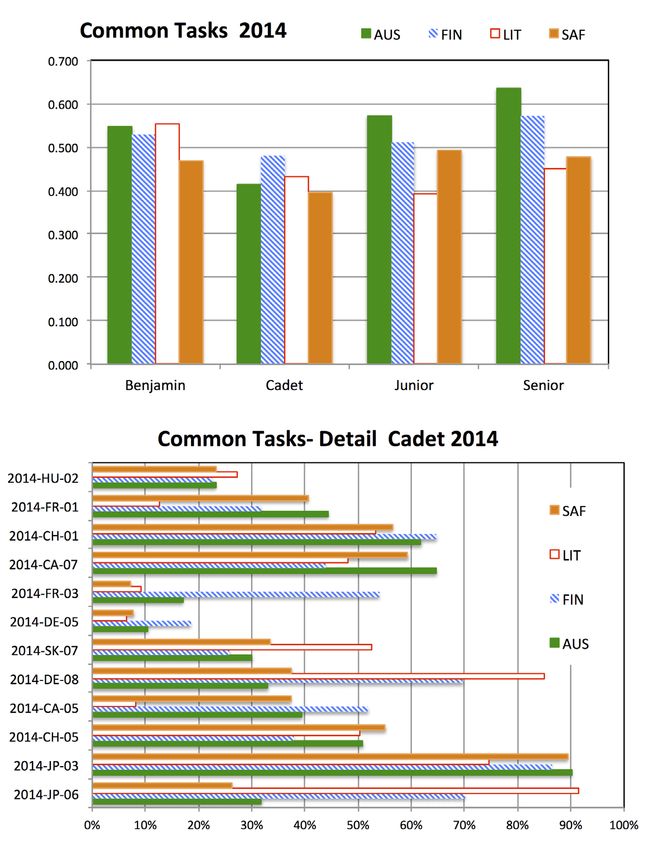
40                                                 C. Izu et al.

tioning CT as a “universally applicable attitude and skill set everyone, not just computer
scientists, would be eager to learn and use” (Wing, 2006). Since then, many countries
have introduced in their school curricula CT or other computer science topics, includ-
ing programming (McCartney and Tenenberg, Eds., 2014, Barendsen and Steenvoorden,
2016, Sentance et al., 2013, Tort and Drot-Delange, 2013, Barendsen et al., 2016, Heintz
et al., 2016).
     CT is meant to encompass a set of concepts and thought processes that aid in ap-
proaching problems arising in different fields in a way that could involve computers
(Mannila et al., 2014). However, the concepts central to CT can be quite foreign to
many K-12 teachers. Thus, among other challenges, it is important to get both teach-
ers and students engaged by developing learning materials that can provide a positive
first experience. A compelling example of this kind of material is provided by the Be-
bras community, which annually arranges an international problem-solving challenge
aimed at children and youth aged 8–18 (Dagienė and Sentance, 2016, Bezáková and
Winczer, 2011). The challenge includes motivating and age-adapted tasks relating to,
for instance, programming and algorithms, computational thinking and information
technology. Moreover, it does not require any background in these areas. All material
from past challenges are available online freely for anyone to use, and each task in-
cludes specific information not only on the correct answer, but also on the connection
to computer science topics.
     A working group at the ITiCSE 2015 conference started an exploratory investiga-
tion of the “task based assessment” approach of the Bebras challenge within the broader
framework of K-9 computer science education, which encompassed the development
of national curricula and guidelines as well as teachers’ attitudes toward their practice
in this field (Barendsen et al., 2015). In particular, their final report proposed a clas-
sification of the conceptual content and question structure of Bebras tasks from years
2010–2014 according to CT categories. Algorithms and data representation were found
to be the main concept categories in the K-9 context. Moreover, a taxonomy for ques-
tions related to algorithms was outlined.
     In this study, we have analyzed in terms of concept coverage, presumed1 and actual
performance a selection of Bebras tasks for seven countries based on data collected in
2014 and 2015. Given that many countries are in the process of updating their curricula,
it is likely that the Bebras challenge was one of the first opportunities for students in
those countries to be exposed to CT.
     The study extends previous work on Bebras tasks (see subsection 2.2) by answering
the following research questions based on large multinational cohorts:
     ●● Which CT concepts and skills are addressed by Bebras tasks?
     ●● Is estimated task difficulty related to the CT conceptual content? how well does
        the estimated difficulty match the observed students’ performance?
     ●● Is gender a significant factor in performance for any country or age group?
   The first question is important in order to explore the implications of CT conceptual
content both in terms of curricular coverage and cognitive demand. The aim of the sec-

 1
     According to the difficulty level assigned by the task proponents.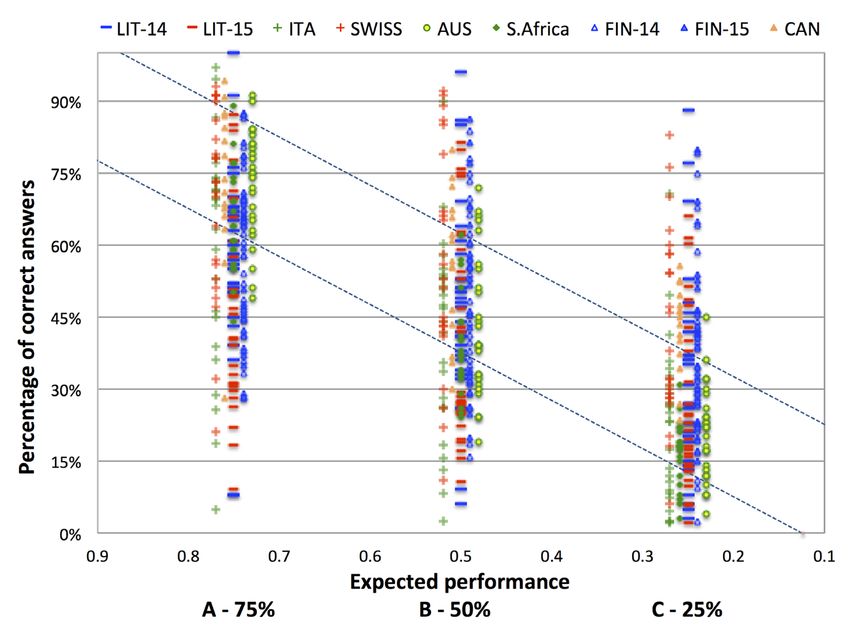
Exploring Bebras Tasks Content and Performance: A Multinational Study        41

ond question is to identify whether some concepts and tasks appear to be more difficult
for student and hence might need more scaffolding when introduced at school. Finally,
the third question is important in order to contribute to the knowledge and discussion on
raising girls’ interest in computer science. All in all, addressing these research questions
will reveal to what extent Bebras tasks match the need for suitable CT teaching material
in K-12 education.
    By analyzing performance data of a large population and from rather different con-
texts, our study provides further insight into a range of questions recently addressed in
smaller-scale inquiries, in particular about the possible impact of schools systems and
gender on learning CT concepts. Distinctive characters of our present work are indeed
the cohort size, amounting to 115,400 students in grades 3–12, as well as the variety of
educational contexts in the seven countries that have been considered. In addition, the
paper represents one of the first attempts to explore the implications of the overall con-
ceptual content of Bebras tasks within a CT-related framework.
    The rest of the paper is organized as follows: we first introduce the Bebras challenge
and review previous work studies relevant for the present analysis. Then we describe the
set of data collected, and analyze them both qualitatively and quantitatively in terms the
concept coverage, performance and difficulty level of a selection of the tasks. Finally, we
end with some conclusions and recommendations.

2. Background

2.1. The Bebras Challenge

The Bebras challenge2 is an online competition that was introduced in 2004 in Lithuania
as an outreach instrument, to encourage interest and motivation in computing-related
topics (Dagienė, 2006). Since then, it has spread worldwide reaching 1.3 million of pu-
pils from 38 countries in the autumn 2015’s challenge and more than 1.5 million from
30 countries in the 2016’s challenge.
    Bebras tasks are short and answerable in a few minutes through a computerized in-
terface. The task set is created on a yearly basis through crowd-sourcing from participat-
ing countries, which are then further reviewed and polished during an annual workshop
(Dagienė and Stupurienė, 2016). Most of the tasks we have analyzed are either multi-
choice or interactive. Multi-choice tasks have four nontrivial and well-defined answer
choices with only one correct solution. Interactive tasks provide a scene or diagram on
the screen that participants can interact with to carry out actions and change the scene’s
state to move towards the question’s goal; this interaction may provide feedback on the
status of the task.
    The challenge is arranged annually in their local languages throughout the world.
Most countries run their event on Bebras Week, which falls on the second full week of
November (southern hemisphere countries may use a different week).

 2
     http://www.bebras.org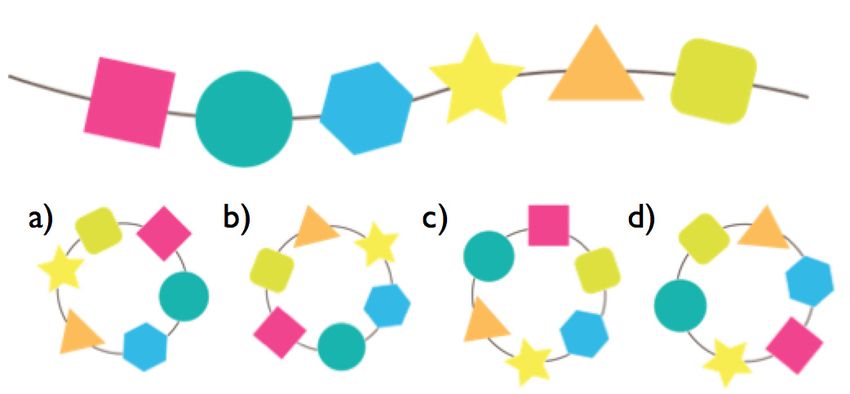
42                                               C. Izu et al.

    Participants are divided into age groups: Mini (grades 3–4); Benjamin (grades 5–6);
Cadet (grades 7–8); Junior (grades 9–10); Senior (grades 11–12). The grades corre-
sponding to the age groups may differ slightly between countries based on their local
curricula3. Each age group attempts 15 (9 for Mini) to 18 tasks within 45–55 minutes.
They will have the same number of tasks, usually 5 or 6 tasks, at each difficulty level: A
(easy), B (medium) and C (hard) as prescribed by developers. The participants are usu-
ally supervised by teachers who may integrate the challenge in their teaching activities.

2.2. Related Work

The popularity of the Bebras’ initiative provides the opportunity to evaluate its results
in a variety of contexts; this also prompted discussions about the possible implications
for K-12 computer science education. There is already quite an extensive review of
work related to the Bebras challenge (Dagienė and Stupurienė, 2016). Therefore, in this
subsection we will focus on the contributions addressing tasks’ scope and difficulty. We
also discuss previous work done on CT classification since such work is relevant to the
qualitative analysis of the Bebras tasks discussed later in the paper.
    Besides their outreach potential (Haberman et al., 2011, Bell et al., 2011), Bebras
tasks can be incorporated in the curriculum (Dagienė and Sentance, 2016) or used as an
instrument to support teachers’ training in computing subjects (Bezáková and Winczer,
2011), as well as to engage students with CT in connection with their informal training
for the contest. Gujberova and Kalas present an example of this perspective in order
to introduce “modern Informatics as opposed to ICT classes” in K-12 education (Guj-
berova and Kalas, 2013). It is especially from this standpoint that the Bebras challenge
is an interesting topic of study.
    As discussed in (Kalelioglu et al., 2016), there are a wide range of papers in recent
years that cover the definitions and classification of Computational Thinking. A key
source of classification for CT problems is the Computer Science Teachers Association4
(CSTA), which has published in cooperation with the ISTE5 a “Computational Thinking
Across the Curriculum” table introducing their list of CT categories. In fact, we followed
the CT characterization proposed in previous work (Barendsen et al., 2015), which is
inspired by these CSTA/ISTE categories: data collection, data analysis, data represen-
tation, problem decomposition, abstraction, algorithms & procedures, automation, par-
allelization and simulation. The detailed definitions and operational characterization that
were used for the qualitative analysis are provided in Table 1.
    Bebras tasks are becoming a popular tool to assess computer science competences at
various levels of school instruction (Duncan and Bell, 2015), to the point that Hubwi-
eser and Mühling are envisaging a possible future role in PISA-like assessment of such

 3
     In particular, South Africa uses also a different labeling of age groups, which we mapped as follows in
     order to have a one-to-one correspondence: Junior (grade 7) ! Benjamin, Intermediate (8–9) ! Cadet,
     Senior (10–11) ! Junior and Elite (12) ! Senior. Other countries not considered in this study have opted
     for different arrangements and/or larger sets of tasks.
 4
     http://www.csteachers.org
 5
     https://www.iste.org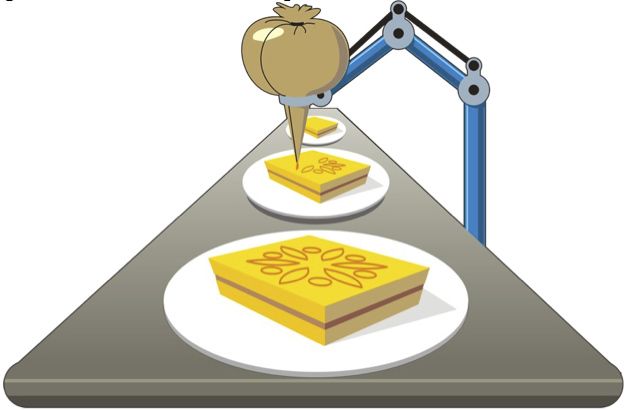
Exploring Bebras Tasks Content and Performance: A Multinational Study                          43

                                                    Table 1
                        CT definitions from previous work (Barendsen et al., 2015)

CT category        Definition                       Operational definition

Data collection    The process of gathering app-    Find a data source for a problem area.
                   ropriate information.
Data analysis      Making sense of data, fin-       Take data and transform it to solve a problem. Often there
                   ding patterns, and drawing       is some statistical analysis involved in the transformation,
                   conclusions.                     although the statistics do not have to be sophisticated.
Data               Depicting and organizing data    Take data and put it into a specified format. Includes
representation     in appropriate graphs, charts,   descriptions of data that involve particular structures. It
                   words, or images.                may involve understanding the implications of graphs or
                                                    other representations on the solution of a problem.
Problem            Breaking down tasks into         Breaking a problem or task into smaller pieces to enable an
decomposition      smaller, manageable parts.       easier or better solution.
Abstraction        Reducing complexity to de-       Problems that ask for the creation of a formula. The
                   fine main idea.                  distillation of broader ideas out of narrower concepts.
                                                    Finding rules that apply to a given problem. Finding a
                                                    pattern to model some behavior. Identifying essential facts
                                                    about a structure or problem to verify correct answers.
Algorithms &       Series of ordered steps taken    Solving maximization, minimization, or other optimization
procedures         to solve a problem or achieve    problems. Following a step-by-step procedure. Verifying
                   some end.                        potential solutions as valid or invalid. Encoding or
                                                    encryption/decryption problems, including the application
                                                    of an encryption scheme to a sample set of data. Debugging
                                                    solutions and finding errors in a solution. Applying a set of
                                                    rules to determine specific values. Choosing or verifying
                                                    pseudocode or code.
Automation         Having computers or ma-          No instances found.
                   chines do repetitive or tedious
                   tasks.
Parallelization    Organize resources to simul- Scheduling problems.
                   taneously carry out tasks to
                   reach a common goal.
Simulation         Representation of a model Tasks that are interactive and involved building and
                   of a process. Simulation also exploring a solution.
                   involves running experiments
                   using models.

competences (Hubwieser and Mühling, 2014). However, multiple studies have identified
the apparent discrepancy between a task’s estimated and perceived difficulty as a major
concern. Yagunova and colleagues found a correlation between length of statement and
difficulty for primary school students, and proposed using an “a posteriori task difficulty
to compensate for differences” (Yagunova et al., 2015). Other researchers investigated
the psychometric factors which influence success (Hubwieser and Mühling, 2015), ex-
plored how to reliably predict task difficulty (van der Vegt, 2013), and developed statisti-
cal models for this purpose (Bellettini et al., 2015).
    By exploring the performance of three European countries, Dagienė et al. (Dagienė
et al., 2014) found that the ability to solve tasks was largely independent of the school
system, and that often supposedly easy tasks turned out to be harder than expected to the
lower age categories.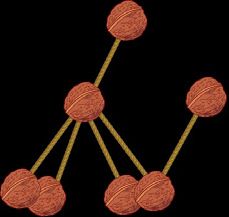
44                                          C. Izu et al.

    Bebras performance has also been analyzed from a gender perspective, but the find-
ings appear to be still inconclusive. On the one hand, Dagienė and colleagues were not
able to uncover any significant difference in overall performance (Dagienė et al., 2014),
although a study of the 2014 Lithuanian contest showed that boys outperformed girls
in specific tasks requiring spatial reasoning and were more likely to guess an uncertain
answer than girls (Dagienė et al., 2015). On the other hand, an investigation of a large
cohort taking part in the 2014 German challenge revealed that boys of all age groups
performed appreciably better compared to girls, the gap increasing strikingly for the
eldest students (Hubwieser et al., 2016).

3. Methodology

3.1. Data Collection

Bebras contest data are stored on local servers and initially we had access to anonymized
data from four countries (Italy, Australia, Finland, and Lithuania); we also received re-
sults (percentage of correct answers per age group and gender) from South Africa, Swit-
zerland and Canada.
    The list of countries and their participation numbers are listed in Table 2. Finland
(FIN), Lithuania (LIT) and Canada (CAN) provided data for both years. Australia
(AUS) and South Africa (SAf) ran their challenges in early 2015, but they are listed in
2014 as they used 2014 tasks. Switzerland (SW) and Italy (ITA) provided data for their

                                             Table 2
                  Participation data for 2014 and 2015, covering 115,400 students

      2014        AUS          FIN            LIT           SAf           CAN       Total

      Mini        1837          585            2409             –            –       9,589
      Benjamin    2350          675            7167          1558            –      10,571
      Cadet       2568         1322            5988          3059            –      13,214
      Junior      1344         2140            6265          2602         4558      13,791
      Senior       526          128            3147           999            –       4,062

                  8625         4850           24976          8218         4558      51,227

      2015        ITA          FIN            LIT           SW            CAN       Total

      Mini        1648          702            2374          1026            –      10,486
      Benjamin     904         2527            7110          1947            –      11,188
      Cadet       1622         1425            5810          4905         4638      18,704
      Junior      2083         3735            6114          4124         5713      18,959
      Senior       287         1207            3304          1411            –       5,279

                  6544         9596           24712         13413         9908      64,173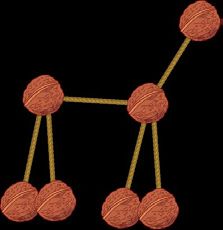
Exploring Bebras Tasks Content and Performance: A Multinational Study                        45

2015 challenges6. Thus, we have results from a total of 115,400 students from seven
different countries.
    There is a large Bebras task pool for each given year, out of which each country se-
lects their own local subset (usually 15 questions, 18 for Lithuania) for each age group.
Some countries use smaller sets, 9 to 12 questions, for the Mini age-group. The collec-
tion of Bebras tasks used in 2014–15 by the countries listed in Table 2 had 145 different
tasks, of which 88 were used by 2 or more countries.

3.2. Qualitative Analysis

In order to address the research questions presented in section 1, we needed to look at the
data from both a qualitative and a quantitative perspective. As mentioned above (subsec-
tion 2.2), we based our CT classification on a framework developed in the previous work
(Barendsen et al., 2015), summarized in Table 1.
    The qualitative study was done through content analysis, see e.g. (Cohen et al., 2013,
Gavora, 2015), in which either two or three of the authors independently went through
all selected tasks and assigned each task one or more of the CT categories summarized in
Table 1. The authors agreed on the majority of assigned categories; in cases of disagree-
ment, one of the authors gave a suggestion for how to resolve the situation, which could
then be accepted or countered with another suggestion by the other authors.
    After three revisions and related discussion about the most appropriate characteriza-
tion of the tasks assigned in 2014 and 2015 (in the considered countries), an inter-rater
agreement of 90.2% was attained. A final decision was made by one of the co-authors
chosen by the others to review and arbitrate disagreements between the rest. None of the
resulting classifications were disputed by the group as a whole. We may also notice that
our classification is not always in agreement with the proponents’ intentions, as attested by
the section “it’s informatics” in the task documentation7. More specifically, full agreement
between both raters and proponents is attained for about 59% of the tasks, whereas there is
a complete mismatch in 4% of the cases and some substantial difference in further 7%.
    Next, we provide specific examples of the classification to illustrate both the process
and the way that the CT categories were instantiated in the Bebras tasks.
    Exercise 2015-MY-018 shows a broken bracelet made out of six colored beads with
different shapes as shown in Fig. 1. The student must pick the corresponding bracelet out
of the four given circular ones.
    This task was classified as data representation (DR). This is because the key to solv-
ing the task is to realize that the circular representation of each of the solutions imposes
conditions regarding which shapes can be located next to each other. Once the impor-
tance of adjacency of shapes is recognized, it is straightforward to verify which option
is the correct one.

 6
     Italy ran the challenge in teams of 3–4, but the table reects the total number of students.
 7
     Actually, the same task may be categorized differently, or with a different emphasis on its informatics/CT
     features, in the documentation provided by organizers from different countries.
 8
     Each task is identified by three data: year, proponent country and progressive number.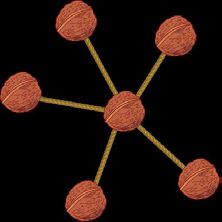
46                                      C. Izu et al.

                                 Fig. 1. Task 2015-MY-01.

    Exercise 2015-LT-03 describes an automated system in a chocolate factory. The
commands that can be given to the decorating robot arm are: Leaf – draws a long oval,
Circle – draws a circle, Rotate k – rotates the sweet clockwise by k degrees, and Repeat
n [...] – repeats the commands in the brackets n times.
    An example is given of a sequence of commands and the drawing it would produce.
Then the drawing in Fig. 2 is provided and the question asks which of the following
command sequences does not cause the robot to draw the indicated flower. The op-
tions are:
    A. Repeat 6 [Rotate 30 Circle Rotate 30 Leaf].
    B. Repeat 6 [Leaf Rotate 60] Rotate 330 Repeat 6 [Circle Rotate 300].
    C. Repeat 6 [Leaf Rotate 60] Repeat 6 [Circle Rotate 60].
    D. Repeat 3 [Rotate 120 Repeat 2 [Leaf Rotate 30 Circle Rotate 150]].
    This task was classified as algorithms & procedures (ALG). The problem has pro-
vided various functions defined for the robot and asks which sequence of function calls
will produce the correct drawing. While the use of procedures might suggest abstraction,
the exercise does not call for the creation of any procedures. Instead, the problem is
asking for interpretation and/or verification of a sequence of commands, something we
classified as algorithms.
    Exercise 2015-CZ-01 provides an example of a Bebras task that was classified into
multiple CT categories. The exercise asks students to match the “walnut animals” in
the two rows of Fig. 3 – i.e., to recognize graph isomorphism. This task was classified
both as data representation (DR) and as abstraction (ABS), the latter because in order
to match isomorphic graphs students are required to think of their structure at a more
abstract level.

                                  Fig. 2. Task 2015-LT-03.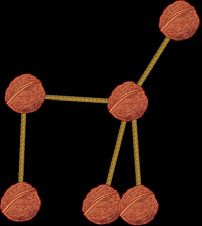
4567

             0";*$7*%"2$-"+1-4+%*&";."5#*"4+65,%*"9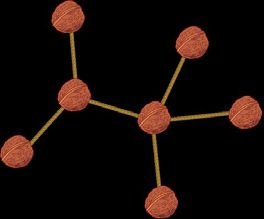
48 C. Izu et al.
are mapped to at least one of the remaining categories reported in Table 1, including
in addition digital literacy, with a slight predominance of abstraction (ABS: 8%) and
simulation (SIM: 7%) due to the usage of interactive tasks. In other words, the Bebras
challenge is mainly focused on algorithmic thinking and data representation.
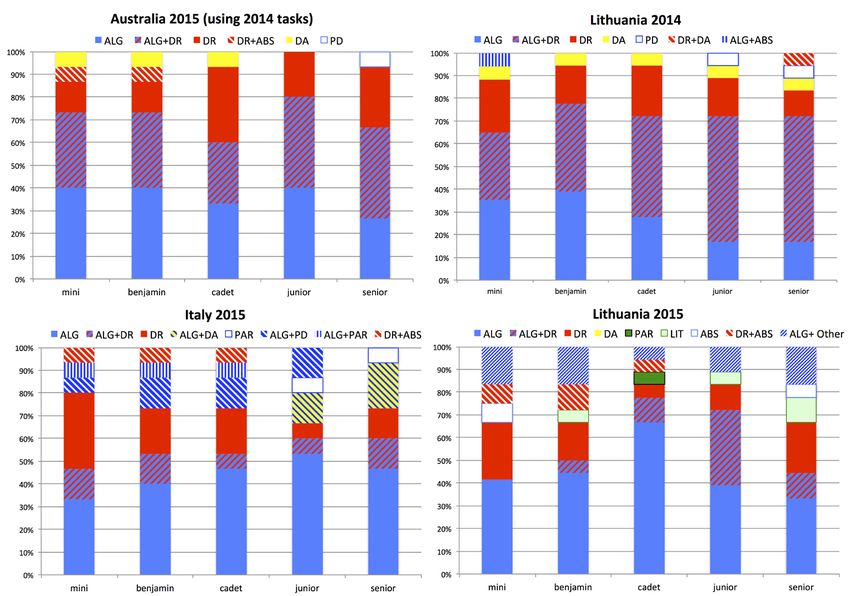
A finer-grained picture of the distribution of CT categories over age groups as well
as over individual challenges is depicted in the Fig. 4 and Fig. 5, which also include the
concepts data analysis (DA), problem decomposition (PD) and parallelization (PAR);
!"#$%&
note there were no instances of data collection (DC) or automation (AUT). From Fig. 4
>56
=56 ?@A@Exploring Bebras Tasks Content and Performance: A Multinational Study 49
we can see that the percentage of tasks classified as ALG varies between 67% (Mini
and Senior) and 81% (Junior), whereas the percentage relative to DR falls in the range
45%–53%, achieving the maximum for Senior. It may also be interesting to observe that
the largest percentage of tasks implying the ABS category (8%) can be found in the Mini
or Benjamin challenges, most often together with DR.
The plots in Fig. 5, on the other hand, show what is the distribution seen by students
in each age group taking a contest in four of the sample countries9. Overall, ALG tasks
(either alone or combined with other categories) represent at least 2/3 of the tasks as-
signed for each age-group in any country, ranging from about 67% (Switzerland 2015)
to more than 93% (Canada 2015). The incidence of different CT categories appears to
depend much more on the year of the task dataset than on the country. As observed in
Fig. 5, the percentage of tasks classified DR (including ALG+DR) dropped by nearly
half from 2014 to 2015, replaced by more ALG tasks and with additional but limited
exposure to tasks from other categories, i.e. ABS, PD and PAR.
Algorithmic tasks. Algorithmic thinking encompasses a diverse range of algorithms,
and as it covers 2/3 of the Bebras tasks, it may be interesting to describe in more detail the
range of questions that belongs to this category. Analyzing the 474 ALG items used in the
42 considered challenges10, we observed the following subtypes and distributions:
●● 9% of the questions require to understand or produce short sequences of com-
mands to achieve some goal; as it may be expected, the bulk of these questions
(82%) were addressed to the Mini and Benjamin age groups.
●● 18% of the tasks ask students to devise less straightforward (program) strategies
or plans, such as those needed to carry out a dichotomic search, to instruct a
“turtle” to draw a shape, or to solve a tower-of-Hanoi puzzle.
●● 12% are either about mastering or combining higher-level (e.g. procedural) be-
havior patterns in a process, 83% of which were addressed to the Cadet, Junior
and Senior age groups.
●● 26% of them require to carry out some combinatorial analysis and/or to figure out
strategies to reduce complexity. Half of them have also been classified as DR: typi-
cal such instances, e.g., ask for an optimal path in a graph according to some given
criteria. 81% of these tasks were again addressed to the last three age groups.
●● Other kinds of task (23% of the items overall) include understanding how data are
coded, tracking the execution of a program based on some form of evolving state,
carrying out accurate deductions.
4.2. Results of Quantitative Analysis
Task difficulty versus success rate. Each age group attempts three sets of (5 or 6) tasks,
ranked in increasing difficulty as A (easy), B (medium) and C (hard). We have consid-
ered the following mapping between a priori rank and success rate: A means around 3/4
9
The others are not shown due to space limitation.
10
Here the same task is counted as many times as there are contests which include it.50 C. Izu et al.
of the class will solve the task correctly, B means 1/2 of the class will solve the task, and
C means only 1/4 of the class will solve the task.
Fig. 6 shows the success rate versus the expected range of success for the easy,
medium and hard questions for each challenge. Ideally, all results should fit inside the
two trend lines plotted in the chart. Points above reflect questions easier than estimated;
points below reflect harder questions. Overall, Fig. 6 seems to indicate that each con-
test has a reasonable mix of questions, although the rank given to several tasks does not
match the observed performance. A detailed analysis of the difficulty of each contest
is provided in Table 3. Ideally, we should have 33% of questions in each actual easy/
Fig. 6. Expected versus real success rate for A/B/C tasks in each dataset.
Table 3
Spread of a-posteriori easy/medium/hard tasks for each challenge (aiming for 33% each),
tasks estimated at the right level, and average success rate per country
Level easy medium hard Rank Avge
Set 0.65 0.65–0.35 0.35 match success
SW 36% 39% 25% 52% 55.8%
ITA 23% 32% 45% 65% 41.2%
FIN-14 23% 49% 28% 45% 47.3%
FIN-15 26% 40% 34% 49% 49.2%
LIT-14 19% 51% 30% 53% 45.1%
LIT-15 15% 31% 54% 40% 38.6%
CAN 38% 51% 11% 53% 57.4%
AUS 28% 29% 43% 72% 45.6%
SAf 15% 38% 47% 68% 40.2%Exploring Bebras Tasks Content and Performance: A Multinational Study 51
medium/hard rank. The Lithuanian challenge in 2015 appears to be the hardest. Of the
84 tasks used among the five age groups, 36 were harder than estimated and 14 were
easier, with only 34 tagged at the right difficulty level. On the other hand, the Australian
has a more balanced distribution with only 16 harder and 5 easier tasks out of the 75
tasks used.
Success rates by country. The top histogram in Fig. 7 show the average success rates
for the common tasks shared between the different challenges using the 2014 tasks. The
point of this graph is not to compare countries, but to put in context the numbers given
in Table 3. The bottom histogram shows the detail for the cadet 2014 contest, which has
12 common tasks for the 4 countries. As seen by that plots, when we look at the Cadet
group, only a few tasks such as 2014-JP-03 (easy) or 2014-DE-05 (hard) can be con-
sidered at the same level for all four countries, while other tasks such as 2014-FR-03
or 2014-JP-06 are hard for some countries and medium or easy for others. Lithuania,
Fig. 7. Average success rate by age groups (top) and task success rate for the
Cadet group (bottom) for the list of common 2014 tasks.52 C. Izu et al.
for some particular reason seems to perform the best in some problems while doing
poorly in others. This variability is also observed in other age groups, both in the 2014
and 2015 challenges.
Task performance by task types. The average performance by CT category for each
age group varied between 40% and 50% with few exceptions. In particular, the success
rate in ALG tasks ranged from 42% (Mini and Junior) to 45% (Cadet); in DR tasks from
42% (Mini) to 50% (Cadet). Overall, DR and DR+ALG tasks turned out to be easier
than purely ALG tasks. The only exception arises with the Mini age group, who showed
significantly lower performance (37%) in the problems assigned to both the ALG and
DR classes, probably due to the cognitive load of mastering procedures and data at the
same time. We also observed low performance for questions requiring data analysis or
simulation, but the number of tasks was very small.
By considering the structure of typical ALG tasks outlined in subsection 4.1, the
tasks requiring to think of a process as a combination of “behavior patterns” turned
out to be the hardest ones, with a success rate around 31% in average. In particular, an
extremely difficult instance was 2015-CH-09. This problem described four simple local
rules to navigate a maze and asked which one of them allowed to escape a given maze. It
was assigned in Italy and resulted in 2.2% (Cadet), 2.3% (Junior) and 4.9% (Senior) suc-
cess rate. Also the questions asking to detail a non trivial plan to achieve a goal appeared
to be rather challenging (36% average success rate), especially for the three younger age
groups. One such example is 2014-FR-03, whose description can be found in subsection
5.3. On the other hand, perhaps not surprisingly, the easiest questions are those asking
for short sequences of commands to achieve a goal (56% average success rate), that were
mostly proposed to Mini and Benjamin students.
Gender participation and impact on success rate. All countries show similar patterns
on gender participation, with a balanced participation at lower levels, Mini to Cadet age
groups, but showing higher participation of boys both in the Junior and in the Senior
level, as shown in Table 411.
Table 4
Gender participation data per country
Set Mini Benjamin Cadet Junior Senior
%F %M %F %M %F %M %F %M %F %M
SW 45 55 46 55 49 51 50 50 36 63
ITA 45 55 44 56 44 56 23 77 21 79
FIN-14 52 47 45 55 48 52 34 66 10 90
FIN-15 51 49 51 49 46 53 41 59 30 70
LIT-14 43 56 46 54 44 56 42 58 30 70
LIT-15 45 55 47 53 44 56 43 57 31 69
CAN – – – – 43 52 38 62 – –
AUS 48 40 48 35 43 40 26 55 15 70
SAf – – 51 46 44 53 26 71 29 68
11
If total is less than 100%, there was a “not reported” option.Exploring Bebras Tasks Content and Performance: A Multinational Study 53
Regarding the impact of gender on success rate, the correlation of performance pat-
terns (% success) of girls vs. boys is high, ranging from 0.935 (SAf) to 0.98 (LIT).
This means that task difficulty levels are essentially the same for both female and male
students. Fig. 8 plots the success rate of female versus male students for each question
(dashed line in the plot corresponds to boys being twice as successful as girls). Most
data points are very close to the diagonal, witnessing similar performance regardless
of gender. However, there are more outliers above than below the diagonal, indicating
a minor advantage for boys in some tasks, a selection of which we will explore later.
This feature is almost unnoticeable for the Mini, Benjamin and Cadet age groups (red
points in the plot), becomes a little more evident for Junior (blue), and emerges clearly
for Senior (green).
Interestingly, by drawing linear interpolations relative to each country and age group
(not shown in the picture), we would notice that on the hardest tasks boys’ performance
tends to be just slightly better than that of girls – whereas the opposite happens for the
easiest questions relative to the Mini-Cadet age groups. This observation appears to be
consistent for all countries.
By comparing the percentages of successful tasks of girls vs. boys, there is a clear
trend of worsening performance of girls relative to!"#$boys from Mini to Senior age. At
*8,
,8;
,8:
,84 +,*-./0.,+
53<
+,*1.23.,+
,89 =3>
)$#$*+% 2?
,-.(+ @A2
,8-
2@B
/@<
,81 53<
+,*1./0.,4 =3>
!"#$%& 2?
,87 @A2
2@B
/@<
,8+
53<
+,*1.56.,7 =3>
'(#$%&
2?
,8*
@A2
2@B
,8,
,8, ,8* ,8+ ,87 ,81 ,8- ,89 ,84 ,8: ,8; *8,
Fig. 8. Task success rate correlation of girls (horizontal axis) vs. boys,
with sample outliers labeled with their relative task code.
%&'()*54 C. Izu et al.
Senior level boys significantly outperform girls in all countries, the difference in average
success rate varying from 3.0% (LIT 2015) to 15.0% (SAf). We observed gender varia-
tions by country as follows:
●● The average success rate is systematically in favor of boys in Canada (from 5.5%
to 7.3%), South Africa (from 0.2% to 15%) and Switzerland (from 0.5% to 6.9%),
whereas in Australia (from –2.3% to 7.7%) the only exception are Cadet.
●● The results are more balanced in Finland and Lithuania, where girls perform bet-
ter than boys in several contests. Apart from Senior, the difference of the average
percentages of successful tasks is usually rather small in these countries, but it
should be noticed that also a deviation of about 1% can be statistically significant
for a large number of participants. For example, this is the case in favor of Cadet
boys for LIT 2015: based on the outcome of Welch’s t-test, the difference (1.0%)
is statistically significant with p-value = 0.020.
5. Discussion
5.1. CT Categories
The categorization outlined in subsection 4.1 covers unevenly the range of CT concepts
in the chosen framework. At first this makes sense in that both algorithms and data
representation are core concepts at introductory level. Moreover, it is not easy to figure
out tasks addressing data collection or automation while meeting the strict constraints
of the challenge. From a pedagogical perspective, however, we should ask what may be
an “ideal coverage” of CT concepts and a balanced approach as to the other key con-
cepts, in particular abstraction and problem decomposition. Abstraction, for instance,
is usually considered more advanced and we may expect, on the one hand, that only a
small percentage of tasks involve it. On the other hand, it is surprising that the majority
of such tasks can be found in the challenges addressed to the youngest age groups, to
whom abstraction should be especially hard. So, perhaps there is room for designing
more tasks implying abstraction – or problem decomposition – at an appropriate level
of difficulty.
Our previous work (Barendsen et al., 2015) categorized the task pool for the 2010–
2014 and found similar dominance of ALG and DR tasks. This paper extends that analy-
sis by looking at individual country selections for each age group and their associated
performance.
5.2. Task Difficulty
When examining the charts in Fig. 7 we can note that, in average, the medium tasks are
targeted around the 50% success for most age groups and countries. Overall, however,
there are fewer easy tasks than intended. On the other hand, although the bulk of hardExploring Bebras Tasks Content and Performance: A Multinational Study 55
tasks have success rates in expected range, this is usually due to the presence of one or
two easy tasks that lift their average for almost all age groups.
Assessing the difficulty of new tasks is a challenging process, and the estimated
ranks exhibited mixed success. Our observations are consistent with previous studies
pinpointing a discrepancy between intended and actual difficulty level, regardless of age
group or country (Bellettini et al., 2015, van der Vegt, 2013).
Note that those appreciable performance differences between countries for some of
the common tasks indicate that an estimation of task difficulty based on CT category
alone will only be effective for some problems, and there are other factors that caused
such variable performance. It is hard to speculate what these factors will be, as if differ-
ences are caused by students background knowledge or familiarity with the context of
the examples, the variations will be more consistent within a given country.
5.3. Gender
The Bebras challenge is equally popular among boys and girls in the early years, while
girls’ participation slowly decreases in relation to that of boys starting around age 12.
This observation is likely related to the fact that “the gender gap in STEM orientations
is largely a process that occurs during the high school years” (Legewie and DiPrete,
2011), but there may be other potential reasons for this change. The overall participa-
tion rate is indeed smaller for Junior and Senior compared to the younger groups. At
the same time, older pupils are more likely to have developed a personal “identity”
and wish to choose the activities to get involved in. In addition, the challenge may
be more commonly delivered in specific STEM courses, where females are underrep-
resented (Justman and Méndez, 2016, Office for Civil Rights & U.S. Department of
Education, 2012).
The graph in Fig. 8 shows that, overall, the difference in performance between boys
and girls was usually small, hence supporting the notion that there is nothing specifi-
cally “male” about computational thinking. On the other hand, our findings are more
in line with the results of the German study discussed in (Hubwieser et al., 2016) than
with the patterns observed by (Dagienė et al., 2014). In Finland and Lithuania the per-
formance of girls vs. boys is fairly balanced, especially for the first three age groups,
but overall the situations where girls outperform boys seem to be more of an exception
than a rule.
When examining the plotted data, we identified a few tasks on which boys performed
definitely better than girls in several countries. Those tasks required spatial skills and
also relied on pupils having an intuitive understanding of binary search, which in its
turn does have spatial implications to make a mental image of what is going on. Gender
differences in spatial ability are well known, and have been investigated both in general
(Linn and Petersen, 1985) and in the specific case of solving Bebras problems (Dagienė
et al., 2015). However, even for some of the tasks requiring spatial abilities, the perfor-
mance of boys were unequivocally better only at the Junior and Senior levels. Here is a
selection of the tasks for which boys performed better than girls:56 C. Izu et al.
The largest relative difference of performance between boys and girls is attained in
2014-CH-07 (about 75% for FIN Senior), a task where students are asked to choose
from a list of four “turtle” programs the only one which does not produce a given draw-
ing – a composition of 5 squares of different size and color. The gender impact is less
extreme but also large in other countries (40% for SAf Senior and just below 30% for
SAf Junior and AUS Senior).
In 2014-FR-03 the student should find a hidden object in a labyrinth by revealing
parts of the labyrinth by clicking in it as few times as possible. The way in which click-
ing the labyrinth reveals it is shown as one starts clicking. The least number of clicks
is the result of using a binary search strategy. (Gender differences: SAf Benjamin 55%,
SAf Cadet: 47%, AUS Mini: 35%, AUS Cadet: 34%, AUS Junior: 42%, LIT Cadet:
31%, LIT Junior: 60%).
In 2015-CH-02 the student should navigate to a given room number by going either
to the left or to the right from the current room number. The goal is to find the correct
room with as few movements as possible. The best result is achieved by using binary
search. (Gender differences: FIN Benjamin: 23%, FIN Cadet: 33%, LIT Benjamin: 26%,
LIT Cadet: 22%, SW Benjamin: 27%).
In 2014-SI-02 the student is given a two-dimensional simple labyrinth in which a
robot should find a given object starting from a given position. The student is to find
out which of four lists of commands written in alien language can take the robot to the
element. (Gender differences: FIN Senior: 41%, SAf: 25–31% in the two oldest age
groups).
6. Conclusions
This paper has thoroughly analyzed the CT content of Bebras tasks assigned in the
2014–2015 challenges as well as the related performance of a large multinational cohort
of students. While trying to answer the third research question introduced in Section 1,
our study has validated some previous observations based on either smaller or less het-
erogeneous samples:
(1) Overall, students from different school systems exhibit comparable CT skills.
(2) A declining performance trend of girls vs. boys can be recognized from primary to
high school level, with boys outperforming girls in all countries at Senior age.
(3) Gender differences relative to all age groups were observed for some tasks related
to spatial skills.
How to reliably estimate the difficulty of new tasks is still an open issue, for which
we need to better understand and characterize the range of algorithmic strategies used
in the challenge, and the factors that caused large task performance variations among
countries. The CT conceptual content, in particular, does not seem to play a major role
in assessing how difficult a task is (second research question). However, the fact that
young students around the world managed to solve many Bebras tasks prior to having
received any instruction on CT reflects their readiness to learn core CT concepts using
everyday examples.Exploring Bebras Tasks Content and Performance: A Multinational Study 57
Our data indicate that the challenge mainly addresses the ALG and DR categories
(first research question). This is to be expected on the lower age groups, but we should
provide Junior and Senior students with a variety of tasks that significantly covers other
CT concepts/skills. Our suggestion to the Bebras community may be to try to take a
broader perspective on CT in the future. Besides, creating an archive of Bebras tasks
which can be searched by CT subcategory may improve the use of the challenge as a tool
to teach CT concepts in the classroom.
References
Barendsen, E., Grgurina, N., Tolboom, J. (October 13–15 2016). A new informatics curriculum for secondary
education in the Netherlands. In: Brodnik, A., Tort, F. (Eds.), Proc. of the 9th International Conference
on Informatics in Schools: Situation, Evolution, and Perspectives, ISSEP 2016. Springer International
Publishing, Cham, pp. 105–117.
Barendsen, E., Mannila, L., Demo, B., Grgurina, N., Izu, C., Mirolo, C., Sentance, S., Settle, A., Stupurienė,
G. (2015). Concepts in K-9 computer science education. In: Proc. of ITiCSE on Working Group Reports.
ITICSE-WGR’15. ACM, pp. 85–116.
Barendsen, E., Steenvoorden, T. (October 13–15 2016). Analyzing conceptual content of international infor-
matics curricula for secondary education. In: Brodnik, A., Tort, F. (Eds.), Proc. of the 9th International
Conference on Informatics in Schools: Situation, Evolution, and Perspectives, ISSEP 2016. Springer Int.
Publishing, Cham, pp. 14–27.
Bell, T., Curzon, P., Cutts, Q., Dagienė, V., Haberman, B. (2011). Overcoming obstacles to CS education by us-
ing non-programming outreach programmes. In: Proc. of the 5th ISSEP Conf. Springer-Verlag, pp. 71–81.
Bellettini, C., Lonati, V., Malchiodi, D., Monga, M., Morpurgo, A., Torelli, M. (2015). How challenging are
Bebras tasks? An IRT analysis based on the performance of Italian students. In: Proc. of ITiCSE ‘15. ACM,
pp. 27–32.
Bezáková, D., Winczer, M. (2011). Teaching theoretical informatics to secondary school informatics teachers.
In: Proc. of the 5th ISSEP Conf. Springer Berlin Heidelberg, pp. 117–128.
Cohen, L., Manion, L., Morrison, K. (2013). Research Methods in Education. London, New York: Rout-
ledge.
Dagienė, V. (2006). Information technology contests – introduction to computer science in a attractive way.
Informatics in Education, 5(1), 37–46.
Dagienė, V., Mannila, L., Poranen, T., Rolandsson, L., Söderhjelm, P. (2014). Students’ performance on pro-
gramming-related tasks in an informatics contest in Finland, Sweden and Lithuania. In: Proc. of ITiCSE’14.
ACM, pp. 153–158.
Dagienė, V., Mannila, L., Poranen, T., Rolandsson, L., Stupurienė, G. (2014). Reasoning on children’s cogni-
tive skills in an informatics contest: Findings and discoveries from Finland, Lithuania, and Sweden. In:
Proc. of the 7th ISSEP Conf. Springer Int. Publishing, pp. 66–77.
Dagienė, V., Pėlikis, L., Stupurienė, G. (2015). Introducing computational thinking through a contest on infor-
matics: Problem-solving and gender issues. Informacijos Mokslai, 73, 43–51.
Dagienė, V., Sentance, S. (October 13–15 2016). It’s Computational thinking! Bebras tasks in the curriculum.
In: Brodnik, A., Tort, F. (Eds.), Proc. of the 9th International Conference on Informatics in Schools: Situa-
tion, Evolution, and Perspectives, ISSEP 2016. Springer Int. Publishing, Cham, pp. 28–39.
Dagienė, V., Stupurienė, G. (2016). Bebras – a sustainable community building model for the concept based
learning of informatics and computational thinking. Informatics in Education, 15(1), 25–44.
Duncan, C., Bell, T. (2015). A pilot computer science and programming course for primary school students. In:
Proc. of WiPSCE ‘15. ACM, pp. 39–48.
Gavora, P. (2015). The state-of-the-art of content analysis. Education Sciences, 1, 6–18.
Gujberova, M., Kalas, I. (2013). Designing productive gradations of tasks in primary programming education.
In: Proc. of the 8th WiPSCE Conf. ACM, pp. 108–117.58 C. Izu et al. Haberman, B., Averbuch, H., Cohen, A., Dagienė, V. (2011). Work in progress – Initiating the Beaver contest on computer science and computer fluency in Israel. In: Proc. of the Frontiers in Education Conference. pp. T1D:1–2. Heintz, F., Mannila, L., Färnqvist, T. (October 2016). A review of models for introducing computational think- ing, computer science and computing in K-12 education. In: Proceedings of the 46th Annual Frontiers in Education, FIE 2016. pp. 1–9. Hubwieser, P., Armoni, M., Giannakos, M.N., Mittermeir, R.T. (2014). Perspectives and Visions of Computer Science Education in Primary and Secondary (K-12) Schools. Transactions on Computing Education, 14(2), 7:1–7:9. Hubwieser, P., Hubwieser, E., Graswald, D. (October 13–15 2016). How to attract the girls: Gender-specific performance and motivation in the Bebras challenge. In: Brodnik, A., Tort, F. (Eds.), Proc. of the 9th International Conference on Informatics in Schools: Situation, Evolution, and Perspectives, ISSEP 2016. Springer Int. Publishing, pp. 40–52. Hubwieser, P., Mühling, A. (2014). Playing PISA with Bebras. In: Proc. of the 9th WiPSCE Conf. ACM, pp. 128–129. Hubwieser, P., Mühling, A. (2015). Investigating the psychometric structure of Bebras contest: Towards mesuring computational thinking skills. In: Proc. of the Int. Conf. on Learning and Teaching in Computing and Engineering. pp. 62–69. Justman, M., Méndez, S.J. (March 2016). Gendered selection of STEM subjects for matriculation. Melbourne Institute of Applied Economic and Social Research – Working Paper No. 10/16. Kalelioglu, F., Glbahar, Y., Kukul, V. (2016). A framework for computational thinking based on a systematic research review. Baltic Journal of Modern Computing, 4(3), 583–596. Legewie, J., DiPrete, T.A. (July 2011). High School Environments, STEM Orientations, and the Gender Gap in Science and Engineering Degrees. Tech. rep., Columbia University Academic Commons. Linn, M.C., Petersen, A.C. (1985). Emergence and characterization of sex differences in spatial ability: A meta-analysis. Child Development, 56(6), 1479–1498. Mannila, L., Dagienė, V., Demo, B., Grgurina, N., Mirolo, C., Rolandsson, L., Settle, A. (2014). Computa- tional thinking in K-9 education. In: Proc. of ITiCSE on Working Group Reports. ITiCSE-WGR’14. ACM, pp. 1–29. McCartney, R., Tenenberg, Eds., J. (June 2014). Trans. on Computing Education – Special Issue on Computing Education in K-12 Schools, 14(2). Office for Civil Rights & U.S. Department of Education (June 2012). Gender Equity in Education – A Data Snapshot. Papert, S. (1980). Mindstorms: Children, Computers, and Powerful Ideas. Basic Books, Inc., New York, NY, USA. Sentance, S., Dorling, M., McNicol, A. (February 26–March 2 2013). Computer science in secondary schools in the UK: Ways to empower teachers. In: Diethelm, I., Mittermeir, R.T. (Eds.), Proc. of the 6th Int. Con- ference on Informatics in Schools: Situation, Evolution, and Perspectives, ISSEP 2013. Springer, Berlin, Heidelberg, pp. 15–30. Tort, F., Drot-Delange, B. (2013). Informatics in the French secondary curricula: Recent moves and perspec- tives. In: Proc. of the 6th ISSEP Conf. Springer, Berlin, Heidelberg, pp. 31–42. van der Vegt, W. (2013). Predicting the difficulty level of a Bebras task. Olympiads in Informatics, 7, 132–139. Wing, J.M. (2006). Computational thinking. Communications of the ACM, 49(3), 33–35. Yagunova, E., Podznyakov, S., Ryzhova, N., Razumovskaia, E., Korovkin, N. (2015). Tasks classification and age differences in task perception: Case study of international on-line competition “Beaver”. In: Proc. of the 8th ISSEP Conf. Univ. of Ljubljana, pp. 33–43.
Exploring Bebras Tasks Content and Performance: A Multinational Study       59

C. Izu is a lecturer in Computer Science at the University of Adelaide. She leads the
outreach program CS4HS which helps middle and high school teachers introduce Com-
puter Science and computational thinking to their classrooms. She has been a curriculum
writer for the new CT subject (Year 11–12) in her state, to be rolled out in 2018. Besides
her regular research in interconnection networks, Cruz is currently exploring the learn-
ing issues of novice programmers.
C. Mirolo is researcher in Computer Science at the University of Udine (Italy), Dept. of
Mathematics, Computer Science and Physics, where he currently teaches introductory
programming and computational geometry. He is also responsible for the education/
training programmes offered to prospective high school teachers of CS. His research
interests include students’ learning of programming and the role of computational think-
ing in general education.
A. Settle is an associate professor in the School of Computing in the College of Com-
puting and Digital Media at DePaul University in Chicago, Illinois, USA. She teaches
computer science, focusing primarily on introductory programming courses. Her re-
search interests include computational thinking, game development and design, gender
and computing, online learning, programming pedagogy, and student recruitment and
retention.
L. Mannila is a researcher in computer science education at university in Linköping,
Sweden. Her research interests include questions related to computational thinking, digi-
tal competence and programming at K-9 level, both from a student and a teacher perspec-
tive. She leads several projects related to programming didactics and developing suitable
teaching materials for introducing computational thinking at lower levels of education.
Mannila is also involved in organizing the Bebras contest in Finland and Sweden.
G. Stupurienė is a doctoral student at Vilnius University Institute of Mathematics and
Informatics at the Department of Informatics Methodology. She has been working with
Bebras challenge since 2010. As a Master student she worked on Conceptualisation of
Informatics Fundamentals through Bebras Tasks of earlier years. Her main research fo-
cus is developing informatics concepts based educational model for schools.
You can also read