Going Beyond the Surface: Studying Multi-Layer Interaction Above the Tabletop
←
→
Page content transcription
If your browser does not render page correctly, please read the page content below
Going Beyond the Surface:
         Studying Multi-Layer Interaction Above the Tabletop
                              Martin Spindler1, Marcel Martsch2, Raimund Dachselt1
                                   1
                                     User Interface & Software Engineering Group
                      2
                        Department of Vocational Education and Human Resources Development
                                         University of Magdeburg, Germany
                                    {spindler, marcel.martsch, dachselt}@ovgu.de
ABSTRACT                                                                       interaction space is no longer limited to an interactive two-
Lightweight spatially aware displays (Tangible Magic                           dimensional (2D) surface, but extended to the third dimen-
Lenses) are an effective approach for exploring complex                        sion (3D). For this purpose, the 3D space above the work
information spaces within a tabletop environment. One way                      surface can be divided into physically separated horizontal
of using the 3D space above a horizontal surface is to di-                     layers [15]. They can be explored by moving spatially
vide it into discrete parallel layers stacked upon each other.                 aware lightweight displays through the “air” that constantly
Horizontal and vertical lens movements are essential tasks                     provide immediate visual feedback regarding current layers.
for the style of multi-layer interaction associated with it.
We conducted a comprehensive user study with 18 partici-                       Until now, many of the aforementioned magic lens ap-
pants investigating fundamental issues such as optimal                         proaches present “cool” technologies and interesting inter-
number of layers and their thickness, movement and hold-                       action opportunities, whereas a careful investigation of the
ing accuracies, and physical boundaries of the interaction                     actual physical characteristics and limitations is still miss-
volume. Findings include a rather limited overall interaction                  ing. Few studies have addressed multi-layer interaction
height (44 cm), a different minimal layer thickness for ver-                   above tabletops, with [17] being a rare exception and focus-
tical and horizontal search tasks (1 cm/4 cm), a reasonable                    ing on pen interaction only. Although multi-layer tangible
maximum number of layers depending on the primary task,                        lens interaction has proven to be a powerful tool for a broad
and a convenience zone in the middle for horizontal search.                    spectrum of application domains, such as the exploration of
Derived from that, design guidelines are also presented.                       spatial information spaces [15], information visualization
                                                                               [16], and collaborative face-to-face sketching and brain-
Author Keywords                                                                storming [14], only little is known about appropriate
Multi-Layer Interaction; Spatially Aware Displays; Above                       boundaries for the physical interaction space, adequate
the Tabletop; Tangible Magic Lens; User Study.                                 amounts of layers, or minimum layer thicknesses – espe-
ACM Classification Keywords                                                    cially with respect to typical interaction tasks with layers.
H.5.2. Information interfaces and presentation: User Inter-                    This paper aims at filling this gap by presenting a compre-
faces – input devices and strategies.                                          hensive study which we conducted to find answers regard-
INTRODUCTION                                                                   ing these questions. In particular, we were interested in:
With ever increasing complex information spaces, technol-
                                                                               • How accurate do users actually interact in the space
ogy and user interfaces are required to explore them and to
                                                                                 above the tabletop (with respect to a particular task)?
focus attention to the relevant information. Magic lenses,
first introduced in 1993 for graphical user interfaces [1],                    • How to design the interaction space in terms of layer
have been proven to be one promising solution. Since then,                       thicknesses, number of layers, and optimal lower and up-
they were made tangible as additional active or passive                          per heights for the physical interaction volume?
displays being used on tabletops [9, 20], above tabletops [8,                  We conducted a comparative user study with 18 partici-
9, 15, 16], in the air [4] or as Mixed Reality lenses [2, 3].                  pants. For this purpose, a simple tangible magic lens system
Typically, these setups include one or more larger (interac-                   with limited features was implemented. As the participants
tive) surfaces. In this work, we will focus on tangible magic                  accomplished several tasks with the system, more than five
lenses in combination with horizontal displays (tabletops).                    hours of performance data was collected. Beyond that, we
With spatially aware tangible magic lenses, the physical                       gathered detailed self-reported data directly after each task.
                                                                               Our findings address valuable insight into physical preci-
                                                                               sion as well as practical guidelines on how to extend a (tab-
Permission to make digital or hard copies of all or part of this work for
personal or classroom use is granted without fee provided that copies are      letop) system with multi-layer interaction techniques.
not made or distributed for profit or commercial advantage and that copies
bear this notice and the full citation on the first page. To copy otherwise,
                                                                               The remainder of this paper is structured as follows. After
or republish, to post on servers or to redistribute to lists, requires prior   presenting background/related work, we describe the goals
specific permission and/or a fee.                                              and the scope of the study in more detail. This is followed
CHI’12, May 5–10, 2012, Austin, Texas, USA.
Copyright 2012 ACM 978-1-4503-1015-4/12/05...$10.00.
by a detailed account of the method, results, and discussion    cause active displays are often too heavy, too thick, too big,
in the respective sections, followed by conclusions.            too rigid, and sometimes even too expensive if many devic-
                                                                es are needed. This lack of technology motivated research-
BACKGROUND: TANGIBLE DISPLAYS
In this section, a brief overview of common tangible mobile     ers to come up with a variety of lightweight display solu-
display approaches is presented and set into context of the     tions, with many of them being designed for horizontal
used reference surface. This is done in order to highlight      table(top)s. Most of these solutions use a passive approach,
technical environments and potential usage scenarios that       i.e., image content is projected onto spatially aware projec-
are likely to benefit from multi-layer exploration techniques   tion screens in one or another form. Lee et al. [11], Holman
as will be discussed in the next section.                       et al. [6], and Spindler et al. [15] presented such systems
                                                                that all use ceiling-mounted projectors for projecting dy-
Tangible Display Interaction (With Respect to a Surface)        namic video content onto optically tracked paper-like dis-
Merging the digital world with the physical world is the        plays. In contrast, SecondLight by Izadi et al. [8] is techni-
vision of ubiquitous computing, as defined by Weiser [21].      cally more complex in that it is based on electronically
This concept was adapted by Ishii’s and Ullmer’s tangible       switchable diffusers. It supports dual back-projections on
user interfaces (TUIs) [7], where interaction with digital      both a tabletop surface and tangible lenses above it. For
information is provided through physical manipulation of        UlteriorScape, Kakehi and Naemura [9] use a special pro-
real-world objects. Inspired by the notion of see-through       jection foil that changes its translucency depending on the
interfaces [1], these objects can also be spatially aware       projection angle and can be used to simultaneously back-
physical displays (e.g., mobile phones) that serve as tangi-    project different image content onto a tabletop surface and a
ble magic lenses into the virtual world. One of the first       tangible lens, respectively. Another promising technologi-
mobile displays for ubiquitous usage has been proposed by       cal development are organic LEDs (OLED) that one day
Fitzmaurice, who presented a spatially aware palmtop com-       might unify the advantages of active and passive displays.
puter for exploring 3D-situated information spaces for re-
                                                                BACKGROUND: MULTI-LAYER INTERACTION
vealing virtual information associated with arbitrary objects
in an office environment [4].                                   As demonstrated in the previous section, a vivid research
                                                                community is working in the field of tangible displays.
Horizontal Reference Surfaces. Contrary to Fitzmaurice’s        Although the aforementioned systems show that a broad
approach, the metaDESK project by Ullmer and Ishii [20]         spectrum of technical solutions and interaction techniques
makes use of a horizontal reference surface only: a tabletop.   has been created for tangible displays, only few of these
Here, users can freely navigate through polygonal 3D mod-       solutions truly utilize the 3D space above a reference sur-
els by moving an arm-mounted LCD display through the            face for the purpose of multi-layer interaction.
space above the tabletop that is also responsible for provid-
ing contextual graphical information. Hirota and Saeki [5]      A multi-layer space is a batch of discrete horizontal layers
as well as Konieczny et al. [10] provide technical solutions    that are stacked one upon each other with each layer con-
for 3D volume slicers using tangible magic lenses, but even     suming a distinct height in physical 3D space. In this way,
though both do not make use of a tabletop, they use the         the multi-layer stack features a physical extent into the third
(horizontal) floor as reference.                                dimension that can be used as a “habitat” for spatially
                                                                aware tangible displays. Multi-layer stacks have been prov-
Vertical Reference Surfaces. In terms of vertical reference     en to be an effective interaction metaphor with a broad field
surfaces, Sanneblad and Holmquist [13] used mobile              of applications, e.g., geometric zooming of large images,
phones to magnify details of a larger contextual image that     semantic zooming of node-link diagrams, exploration of
was shown on a wall display, but without using the space in     space-time data, and layered geo maps – such as demon-
front of the wall for interaction purposes, such as control-    strated by our PaperLens [15] project. This is a lightweight
ling the level of detail. Besides providing a technical solu-   paper-based display solution that enables users to explore
tion for projecting video content on spatially aware projec-    various types of information spaces by moving paper-like
tion screens, Lee et al. [11] suggested using spatially aware   screens through the physical space above the tabletop (see
displays to explore data sets with multiple information         Figure 1). For this purpose, layers of a virtual data space are
layers in front of a vertical display.                          mapped onto physical layers of a multi-layer stack that
                                                                remain parallel to a horizontal table surface. In such setups,
User’s Body as Reference Surface. The peephole displays
                                                                three basic tasks play a dominant role (see Figure 2):
by Yee [22] explore the virtual information space wrapped
around a user by taking the distance between user and PDA       • Holding (keeping a display at a fixed position)
into account. This is used for zooming and layering opera-
                                                                • Vertical Search (moving a display upwards/downwards)
tions in the context of desktop applications, such as calen-
dar, web browsing or geographical maps.                         • Horizontal Search (moving a display at the same height)
Lightweight Tangible Display Solutions                          One example for information spaces that can be explored
In various cases, active display solutions, such as LCD         with these basic interaction tasks are temporal data sets
panels, do not provide suitable form factors for a seamless     (e.g., videos) that users can browse through by lifting and
integration into a tangible magic lens system. This is be-      lowering a mobile display (vertical search) in fast or slow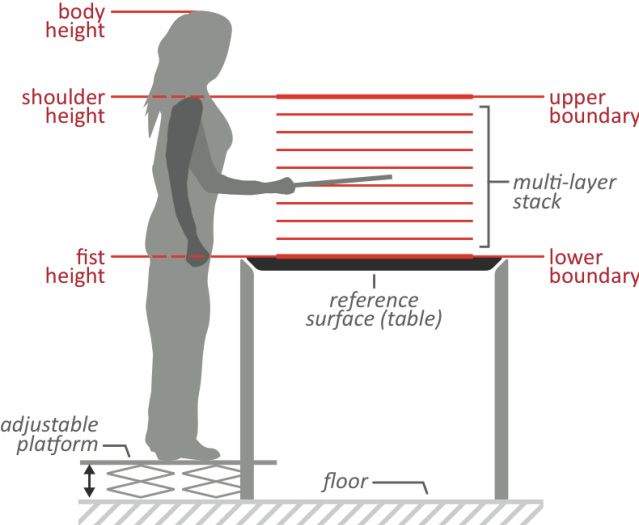
Figure 1: Exploring a multiple layer information space          Figure 2: Three basic tasks for tangible magic lens-based
    by lifting and lowering a tangible magic lens above a         multi-layer interaction above a horizontal surface that were
   digital table that serves as an additional visual context.          tested in terms of physical accuracy in our study.

motion, or they can look at a particular still image by hold-    resulting in a maximum number of 4 layers. They also not-
ing the lens at a particular height (holding task). Another      ed that when users only navigated through layers (similar to
example is the layered information space [15] that enables       our “vertical search”) these could be made thinner than
users to explore several 2D information layers (see Figure       layers where selection gestures were performed (similar to
1), e.g., anatomic images by moving a display horizontally       our “horizontal search”). At the same time, layers closer to
above the table surface (horizontal search). Here, selecting     the work surface could be made thinner than others.
a layer is accomplished by vertical search. For all these
                                                                 GOALS AND SCOPE OF THE STUDY
types of information spaces, the tabletop usually serves as a    While the long-term goal of our work is to fully understand
contextual reference that provides a graphical overview to       general affordances of tangible magic lens interaction
the detail that is displayed on a mobile display.                above the tabletop, the focus of this study is the thorough
In a concluding formative user study [15], we confirmed          investigation of the special requirements of multi-layer
that their exploration techniques are easy to use and intui-     interaction and its physical boundaries. In particular, we are
tive to work with, i.e., users were able to instantly accom-     interested in the three basic interaction tasks discussed in
plish given tasks without being taught how to actually in-       the previous section: holding, vertical search, and horizon-
teract with them, making these techniques ideal not only for     tal search. These operations shall be examined in terms of
public installations. We believe that such techniques will       the accuracy at which users can execute them in physical
play a vital role in future tabletop research.                   space. In addition, design principles concerning layer thick-
                                                                 ness, quantity and convenience volumes for multi-layer
Evaluating Multi-Layer Tangible Display Interaction
                                                                 interaction shall be derived as a sound foundation for de-
Evaluating specific tangible display systems has been the
                                                                 signing future magic lens systems.
goal of a few research projects only. Besides our own work
[15], a notable example is Oh and Hua’s evaluation on form       Hence, the main focus of this work is on designing, con-
factors of tangible magic lenses [12]. In a comparative user     ducting and evaluating a user study that addresses the fol-
study, they tested various lens aspect ratios and sizes. They    lowing issues:
came to the conclusion that the aspect ratio of a lens plays a
more important role for smaller lenses than for larger ones      • Finding possible physical lower and upper thresholds that
and that lens sizes are more dominant in impacting the user        vertically limit the interaction space
performance. However, to the best of our knowledge, no           • Finding exact measures on how accurately users accom-
evaluation of the particular needs of the multi-layer interac-     plish vertical & horizontal search and hold operations
tion aspect of such systems has been done before.                • Gaining an understanding about layout details for a multi-
Multi-Layer Pen Interaction above Digital Tables                   layer stack and its dynamic exploration
In [17], Subramanian et al. presented and evaluated pen          Many possible variables impact the interaction with tangi-
interaction above a digital table for the purpose of multi-      ble magic lenses, e.g., two- vs. one-handed use, tilting,
layer interaction. Although this is similar to the previously    display sizes and weights, device thicknesses, and display
introduced PaperLens concept, it does not couple input and       frame widths. In order to maintain a manageable study
output within the same physical device. Instead, Subrama-        design while still providing ecological validity, we needed
nian et al. designed and tested a set of 3D pen gestures that    to make some tradeoffs. We therefore restricted our investi-
can be used to interact with a multi-layer stack. In a pilot     gations to the case of a user standing in front of a horizontal
study with 5 users (all sitting) they estimated a minimal        tabletop and a two-handed use (as opposed to a seated setup
layer thickness of 4 cm to prevent frustration due to acci-      and one-handed use). We also decided to disregard lens
dentally changing layers, which is close to our findings. In     tilting. This was because our main focus was on stacked
order to reduce fatigue, they argued for limiting the maxi-      multi-layer spaces, where lens tilting often plays a minor
mum height above the work surface to about 16 cm, thus,
(a) Interaction Zones (b) Layer Subdivisions
Figure 3: Conceptual design of interaction zones (a) and
layer subdivisions (b) as used for the study.
role (e.g., for the ease of comfort) or is used as additional
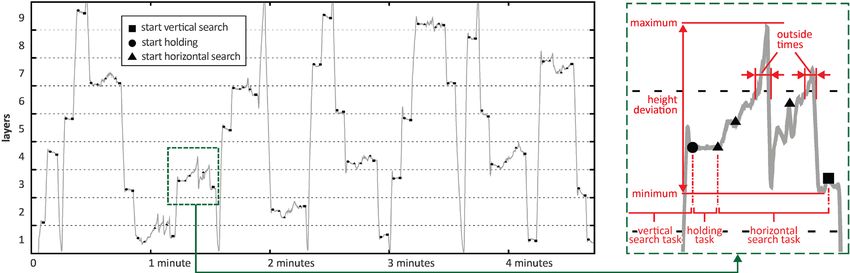
modality that only adds further degrees of freedom. In in- Figure 4: Principle setup of the study. The platform’s height
formal pre-tests we observed no practical influence of dis- was adjusted in order to match fist height and table height.
play sizes for a two-handed use (we tested paper formats of
A6 to A4), so we skipped this variable. Another example is motivated by the three interaction zones as explained later
display weights. We assume that in the near future a new (see Figure 3a). We used a within-subject design.
generation of lightweight displays (e.g., based on OLEDs) Compensating Body Sizes
will dramatically improve form factors of tablets, smart To compensate for different body sizes of participants (e.g.,
phones and alike, so that display weights are likely to come longer arm lengths), we decided to use the fist height and
closer to the weight we used in our study (about 190g). A the shoulder height as a priori limits for the lower and up-
high priority was the avoidance of additional disturbing per boundaries of the interaction volume, with the fist
effects, such as a visual context displayed on the table sur- height being the distance of fist to floor when the arm hangs
face. In order to diminish cognitive load from participants, loosely. These values could be adjusted for each participant
mainly stimuli were considered that address low-level pro- by using a platform (see Figure 4). The use of fist and
cessing. Based on the feature integration theory [19], we shoulder heights was motivated by ergonomics literature –
designed single-feature search tasks with targets that are in our case [18] – and the outcome of a small pre-test: a
clearly visually separated from distractors. This is achieved table surface that is too low forces users to bend the upper
by using discriminative features (pop-out effect), for in- body, whereas holding lenses higher than the shoulder
stance strong contrasts of light, shade and color, which can quickly leads to fatigue. We used the shoulder-fist distance
be preattentively processed. to define the overall height of the interaction volume for
each participant (M = 691.11 mm, SD = 54.33). Due to
METHOD constant subdivision of layers, the layer thicknesses varied
Participants relative to individual heights of the physical interaction
Eighteen students and staff members from our department volume, with L9 (M = 76.80 mm, SD = 6.04), L18 (M =
(4 female, 14 male) participated in the user study. Their age 38.40 mm, SD = 3.02) and L36 (M = 19.2, SD = 1.51).
ranged from 20 to 32 (M = 26.9, SD = 3.2). The average Vertical Search: Distributing Targets within the Layer Stack
body height was 178.9 cm (SD = 9.4). All were daily users For vertical search tasks, a sequence of targets was defined
of computers and had advanced knowledge in the fields of that was distributed over the overall volume height. For this
computer graphics, simulation or image processing. purpose, we distinguished between three equispaced inter-
Design & Tasks action zones: the lower (L), middle (M) and upper (U) zone
In order to test the accuracy at which users perform the (see Figure 3a). We chose three random layers from each
three basic interaction tasks (holding, vertical search and zone as a search target. This allowed us to design six differ-
horizontal search), a minimalistic layered information space ent combinations of vertical search tasks: L-L, M-M, U-U,
was designed that consists of vertically stacked randomized L-M, L-U, and M-U, which was further multiplied by the
integer numbers (between “1” and “99”) representing the direction, e.g., L-M vs. M-L or L1-L2 vs. L2-L1. Since at
search targets unknown to participants. The independent least two variants were to be tested for each combination,
variable was the number of layers that directly correlates we finally came up with 6 × 2 × 2 = 24 vertical search
with layer thicknesses. As pre-tests suggested, we expected tasks. For all participants and layer subdivisions (L9, L18,
this parameter to impact the accuracy of task performances. L36) the same sequence was used.
Three different levels of layer subdivision were used: 9 Horizontal Search: Distributing Targets within a Single Layer
layers (L9), 18 layers (L18) and 36 layers (L36), as illus- For horizontal search tasks (panning), two search targets
trated in Figure 3b. The use of multiples of “3” was mainly were randomly placed in each horizontal layer. To avoid
(a) Vertical Search Task                             (b) Holding Task                 (c) Horizontal Search Task
    Figure 5: Apparatus and three interaction tasks. Lens content appears brighter than during the user study, e.g., for holding tasks
     the background was usually deep black. This is due to light conditions during taking photographs. Interaction was two-handed.

that participants have to bend their backs, we chose a con-                    visual feedback on the display (red “Hold!” label, see Fig-
servative working radius of 40 cm (150 cm tall women have                      ure 5b) they had to hold the tangible lens stable at the very
a shoulder-finger reach of about 60 cm, see [18]).                             same layer (holding task) for 3 seconds until the “Hold!”
                                                                               label disappeared and another “beep” sound indicated that
Overall Task Cycle
According to this design, for each level of layer subdivision                  the participant should continue searching for the next red
(L9, L18, and L36) a randomized sequence of 24 holding                         number. From time to time (at 9 different layers), users had
tasks (3 sec each), 24 vertical search tasks, and 9 horizontal                 to perform a sequence of horizontal search tasks. For this
search tasks was defined. The same sequence was used for                       purpose, the red number was replaced by a slightly smaller
each participant. See Figure 6 for an example height plot.                     white number above a red background with white arrows
                                                                               hinting that the participant should now continue searching
Procedure
                                                                               horizontally until two randomized search targets (white
For each participant, the following order of test parts was                    numbers) within the same layer were found that had to be
maintained: (1) introduction part, (2) interaction part, and                   read out aloud (see Figure 5c). Whenever participants acci-
(3) assessment part. Users spent on average 40 minutes per-                    dentally left the layer, they got immediate visual feedback
forming all parts.                                                             (the lens turned dark). In such cases, users had to manually
                                                                               find back to the layer by lifting/lowering the lens until it
(1) Introduction Part                                                          turned red again. Neighboring layers did not contain any
After participants completed a brief questionnaire soliciting                  numbers. This prevented reports of false numbers. By
demographics and computer usage information, the body,                         reaching the starting position again (white number with
shoulder and fist heights were measured. Thereon, the plat-                    arrows, see Figure 5c), the horizontal search task ended,
form’s height was adjusted to match the table height with                      followed by the next vertical search task.
the fist height, see section “Compensating Body Sizes”
above. Then, the main task was explained verbally in a                         (3) Assessment Part
standardized way by reading out aloud from a sheet of pa-                      Self-Report. At the end of each cycle in the interaction part,
per. To ensure that all participants had perfectly understood                  participants were asked to rate their agreement on a 7-point
all relevant aspects, they were invited to perform a few                       Likert scale from “1” (“do not agree at all”) to “7” (“com-
exercise trials without collecting data until they felt confi-                 pletely agree”) to several items in a questionnaire. These
dent in handling the task (never longer than two minutes).                     items addressed the usability (effectiveness, efficiency and
                                                                               user satisfaction) regarding holding tasks, vertical search
(2) Interaction Part                                                           tasks and horizontal search tasks.
Participants were asked to complete the interaction part in
three cycles – one for each level (L9, L18 and L36). The                       Perceived Interaction Zones. After all tasks of the interac-
order of levels was counter-balanced. For each cycle, par-                     tion part had been completed, participants were asked to fill
ticipants were to hold the tangible display in front of their                  out another questionnaire that was very similar to the one
body in order to explore a stack of white random integer                       from the interaction part, but this time with respect to how
numbers by vertically lifting and lowering it (vertical                        they perceived the interaction in each of the three interac-
search task, see Figure 5a) until they found the search tar-                   tion zones (see Figure 3a). In order to utilize spatial memo-
get (a single red-colored number). Users were instructed to                    ry, participants could play around with the tangible lens
read out aloud the red number 1. After a “beep” sound and a                    once again while the lens was tinted according to the
                                                                               scheme depicted in Figure 3a (no targets were displayed).
1
  Filtering a single red-colored number out of many white-colored ones is      Preferred Boundaries. In the final and additional part, par-
a preattentive process. Although this does not apply to reading two-digit      ticipants were asked to define – from their point of view –
numbers, we still consider it to be fast enough to not significantly affect    the ideal vertical lower and upper boundaries of the interac-
our experiment.
Figure 6: A typical plot of a cycle for level L9 showing height measures of the tangible lens over time. In the detailed view at the
         right side, the derivation for “outside times” and “height deviations” (as used in the data analysis) is illustrated.
tion volume with respect to the table surface. This was              mance data. Second, we provide further analysis with re-
accomplished by holding the lens at the favored lower and            spect to the three interaction zones. And third, we investi-
upper heights above the table and then saying “okay”.                gate data from questionnaires.
Apparatus                                                            Performance Data
The user study was conducted in a dark and quiet lab envi-           In order to analyze collected performance raw data, the
ronment. The technical setup used for the experiments con-           following types of derived data have been extracted:
sisted of a horizontal table (reference surface), a piece of a
rectangular cardboard of size 21.5 × 21.5 cm (tangible dis-          • Task completion time (in sec) that we used as a distinct
play), and a ceiling-mounted video projector directly above            measure of performance for vertical and horizontal search
the table. In order to guarantee a high degree of spatial              tasks. For holding tasks this time is constant (24 × 3 sec =
precision we opted for a magnetic-based tracking approach              72 sec) and thus not relevant.
(Polhemus Fastrak) that enabled us to limit the spatial error        • Total completion time (in sec) is an aggregated measure
to 0.3 mm within a working volume of 70 × 70 × 70 cm³.                 of performance that sums up the times spent on horizon-
We decided against projecting additional visual context                tal and vertical search tasks.
onto the table. Instead, the table surface primarily served as       • Height deviation (in mm) is the minimum and maximum
horizontal spatial reference.                                          displacement for horizontal search and holding tasks used
On the software side, our system was implemented with C#.              as a measure of accuracy (see Figure 6). By using MIN/
We opted for a client/server model with the server being               MAX operators, we decided on a conservative but simple
responsible for lens tracking and the client being responsi-           statistical tool. Choosing other tools, such as MEAN/
ble for displaying and application (user study tasks). Com-            VARIANCE, would only further narrow our findings.
munication between client and server was achieved by a               • Outside time (in sec), i.e., amount of time that partici-
simple self-tailored UDP/IP-based protocol. It allows for              pants unintentionally spent outside of a layer while per-
sending and receiving a stream of 4 × 4 transformation                 forming a holding or horizontal search task (see Figure
matrices that describe the current 3D position and orienta-            6). We used this as a measure of error.
tion of the tangible lens’ center.
                                                                     We also analyzed tilting of lenses. However, in contrast to
Collected Data                                                       our assumptions, we did not find any significant effect and
For later evaluation, the stream of transformation matrices          thus will omit the discussion about it.
was continuously logged into a file at a rate of about 33
samples per second. Along with this, additional marker               Statistical Methodology
timestamps were recorded (e.g., “start vertical search”, see         Collected data (performance measures and self-report data)
Figure 6). For this purpose, the study leader had to manual-         was analyzed with a repeated measurement ANOVA. For all
ly press the ENTER key every time a number was read out              ANOVAs, p-values were Greenhouse–Geisser corrected.
aloud to trigger the next task. To ensure equal times for the        When main effects were significant, Bonferroni corrected
holding task, the system automatically generated a “beep”            p-values are reported for post hoc comparisons (t-test, two-
sound after 3 seconds of holding.                                    tailed). For testing the relationship between layer subdivi-
                                                                     sion and accuracy of horizontal search tasks, correlation
RESULTS                                                              coefficients (Pearson r) were computed. For statistical tests,
In this section, results from the experiment are presented in        the a priori threshold of α = .05 was used. If not stated oth-
three parts. First, we report on the basic analysis of perfor-       erwise, results are in sec; “ns” stands for “not significant”.
Figure 7: Task completion times of horizontal and vertical               Figure 8: Outside times of holding tasks and
 search tasks for L9, L18 and L36. Both times sum up to the                horizontal search tasks for L9, L18 and L36.
 total completion time. Error bars show standard deviations.                Error bars represent standard deviations.

Basic Analysis of Performance Data                                there is no significant effect (t(17) = 1.56, ns) for L9 vs. L18,
In the following, a basic analysis of performance data is         participants needed significantly (t(17) = 4.90, p < .001)
presented. See Figure 7 for completion times.                     more time for L36 than for L18.
Total Completion Times                                            We observed no main effect of layer subdivisions for height
Regarding total completion times, we found a significant          deviations (F(2,34) = 2.25, ns). For outside times we found a
main effect of layer subdivisions (F(2,34) = 45.2, p < .001).     significant main effect of layer subdivisions (F(2,34) = 57.27,
Completion times for L9 were significantly shorter than for       p < .001). The participants crossed layer boundaries less
L18 (t(17) = 3.95, p = .001). The same holds for the contrast     often for L9 than for L18 and L36, see Figure 8 (right).
L18 vs. L36 (t(17) = 12.73, p < .001).
                                                                  To test the interrelation of total completion times (TCT)
In summary, total completion times show that with decreas-        against height deviations (HD) and outside times (OT),
ing thickness of layers participants needed significantly         several correlation coefficients were computed that show a
more time for completing horizontal and vertical search           significant relation of TCT × HD (L9: r = .526, p < .001;
tasks. In the following, further results are presented for each   L18: r = .495, p < .001; L36: r = .643, p < .001) and TCT ×
task.                                                             OT (L9: r = .682, p < .001; L18 = .871, p < .001; L36: r =
Holding Task                                                      .903, p < .001). This shows for all layer subdivisions that
The analysis of height deviations revealed no significant         participants who accomplished tasks accurately were the
main effect of layer subdivisions (F(2,34) = 2.41, ns). How-      ones with a good overall performance and vice versa.
ever, the results of height deviations depict that the preci-     Further Analysis Regarding Interaction Zones
sion of holding tasks generally improves slightly from L9         In this section, further analysis of performance data is pre-
(M = 7.18 mm, SD = 2.33) over L18 (M = 7.00 mm, SD =              sented with regards to the lower, middle and upper interac-
2.30) to L36 (M = 6.23 mm, SD = 1.44).                            tion zone (see Figure 3a). For this purpose, we rearranged
Analysis of outside times (see Figure 8, left) revealed a         already analyzed performance data with respect to these
significant main effect of layer subdivisions (F(2,34) = 3.93,    zones. In particular, we looked into height deviations and
p = .029). Pairwise comparisons showed that participants          outside times for holding and horizontal search tasks sepa-
accidentally left target layers significantly more frequently     rately for each layer subdivision (within-subject factor).
(t(17) = 3.00, p < .024) for L18 than for L9. Most layer          Holding Task
crossings happened for L36, but neither differed significant-     We did not find any significant main effect of the three
ly from L9 (t(17) = 3.00, ns) nor from L18 (t(17) = 1.72, ns),    interaction zones for height deviations or for outside times.
which is due to a high standard deviation.
                                                                  Horizontal Search Task
Vertical Search Task                                              For L9 and L18 we observed no significant main effects
In terms of the completion time, we observed a significant        with regard to the three interaction zones, neither for task
main effect of layer subdivisions for vertical search tasks       completion times and height deviations, nor for outside
(F(2,34) = 77.9, p < .001). Participants needed significantly     times. In contrast, for L36 we revealed significant effects of
less time (t(17) = 6.33, p < .001) for L9 when compared with      task completion times (F(2,34) = 12.08, p = .001), height de-
L18. In the same way, differences of completion times             viations (F(2,34) = 4.10, p = .049) and outside times (F(2,34) =
between L18 and L36 are significant (t(17) = 6.14, p < .001).     10.45, p = .003). For the following discussion, see Figure 9.
Horizontal Search Task                                            For task completion times, pairwise comparisons show that
For horizontal search tasks we found a significant main           the middle zone is less demanding than the lower (t(17) =
effect of completion times of layer subdivisions (F(2,34) =       4.56, p = .001) and upper zone (t(17) = 4.13, p = .002).
24.82, p < .001). Although pairwise comparisons show that
Figure 9: Performance data for the horizontal search task Figure 10: Usability ratings for holding task, vertical search
(only L36) broken down by the lower, middle and upper task and horizontal search task with respect to
interaction zone (see Figure 3). Error bars represent stand- single layer subdivisions (L9, L18, and L36).
ard deviations. Error bars represent standard deviations.
Height deviations of the middle zone are slightly (but not DISCUSSION
significantly) smaller than the ones of the lower and upper In this section, we will reflect on our results and provide
zone. This indicates that the middle zone takes on a special answers to the questions of minimal layer thicknesses, ver-
role for horizontal search tasks. This is also supported by tical boundaries for the physical interaction zone, and max-
outside times that are significantly longer for the upper imum number of layers. Based on these findings, we will
zone, when compared to the lower (t(17) = 4.63, p = .001) derive design guidelines that will be presented at the end of
and middle zone (t(17) = 3.96, p = .003). this section.
Layer Thicknesses & Accuracy
Questionnaires & User Preferences In general, we can show that a diminishing layer thickness
In the following, the results of user ratings concerning usa- correlates with decreasing test performances. This applied
bility are presented as agreement values on a 7-point Likert in particular to the vertical and horizontal search task. In
scale. For a brief summary, see Figure 10. contrast, the holding task remained mostly unaffected.
Holding Task
Holding Task. Compared to other tasks, holding was per-
Ratings on holding tasks differ depending on layer subdivi-
formed most accurately. On average, the height deviation
sions (F(2,34) = 19.24, p < .001). Pairwise comparisons show
for holding tasks was approx. 7 mm. By taking into account
that L9 is rated best when compared with L18 and L36.
a standard deviation of approx. 2 mm, this leads to a rather
Individual comparison shows that contrasts are significant
conservative minimum layer thickness of approx. 9 mm or
for all combinations.
about 1 cm. This value is even substantially lower than the
Vertical Search Task average thickness of L36 (M ≈ 19 mm), which is most like-
With respect to the ratings for vertical search, we found a ly the reason for why the control variable “layer subdivi-
significant main effect of layer subdivisions (F(2,34) = 8.62, sion” only marginally affected the error measure “outside
p = .001). Pairwise comparisons show that L9 is assessed as times” for holding tasks. Interestingly, participants per-
significantly easier than both L18 and L36. For L18 vs. formed the holding tasks most accurate with L36
L36, this effect is not significant. (M ≈ 6 mm), as opposed to L9 (M ≈ 7 mm). This effect was
Horizontal Search Task significant and indicates that visual feedback helps to
Ratings for horizontal search tasks have a significant main further improve the accuracy at which holding tasks are
effect of layer subdivisions (F(2,34) = 14.29, p < .001). Pair- performed – simply because users can adapt to errors
wise comparisons reveal that L36 is rated as significantly quicker (visual correction impulse). This interpretation is
more difficult than L9 and L18. also supported by slightly longer “outside times” for L36
(M ≈ 0.4 sec), which correlates with more frequent visual
Perceived Interaction Zone feedback due to thinner layers. Surprisingly, these findings
We observed a significant main effect of the three interac- are somehow contradicted by self-reports. Here, users had
tion zones (F(2,34) = 25.20, p < .001). The usability of inter- the subjective impression that they would perform signifi-
action for the middle zone (M = 6.46, SD = .62) was rated cantly worse for L36 (M ≈ 4.7) compared to L9 (M ≈ 6.1),
significantly better when compared with the lower (M = which was just not true. One reason for such ratings could
6.04, SD = .62) and upper zone (M = 4.47, SD = 1.38). be disappointment due to an assumed bad performance that
Preferred Boundaries was associated with leaving a layer.
The analysis of subjective boundaries of the interaction Vertical Search Task. We found significant main effects for
volume results in a preferred lower limit (M = 68.28 mm, task completion times between all combinations of layer
SD = 51.01) and a preferred upper limit (M = 508.77 mm, subdivisions. Although the search space was doubled each
SD = 78.45) above the table surface. time, the completion times for vertically searching it didnot. More precisely, for L9-L18, there were 9 added layers matches the standard deviation of the body heights (SD ≈ 9
with 18 sec of longer completion times that resulted in a cm). By compensating for the preferred lower boundary, we
delay of 2 sec per extra layer. In contrast, for L18-L36, obtain a corrected upper boundary of about 44 cm (i.e.,
there were 18 added layers with only 25 sec penalty produc- 51 cm - 7 cm) above the adjusted table surface.
ing a delay of less than 1.4 sec per extra layer. This indi-
Number of Layers. A reasonable threshold for the maxi-
cates that the vertical search task is an efficient interaction
mum number of layers is found by mapping minimal layer
technique for single-feature searches (when pop-out effects
thicknesses (1cm / 4cm) onto the absolute height of the
are being utilized) that performs better than linear with a
physical interaction volume (44 cm). Depending on the
growing search space. These insights are also supported by
task, this results in a number of 44 layers (holding and
self-reports.
vertical search tasks) or 11 layers (horizontal search tasks).
Unfortunately, data gathered during our experiments made
Design Guidelines & Further Observations
it difficult to directly derive a minimum layer thickness. When designing multi-layer applications, the general rule of
This is because “outside times” and “height deviations” are thumb is to use as few layers as necessary with the exact
not available for vertical search. However, since search number depending on the primary interaction goal. For
tasks are usually accompanied by holding tasks, we can instance, for the exploration of a multi-layer geo-referenced
borrow from our findings there. Thus, our conservative map, where panning (horizontal search) is the dominant
estimate for the minimum layer thickness for vertical task, at most eleven layers should be adopted. In addition to
search is roughly 1 cm. that, most relevant information layers should be assigned to
Horizontal Search Task. For horizontal search, task com- the middle (“comfort”) zone, followed by the lower zone.
pletion times and outside times indicate that the threshold One important outcome of our study was that vertical
for a minimum layer thickness lies somewhere between L18 search was clearly favored over horizontal search. Thus,
and L36. Thus, a conservative measure is found by using it should be the first choice whenever possible. For exam-
the average layer thickness of L18 (M ≈ 3.8 cm) as the ple, for the exploration of temporal data sets (e.g., surveil-
minimum layer thickness that is about 4 cm. A less con- lance videos), vertical search should be reserved for the
servative measure would be slightly smaller but should not dominant goal of time-browsing, whereas horizontal search
get too close to L36 (M ≈ 1.9 cm). A follow-up study with should be used for secondary goals, such as selecting a
finer layer subdivisions might help further narrowing down video.
this value. However, conducting another user study is prob-
ably not worth the effort. Although our study mostly addressed single-feature search
tasks in discrete (non-continual) layers, many of our find-
Physical Interaction Space & Number of Layers
ings also apply to continuous layer setups. Examples are the
Holding tasks were performed equally well in all of the
measures for lower and upper boundaries of the physical
three interaction zones. Horizontal search tasks, in con-
interaction space, the minimum layer thickness for holding
trast, were best accomplished in the middle zone (with
tasks, and the recommendation for restricting the interaction
respect to height deviations and outside times) and not as
to the middle and lower zones.
we anticipated in the lower zone. This was a surprising
insight and somehow the precursor of another unexpected A simple way to improve the accuracy of holding and hori-
finding: zontal search tasks is to provide instant visual feedback
regarding layer borders. Another strategy is to adjust the
Lower and Upper Boundaries. When asked for their pre-
center of the layer to match the current display height
ferred lower interaction boundary, most participants did not
after a certain dwell time. This prevents the problem of
choose the table surface. Instead, they opted for a slightly
losing the layer when the tangible lens was originally too
higher value that was roughly 7 cm (SD ≈ 5 cm) above it.
close to one of its boundaries – an effect that we frequently
On the one hand, this was because most participants did not
encountered during our studies.
consider letting the lens loose in order to put it on the table
surface. On the other hand, this means that the initially used Another noticeable effect was over- and undershooting
“fist height” was a rather weak estimate for the table height. during vertical search, especially whenever an unknown
This was probably due to the frequent bending of the upper search target was encountered (pop-out effect). We only
part of the body that was involved, for instance, with the gathered limited evidence regarding fatigue (participants
horizontal search task. We therefore propose the “wrist spent only approx. 30 min with the tangible display). Nev-
height” as a more adequate measure for the ideal tabletop ertheless, a multi-layer application should always provide
height. This insight can also be useful for conventional users with the ability to rest from time to time, e.g., by
interactive table displays, in particular whenever a standing freezing particular views and putting them down on the
usage is intended. table (cf. [16]).
In terms of a physical upper boundary, participants pre- Beyond that, in many scenarios the required number of
ferred a height of roughly 51 cm above the table surface physical layers can easily extend a reasonable amount. In
with a standard deviation of about 8 cm, which closely such cases, better layer subdivision strategies must befound, such as distorting the physical interaction space for 7. H. Ishii and B. Ullmer. Tangible Bits: Towards Seam-
horizontal search tasks by increasing the thickness of a less Interfaces between People, Bits and Atoms. Proc.
particular layer (fisheye effect). CHI 1997, ACM Press (1997), 234-241.
CONCLUSIONS & FUTURE WORK 8. S. Izadi, S. Hodges, S. Taylor, D. Rosenfeld, N. Villar,
In this paper, a class of interaction techniques that extends A. Butler, and J. Westhues. Going Beyond the Display:
the design space of horizontal digital tables to the physical A Surface Technology with an Electronically Switcha-
third dimension was systematically investigated with re- ble Diffuser. Proc. UIST ‘08, ACM Press (2008), 269-
spect to exploring a layered information space. With a 278.
comprehensive user study, we studied the accuracy at 9. Y. Kakehi and T. Naemura. UlteriorScape: Interactive
which three fundamental tasks (vertical search, horizontal Optical Superimposition on a View-Dependent Tab-
search and holding) are performed with tangible magic letop Display. Proc. TABLETOP ‘08. IEEE Computer
lenses. This also considered other fundamental issues such Society Press (2008), 189-192.
as the optimal number of layers and their thickness. Our
findings include considerable differences in vertical and 10. J. Konieczny, C. Shimizu, G. W. Meyer, and D. A.
horizontal search tasks, e.g., a minimal layer thickness of Colucci. Handheld Flexible Display System. Proc. VIS
1 cm vs. 4 cm or a resulting maximum number of layers ‘05, IEEE Computer Society Press (2005), 75-81.
(11 vs. 44). Derived from these findings, design recom- 11. J. C. Lee, S. E. Hudson, J. W. Summet, and P. H.
mendations were also presented. Given the generic charac- Dietz. Moveable Interactive Projected Displays Using
ter of interaction tasks in stacks of discrete layers and their Projector Based Tracking. Proc. UIST ‘05, ACM Press
universal applicability for many systems and domains, we (2005), 63-72.
hope that our findings will help the research community to 12. J. Oh and H. Hua. User Evaluations on Form Factors of
design and develop a new generation of applications using Tangible Magic Lenses. Proc. ISMAR ‘06, ACM Press
tangible magic lenses. (2006), 23-32.
For future work, we intend to investigate further aspects of 13. J. Sanneblad and L.E. Holmquist. Ubiquitous Graphics:
tangible multi-layer interaction, such as rotation tasks, the Combining Hand-held and Wall-size Displays to Inter-
dynamic non-linear arrangement of layers, perceptual and act with Large Images. Proc. AVI ‘06, ACM Press
cognitive issues as well as novel application domains. (2006), 373-377.
ACKNOWLEDGEMENTS 14. M. Spindler and R. Dachselt. Poster: Towards Making
This work was funded by the German Ministry of Educa- Graphical User Interface Palettes Tangible. Proc. ITS
tion and Science (BMBF) project ViERforES-II (01IM1000 ‘10, ACM Press (2010), 291-292.
2B). We thank Ricardo Langner for his artwork and video 15. M. Spindler, S. Stellmach, and R. Dachselt. Advanced
editing. Magic Lens Interaction above the Tabletop. Proc. ITS
REFERENCES ‘09, ACM Press (2009), 77-84.
1. E. A. Bier, M. C. Stone, K. Pier, W. Buxton, and T. D. 16. M. Spindler, C. Tominski, H. Schumann, and R. Dach-
DeRose. Toolglass and Magic Lenses: The See- selt. Tangible Views for Information Visualization.
Through Interface. Proc. SIGGRAPH 1993, ACM Proc. ITS ‘10, ACM Press (2010), 157-166.
Press (1993), 445-446.
17. S. Subramanian, D. Aliakseyeu, and A. Lucero. Multi-
2. L. D. Brown, and H. Hua, Magic Lenses for Augment- Layer Interaction for Digital Tables. Proc. UIST ‘06,
ed Virtual Environments. IEEE Computer Graphics ACM Press (2006), 269-272.
and Applications. 26, 4 (July 2006), 64-73.
18. A.R.Tilley. The Measure of Man and Woman: Human
3. L. K. Y. Chan and H. Y. K. Lau. Poster: A Tangible Factors in Design. John Wiley & Sons, 2nd ed., 2002.
User Interface Using Spatial Augmented Reality. Proc.
IEEE 3DUI, IEEE Comp. Society, 2010, 137-138. 19. A. Treisman and G. Gelade. A Feature Integration
Theory of Attention. Cognitive Psychology. 12, (1980),
4. G. W. Fitzmaurice. Situated Information Spaces and 97–136.
Spatially Aware Palmtop Computers, Communications
of ACM, 36, 7 (1993), 39-49. 20. B. Ullmer and H. Ishii. The metaDESK: Models and
Prototypes for Tangible User Interfaces. Proc. UIST
5. K. Hirota and Y. Saeki. Cross-section Projector: Inter- ‘97, ACM Press (1997), 223-232.
active and Intuitive Presentation of 3D Volume Data
using a Handheld Screen. Proc. 3DUI 2007, IEEE 21. M. Weiser. The Computer for the 21st Century. Scien-
Computer Society Press (2007), 57-63. tific American. 265, 3 (1991), 66-75.
6. D. Holman, R. Vertegaal, M. Altosaar, N. Troje, and D. 22. K. Yee. Peephole Displays: Pen Interaction on Spatial-
Johns. Paper Windows: Interaction Techniques for ly Aware Handheld Computers. Proc. CHI ‘03, ACM
Digital Paper. Proc. CHI ’05, ACM Press (2005), 591- Press (2003), 1-8.
599.You can also read