Insights into the role of diet and dietary flavanols in cognitive aging: results of a randomized controlled trial - Nature
←
→
Page content transcription
If your browser does not render page correctly, please read the page content below
www.nature.com/scientificreports
OPEN Insights into the role of diet
and dietary flavanols in cognitive
aging: results of a randomized
controlled trial
Richard P. Sloan1,2*, Melanie Wall2, Lok‑Kin Yeung3,4, Tianshu Feng2, Xinyang Feng3,
Frank Provenzano3,4, Hagen Schroeter5, Vincenzo Lauriola1, Adam M. Brickman3,4 &
Scott A. Small3,4*
With the world’s population aging, age-related memory decline is an impending cognitive epidemic.
Assessing the impact of diet on cognitive aging, we conducted a controlled, randomized, parallel-arm
dietary intervention with 211 healthy adults (50–75 years) investigating effects of either a placebo or
260, 510 and 770 mg/day of cocoa flavanols for 12-weeks followed by 8-weeks washout. The primary
outcome was a newly-developed object-recognition task localized to the hippocampus’ dentate
gyrus. Secondary outcomes included a hippocampal-dependent list-learning task and a prefrontal
cortex-dependent list-sorting task. The alternative Healthy Eating Index and a biomarker of flavanol
intake (gVLM) were measured. In an MRI substudy, hippocampal cerebral blood volume was mapped.
Object-recognition and list-sorting performance did not correlate with baseline diet quality and did
not improve after flavanol intake. However, the hippocampal-dependent list-learning performance
was directly associated with baseline diet quality and improved after flavanol intake, particularly in
participants in the bottom tertile of baseline diet quality. In the imaging substudy, a region-of-interest
analysis was negative but a voxel-based-analysis suggested that dietary flavanols target the dentate
gyrus. While replication is needed, these findings suggest that diet in general, and dietary flavanols in
particular, may be associated with memory function of the aging hippocampus and normal cognitive
decline.
As the average age of populations increases globally, so too do the considerable societal and personal costs associ-
ated with a decline in cognitive performance during normal cognitive aging. Consequently, research in this area
increasingly focuses on the development of life-style and dietary approaches aimed at preventing or delaying
the onset of age-related cognitive decline. The work described here lies at the intersection of two main areas
of interest and scientific inquiry, namely the identification and investigation of specific brain regions causally
linked to cognitive aging as well as the impact of diet on cognitive performance and its application as a potential
means for maintaining cognitive health into old age. In this context, data from epidemiological studies as well as
dietary intervention studies support the notion that dietary status generally, and the intake of dietary flavanols,
in particular, may attenuate cognitive aging and enhance various fuctional measures of cognitive p erformance1,2.
Flavanols are bioactive food constituents and dietary sources include tea, cocoa, pome fruits, grapes and wine,
and various grains, herbs, and berries.
While the physiological processes that underlie cognitive aging are still being investigated, the neuroana-
tomical profile of cognitive aging is currently thought to be localized to two general brain areas, the prefrontal
cortex and hippocampus3. Nonetheless, further experimental interventions are required to validate that these
two brain regions are causally linked to cognitive aging. Initial experimental data, including a video game-based
1
Division of Behavioral Medicine, Department of Psychiatry, Columbia University Irving Medical Center, 622
West 168th St., New York, NY 10032, USA. 2New York State Psychiatric Institute, 1050 Riverside Drive, New York,
NY 10032, USA. 3Department of Neurology, Vagelos College of Physicians and Surgeons, Columbia University,
622 West 168th St., New York, NY 10032, USA. 4Taub Institute for Research On Alzheimer’s Disease and the
Aging Brain, Vagelos College of Physicians and Surgeons, Columbia University, 622 West 168th St., New York,
NY 10032, USA. 5Mars Inc., 6885 Elm St, McLean, VA 22101, USA. *email: rps7@cumc.columbia.edu; sas68@
cumc.columbia.edu
Scientific Reports | (2021) 11:3837 | https://doi.org/10.1038/s41598-021-83370-2 1
Vol.:(0123456789)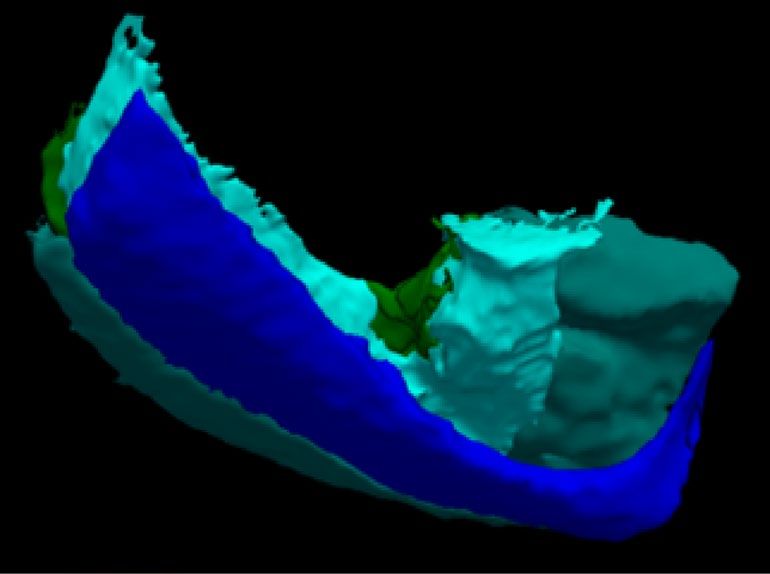
www.nature.com/scientificreports/
a Trial 1 Matching Trial 41
c
Trial 1
... ELEPHANT MOUSE PIG
10 s y/n 10 s l/r
Name from smallest to largest
1s 1s
“Click on the figure that looks exactly like the one you just saw as quickly as possible” Trial 2
Recognition
Trial 1 Trial 2 Trial 82 STAWBERRY PUMPKIN BANANA
Name from smallest to largest
Trial 3
y/n y/n
... y/n
0s BANANA ELEPHANT STAWBERRY PIG
“Is this one of the figures you saw earlier? Respond y/n (button press) as quickly Name from smallest to largest, animals first, then
as possible” fruits.
Long
b Learning trials
Learning Delay
Short
Distractor Delay Free Recall Recognition Source
List Free Recall Memory
1 2 3
A A A B A A B A A/B
Figure 1. Example of the neuropsychological tests used to assess cognitive performance, including (a) Object-
Recognition test (Modified Benton recognition task), (b) List-Learning memory test (Modified Rey auditory
verbal learning test), and (c) List-Sorting task (List sorting working memory test from the NIH Toolbox
Cognition Battery). Example stimuli for the ModBent (a) were generated in MATLAB (MathWorks, Natick,
MA, version R2008a). Details of stimuli generation were described p reviously8. Stimuli displayed as examples
from NIH Toolbox were publicly available clip art. We did not include stimuli from the actual tests to maintain
the integrity and security of test materials, according to the ethical standards of our field. Information about the
NIH Toolbox is available online (https://www.healthmeasures.net/explore-measurement-systems/nih-toolbox).
intervention, which demonstrated improved performance on a prefrontal task that declines with age, strengthen
the argument for a causal link between the prefrontal cortex and cognitive aging4.
We have investigated the potential causal link between cognitive aging and functional changes in the dentate
gyrus (DG), a region within the hippocampal circuit vulnerable to a ging5. The DG has been linked to perfor-
mance on "object-recognition" t asks6 and other investigators suggested that DG function is essential in the
pattern separation of complex stimuli as they flow through the hippocampal circuit7. Using a new task in which
a series of complex patterns were embedded in an object-recognition paradigm sufficiently difficult to probe
pattern separation ability in h umans8 (Fig. 1a), our prior proof-of-concept study showed that a smaller-scale
flavanol-based dietary intervention resulted in improved performance on this task, supporting the hypothesis
that age-related modulations of function in the hippocampus in general, and the DG in particular, contributes
to cognitive a ging8.
Here, we aimed to replicate our initial findings at greater scale and conducted a 20-week placebo-controlled
cocoa flavanol-based clinical dietary intervention study in 211 healthy older participants. Expanding upon the
scope of our previous investigation, we included a broader intake amount range, investigated the role of baseline
diet quality on cognitive performance, and studied the persistence of flavanol intake-related effect after consump-
tion was discontinued. The aim of the trial was to investigate whether or not flavanol consumption improves
performance on a standard hippocampal-dependent declarative memory task (Fig. 1b) and a prefrontal cortex-
dependent list-sorting task (Fig. 1c).
Results
Study participants. Data collection began on Jan. 13, 2016 and ended on Nov. 21, 2018. A total of 2589
potential participants were screened, of whom 526 initially were eligible. 368 provided informed consent and 212
successfully completed the run-in phase. 211 (120 women, 91 men, 61.99 ± 6.44 years old) were randomized in
the main study stratified by age and sex, and 58 were randomly selected for the MRI substudy based on eligibility
and designed to evenly space the MRI data collection across the full three years of the main study enrollment.
Participants were randomly assigned to four different levels of flavanol intake: placebo/0 mg, n = 53; low intake,
n = 53; middle intake, n = 53; high intake, n = 52. In the substudy, 15, 14, 14, and 14 participants were randomized
to these four intake conditions respectively. Further details are presented in the CONSORT diagram (Fig. 2).
Scientific Reports | (2021) 11:3837 | https://doi.org/10.1038/s41598-021-83370-2 2
Vol:.(1234567890)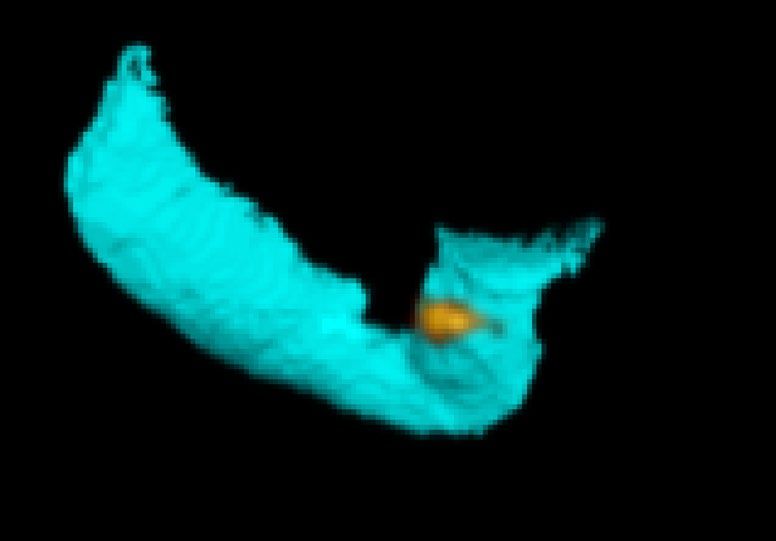
www.nature.com/scientificreports/
Prescreened (2589)
Ineligible (n=1707) Ineligible (n=35)
Age (n=65) Not Speaking English (n=5)
BMI (n=97) Alcoholism (n=2)
Not postmenopause (n=77) Study Screened (526) GAD (n=4)
Hormone replacement (n=82) PH (n=18)
Smoking (n=133) Study (n=1)
Diabetes (n=161) Vacation (n=5)
Mood disorder (n=175) LTF (n=85)
Consented (Cog+MRI) (n=368)
Diet related (n=119) Withdrawn (WD) (n=38)
MRI Branch (n=217)
Respiratory diseases (n=48)
Other Medical Issues (n=384)
Ineligible Post Consent (n=91)
Unwilling blood draw (n=81)
BMI (n=5)
Claustrophobic (n=139)
MOCA (n=66)
Gadolinium related (58)
Blood Pressure (n=4)
Metal device&dental work (n=86)
Other (n=16)
Lost to follow-up (LTF) (n=356)
LTF (n=24)
2 Weeks Run-In (n=253)
Run-In ineligible (n=24)
WD/LTF (n=17)
Baseline assignment (n=212)
MRI Branch (n=61)
Baseline Ineligible (n=1)
Randomized (Cog+MRI) (n=211)
MRI Branch (n=58)
Placebo (n=53) Low Intake Amount (n=53) Med Intake Amount (n=53) High Intake Amount (n=52)
MRI (n=15) MRI (n=14) MRI (n=15) MRI (n=15)
intervention
12 weeks
Wk 4 Neuropsych Wk 4 Neuropsych Wk 4 Neuropsych Wk 4 Neuropsych
(n=51) (n=52) (n=52) (n=51)
Wk1 2 Neuropsych(n=51) Wk 12 Neuropsych(n=51) Wk 12 Neuropsych(n=50) Wk1 2 Neuropsych(n=52)
MRI (n=14) MRI (n=10) MRI (n=13) MRI (n=12)
washout
8 weeks
Wk 20 Neuropsych Wk 20 Neuropsych Wk 20 Neuropsych Wk 20 Neuropsych
(n=49) (n=49) (n=49) (n=50)
Figure 2. CONSORT diagram.
Participant retention and adherence to the treatment protocol. 204 participants completed the
main study assessments after 12 weeks of dietary flavanol intake (204/211 = 97% retention rate) and 49 com-
pleted the MRI substudy. Demographic characteristics of the sample appear in Table 1. There were no serious
adverse events attributable to the trial. In the MRI substudy, one participant experienced a vasovagal reaction to
insertion of the IV line and another experienced nausea.
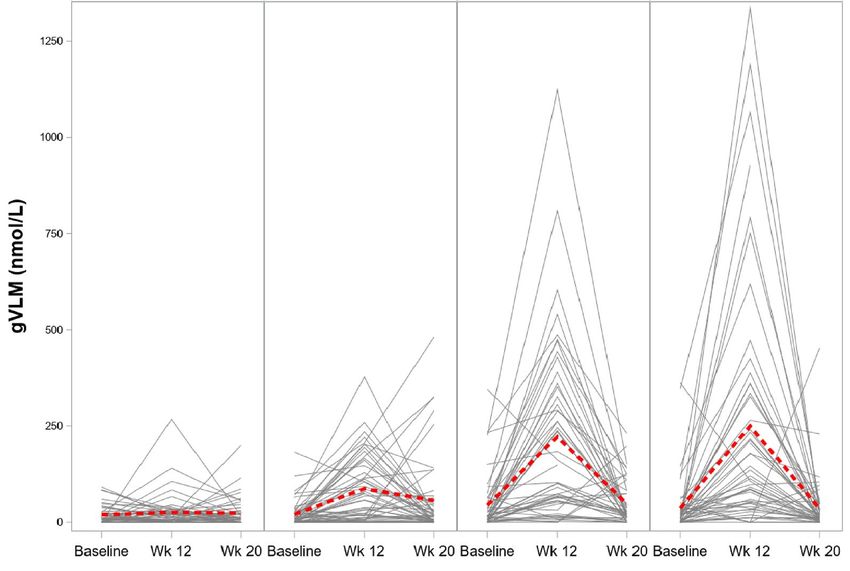
Blood tests at baseline and after 12 and 20 weeks revealed an intake amount-dependent increase then decrease
in gVLM, a biomarker of dietary flavanol intake (Fig. 3), demonstrating the bioavailability of flavanols from the
test materials and adherence to the interventions. 8 weeks after the end of the capsule intake period, gVLM levels
had returned to baseline levels.
Capsule count data were consistent with the gVLM assessment. Mean capsules consumed/day were 3.99 ± 1.11,
3.98 ± 0.55, 3.88 ± 0.29, and 3.85 ± 0.32 out of the required 4/day for the placebo, low, medium, and high flavanol
groups respectively. Adherence was not different across treatment groups.
As Table 1 indicates, covariate balance between randomized treatment groups was achieved for demographic
characteristics and baseline cognitive measures (all standardized mean differences (SMD) < 0.25). Non-trivial
imbalance due to chance randomization occurred between treatment groups on baseline DG-CBV (SMD = 0.44)
as is common given the smaller sample sizes selected to the MRI substudy. All analyses of treatment effects
controlled for baseline differences, sex, age, and education.
Object‑recognition performance. Baseline performance on the object-recognition task did not correlate
with aHEI (r = 0.027, p = 0.694), gVLM (r = − 0.059, p = 0.397), and surprisingly, it did not correlate with age
(r = 0.055, p = 0.428). There was no significant effect of 12 weeks of flavanol consumption on performance on this
task (p = 0.441, Table 2).
Scientific Reports | (2021) 11:3837 | https://doi.org/10.1038/s41598-021-83370-2 3
Vol.:(0123456789)www.nature.com/scientificreports/
Treatment Groups
Low flavanol intake Medium flavanol High flavanol intake
Total Samples (n = 211) Placebo group (n = 53) group (n = 53) intake group (n = 53) group (n = 53) Standardized
Mean Differences
Variables n Mean (SD) or % n Mean (SD) or % n Mean (SD) or % n Mean (SD) or % n Mean (SD) or % p value a
between groupsb
Demographics
Age (range 50–75) 211 61.99 (6.44) 53 62.35 (6.70) 53 61.88 (6.10) 53 61.65 (6.69) 52 62.07 (6.41) 0.955 0.059
Gender
Male 91 43.10% 22 41.50% 23 43.40% 23 43.40% 23 44.20% 0.994 0.027
Female 120 56.90% 31 58.50% 30 56.60% 30 56.60% 29 55.80%
Education Category
Bachelor’s or Less 116 55.00% 26 49.10% 30 56.60% 25 47.20% 35 67.30% 0.151 0.227
More than Bach-
95 45.00% 27 50.90% 23 43.40% 28 52.80% 17 32.70%
elor’s
Cognitive Measures
Baseline Novel
Object-Recog- 210 2680.6 (1309.4) 53 2807.98 (1733.36) 53 2579.94 (1026.18) 53 2603.65 (999.31) 53 2732.79 (1367.96) 0.785 0.104
nition
Baseline List-
208 38.96 (8.45) 53 38.91 (8.45) 52 37.25 (8.19) 52 39.75 (7.38) 51 39.96 (9.62) 0.349 0.177
Learning
Baseline List-
208 54.86 (8.94) 53 52.89 (8.85) 52 56.81 (8.91) 52 54.60 (9.15) 51 55.18 (8.65) 0.16 0.23
Sorting
MRI Measures
Baseline DG-CBV 57 2.15 (0.69) 15 2.44 (0.81) 14 2.17 (0.69) 14 2.11 (0.47) 14 1.85 (0.67) 0.153 0.442
Other relevant variables
aHEI 211 66.36 (12.0) 53 65.09 (11.44) 53 68.78 (10.82) 53 64.83 (14.3) 52 66.74 (10.84) 0.299 0.188
gVLM 208 30.44(55.84) 51 19.70 (24.23) 53 20.98 (34.28) 53 44.32 (72.4) 51 36.59 (72.06) 0.0617 0.267
Table 1. Demographics characteristics and cognitive and MRI measurements in study population at
baseline. a Baseline differences are assessed using F-tests (3 df) for continuous measures and chi-square
test (3 df) for dichotomous measures. b Standardized absolute mean differences is calculated as the average
absolute difference between all 6 comparisons of treatment groups divided by the overall standard deviation.
Values > 0.25 are considered to be non-trivial imbalance due to chance. aHEI, alternative Healthy Eating Index;
gVLM, 5-(3ʹ,4ʹ-dihydroxyphenyl)-γ-valerolactone metabolites; DG-CBV, dentate gyrus-cerebral blood volume.
Post-hoc analysis revealed technical issues in the implementation of the object-recognition task: only one
third of subjects performed the task at better than chance, based on the assumption that the percent accuracy
out of the 82 trials was expected to randomly fall with 95% certainty in the range from 40.2 to 59.7%. Thus, the
failure to support the primary hypothesis may have been due to problems with the psychometric properties of
the outcome measure.
List‑learning performance. We also tested the effect of flavanol intake on a hippocampal-dependent ‘list-
learning’ task. At baseline, performance on this task positively correlated with diet quality and habitual flavanol
intake, as measured by the aHEI (r = 0.141, p = 0.043) and the blood-based flavanol biomarker gVLM (r = 0.138,
p = 0.049), respectively. It also correlated with younger age (r = − 0.215, p = 0.002).
Controlling for age, sex, level of education, and baseline test performance, there was a significant intake level-
dependent treatment effect compared to placebo (one-tailed test of trend, p = 0.042; Table 2, Fig. 4a) after 12 weeks
of intervention. Furthermore, the effect of dietary flavanols on improvement in the task was associated with
baseline aHEI (Table 3). A marginally significant treatment by aHEI interaction was observed (F(6,186) = 1.87,
p = 0.088, Table 3). While the flavanol effect was observed across the cohort, a post-hoc exploration revealed
that the effect was driven primarily by participants with low scores of baseline aHEI (Fig. 4b). For those in the
bottom tertile of the aHEI at baseline, the effect of high flavanol intake on list learning was significantly greater
than placebo (Cohen’s d = 0.623, p = 0.012; Table 3).
The interaction between baseline gVLM levels and treatment was not statistically significant (F(6, 183) = 1.66,
p = 0.134), hence further interpretation of differential treatment effects by baseline gVLM should be considered
exploratory. After controlling for baseline list learning, sex, age, and education there was no significant associa-
tion with baseline gVLM levels (p = 0.831).
Finally, 8 weeks after cessation of flavanol consumption, there were no effects on list learning of the interven-
tion compared with placebo at any flavanol intake level, reflecting a return to baseline performance (one-tailed
test of trend across flavanol intake at 8 weeks after cessation, p = 0.485).
List‑sorting performance. We also assessed a list-sorting task that functionally localizes to the prefrontal
cortex. Baseline performance on this task trended towards an inverse relationship with the aHEI (r = − 0.13,
Scientific Reports | (2021) 11:3837 | https://doi.org/10.1038/s41598-021-83370-2 4
Vol:.(1234567890)www.nature.com/scientificreports/
Low Intake Medium Intake High Intake
Placebo Amount Amount Amount
Figure 3. Concentration of 5-(3ʹ,4ʹ-dihydroxyphenyl)-γ-valerolactone metabolites (gVLM) in plasma
at baseline, 12 weeks after daily intake of placebo and flavanols at a low (260 mg), medium (510 mg) and
high (770 mg) intake level, and at 20 weeks after washout (8 weeks). Data are presented as the individual
concentration of gVLM for each volunteer (black lines) and as the mean (red dashed line) over time.
Test of
Intake
amount
Between Response
Groups Low flavanol intake Vs. Placebo Medium flavanol intake Vs. Placebo High flavanol intake Vs. Placebo Effect
Adj Mean Cohen’s d Adj Mean Cohen’s d Adj Mean Cohen’s d
Measure Diff SE Effect sizea pb Diff SE Effect sizea pb Diff SE Effect sizea pb pc
Neurocognitive Measures
Novel Object-
− 8.917 154.92 − 0.007 0.954 − 147.065 155.426 − 0.112 0.345 21.693 156.072 0.017 0.890 0.441
Recognition
List-Learning 0.592 1.178 0.07 0.616 0.996 1.187 0.118 0.402 2.024 1.184 0.239 0.088 0.042
List-Sorting 0.416 1.444 0.047 0.773 − 0.16 1.45 − 0.018 0.912 − 1.245 1.444 − 0.139 0.389 0.172
MRI Measure
CBV − 0.084 0.253 − 0.122 0.743 − 0.165 0.238 − 0.24 0.493 0.169 0.262 0.246 0.524 0.307
Table 2. Mixed effects model results between treatment group effects at week 12 (end of treatment),
controlling for basline score, sex, age and education. Bold value indicates p < 0.05. a Cohen’s d effect size
calculated taking Adj Mean Diff divided by baseline measures standard deviation. b Two-sided p value for t-test
of treatment at each intake amount compared to placebo from longitudinal mixed effects model. c One-sided
p-vale for t-test of linear trend in treatment effects across groups from longitudinal mixed effects models. Adj
Mean Diff, adjusted mean difference; CBV, Cerebral Blood Volume.
p = 0.07) but was not associated with gVLM (r = 0.01, p = 0.85). There was no effect 12 weeks of flavanol con-
sumption on this task (p = 0.172, Table 2) and there were no observed interactions with baseline aHEI or gVLM.
CBV‑fMRI substudy. The DG, together with other regions of the hippocampus, extends for over 5 cm in its
long axis (Fig. 5a). Guided by our previous study, we established a predetermined region-of-interest (ROI) in the
middle of the DG (Fig. 5b), which we used to evaluate the effect of flavanol consumption by CBV-fMRI. There
was no effect of 12 weeks of flavanol consumption on CBV-fMRI (p = 0.307; Table 2, Fig. 5c). However, the effect
size for high intake versus placebo for CBV-fMRI (Cohen’s d = 0.246) was similar to that found for the list learn-
ing task and a significant effect was observed when not controlling for baseline performance (Supplementary
Scientific Reports | (2021) 11:3837 | https://doi.org/10.1038/s41598-021-83370-2 5
Vol.:(0123456789)www.nature.com/scientificreports/
a b
Mean List Learning Change from Baseline 4 10 Low aHEI n=69 Medium aHEI n=66 High aHEI n=67
Mean List Learning Change
3
5
2
0
1
0 -5
H Int A bo
ta Am nt
A unt
nt
H Int A bo
ta Am nt
A unt
nt
H Int A bo
ta Am nt
A unt
nt
o
nt
nt
nt
eb
h ke ou
ou
h ke ou
ou
h ke ou
ou
m ke ce
m ke ce
e ce
ou
ou
ou
ke o
ke o
ke o
ac
ig a m
m
ig a m
m
ig a m
m
iu ta Pla
iu ta Pla
iu nta Pla
m
m
m
Pl
A
A
A
e
e
e
m k
k
k
k
ta
ta
ta
ed w In
In
ed w In
In
In
In
In
In
ed w I
w
m
h
Lo
Lo
Lo
ig
Lo
iu
H
ed
M
M
M
M
Figure 4. Changes in List-Learning memory test before and 12 weeks after daily intake of placebo and flavanols
at a low (260 mg), medium (510 mg) and high (770 mg) intake level. Data are expressed as mean ± SE of all
volunteers (a) and divided in tertiles according to diet quality assessed with the alternative Healthy Eating Index
(aHEI; b).
Between
Groups Low aHEI at Baseline Medium aHEI at Baseline High aHEI at Baseline
Tests between
Intake Cohen’s d Cohen’s d Cohen’s d
amounts Adj Mean Diff SE Effect sizea pb Adj Mean Diff SE Effect sizea pb Adj Mean Diff SE Effect sizea pb
Low flavanol
intake vs 1.251 1.846 0.148 0.499 1.673 2.366 0.198 0.480 − 0.022 2.1 − 0.003 0.992
Placebo
Medium
flavanol intake 2.621 2.047 0.31 0.202 0.078 2.109 0.009 0.971 1.028 2.11 0.122 0.627
vs Placebo
High flavanol
intake vs 5.268 2.085 0.623 0.012 − 1.676 1.891 − 0.198 0.377 4.355 2.29 0.515 0.059
Placebo
Trend Test
across intake 0.011 0.271 0.051
amounts
Interaction test F-test
(aHEI vs intake (6,186) = 1.87,
amount) p = 0.088
Table 3. Test of differential effects between treatment groups on the List-Learning task at week 12 at different
tertiles divided according to alternative Healthy Eating Index (aHEI), controlling for baseline list learning, sex,
age, and education. Bold value indicates p < 0.05. a Cohen’s d effect size calculated taking Adj Mean Diff divided
by baseline measures standard deviation. b Two-sided p value for t-test of treatment at each intake amount
compared to placebo from longitudinal mixed effects model. Adj Mean Diff, adjusted mean difference;
Fig. 1). The sample size in the MRI substudy was originally based on power considerations assuming a much
larger effect size (expected Cohen’s d = 1.9) based our previous study8.
We then performed a voxel-based analysis to localize the flavanol effect in the hippocampus. Flavanol con-
sumption increased CBV that localized to the anterior head of the DG, at the outer boundaries of the ROI
(Fig. 5b), but in no other hippocampal regions.
Discussion
This study was designed to replicate and extend the findings from our previous study into a larger sample,
investigate a range of flavanol intake amounts, and assess the persistence of effects on cognitive function related
to multiple brain regions.
Scientific Reports | (2021) 11:3837 | https://doi.org/10.1038/s41598-021-83370-2 6
Vol:.(1234567890)www.nature.com/scientificreports/
a c
0.4
CBV Change from Baseline
SUB !"# 0.2
CA3 DG CA1
0.0
bb -0.2
CBV change
-0.4
o nt nt nt
eb ou ou ou
ROI ac
Pl Am Am Am
e e e
t ak t ak t ak
In In In
h
L ow ium H ig
ed
M
Figure 5. (a) Hippocampal sub-regions. (b) Predetermined region-of-interest (ROI) in the Dentate Gyrus used
to evaluate the effect of flavanol consumption by Cerebral Blood Volume (CBV)-fMRI. (c) Changes in CBV-
fMRI before and 12 weeks after daily intake of placebo and flavanols at a low (260 mg), medium (510 mg) and
high (770 mg) intake level. Data are expressed as mean ± SE adjusted by baseline values.
Flavanol intake did not improve performance on the object-recognition task, the study’s primary endpoint,
failing to replicate our previous findings. This failure to replicate tenably reflects technical limitations of the
newly developed object-recognition task. First, the task was designed to be difficult enough to stress the DG’s
purported function in pattern separation. However, post-hoc analysis suggested that the task, originally developed
with younger subjects, is so difficult that the majority of participants performed no better than chance, which
likely contributed to the failure to replicate. Challenges related to the level of difficulty of a given cognitive task,
especially when investigating the impact on cognition of nutrition- and life-syle modifications in generally
healthy individuals have been raised and discussed before1,9. The level of task difficulty seems to be a critical
factor, not just when choosing or designing a cognitive task for testing a specific hypothesis, but also when
interpreting outcomes and observed effects sizes. Thus, this notion is not exclusively relevant for discussing the
object-recognition task used here, but also applies the other cognitive tasks deployed here and elsewhere. It can
be anticipated that future deployment of difficulty-ranked cognitive assessments will help address this challenge.
Second, the standard list-learning memory task, a secondary outcome, is intuitively easy to understand and
perform. Our data demonstrate that list learning-task performance was improved by the dietary flavanol inter-
vention. It is noteworthy that the effect size for the observed improvements in this cohort of generally healthy
individuals seems to be directly related to habitual diet quality. Individuals with lower aHEI score more likely
experienced greater treatment effects. Our data also demonstrate that shifting flavanol intake back to reflect
habitual intake levels at baseline, causes an attenuation of memory performance gains within 8 weeks of inter-
vention cessation. This finding provides novel insights into the dynamics and functional plasticity of list-lerning
task performance in the context of nutrition, supporting the notion that this hippocampal-dependent task is
sensitive to relatively short-term dietary modifications.
While epidemiological studies as well as dietary interventions have previously demonstrated associations
between flavanol intake and cognitive performance1,2,9, detailed assessements of diet quality and habitual fla-
vanols intake in well-controlled dietary interventions in the context of cognitive performance and cognitive
aging are uncommon. Thus, our data on the link between habitual diet, baseline cognitive performance, and
intervention-based effect size may help explain some of the heterogenicity related to outcomes across previous
flavonoid-centric dietary interventions in the area of cognition, and they may also have utility in the context of
interpretating our findings in a broader population-based context. Although at the level of an individual, the
observed effect sizes were modest, especially when considered in the context of pharmaceutical treatments of
disease, similar scale improvements in the context of diet and lifestyle modifications have been shown to have
meaningful impact on health and disease risk reduction at the population level. For example, a small reduc-
tion in dietary salt intake can have a significant impact on coronary heart d isease10, small reductions in systolic
blood pressure are associated with a population-level reduction in heart failure e vents11, and a small fortification
of cereal grains with folic acid significantly reduces the prevalence of neurodevelopment birth defects in the
Scientific Reports | (2021) 11:3837 | https://doi.org/10.1038/s41598-021-83370-2 7
Vol.:(0123456789)www.nature.com/scientificreports/
opulation12. These and other studies show the benefits of population-based dietary advice and public health
p
interventions for conditions that normally occur in early or midlife13. This potential benefit is underscored by
a comparison of the aHEI scores in our study to those from the general US public. The median aHEI of study
participants was 66 (IQR 58 - 74). In NHANES, the mean aHEI was 39.0 (95% CI 38.9 39.8) in women and 35.7
(95% CI 34.9; 36.6) in men14, suggesting that the general US public has a poorer diet quality than the bottom
tertile of participants in this study, and may thus tenably experience cognitive benefits from increasing their
diet quality and flavanol intake.
This observation suggests the value of assessing diet quality to determine those individuals who may benefit
from flavanol supplementation. While these findings suggest the value of comprehensive measures of diet quality
and intake of specific nutrients/dietary constituents such as flavanols when investigating the effects of dietary
interventions on cognition, they require further study. The outcomes of an ongoing large-scale and long-term
dietary intervention trial, COSMOS15, may provide more conclusive answers.
In the context of neuroanatomical insights into cognitive aging, the well-established list learning performance
task was not explicitly developed to assess pattern separation. Studies suggest that performance on list-learning
trials of a declarative memory task depends, in part, on this computational o peration16 and that among hip-
pocampal regions, it differentially depends on the DG17,18. Further support for this interpretation comes from the
voxel-based analysis of the CBV-fMRI data obtained here. Although conducted only on a small subset of partici-
pants, the DG was the only hippocampal region that increased its basal metabolism after flavanol consumption.
The lack of an effect on the ROI analysis may be due to insufficient statistical power. Since pattern separation
occurs on a c ontinuum7, large-scale data will allow us to sort the items from the newly developed task by degree
of difficulty to compare performance on ‘hard’ vs. ‘easy’ items, further refining this task. An intriguing finding
is that flavanol intake improved performance on a hippocampal-dependent, but not on a prefrontal cortex task,
suggesting a regional specificity of the effect.
The principal limitation of the trial was the failure of the object-recognition task to perform as expected.
Designed to overcome the limitation of its predecessor, the Benton Visual Retention Task, originally designed
to test patients with profound cognitive i mpairments8, the newly developed task was designed to be more chal-
lenging so as to ‘stress’ the DG among healthy elders. Our finding, showing that most participants performed
no better than chance, suggests that it might be too challenging, compromising our ability to adequately test the
primary hypothesis.
A second limitation was the failure of randomization to produce treatment groups with approximately equiva-
lent levels of DG-CBV at baseline. After adjustment for these baseline levels, there was no effect of flavanols on
CBV. It is impossible to know whether the failure to detect an effect was the result of this randomization failure
or in fact, there is no effect on CBV.
We also considered the presence of the caffeine in our test materials (Table A, Supplementary Methods), and
would argue that this does not represent a confounder in this study and its outcomes interpretation. While the
effects of caffeine are well documented in the context of its transient impact on alertness, mood, arousal, and
concentration, to our knowledge, sustained beneficial effects of caffeine at intake amounts at or below 25 mg per
day on memory and cognitive performance have not been demonstrated by either epidemiological- or interven-
tion studies19,20. Moreover, 3 preceding dietary intervention studies in the context of which caffeine levels were
matched across treatment groups, clearly identified caffeine-independent effects of flavanol intake on various
measures of memory and cognitive performance8,21,22. In addition, as we were interested in the longer-term,
and not the acute effects of flavanols on memory and cognitive function, our study was designed to undertake
all cognitive performance tests at least 12 h after flavanol intake, thus excluding the potential transient impact
of caffeine on vasomotor function as well as on the other endpoints investigated. This is further supported by
measurements of caffeine in plasma collected at each study v isit23, which did not identify significant differences
in the levels of caffeine after test material intake (at baseline: 6 ± 6 µM; at week 12: 7 ± 9 µM; at week 20: 7 ± 9 µM;
average ± SD across all samples).
It is also noteworthy that this study was focused on participants with normal cognitive function, thus the
generalizability of our findings is limited and cannot be extended into patient populations with clinical manifesta-
tions of dementia or cognitive dysfunction. Finally, our study is limited by the intervention- and total observation
periods of 12 and 20 weeks, respectively. While ranking among the longer-term clinical dietary intverventions
undertaken in the field of polyphenols/nutrition and cognition, the study duration does represent a limitation.
In conclusion, this study raises the possibility that at the population level, flavanol-based dietary interven-
tions may have a beneficial impact on cognitive aging. Considering the increasing world-wide aging population
due to the overall reduction in late life morbidities, normal age-related memory decline is now considered an
impending cognitive epidemic24. In this context, dietary flavanols may offer meaningful benefits to cognitive
health, although further studies are needed. Replication of our findings at scale, potentially through ongoing
studies like C OSMOS15, may allow for an evidence-based assessment at the population level of the utility of
dietary flavanols to address the significant challenge of age-related cognitive decline in late life.
Methods
Design and ethics. This parallel-groups, 4-arm, placebo-controlled trial was approved by the Institutional
Review Board of the New York State Psychiatric Institute in accordance with the Helsinki Declaration of 1975 as
revised in 1983. Informed consent was obtained from all participants. The trial was registered with ClinicalTri-
als.Gov (NCT02312310).
Study participants. Study participants were 211 healthy, sedentary, normotensive older adults, 50–75 years
of age, with a BMI between 18.0 and 35.0 kg/m2, recruited by social media and radio ads from the metropolitan
Scientific Reports | (2021) 11:3837 | https://doi.org/10.1038/s41598-021-83370-2 8
Vol:.(1234567890)www.nature.com/scientificreports/
New York City area. All women were post-menopausal. Exclusion criteria included Montreal Cognitive Assess-
ment scores < 26, current depression or anxiety symptoms (PHQ-8 score > = 10 and/or GAD-7 score > = 10),
smoking, current or history of substance use, use of psychotropic medications, current psychiatric disorder,
habitual consumers of dietary or herbal supplements including Gingko, flavonoid, and dietary herbal or plant
extracts, lactose intolerance, and diabetes. MRI-related exclusion criteria appear in Supplementary Methods.
Study protocol. Participants deemed eligible by phone screening met with a study research assistant to
provide written informed consent and further determine eligibility. At the consent appointment, participants
were given the opportunity to enroll in an optional MRI substudy or only in the main study. Eligible participants
completed a 2-week run-in period, described below, then were scheduled for the time 0 neuropsychological
testing session and two weeks later, the time 1 measurement session, during which they provided a fasting blood
sample, ate a light breakfast, then completed another neuropsychological test battery, a dietary inventory, and if
enrolled in the optional substudy, an MRI study (described below). After completing these tests, they were ran-
domized to a treatment condition. After the 12-week intervention period, they returned for a post-intervention
testing session and then, 8 weeks later, a final testing session. Participants in the substudy had a second MRI
session immediately following the intervention period.
Test material description. The cocoa flavanol-based intervention materials were supplied in a capsule
format. Detailed information related to the test material characterization is provided in the Supplementary
Methods.
Run‑in period. During this two-week period, participants were to take two placebo capsules each morn-
ing and evening. If they consumed 80% of the capsules, as assessed by pill count, they qualified for continued
participation.
Treatment interventions. Participants were randomly assigned to four levels of daily dietary flavanol
intake for the 12-week intervention period: placebo (0 mg of Flavanols per day), 260 mg, 510 mg, and 770 mg
of Flavanols per day (for durther details, please see Supplementary Methods). Randomization was done using
computer-generated lists of random numbers via the randomly permuted block method and stratified by sex and
age group (50–63 and 64–74 years) for the overall study and for the MRI substudy. The allocation ratio to receive
placebo and the 3 flavanol interventions was 1:1:1:1. The allocation list was generated by MW, recruitment of
participants was conducted by VL, and allocation of participants was conducted by TF.
Blinding. All study staff as well as participants were blinded to treatment conditions, which were identified
only by randomly generated identifiers.
Laboratory testing sessions. Participants arrived at the Behavioral Medicine Laboratory at 8 am after an
overnight fast. After a venous blood draw, they received a light breakfast followed by a food frequency question-
naire (see below) and neuropsychology tests. Participants in the optional substudy then had an MRI scan.
Measurement of adherence to study protocol. Adherence to the study protocol was measured by
biological and behavioral assessments. gVLM, a flavanol metabolite and validated biomarker of intake23,25, was
measured at baseline and after the 12-week intervention. We also measured capsule counts from baseline to
week 12. Capsules taken were computed as the difference between the number of capsules provided and the
number remaining after the 12-week intervention.
Treatment assessments. Neuropsychological tests to assess cognitive performance. Neuropsychological
tests were conducted at weeks − 2, 0, 4, 12, and 20. The test session at week − 2 was administered to minimize
practice effects during the active study period and was not considered in analyses. The primary outcome meas-
ure was performance on an object-recognition task, the Modified Benton Recognition Task (Fig. 1a), previously
linked to DG function, and previously described8. A standardized list-learning memory test, the Modified Rey
Auditory Verbal Learning Test (Fig. 1b) was administered as a second hippocampal-mediated measure26. For
this test, the total number of words learned across three trials was the outcome measures. A List Sorting Working
Memory Test (Fig. 1c) from the NIH Toolbox Cognition Battery also was a dministered27.
MRI acquisition. Subjects eligible for cerebral blood volume (CBV)-fMRI scans received them at two times
(weeks 0 and 12), according to eligibility criteria as previously described8.
MRI processing. Whole brain CBV images were generated from the pair of pre- and post-contrast MRI
images as described previously8,28, and based on our previous findings, a region-of-interest was identified in the
body of the dentate gyrus (see Supplementary Methods).
Blood assays. A series of 5-(3ʹ,4ʹ-dihydroxyphenyl)-γ-valerolactone metabolites (gVLM) derived from fla-
vanol gut microbiome catabolism were measured in plasma at the Department of Nutrition at the University of
California, Davis as previously described29.
Scientific Reports | (2021) 11:3837 | https://doi.org/10.1038/s41598-021-83370-2 9
Vol.:(0123456789)www.nature.com/scientificreports/
Dietary assessment. We used the Block 2005 food frequency questionnaire (FFQ) (NutritionQuest,
Berkeley CA; (www.NutritionQuest.com) to estimate customary dietary intake. The food list for this question-
naire was developed from the NHANES III dietary recall data. The nutrient database was developed from the
USDA Nutrient Database for Standard Reference. Individual portion size was measured using pictures provided
by the FFQ. From these data, we computed the alternative Healthy Eating Index (aHEI)30,31.
Participant compensation. Participants were paid $40 for each of the five neuropsychology testing ses-
sions. If they consumed at least 90% of the total number of required capsules and completed all testing sessions,
they received an additional $50 for a possible total of $250. Participants in the optional MRI sub-study received
$70 for each of the two MRI scans.
Statistical analyses. Demographics, baseline cognitive, and imagining measures were summarized by ran-
domized treatment groups and differences tested using ANOVA and chi-square tests. Based on recommendation
not to focus on statistical tests of baseline differences we also calculated standardized absolute mean differences
as the average absolute difference between all 6 comparisons of treatment groups divided by the overall standard
deviation. Values > 0.25 are considered to be non-trivial imbalance due to chance. Pearson correlation coeffi-
cients were used to examine the association between baseline healthy eating, gVLM, and cognitive and imaging
measures.
The flavanol effect on the change in each outcome from baseline to 12 weeks was tested using linear mixed
effects models controlling for the respective baseline measures, four categories of treatment, sex, age, and educa-
tion. Regression adjusted mean within-group tests of change were estimated and tested for statistical significance
from the model. The primary test used for assessing the treatment effect was the linear trend contrast from the
model across: placebo, low, medium and high intake. The model for cognitive measures incorporated additional
outcome measurement times at 4 weeks and 20 weeks and included categorical time (4, 12, 20 weeks) as a pre-
dictor as well as a treatment (4 category) by time interaction, and a random intercept to control for repeated
measures within individuals (results for 4 and 20 weeks not presented). Additional regression models tested for
treatment effect modification by baseline healthy eating and gVLM. Specifically, the baseline values of the aHEI
or the gVLM were included in the mixed effects model along with its interaction with the 4 categories of with
treatment. To provide a more flexible relationship to be tested than simply linear associations, the aHEI and
gVLM measures were trichotomized into low, medium, and high values based on tertiles. Post-hoc tests of the
treatment effect within each tertile of aHEI and gVLMB were performed when the interaction test was found
to be significant at 0.10.
Analyses were carried out using SAS 9.4. Cohen’s d effect sizes were calculated for all treatment effect to
allow direct comparison of magnitude using the baseline standard deviation of each variable across all groups.
The planned sample size, i.e. 50 completers per treatment group, and 12 completers per treatment group in
the MRI sub-study, was based on power calculations based on data from the previous study to ensure at least 80%
power for the expected effects on the primary neurocognitive endpoint, i.e., the object-recognition task, and the
secondary MRI endpoint, i.e., CBV. The expected effect size of high intake versus placebo, Cohen’s d = 0.72, for
the object-recognition task, and Cohen’s d = 1.9 for CBV, were based on prior s tudies8.
Data availablity. The datasets generated during and/or analysed during the current study are available from
the corresponding author on reasonable request.
Clinical trial registry
clinicaltrials.gov Identifier: NCT02312310; (https://clinicaltrials.gov/ct2/show/NCT02312310).
Received: 1 October 2020; Accepted: 22 January 2021
References
1. Haskell-Ramsay, C. F., Schmitt, J. & Actis-Goretta, L. The impact of epicatechin on human cognition: the role of cerebral blood
flow. Nutrients 10, 986. https://doi.org/10.3390/nu10080986 (2018).
2. Jaeger, B. N., Parylak, S. L. & Gage, F. H. Mechanisms of dietary flavonoid action in neuronal function and neuroinflammation.
Mol. Asp. Med. 61, 50–62. https://doi.org/10.1016/j.mam.2017.11.003 (2018).
3. Small, S. A. Age-related memory decline; current concepts and future directions. Arch. Neurol. 58, 360–364 (2001).
4. Anguera, J. A. et al. Video game training enhances cognitive control in older adults. Nature 501, 97–101. https://doi.org/10.1038/
nature12486 (2013).
5. Adriano, F., Caltagirone, C. & Spalletta, G. Hippocampal volume reduction in first-episode and chronic schizophrenia: a review
and meta-analysis. Neuroscientist 18, 180–200. https://doi.org/10.1177/1073858410395147 (2012).
6. Brickman, A. M., Stern, Y. & Small, S. A. Hippocampal subregions differentially associate with standardized memory tests. Hip-
pocampus 21, 923–928. https://doi.org/10.1002/hipo.20840 (2011).
7. Yassa, M. A. & Stark, C. E. Pattern separation in the hippocampus. Trends Neurosci. 34, 515–525. https://doi.org/10.1016/j.
tins.2011.06.006 (2011).
8. Brickman, A. M. et al. Enhancing dentate gyrus function with dietary flavanols improves cognition in older adults. Nat. Neurosci.
17, 1798–1803. https://doi.org/10.1038/nn.3850 (2014).
9. Gratton, G. et al. Dietary flavanols improve cerebral cortical oxygenation and cognition in healthy adults. Sci. Rep. 10, 19409. https
://doi.org/10.1038/s41598-020-76160-9 (2020).
10. Bibbins-Domingo, K. et al. Projected effect of dietary salt reductions on future cardiovascular disease. N. Engl. J. Med. 362, 590–599.
https://doi.org/10.1056/NEJMoa0907355 (2010).
Scientific Reports | (2021) 11:3837 | https://doi.org/10.1038/s41598-021-83370-2 10
Vol:.(1234567890)www.nature.com/scientificreports/
11. Hardy, S. T. et al. Reducing the blood pressure-related burden of cardiovascular disease: impact of achievable improvements in
blood pressure prevention and control. J. Am. Heart Assoc. 4, e002276–e002276. https: //doi.org/10.1161/JAHA.115.002276 (2015).
12. Honein, M. A. Impact of folic acid fortification of the US food supply on the occurrence of neural tube defects. JAMA 285, 2981.
https://doi.org/10.1001/jama.285.23.2981 (2001).
13. Shan, Z. et al. Association between healthy eating patterns and risk of cardiovascular disease. JAMA Internal Med. 180, 1090–1100.
https://doi.org/10.1001/jamainternmed.2020.2176 (2020).
14. Wang, D. D. et al. Trends in dietary quality among adults in the United States, 1999 through 2010. JAMA Internal Med. 174,
1587–1595. https://doi.org/10.1001/jamainternmed.2014.3422 (2014).
15. Manson, J. E. COcoa Supplement and Multivitamin Outcomes Study (COSMOS). (2015).
16. Stark, S. M., Yassa, M. A., Lacy, J. W. & Stark, C. E. L. A task to assess behavioral pattern separation (BPS) in humans: data
from healthy aging and mild cognitive impairment. Neuropsychologia 51, 2442–2449. https://doi.org/10.1016/j.neuropsychologi
a.2012.12.014 (2013).
17. Mueller, S. G., Chao, L. L., Berman, B. & Weiner, M. W. Evidence for functional specialization of hippocampal subfields detected
by MR subfield volumetry on high resolution images at 4 T. NeuroImage 56, 851–857. https://doi.org/10.1016/j.neuroimage
.2011.03.028 (2011).
18. Aslaksen, P. M., Bystad, M. K., Ørbo, M. C. & Vangberg, T. R. The relation of hippocampal subfield volumes to verbal epi-
sodic memory measured by the California Verbal Learning Test II in healthy adults. Behav. Brain Res. 351, 131–137. https://doi.
org/10.1016/j.bbr.2018.06.008 (2018).
19. Nehlig, A. Is caffeine a cognitive enhancer?. J. Alzheimer’s Dis. : JAD 20(Suppl 1), S85-94. https://doi.org/10.3233/jad-2010-09131
5 (2010).
20. Zhou, A. et al. Habitual coffee consumption and cognitive function: a Mendelian randomization meta-analysis in up to 415,530
participants. Sci. Rep. 8, 7526. https://doi.org/10.1038/s41598-018-25919-2 (2018).
21. Desideri, G. et al. Benefits in cognitive function, blood pressure, and insulin resistance through cocoa flavanol consumption in
elderly subjects with mild cognitive impairment/novelty and significance. Hypertension 60, 794–801. https://doi.org/10.1161/
hypertensionaha.112.193060 (2012).
22. Mastroiacovo, D. et al. Cocoa flavanol consumption improves cognitive function, blood pressure control, and metabolic profile in
elderly subjects: the Cocoa, Cognition, and Aging (CoCoA) Study—a randomized controlled trial. Am. J. Clin. Nutr. https://doi.
org/10.3945/ajcn.114.092189 (2015).
23. Ottaviani, J. I. et al. Evaluation at scale of microbiome-derived metabolites as biomarker of flavan-3-ol intake in epidemiological
studies. Sci. Rep. 8, 9859. https://doi.org/10.1038/s41598-018-28333-w (2018).
24. Harada, C. N., Natelson Love, M. C. & Triebel, K. L. Normal cognitive aging. Clin. Geriatr. Med. 29, 737–752. https://doi.
org/10.1016/j.cger.2013.07.002 (2013).
25. Ottaviani, J. I. et al. Evaluation of (–)-epicatechin metabolites as recovery biomarker of dietary flavan-3-ol intake. Sci. Rep. 9, 13108.
https://doi.org/10.1038/s41598-019-49702-z (2019).
26. Hale, C. et al. The ModRey: an episodic memory test for nonclinical and preclinical populations. Assessment https://doi.
org/10.1177/1073191117723113 (2017).
27. Tulsky, D. S. et al. NIH Toolbox Cognition Battery (NIHTB-CB): list sorting test to measure working memory. J. Int. Neuropsychol.
Soc. 20, 599–610. https://doi.org/10.1017/S135561771400040X (2014).
28. Khan, U. A. et al. Molecular drivers and cortical spread of lateral entorhinal cortex dysfunction in preclinical Alzheimer’s disease.
Nat. Neurosci. 17, 304–311. https://doi.org/10.1038/nn.3606 (2014).
29. Ottaviani, J. I. et al. The metabolome of [2–14C](−)-epicatechin in humans: implications for the assessment of efficacy, safety, and
mechanisms of action of polyphenolic bioactives. Sci. Rep. 6, 29034. https://doi.org/10.1038/srep29034 (2016).
30. Chiuve, S. E. et al. Alternative dietary indices both strongly predict risk of chronic disease. J. Nutr. 142, 1009–1018. https://doi.
org/10.3945/jn.111.157222 (2012).
31. McCullough, M. L. et al. Diet quality and major chronic disease risk in men and women: moving toward improved dietary guid-
ance. Am. J. Clin. Nutr. 76, 1261–1271. https://doi.org/10.1093/ajcn/76.6.1261 (2002).
Author contributions
S.A.S. and R.P.S. designed research (project conception, development of overall research plan, and study over-
sight); R.P.S., A.M.B., and V.L. conducted research (hands-on conduct of the experiments and data collection);
H.S. provided guidance in selecting flavanol intake amounts for the intervention and in generating the flavanol
biomarker data; F.P., X.F., and L.-K.Y. performed the image analysis; M.W. and T.F. performed statistical analy-
sis; S.A.S. and R.P.S. wrote paper (only authors who made a major contribution); S.A.S. and R.P.S. had primary
responsibility for final content.
Funding
This investigator-initiated study that wasin part funded by Mars, Inc., R61 MH112800 (SAS), R01 AG058417
(RPS), and the Nathaniel Wharton Fund.
Competing interests
HS is employed by Mars, Incorporated, a company engaged in flavanol research and flavanol-related commercial
activities. SAS has received an unrestricted research grant from Mars, Incorporated. None of the other authors
has a conflict of interest to declare.
Additional information
Supplementary Information The online version contains supplementary material available at https://doi.
org/10.1038/s41598-021-83370-2.
Correspondence and requests for materials should be addressed to R.P.S. or S.A.S.
Reprints and permissions information is available at www.nature.com/reprints.
Publisher’s note Springer Nature remains neutral with regard to jurisdictional claims in published maps and
institutional affiliations.
Scientific Reports | (2021) 11:3837 | https://doi.org/10.1038/s41598-021-83370-2 11
Vol.:(0123456789)www.nature.com/scientificreports/
Open Access This article is licensed under a Creative Commons Attribution 4.0 International
License, which permits use, sharing, adaptation, distribution and reproduction in any medium or
format, as long as you give appropriate credit to the original author(s) and the source, provide a link to the
Creative Commons licence, and indicate if changes were made. The images or other third party material in this
article are included in the article’s Creative Commons licence, unless indicated otherwise in a credit line to the
material. If material is not included in the article’s Creative Commons licence and your intended use is not
permitted by statutory regulation or exceeds the permitted use, you will need to obtain permission directly from
the copyright holder. To view a copy of this licence, visit http://creativecommons.org/licenses/by/4.0/.
© The Author(s) 2021
Scientific Reports | (2021) 11:3837 | https://doi.org/10.1038/s41598-021-83370-2 12
Vol:.(1234567890)You can also read