Ability of an Australian reanalysis dataset to characterise sub-daily precipitation
←
→
Page content transcription
If your browser does not render page correctly, please read the page content below
Hydrol. Earth Syst. Sci., 24, 2951–2962, 2020
https://doi.org/10.5194/hess-24-2951-2020
© Author(s) 2020. This work is distributed under
the Creative Commons Attribution 4.0 License.

Ability of an Australian reanalysis dataset to
characterise sub-daily precipitation
Suwash Chandra Acharya1 , Rory Nathan1 , Quan J. Wang1 , Chun-Hsu Su1,2 , and Nathan Eizenberg2
1 Department   of Infrastructure Engineering, the University of Melbourne, Melbourne, Australia
2 Bureau   of Meteorology, Melbourne, Australia

Correspondence: Suwash Chandra Acharya (suwasha@student.unimelb.edu.au)

Received: 19 August 2019 – Discussion started: 3 September 2019
Revised: 14 April 2020 – Accepted: 2 May 2020 – Published: 4 June 2020

Abstract. The high spatio-temporal variability of precipi-         especially at sub-daily resolutions. Users of BARRA are rec-
tation is often difficult to characterise due to limited mea-      ommended to properly account for possible spatio-temporal
surements. The available low-resolution global reanalysis          displacement errors, especially for applications where the
datasets inadequately represent the spatio-temporal variabil-      spatial and temporal characteristics of rainfall are deemed
ity of precipitation relevant to catchment hydrology. The          very important.
Bureau of Meteorology Atmospheric high-resolution Re-
gional Reanalysis for Australia (BARRA) provides a high-
resolution atmospheric reanalysis dataset across the Aus-
                                                                   1   Introduction
tralasian region. For hydrometeorological applications, how-
ever, it is essential to properly evaluate the sub-daily precip-   Precipitation is highly variable across both space and time,
itation from this reanalysis. In this regard, this paper eval-     especially at spatial and temporal scales relevant to catch-
uates the sub-daily precipitation from BARRA for a period          ment hydrology (Michaelides et al., 2009). An understand-
of 6 years (2010–2015) over Australia against point observa-       ing of the spatio-temporal pattern of precipitation is vi-
tions and blended radar products. We utilise a range of ex-        tal for many scientific and operational applications, such
isting and bespoke metrics for evaluation at point and spatial     as hydro-climatic modelling and the forecasting of floods
scales. We examine bias in quantile estimates and spatial dis-     (Golding et al., 2016; Kucera et al., 2013; Paschalis et al.,
placement of sub-daily rainfall at a point scale. At a spatial     2014). This understanding relies on access to high-resolution
scale, we use the fractions skill score as a spatial evaluation    precipitation datasets. However, the availability of fine-
metric. The results show that the performance of BARRA             scale precipitation products (e.g. spatial resolution less than
precipitation depends on spatial location, with poorer per-        around 0.25° on an hourly timescale) are limited. The gen-
formance in tropical relative to temperate regions. A possi-       eral sources of precipitation data are gauge measurements,
ble spatial displacement during large rainfall is also found at    ground-based radars, satellites, and atmospheric reanalysis
point locations. This displacement, evaluated by comparing         models (Michaelides et al., 2009). Gauge measurements,
the distribution of rainfall within a day, could be quantified     which are localised in nature, are hindered by the sparse
by considering the neighbourhood grids. On spatial evalua-         and uneven distribution of gauge networks, whereas the cov-
tion, hourly precipitation from BARRA is found to be skilful       erage of ground-based radars is limited. Global reanalysis
at a spatial scale of less than 100 km (150 km) for a thresh-      datasets (e.g. NCEP-CFSR, Saha et al., 2010; ERA-Interim,
old of 75th percentile (90th percentile) at most of the loca-      Dee et al., 2011; JRA-55, Kobayashi et al., 2015) and satellite
tions. The performance across all the metrics improves sig-        products (e.g. TMPA, Huffman et al., 2007; IMERG, Huff-
nificantly at time resolutions higher than 3 h. Our evaluations    man et al., 2018) provide a continuous and consistent esti-
illustrate that the BARRA precipitation, despite discernible       mate at varying spatial (0.05 to 2.5◦ ) and temporal resolution
spatial displacements, serves as a useful dataset for Australia,   (hourly to daily).

Published by Copernicus Publications on behalf of the European Geosciences Union.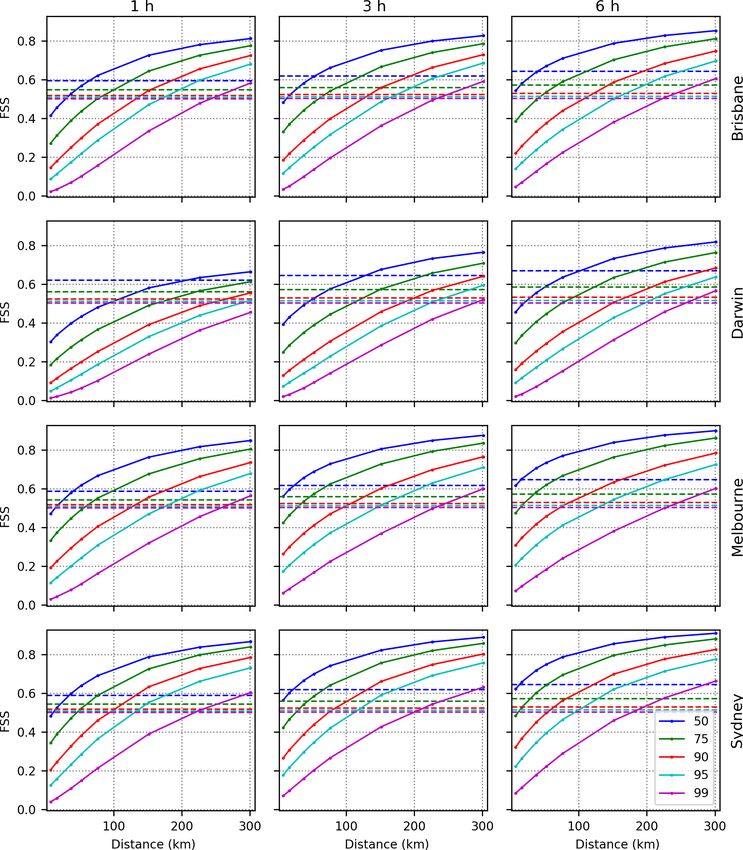
2952                                                    S. C. Acharya et al.: Evaluation of sub-daily reanalysis precipitation

   An atmospheric reanalysis merges observations and mod-          proach which considers likely displacements in space and
els to provide four-dimensional earth system data at a regular     time (Gilleland et al., 2009; Jermey and Renshaw, 2016;
spatial and temporal resolution over a long time period, of-       Thiemig et al., 2012). For example, when evaluating heavy-
ten years and decades (Parker, 2016). The variables in the         rainfall events at a point scale, Thiemig et al. (2012) adopted
reanalysis (such as precipitation, cloud, and soil moisture)       an error metric that explicitly considers possible time lags in
are related to one another through modelled physical rela-         the gridded dataset. Similarly, Jermey and Renshaw (2016)
tions and to the analysed observations. By undertaking mod-        considered temporal displacement while evaluating the pre-
elling over a limited area, a regional atmospheric reanalysis      cipitation by grouping the events into seven synthetic cate-
can provide precipitation estimates at finer spatial and tem-      gories with varying temporal shift and bias structure. Besides
poral scales than a global reanalysis. It can incorporate more     these methods which look at temporal displacement, a pos-
observations at a finer scale to better constrain the evolution    sible shift across space can be considered when evaluating
of a higher-resolution model and thus can account for the          high-resolution precipitation datasets. However, such evalu-
effects of mountains, coastlines, and mesoscale atmospheric        ations may be limited by the availability of suitable gridded
circulations in greater detail. Such analyses can thereby pro-     observation data for comparison, and it is thus preferable to
vide precipitation estimates with greater spatial relevance to     undertake assessments using multiple evaluation techniques
local fine-scale studies than coarser-scale models. BARRA          (Jermey and Renshaw, 2016).
(Bureau of Meteorology Atmospheric high-resolution Re-                The metrics used to undertake the evaluation need to
gional Reanalysis for Australia) is one such high-resolution       match the prospective use of the dataset. For example, it may
(∼ 12 km) regional reanalysis (BARRA-R). It is driven with         be sufficient for some urban and storm water design problems
initial and boundary conditions from the global ERA-Interim        to only evaluate the non-conditional frequency distribution of
reanalysis (∼ 79 km) and provides estimates over the Aus-          precipitation at a point. However, for most hydrological mod-
tralasian region from 1990 to 2018 (Jakob et al., 2017; Su         elling purposes, it is necessary to evaluate the representation
et al., 2019).                                                     of spatio-temporal characteristics of rainfall events over the
   BARRA-R (referred to here as simply BARRA) provides             catchment of interest. The spatial and temporal resolution of
hourly precipitation estimates at 12 km horizontal resolution      the prospective applications also play a critical role in selec-
(Jakob et al., 2017; Su et al., 2019). Rainfall observations       tion of the performance measures, so it is useful to assess the
are not assimilated in this reanalysis, and precipitation is es-   efficacy of the reanalysis over a range of different temporal
timated by model physics and parameterisation. Evaluating          and spatial accumulations.
its suitability for scientific studies and its use in hydrologi-      The objective of this paper is to present an evaluation of
cal applications can be facilitated by identifying its strengths   sub-daily BARRA precipitation at temporal and spatial reso-
and limitations through a quantitative assessment. An ini-         lutions that are relevant to catchment hydrology applications.
tial assessment of daily precipitation from BARRA showed           The evaluation is undertaken using ground measurements
that it was able to reproduce the precipitation statistics and     and radar-based rainfall observations across Australia over
large precipitation amounts at point (gauged locations) and        a 6-year period spanning 2010–2015. Following the assess-
grid scales of 5 km (Acharya et al., 2019; Su et al., 2019).       ment of BARRA at a daily scale (Acharya et al., 2019), this
However, precipitation data at sub-daily temporal resolutions      study further explores BARRA precipitation at different time
are essential to support the application of flood modelling        accumulations ranging from hourly to daily. In addition, we
(Chiaravalloti et al., 2018) and analysis of precipitation ex-     compare the temporal distribution of gauged rainfalls with
tremes in convective systems. Therefore, it is useful to assess    neighbouring grids, specifically for large rainfall events. We
the performance of BARRA at sub-daily resolution along             also employ a spatial evaluation metric (Roberts and Lean,
with its ability to represent the spatial structure of rainfall    2008) to evaluate the ability of the reanalysis dataset to rep-
events.                                                            resent the spatial distribution of rainfalls against a gauge-
   The performance of BARRA at a daily scale was sum-              corrected radar dataset. Overall, our aim is to assess the abil-
marised using continuous metrics and categorical metrics           ity of BARRA to capture the behaviour of sub-daily precip-
at both point and grid scales (Acharya et al., 2019). How-         itation at the catchment scale, particularly for large events.
ever, at sub-daily scales, such one-on-one evaluations can be      To this end, we use a combination of existing and bespoke
misleading for several reasons (Jermey and Renshaw, 2016).         metrics to evaluate performance over different temporal and
First, sub-daily precipitation is dominated by zero values and     spatial accumulations in different climatic zones.
has a highly skewed distribution, which makes it difficult to
interpret the correlation statistics. In addition, these metrics
doubly penalise a modelled rainfall field that is displaced        2   Study area and data sources
in space or time: once as a missed observation and again
as a false alarm. This situation is popularly known as the         The primary sources of reference data used to evaluate the
“double-penalty problem” (Rossa et al., 2008), and to mit-         performance of BARRA data were derived from pluviome-
igate this issue it is necessary to adopt an evaluation ap-        ter gauges and radar-based products. Ground-based obser-

Hydrol. Earth Syst. Sci., 24, 2951–2962, 2020                                       https://doi.org/10.5194/hess-24-2951-2020
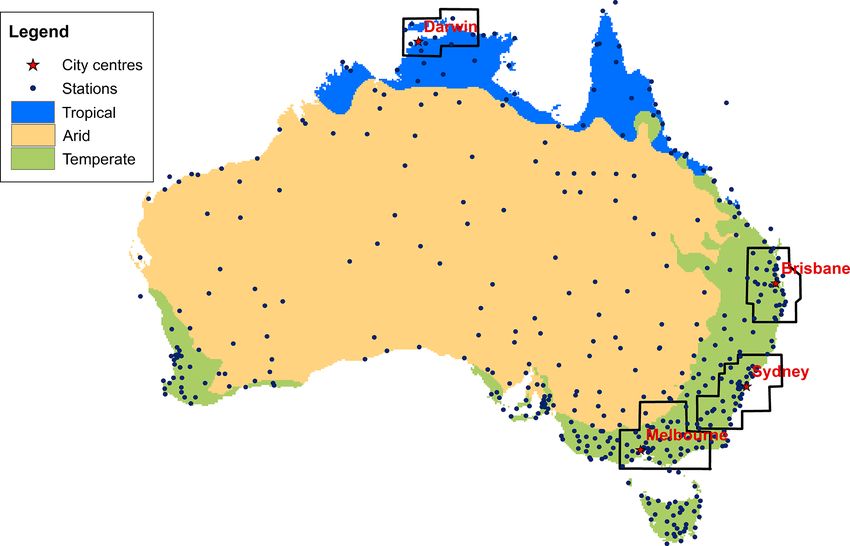
S. C. Acharya et al.: Evaluation of sub-daily reanalysis precipitation                                                        2953

vations are not assimilated in BARRA, and thus these data          to 19.4◦ N, 65.0 to 196.9◦ E at a spatial resolution of 0.11◦
serve as an independent dataset for evaluation. The plu-           (approximately 12 km) and with 70 levels up to 80 km into
viometer observations in this study encompass three of the         the atmosphere. The model includes a comprehensive set
broad climatic zones across Australia, namely tropical, tem-       of parameterisations, including a modified boundary layer
perate, and arid (Fig. 1). Rainfall in Australia is highly vari-   scheme, mixed-phase cloud microphysics, a mass flux con-
able across space and time. Rainfall is concentrated during        vection scheme, and a radiation scheme. The model parame-
summer in the tropical north, whereas rainfall is more preva-      terisation in BARRA is mainly inherited from the UK Met
lent during winter in the temperate south and southwest.           Office Global Atmosphere (GA) 6.0 configurations as de-
The southeast region experiences a more consistent rainfall        scribed in Walters et al. (2017). Observations from land sur-
throughout the year. The central arid region receives the least    face stations, ships, buoys, aircrafts, radiosondes, and satel-
total rainfall, and the eastern coast the highest average rain-    lites are assimilated in BARRA, conducted 4 times a day
fall. The spatial evaluation across the whole of Australia is      with a 6 h analysis window centred at time t0 = 00:00, 06:00,
impeded by the availability of a high-resolution observation-      12:00, and 18:00 UTC. Surface and satellite rainfall obser-
based dataset. Therefore, the spatial evaluation is undertaken     vations are not assimilated, and the precipitation fields are
by using radar-based datasets at four city-centred regions         determined by the modelled dynamics. In particular, they are
(Brisbane, Darwin, Melbourne and Sydney). These study ar-          estimated from the 12 h forecast runs of the UM from t0 −3 h,
eas are located in the tropical and temperate zones with vary-     using the microphysics scheme based on Wilson and Ballard
ing rainfall climates.                                             (1999) and the mass flux convective parameterisation scheme
   Hourly rainfall observations from pluviometer gauges            of Gregory and Rowntree (1990). The former describes the
were obtained from the Australian Bureau of Meteorology.           atmospheric processes that transfer water between the vari-
Observations from a total of 441 gauges were selected, cov-        ous states of water to remove moisture resolved on the grid
ering a common period of record between 2010 and 2015              scale. At 12 km horizontal resolution, BARRA requires the
(Fig. 1). The observed rainfall is used to approximate pre-        convection scheme to model sub-grid-scale convection us-
cipitation as most precipitation in Australia is in the form of    ing an ensemble of cumulus clouds as a single entraining–
rainfall.                                                          detraining plume (Clark et al., 2016). The scheme prevents
   The blended radar precipitation dataset was also obtained       unstable growth of cloud structures on the grid and explicit
from the Australian Bureau of Meteorology for regions sur-         vertical circulations, and can only predict an area-average
rounding the four city centres (Fig. 1). The spatial resolution    rainfall instead of a spectrum of rainfall rates. This parame-
of the radar data is 1.5 km, and it is only available from 2014.   terisation scheme adopted for sub-grid convection is limiting
The radar fields have been blended with the observed rainfall      in resolving convective rainfall and affects the locations dom-
using conditional merging (Sinclair and Pegram, 2005). The         inated by such rainfall (especially the tropics). Further details
approach is in principle close to a copula-based approach,         on parameterisation and assimilation schemes in BARRA are
which exhibits less bias and yields a smaller error metric         provided by Su et al. (2019).
compared to non-parametric radar rainfall estimation (Hasan
et al., 2016). The blended radar estimates are still likely to
be erroneous and biased for reasons that include errors in         3     Methodology
reflectivity measurement (e.g. radar beam overshoot, terrain
blocking, and clutter), inaccurate radar reflectivity–rain rate    Hourly BARRA precipitation estimates at 12 km resolution
relationship, tendency of the radar to underestimate rainfall at   are evaluated at varying spatial and temporal scales. A range
distance, and quality control algorithms rejecting gauge data      of point-to-grid and grid-to-grid evaluations are undertaken
used for bias adjustment (Chumchean et al., 2006; Seo et al.,      using gauged rainfall and blended radar estimates over vari-
2010). Further, there is a fundamental difference in represen-     ous temporal and spatial scales.
tativity between radar measurements and modelled precipita-
tion, where radar infers precipitations at height over a cubic     3.1    Frequency distribution of sub-daily rainfall
kilometre in size. However, we follow prior studies (e.g. Mit-
termaier et al., 2013; Roberts and Lean, 2008) and use radar       A point-to-grid analysis is undertaken to evaluate the sub-
rainfall to compare spatial rainfall at sub-daily time steps as-   daily frequency distribution of BARRA precipitation. At
suming that the spatial distribution of rainfall is preserved.     each gauge location as shown in Fig. 1, corresponding
In addition, we apply quantile-based thresholds in order to        BARRA estimates are obtained using the nearest-neighbour
remove the potential bias in the daily rainfall totals, although   interpolation. The basis of comparison requires some thought
we note the strategy remains limited by the fact that the bias     as the fraction of zero values in sub-daily rainfall data is high
is spatially varying.                                              (the 95 % quantiles at hourly temporal resolution are zero).
   BARRA utilises the Met Office Unified Model (UM;                This issue could be addressed by selecting suitable condi-
Davies et al., 2005) and its 4D variational data assimila-         tional thresholds, though different thresholds would need to
tion system (4D Var). BARRA extends spatially over −65.0           be adopted for each temporal accumulation. For example, a

https://doi.org/10.5194/hess-24-2951-2020                                       Hydrol. Earth Syst. Sci., 24, 2951–2962, 2020
2954                                                        S. C. Acharya et al.: Evaluation of sub-daily reanalysis precipitation

Figure 1. Study area with locations of pluviometer gauges (points) and the radar data (boxes surrounding city centres). The locations of radar
datasets are the Darwin, Brisbane, Sydney, and Melbourne regions. The climatic classification is adapted from Peel et al. (2007).

threshold of 0.1 mm h−1 could be adopted for hourly data and             are not able to penalise intensity and location errors in a
1 mm d−1 for daily data. However, the slight problem with                desirable manner (Rossa et al., 2008). Performance metrics
this approach is that any trends in the performance metric               which compare point observations with model estimates av-
with temporal accumulation will be confounded by the some-               eraged over a grid cell are heavily influenced by errors in
what arbitrary choice of thresholds for intermediate tempo-              the spatial pattern and location of rainfall events, even if the
ral accumulations (3, 6, and 12 h). Accordingly, we derived              average rainfall depths over the local domain are the same.
quantiles for sub-daily rainfalls that occurred only on the rain         This is particularly the case with high-resolution precipita-
days for each dataset individually, where a “rain day” is de-            tion datasets and with the analysis of sub-daily periods.
fined based on a threshold of 1 mm d−1 (Ebert et al., 2007).                To mitigate this problem in a gauge-based evaluation,
   In investigating the frequency of rainfall, we compute the            we adopt an approach that allows for possible timing and
various quantiles (80, 90, 95, and 99 %) at different time ac-           displacement differences in rainfall occurrence. The ap-
cumulations (1, 3, 6, 12, and 24 h). The analysis of frequen-            proach is similar to the neighbourhood (or “fuzzy”) ap-
cies corresponding to different accumulations (up to 24 h) is            proach used with single observation-neighbourhood fore-
selected to be of relevance for design rainfall applications.            casts (Ebert, 2008), in which gridded observations were eval-
We then estimate percentage bias using (m − o)/o × 100,                  uated against gridded forecasts. This method accounts for sit-
where m and o denote the reanalysis and observed precipi-                uations where an event defined on the basis of gauge mea-
tation corresponding to the selected quantiles, respectively.            surements may miss the nearby grid cell, resulting in spatial
This evaluation is further stratified across three broad cli-            error, and/or appear non-coincident at the nearby grid cell
matic zones (arid, tropical, and temperate) as defined by the            signifying a temporal error. For the former case, an evalua-
Köppen–Geiger classification (Peel et al., 2007; Fig. 1). It is          tion that considers neighbouring grid cells can account for
worth noting that comparisons of point (gauged) and areal                spatial errors. For cases involving a time displacement, a
(gridded) rainfall are generally biased as the average precipi-          moving storm may appear at a neighbouring grid cell at the
tation over a grid cell is lower than rainfall recorded at a par-        time step under consideration, approaching the nearby grid
ticular point. It would also be expected that sub-daily point            cell.
rainfalls are more variable than those averaged over a grid                 To account for these different types of errors, we employ
cell area.                                                               an analysis that explicitly considers the occurrence and tim-
                                                                         ing of rainfalls at neighbouring grid cells. This evaluation
3.2    Neighbourhood-based sub-daily patterns at point                   is undertaken by selecting large rainfall events (greater than
       locations                                                         10 mm d−1 ) in the gauge dataset. The cumulative fraction
                                                                         of rainfall over the day is computed for the gauge and the
A direct comparison of precipitation, especially in higher-              nearest neighbouring grid (Eq. 1). The squared difference in
resolution datasets, is difficult as the conventional metrics            the fraction of cumulative rainfall occurring in each hour be-

Hydrol. Earth Syst. Sci., 24, 2951–2962, 2020                                               https://doi.org/10.5194/hess-24-2951-2020
S. C. Acharya et al.: Evaluation of sub-daily reanalysis precipitation 2955
tween the gauge and reanalysis rainfalls is then averaged to rate is selected for both the observed and modelled grid cells.
provide an error score (Eq. 2). An increasing window of size n × n centred on a particular
h
X grid is selected (which yields N windows over the whole do-
Fh = fi , 1 ≤ h ≤ 24, (1) main). For each window i, a fraction of grid points exceeding
i=1 the threshold in observed rainfall (po,i ) and modelled rainfall
where fi is the fraction of daily rainfall occurring at the ith (pm,i ) are computed. Then, the FSS is calculated as
hour. 2
1 PN
23 N i=1 pm,i − po,i
1 X 2 FSS = 1 − N N
. (3)
Error score = Fh,model − Fh,gauge (2) 1 P 2 1 P 2
23 h=1 N i=1 pm,i + N i=1 po,i
Note that 23 is used in the denominator as F24,model = The FSS score varies between 0 and 1. A score of 0 repre-
F24,gauge = 1 and is not included in the computation of the er- sents a complete mismatch between two rainfall fields, and
ror score. The temporal error is considered by using cumula- a score of 1 represents a perfect match. Usually, FSS is
tive precipitation at a daily scale, which penalises large tem- computed for varying sizes of spatial windows, and results
poral errors more than small ones. Similarly, to account for are plotted as a function of window size. A random score
possible spatial displacement, we analyse the temporal dis- (FSSrandom ) is the FSS that would be achieved, on average, by
tribution of precipitation by searching over neighbourhood a random field with the same fraction of observed events (po )
space to find the best-performing grid cell. The error score over the domain. A benchmark score, a target or “uniform”
is computed for both the nearest grid and the neighbourhood skill (FSSuniform ), is given to a uniform field with a probabil-
grid cells equidistant from the nearest grid. The minimum ity of occurrence equal to po at each grid cell (Roberts and
error score is selected and then averaged across all rainfall Lean, 2008). FSSuniform is expressed as 0.5 + po /2, which
events at a location. is halfway between a perfect score (1) and a random score
The average error score varies between 0 and 1. A score (FSSrandom = po ). This FSSuniform can be approximated to
of 1 represents the worst-possible situation in which rainfall 0.5 when po is small, as in the case of larger precipitation
occurs in the first hour in one dataset and the last hour in thresholds.
the other. Conversely, a score of 0 indicates a perfect match The thresholds used to calculate FSS are based on rain-
between observations and model estimates. Scores between fall quantiles in observed and reanalysis data which are de-
0 and 1 indicate differing degrees of temporal error, where, rived for each time step. A rainfall intensity greater than
for example, a score of 0.33 indicates that rainfall occurs in 0.2 mm h−1 is used as a threshold to define a rainy grid cell
either the first or last hour in one dataset and is distributed for which quantile-based thresholds are computed. This en-
uniformly throughout the day in the other. sures that the model and observed rainfall fields have an iden-
tical fraction of rain events for each threshold value. The ap-
3.3 Neighbourhood-based spatial evaluation plication of quantile-based thresholds aims to remove the im-
pact of any bias in rainfall amount and focus solely on spa-
Finally, a spatial evaluation of reanalysis precipitation tial accuracy of modelled precipitation (Mittermaier et al.,
against blended radar estimates is undertaken. For each 2013; Roberts and Lean, 2008; Skok and Roberts, 2018).
spatial domain, the largest 25 rainfall events to have oc- It is worth noting that the FSS metric only provides infor-
curred over the 3-year period are selected based on domain- mation on variation of performance with increasing spatial
averaged daily precipitation. Radar precipitation, which is scale. The timing errors at finer temporal scales can be in-
available as 30 min accumulations, is aggregated to hourly directly discerned by analysing variation of FSS with time
values to match the temporal resolution of BARRA. Simi- accumulations. Therefore, the FSS is evaluated at temporal
larly, a common spatial resolution is adopted. The precipita- aggregations of 3 and 6 h.
tion from BARRA (∼ 12 km) is re-gridded to the resolution
of the radar grid (∼ 1.5 km) using area-weighted re-gridding,
which means that single BARRA precipitation estimates are 4 Results
distributed over 8 × 8 radar grid cells.
Different metrics have been developed for undertaking 4.1 Frequency distribution of sub-daily rainfall
spatially variable evaluations (Ebert, 2008, 2009). This study
adopts the fractions skill score (FSS) from Roberts and Lean Figure 2 illustrates the spatial distribution of quantile bias
(2008), as it measures the variation of skill across increasing and its summary across climatic zones. Overall, the spatial
spatial scales and hence indicates the minimum spatial scale distribution of bias across all time accumulations and quan-
at which the model is skilful. tiles exhibits a similar pattern. The biases in the northern
The FSS metric is based on the likelihood that rainfall region are higher and spatially more variable than those in
over a given threshold occurs somewhere within the neigh- the southern region. The variation in bias across quantiles is
bouring window of grid cells. A common threshold rainfall the highest for hourly rainfall, especially in arid and tropical
https://doi.org/10.5194/hess-24-2951-2020 Hydrol. Earth Syst. Sci., 24, 2951–2962, 20202956 S. C. Acharya et al.: Evaluation of sub-daily reanalysis precipitation
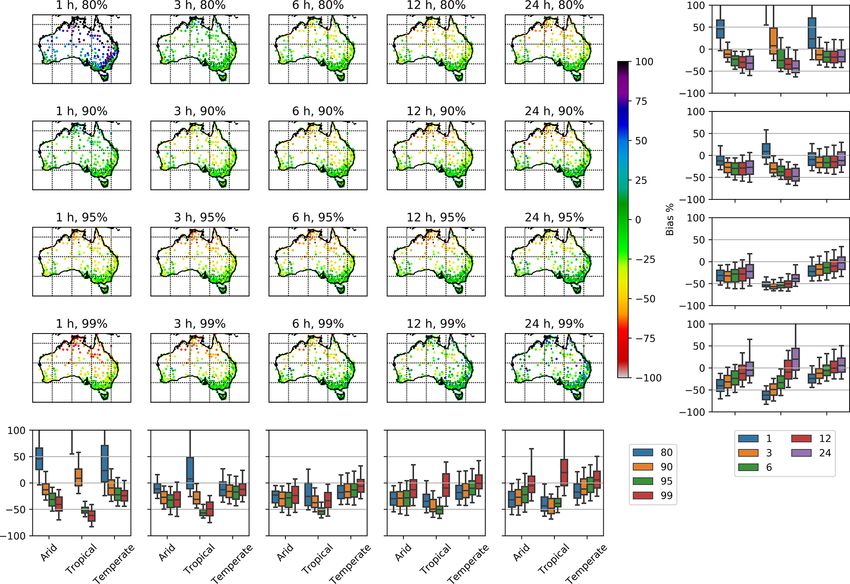
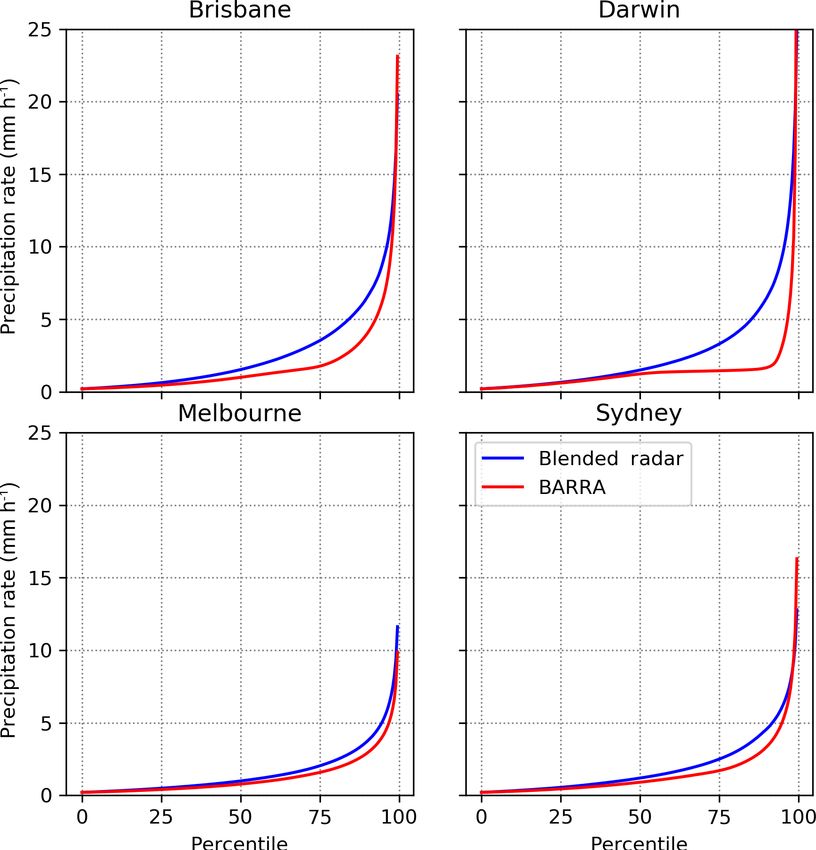
climatic zones. For the 80 % quantile of hourly rainfalls, all the frequency distribution of hourly precipitation and the dis-
stations in the arid and tropical zones exhibit a higher posi- crepancy between radar and BARRA precipitation.
tive bias than those in the temperate zone. This difference is Overall, the rainfall magnitude corresponding to quantiles
partly due to the tendency of BARRA to overestimate light- is higher for the radar estimates than for BARRA, and this
rain events (Su et al., 2019). Despite considering wet days can be attributed to the difference in spatial scale and the
only in comparing quantiles, hourly rainfall at the 80 % quan- area-weighted re-gridding scheme. The difference between
tile for the arid and tropical region is dominated by small the two datasets is greater at higher quantiles. However, at
precipitation amounts, which results in a high positive bias. around 99 % quantiles, the precipitation from BARRA is
At higher quantiles, the BARRA estimates are all lower than close to or greater than radar precipitation.
the gauged point rainfalls. This negative bias is largest in the FSS is calculated for varying quantile thresholds (50, 75,
tropical zone, followed by the arid zone. Although the nature 90, 95, and 99 %) at different accumulations across time (1,
of the high hourly bias varies with location, a step reduc- 3, and 6 h) and presented in Fig. 5. As expected, FSS in-
tion in bias is observed when the accumulation time periods creases with increasing neighbourhood size and decreases
increase from 1 to 3 and 6 h. This is partly due to reduced with increasing threshold. If there is no frequency bias, then
inherent bias arising from the adoption of longer temporal the FSS curve is expected to asymptote to 1 as the neigh-
accumulations, which reduces the potential for differences in bourhood size is increased. In Fig. 5, the maximum FSS of
timing between observations and model estimates. 1 is not achieved even at the neighbourhood size of 300 km,
The spatial distribution of biases associated with the differ- which signifies a frequency bias in BARRA.
ent quantiles exhibits a similar pattern for all temporal accu- The FSS scores vary with location, where the regions in
mulations considered. At shorter accumulations (up to 3 h), increasing order of performance are Darwin, Brisbane, Mel-
the biases change from positive to negative and gradually in- bourne, and Sydney. The results for hourly precipitation and
crease in magnitude with increasing quantile. At higher accu- 75 % quantile threshold suggest that the skilful spatial scale
mulations (6, 12, and 24 h), the bias is negative but decreases L (FSS > 0.5 + po /2) is less than 100 km for all the loca-
in magnitude with increasing quantiles. At higher quantiles tions except Darwin. The skilful spatial scale for 90 and 95 %
(95 and 99 %), the bias is the least in the temperate zone. The quantile thresholds increases to 150 km. For the 99 % quan-
BARRA estimates are under-predicted at all time accumula- tile threshold, BARRA estimates only exhibit useful skill
tions, but this improves with increasing temporal accumula- over spatial scales larger than around 250 km.
tions. The FSS metric only provides information on how perfor-
mance varies with increasing spatial scale. It does not ac-
4.2 Neighbourhood-based sub-daily patterns at point count for timing errors associated with events that might be
locations initiated at different times and/or evolve at different rates.
An indication of such timing errors may be discerned by as-
Figure 3 shows how the minimum error score changes with sessing how the FSS varies with increasing time accumula-
varying neighbourhood grid size. It is seen that the error tions. The results shown in Fig. 5 indicate that FSS improves
score decreases significantly when a neighbourhood of 3 × 3 with increasing time accumulations. For example, at Darwin,
grid cells (about 35×35 km) is considered instead of a single BARRA is able to provide skilful estimates of 50 % thresh-
nearest neighbour only. The error score continues to decrease old of hourly rainfalls only at a scale of 200 km; however, at
slightly as the size of the neighbourhood increases, though 3 and 6 h accumulations, the corresponding spatial scale re-
the adoption of a larger neighbourhood increases the likeli- duces to 125 and 100 km, respectively. The accuracy of the
hood that rainfall events unrelated to the gauge observations BARRA estimates decreases with increasing rainfall sever-
are being considered. The results show that the temporal dis- ity, and even at the longest time accumulations the spatial
tribution of the BARRA precipitation estimates within a wet scale at which rainfalls above the 99 % quantiles are skilful
day are representative yet displaced in terms of location. The extends out to 300 km.
error scores are all less than 0.33, which indicates that the
temporal distribution of sub-daily BARRA precipitation is
on average superior to a uniform distribution of estimates de- 5 Discussion
rived by simply disaggregating daily rainfalls over a day.
To understand the performance of BARRA precipitation at
sub-daily scales, a range of evaluation methods are employed
4.3 Neighbourhood-based spatial evaluation
to ascertain its spatial and temporal characteristics. Key in-
sights arising from the results are discussed below.
Figure 4 shows the hourly precipitation rates corresponding
to different quantile thresholds in the Brisbane, Darwin, Mel-
bourne, and Sydney regions, for the largest 25 events that
occurred between 2014 and 2016. The Melbourne and Syd-
ney regions are more similar than other domains in terms of
Hydrol. Earth Syst. Sci., 24, 2951–2962, 2020 https://doi.org/10.5194/hess-24-2951-2020S. C. Acharya et al.: Evaluation of sub-daily reanalysis precipitation 2957
Figure 2. Percentage bias in precipitation at quantiles (rows) and accumulations (columns). The box plots represent the summary of percent-
age bias across climatic zones for respective rows and columns. Each box in the box plot represents 25th–75th-quantile values, the horizontal
line in the box represents the median, and whiskers represent the 5th–95th quantiles.
of sub-daily climatology (Fig. 2). The minimum bias across
all time accumulations and quantiles in the temperate zone
suggests that BARRA provides unbiased estimates of tem-
perate rainfalls over the observed range of events. In addi-
tion, an improved performance is observed across all regions
when temporal accumulations are considered. This includes
the arid and tropical zones where BARRA performs poorly
at an hourly scale. A slight negative bias is observed across
all locations in most of the quantiles. This underestimation
is however expected due to the mismatch in spatial scale be-
tween point observations and grid-average precipitation (Ma-
Figure 3. Box plots showing the distribution of the minimum er- raun, 2013). The point precipitation, in general, is expected
ror score across stations in each neighbourhood grid size. The box to be higher than areal rainfall at a 12 km spatial scale.
represents 25–75th-quantile values, the horizontal line in the box
represents the median, and whiskers represent 5–95th quantiles. 5.2 Spatio-temporal representation of rainfall
A potential displacement of the precipitation field in space
5.1 Performance based on wet-day quantiles and time is expected when evaluating high-resolution pre-
cipitation datasets, especially when performance is assessed
The unconditional evaluation of precipitation frequency in on an hourly timescale and at a point (or single grid cell)
terms of wet-day quantiles examines the representativeness location (Rossa et al., 2008). The BARRA estimates exhibit
https://doi.org/10.5194/hess-24-2951-2020 Hydrol. Earth Syst. Sci., 24, 2951–2962, 20202958 S. C. Acharya et al.: Evaluation of sub-daily reanalysis precipitation
This spatial evaluation is conducted at selected locations to
take advantage of the availability of high-resolution blended
radar datasets. Across the whole Australian continent there
is a dearth of such high-resolution observations of precipita-
tion, and BARRA could be relied upon to provide estimates
of sub-daily precipitation at selected spatial scales in regions
where there is a paucity of gauging data.
5.3 Performance dependence on spatial location
The overall performance of BARRA varies with location, and
this similar trend was evident across all evaluation methods.
Both the bias analysis of quantiles and the FSS evaluation
show that the performance of BARRA gradually improves as
we move from northern to southern regions (Figs. 2 and 5).
This variation in performance can partly be attributed to the
different rainfall climate in these regions. The convective pre-
cipitation during the summer season is dominant at northern
(low) latitudes, whereas winter (or uniform) frontal rainfall
is dominant at southern (high) latitudes. The poorer perfor-
mance in the tropics, where convective precipitation is dom-
inant, reflects the limitations of the parameterisation scheme
Figure 4. Hourly precipitation rates corresponding to quantiles for to describe sub-grid-scale rainfall (Su et al., 2019). This is
BARRA and blended radar data at four different locations. consistent with the finding of Ebert et al. (2007) that focuses
on general performance of NWP models. The variation in
performance of sub-daily BARRA precipitation across spa-
such displacement errors, as evidenced by improved perfor-
tial location and different climatologies is consistent with the
mance in neighbourhood analysis and FSS analysis. An as-
daily evaluation performed in Acharya et al. (2019).
sessment of hourly temporal patterns shows an improvement
when neighbourhood grid cells are considered (Fig. 3). This
5.4 Performance as a function of temporal resolution
suggests that, when using precipitation from BARRA, users
could benefit from considering spatial and temporal displace-
Availability of hourly rainfall observations (based on both
ment in the precipitation field, especially during large events.
pluviometer and radar products) enables BARRA estimates
This further suggests an opportunity to utilise hourly distri-
of hourly rainfalls to be evaluated. The uneven and sparse
bution of rainfall for disaggregating daily totals.
distribution of pluviometer gauges across Australia and the
At the catchment scale, the accuracy of the spatial distribu-
limited availability of radar products is not sufficient for
tion of rainfall is important for flood modelling. The evalua-
an overall assessment of sub-daily precipitation across the
tion of the spatial performance of BARRA against radar data
whole of Australia, yet, given the wide range of climatologies
for selected large events showed a mixed result between loca-
considered, the analyses provide a comprehensive evaluation
tions. BARRA rainfalls for the 90 % quantile at 3 h accumu-
of BARRA. Our unconditional (Fig. 2) and direct compar-
lation achieves the target FSS at a spatial scale of range 100–
isons (Fig. 5) both illustrate a similar dependency of perfor-
140 km for all domains except Darwin (250 km) (Fig. 5).
mance on temporal resolution. The performance shows a sig-
Achieving useful skill only at a large spatial scale can be
nificant improvement when estimates are accumulated from
partly attributed to the spatial error in the precipitation fields.
1 to 3 h. The increased performance for coarser temporal res-
The higher quantile thresholds are related to small-scale fea-
olution can also be linked to the smoothing effect of rainfall
tures which are even more likely to be subject to spatial error.
at larger accumulation times and reduction of inherent bias.
Therefore, it is difficult to achieve a skilful spatial scale for
The trade-off between performance and temporal resolu-
these more extreme rainfalls. This has also been pointed out
tion needs to be considered in combination with the objec-
by Roberts and Lean (2008) based on the skill of numerical
tives for which the precipitation estimates are used. However,
weather prediction (NWP) model outputs at various quan-
in general terms the increased performance at 3 and 6 h accu-
tile thresholds (75, 90, 95, and 99 %). The nature of such
mulation suggests that it is better to use these accumulations
spatial displacement errors should be considered if BARRA
from BARRA. Given that the performance of BARRA does
estimates of precipitation are intended to be used for hydro-
vary with location, it is expected that shorter (3 h) accumula-
logical modelling.
tions may be appropriate for use in temperate locations, and
longer accumulations (6 h) in the tropical and arid regions.
Hydrol. Earth Syst. Sci., 24, 2951–2962, 2020 https://doi.org/10.5194/hess-24-2951-2020S. C. Acharya et al.: Evaluation of sub-daily reanalysis precipitation 2959
Figure 5. Mean FSS as a function of neighbourhood distance for rainfall above quantile thresholds (indicated by colours) at various locations
(rows) and accumulations (columns). The dashed horizontal lines indicate the target or uniform (FSStarget or FSSuniform ) skill for each
threshold as specified by Roberts and Lean (2008).
6 Conclusions 1. Sub-daily precipitation from BARRA exhibits negative
bias at higher quantiles. The magnitude of bias varies
An accurate representation of spatial and sub-daily temporal with event severity and temporal accumulation.
characteristics of precipitation fields is important for many
hydro-meteorological applications. BARRA is a regional re- 2. There is some tendency for BARRA reanalysis precip-
analysis dataset that provides long-term high-resolution esti- itation to exhibit spatial displacement, and this is more
mates of atmospheric variables over the Australian continent. pronounced for rainfall corresponding to higher quan-
In this study, the spatio-temporal characteristics of sub-daily tiles.
BARRA precipitation estimates are assessed using various
metrics to evaluate its performance at various spatial and 3. The performance of BARRA precipitation depends on
temporal scales. Based on the results, we conclude the fol- spatial location, with poorer performance in tropical rel-
lowing: ative to temperate regions. These spatial trends are con-
sistent across evaluations undertaken using both gauged
point rainfalls and blended radar observations.
https://doi.org/10.5194/hess-24-2951-2020 Hydrol. Earth Syst. Sci., 24, 2951–2962, 20202960 S. C. Acharya et al.: Evaluation of sub-daily reanalysis precipitation
4. Bias in BARRA precipitation quantiles at a point scale Author contributions. SCA designed the research and performed
and spatial displacement errors at a spatial scale de- the analysis. All co-authors provided ideas and feedback follow-
crease with increasing time aggregation, and the perfor- ing discussions. SCA prepared the paper, with review and editing
mance is reasonably skilful at most of the locations for contributions from all co-authors.
temporal accumulations of 3 h and greater.
Competing interests. The authors declare that they have no conflict
One of the limitations of this study is that the spatial as- of interest.
sessment of BARRA is restricted to a few locations where
radar-based datasets are available and the performance of
BARRA across Australia is generalised based on evalua- Acknowledgements. We would like to thank Susan Rennie,
tion at those locations. Currently, the lack of high-quality Kevin Cheong, and Alan Seed (Bureau of Meteorology) for their
and high-resolution benchmark datasets limits our ability to advice on the use of the radar rainfall products, as retrieved from
fully understand the performance of BARRA across the en- the Rainfields Archiving System provided by the Bureau of Mete-
tire continent. However, a more detailed spatial assessment orology. Also, Dörte Jakob and Peter Steinle (Bureau of Meteorol-
of BARRA will be possible once such benchmark datasets ogy) contributed valuable discussions on general methodology and
are available. early results. The authors would like to thank Micha Werner and
two anonymous reviewers for their constructive feedback during the
A natural interest of the users of BARRA is the potential
review process, which helped improve the manuscript.
application of the data in hydro-meteorology. Information on
sub-daily rainfalls across the Australian continent is limited
due to sparse gauge measurements, the availability of radar at
Financial support. This research has been supported by Seqwater
only few locations, spatially coarser global reanalysis prod- (grant no. CO034338) and the Australian Bureau of Meteorology
ucts, and few satellite products (∼ 25 km, going back to only Scholarship Program (grant no. TA38977).
1998). BARRA stands out as one of few available datasets
at hourly temporal resolution. In that respect, it serves as a
useful dataset for the applications requiring sub-daily pre- Review statement. This paper was edited by Micha Werner and re-
cipitation. Further, it can be used to help characterise rainfall viewed by two anonymous referees.
behaviour in regions where gauges are sparse or non-existent.
One of the potential applications of BARRA is for deriving
probabilistic design rainfall events for engineering applica-
tions, which utilise information on the relationship between
rainfall magnitude and its exceedance probability either at a References
point or over an area. Such applications are probabilistic in
nature and are less sensitive to spatial and temporal errors Acharya, S. C., Nathan, R., Wang, Q. J., Su, C.-H., and Eizenberg,
N.: An evaluation of daily precipitation from a regional atmo-
of the individual events. For applications in flood modelling,
spheric reanalysis over Australia, Hydrol. Earth Syst. Sci., 23,
where the spatial and temporal distribution of precipitation 3387–3403, https://doi.org/10.5194/hess-23-3387-2019, 2019.
is important, the likely spatio-temporal displacement errors Bureau of Meteorology: Atmospheric high-resolution regional
in the BARRA precipitation need to properly be taken into reanalysis for Australia, available at: http://www.bom.gov.au/
account. research/projects/reanalysis, last access: 2 June 2020.
The strength of the BARRA dataset is that it provides es- Chiaravalloti, F., Brocca, L., Procopio, A., Massari, C., and
timates of sub-daily areal rainfall which can be used across Gabriele, S.: Assessment of GPM and SM2RAIN-ASCAT rain-
diverse hydrological applications that require such estimates. fall products over complex terrain in southern Italy, Atmos. Res.,
In addition to providing absolute estimates of precipitation, 206, 64–74, https://doi.org/10.1016/j.atmosres.2018.02.019,
BARRA would also appear well suited to providing informa- 2018.
tion on sub-daily patterns of areal rainfalls which can be used Chumchean, S., Sharma, A., and Seed, A.: An inte-
grated approach to error correction for real-time radar-
as a means of disaggregating daily rainfalls obtained from
rainfall estimation, J. Atmos. Ocean. Tech., 23, 67–79,
more reliable sources. The extent to which such estimates https://doi.org/10.1175/JTECH1832.1, 2006.
might provide a better representation of areal sub-daily rain- Clark, P., Roberts, N., Lean, H., Ballard, S. P., and Charlton-
fall for design and hydrological modelling warrants further Perez, C.: Convection-permitting models: a step-change
investigation. in rainfall forecasting, Meteorol. Appl., 23, 165–181,
https://doi.org/10.1002/met.1538, 2016.
Davies, T., Cullen, M. J. P., Malcolm, A. J., Mawson, M. H.,
Data availability. BARRA data are available for academic use. Staniforth, A., White, A. A., and Wood, N.: A new dynam-
Readers are referred to http://www.bom.gov.au/research/projects/ ical core for the Met Office’s global and regional modelling
reanalysis (Bureau of Meteorology, 2020) for information on avail- of the atmosphere, Q. J. Roy. Meteor. Soc., 131, 1759–1782,
able parameters and access. https://doi.org/10.1256/qj.04.101, 2005.
Hydrol. Earth Syst. Sci., 24, 2951–2962, 2020 https://doi.org/10.5194/hess-24-2951-2020S. C. Acharya et al.: Evaluation of sub-daily reanalysis precipitation 2961
Dee, D. P., Uppala, S. M., Simmons, A. J., Berrisford, P., Poli, Jermey, P. M. and Renshaw, R. J.: Precipitation representation over
P., Kobayashi, S., Andrae, U., Balmaseda, M. A., Balsamo, G., a two-year period in regional reanalysis, Q. J. Roy. Meteor. Soc.,
Bauer, P., Bechtold, P., Beljaars, A. C., van de Berg, L., Bidlot, J., 142, 1300–1310, https://doi.org/10.1002/qj.2733, 2016.
Bormann, N., Delsol, C., Dragani, R., Fuentes, M., Geer, A. J., Kobayashi, S., Ota, Y., Harada, Y., Ebita, A., Moriya, M., Onoda,
Haimberger, L., Healy, S. B., Hersbach, H., Hólm, E. V., Isak- H., Onogi, K., Kamahori, H., Kobayashi, C., Endo, H., Miyaoka,
sen, L., Kållberg, P., Köhler, M., Matricardi, M., Mcnally, A. P., K., and Takahashi, K.: The JRA-55 Reanalysis: General Speci-
Monge-Sanz, B. M., Morcrette, J. J., Park, B. K., Peubey, C., fications and Basic Characteristics, J. Meteorol. Soc. Jpn. II, 93,
de Rosnay, P., Tavolato, C., Thépaut, J. N., and Vitart, F.: The 5–48, https://doi.org/10.2151/jmsj.2015-001, 2015.
ERA-Interim reanalysis: Configuration and performance of the Kucera, P. A., Ebert, E. E., Turk, F. J., Levizzani, V., Kirschbaum,
data assimilation system, Q. J. Roy. Meteor. Soc., 137, 553–597, D., Tapiador, F. J., Loew, A., and Borsche, M.: Precipitation
https://doi.org/10.1002/qj.828, 2011. from space: Advancing earth system science, B. Am. Mete-
Ebert, E. E.: Fuzzy verification of high-resolution gridded forecasts: orol. Soc., 94, 365–375, https://doi.org/10.1175/BAMS-D-11-
A review and proposed framework, Meteorol. Appl., 15, 51–64, 00171.1, 2013.
https://doi.org/10.1002/met.25, 2008. Maraun, D.: Bias Correction, Quantile Mapping, and Downscal-
Ebert, E. E.: Neighborhood Verification: A Strategy for Re- ing: Revisiting the Inflation Issue, J. Climate, 26, 2137–2143,
warding Close Forecasts, Weather Forecast., 24, 1498–1510, https://doi.org/10.1175/JCLI-D-12-00821.1, 2013.
https://doi.org/10.1175/2009WAF2222251.1, 2009. Michaelides, S., Levizzani, V., Anagnostou, E., Bauer, P., Kas-
Ebert, E. E., Janowiak, J. E., and Kidd, C.: Comparison of paris, T., and Lane, J. E.: Precipitation: Measurement, remote
near-real-time precipitation estimates from satellite observa- sensing, climatology and modeling, Atmos. Res., 94, 512–533,
tions and numerical models, B. Am. Meteorol. Soc., 88, 47–64, https://doi.org/10.1016/j.atmosres.2009.08.017, 2009.
https://doi.org/10.1175/BAMS-88-1-47, 2007. Mittermaier, M., Roberts, N., and Thompson, S. A.: A
Gilleland, E., Ahijevych, D., Brown, B. G., Casati, B., and long-term assessment of precipitation forecast skill using
Ebert, E. E.: Intercomparison of Spatial Forecast Ver- the Fractions Skill Score, Meteorol. Appl., 20, 176–186,
ification Methods, Weather Forecast., 24, 1416–1430, https://doi.org/10.1002/met.296, 2013.
https://doi.org/10.1175/2009WAF2222269.1, 2009. Parker, W. S.: Reanalyses and Observations: What’s the
Golding, B., Roberts, N., Leoncini, G., Mylne, K., and Difference?, B. Am. Meteorol. Soc., 97, 1565–1572,
Swinbank, R.: MOGREPS-UK Convection-Permitting Ensem- https://doi.org/10.1175/BAMS-D-14-00226.1, 2016.
ble Products for Surface Water Flood Forecasting: Ratio- Paschalis, A., Fatichi, S., Molnar, P., Rimkus, S., and Burlando,
nale and First Results, J. Hydrometeorol., 17, 1383–1406, P.: On the effects of small scale space–time variability of
https://doi.org/10.1175/JHM-D-15-0083.1, 2016. rainfall on basin flood response, J. Hydrol., 514, 313–327,
Gregory, D. and Rowntree, P. R.: A Mass Flux Convec- https://doi.org/10.1016/j.jhydrol.2014.04.014, 2014.
tion Scheme with Representation of Cloud Ensemble Peel, M. C., Finlayson, B. L., and McMahon, T. A.: Updated world
Characteristics and Stability-Dependent Closure, Mon. map of the Köppen-Geiger climate classification, Hydrol. Earth
Weather Rev., 118, 1483–1506, https://doi.org/10.1175/1520- Syst. Sci., 11, 1633–1644, https://doi.org/10.5194/hess-11-1633-
0493(1990)1182.0.CO;2, 1990. 2007, 2007.
Hasan, M. M., Sharma, A., Johnson, F., Mariethoz, G., and Seed, Roberts, N. M. and Lean, H. W.: Scale-Selective Verifica-
A.: Merging radar and in situ rainfall measurements: An assess- tion of Rainfall Accumulations from High-Resolution Fore-
ment of different combination algorithms, Water Resour. Res., casts of Convective Events, Mon. Weather Rev., 136, 78–97,
52, 8384–8398, https://doi.org/10.1002/2015WR018441, 2016. https://doi.org/10.1175/2007MWR2123.1, 2008.
Huffman, G. J., Bolvin, D. T., Nelkin, E. J., Wolff, D. B., Rossa, A., Nurmi, P., and Ebert, E.: Overview of methods for the
Adler, R. F., Gu, G., Hong, Y., Bowman, K. P., and verification of quantitative precipitation forecasts, in: Precipita-
Stocker, E. F.: The TRMM Multisatellite Precipitation Analy- tion: Advances in Measurement, Estimation and Prediction, Jan-
sis (TMPA): Quasi-Global, Multiyear, Combined-Sensor Precip- uary, Springer Berlin Heidelberg, Berlin, Heidelberg, Germany,
itation Estimates at Fine Scales, J. Hydrometeorol., 8, 38–55, 419–452, https://doi.org/10.1007/978-3-540-77655-0_16, 2008.
https://doi.org/10.1175/JHM560.1, 2007. Saha, S., Moorthi, S., Pan, H. L., Wu, X., Wang, J., Nadiga, S.,
Huffman, G. J., Bolvin, D., Braithwaite, D., Hsu, K., Joyce, R., Tripp, P., Kistler, R., Woollen, J., Behringer, D., Liu, H., Stokes,
Kidd, C., Nelkin, E., Sorooshian, S., Tan, T., and Xie, P.: D., Grumbine, R., Gayno, G., Wang, J., Hou, Y. T., Chuang,
NASA Global Precipitation Measurement (GPM) Integrated H. Y., Juang, H. M. H., Sela, J., Iredell, M., Treadon, R., Kleist,
Multi-satellitE Retrievals for GPM (IMERG), Algorithm D., Van Delst, P., Keyser, D., Derber, J., Ek, M., Meng, J., Wei,
Theoretical Basis Document (ATBD), 1–31, available at: H., Yang, R., Lord, S., Van Den Dool, H., Kumar, A., Wang,
https://pmm.nasa.gov/resources/documents/gpm-integrated- W., Long, C., Chelliah, M., Xue, Y., Huang, B., Schemm, J. K.,
multi-satellite-retrievals-gpm-imerg-algorithm-theoretical-basis- Ebisuzaki, W., Lin, R., Xie, P., Chen, M., Zhou, S., Higgins, W.,
(last access: 16 April 2019), 2018. Zou, C. Z., Liu, Q., Chen, Y., Han, Y., Cucurull, L., Reynolds,
Jakob, D., Su, C.-H., Eizenberg, N., Kociuba, G., Steinle, P., Fox- R. W., Rutledge, G., and Goldberg, M.: The NCEP climate fore-
Hughes, P., and Bettio, L.: An atmospheric high-resolution re- cast system reanalysis, B. Am. Meteorol. Soc., 91, 1015–1057,
gional reanalysis for Australia, Bulletin of the Australian Mete- https://doi.org/10.1175/2010BAMS3001.1, 2010.
orological and Oceanographic Society, 30, 16–23, 2017. Seo, D.-J., Seed, A., and Delrieu, G.: Radar and multisensor rainfall
estimation for hydrologic applications, Geophys. Monogr. Ser.,
191, 79–104, https://doi.org/10.1029/2010GM000952, 2010.
https://doi.org/10.5194/hess-24-2951-2020 Hydrol. Earth Syst. Sci., 24, 2951–2962, 20202962 S. C. Acharya et al.: Evaluation of sub-daily reanalysis precipitation Sinclair, S. and Pegram, G.: Combining radar and rain gauge rainfall Walters, D., Boutle, I., Brooks, M., Melvin, T., Stratton, R., Vosper, estimates using conditional merging, Atmos. Sci. Lett., 6, 19–22, S., Wells, H., Williams, K., Wood, N., Allen, T., Bushell, A., https://doi.org/10.1002/asl.85, 2005. Copsey, D., Earnshaw, P., Edwards, J., Gross, M., Hardiman, Skok, G. and Roberts, N.: Estimating the displacement in precipita- S., Harris, C., Heming, J., Klingaman, N., Levine, R., Man- tion forecasts using the Fractions Skill Score, Q. J. Roy. Meteor. ners, J., Martin, G., Milton, S., Mittermaier, M., Morcrette, C., Soc., 144, 414–425, https://doi.org/10.1002/qj.3212, 2018. Riddick, T., Roberts, M., Sanchez, C., Selwood, P., Stirling, Su, C.-H., Eizenberg, N., Steinle, P., Jakob, D., Fox-Hughes, P., A., Smith, C., Suri, D., Tennant, W., Vidale, P. L., Wilkinson, White, C. J., Rennie, S., Franklin, C., Dharssi, I., and Zhu, J., Willett, M., Woolnough, S., and Xavier, P.: The Met Office H.: BARRA v1.0: the Bureau of Meteorology Atmospheric Unified Model Global Atmosphere 6.0/6.1 and JULES Global high-resolution Regional Reanalysis for Australia, Geosci. Land 6.0/6.1 configurations, Geosci. Model Dev., 10, 1487– Model Dev., 12, 2049–2068, https://doi.org/10.5194/gmd-12- 1520, https://doi.org/10.5194/gmd-10-1487-2017, 2017. 2049-2019, 2019. Wilson, D. R. and Ballard, S. P.: A microphysically based Thiemig, V., Rojas, R., Zambrano-Bigiarini, M., Levizzani, V., and precipitation scheme for the UK meteorological office uni- De Roo, A.: Validation of Satellite-Based Precipitation Products fied model, Q. J. Roy. Meteor. Soc., 125, 1607–1636, over Sparsely Gauged African River Basins, J. Hydrometeorol., https://doi.org/10.1002/qj.49712555707, 1999. 13, 1760–1783, https://doi.org/10.1175/JHM-D-12-032.1, 2012. Hydrol. Earth Syst. Sci., 24, 2951–2962, 2020 https://doi.org/10.5194/hess-24-2951-2020
You can also read