Cold Regions Science and Technology
←
→
Page content transcription
If your browser does not render page correctly, please read the page content below
Cold Regions Science and Technology 181 (2021) 103196
Contents lists available at ScienceDirect
Cold Regions Science and Technology
journal homepage: www.elsevier.com/locate/coldregions
An experimental study of rain erosion effects on a hydro-/ice-phobic
coating pertinent to Unmanned-Arial-System (UAS) inflight
icing mitigation
Zichen Zhang a, Liqun Ma a, Yang Liu a, Juan Ren b, Hui Hu a, *
a
Department of Aerospace Engineering, Iowa State University, Ames, IA 50011, USA
b
Department of Mechanical Engineering, Iowa State University, Ames, IA 50011, USA
A R T I C L E I N F O A B S T R A C T
Keywords: An experimental investigation was conducted to evaluate the variations of the surface wettability and ice
Rain erosion effects adhesion strength on a typical hydro− /ice-phobic surface before and after undergoing continuous impingement
Superhydrophobic surface of water droplets (i.e., rain erosion effects) at relatively high speeds (i.e., up to ~100 m/s) pertinent to
Surface wettability
Unmanned-Arial-System (UAS) inflight icing mitigation. The experimental study was conducted by leveraging a
Icephobicity
specially designed rain erosion testing rig available at Iowa State University. Micro-sized water droplets carried
by an air jet flow were injected normally onto a test plate coated with a typical Super-Hydrophobic Surface (SHS)
coating to simulate the scenario with micro-sized water droplets in the cloud impacting onto UAS airframe
surfaces. During the experiments, the surface wettability (i.e., in the terms of static, advancing and receding
contact angles of water droplets) and the ice adhesion strength on the SHS coated test plate were quantified as a
function of the duration of the rain erosion testing. The surface topology changes of the SHS coated surface
against the duration of the rain erosion testing were also measured by using an Atomic Force Microscope (AFM)
system. The characteristics of the surface wettability and ice adhesion strength on the eroded SHS surface are
correlated with the AFM measurement results to elucidate the underlying physics for a better understanding
about the rain erosion effects on hydro− /ice-phobic coatings in the context of UAS inflight icing mitigation.
1. Introduction weighted UAS is much more susceptible to icing problems due to the
lower cruising altitude with relatively higher liquid water content
Unmanned Aerial System, i.e., UAS in short, is one of the most (LWC) and warmer air temperatures, smaller excess power margin to
remarkable developments in aviation community in recent years. These offset the increased drag caused by ice accretion, lower flying velocity to
remotely or sometimes autonomously controlled aerial vehicles have result in much longer exposing to icing conditions, and more vulnerable
become invaluable tools for various civilian and military applications. to cause damages to important sensors onboard. The potential damage
Free from having to accommodate the safety needs and endurance limits of inflight icing to UAS renders their operation unfeasible in cold
of onboard pilots, UAS is capable of flying extended missions and weather. As described in Botura and Fahrner (2003), 25% UAS flights
venturing into hazardous and remote locations (Miziński and Niedziel encountered icing during a specific military operation that have nega
ski, 2017). Additionally, the associated cost savings and casualty tively impacted the success of the mission. The common UAS icing
reduction in using UAS for various military reconnaissance and sur avoidance strategies are keeping UAS on the ground or modifying path
veillance operations are also very attractive, in comparison to conven planning (Zhang et al., 2014) which would greatly reduce UAS opera
tional manned aircraft. As a result, military operations have seen a tion capability in cold climate. This is particularly troublesome for
widespread use of UAS, such as Global Hawk, Predator and Phoenix. military applications, in which icing conditions can lead to aborted
Inflight icing is a common aviation danger that plagues both un missions and the loss of crucial tactical capabilities.
manned and manned airplanes flying in cold climate (Cao et al., 2018). Extensive efforts have been undertaken in recent years to develop
In comparison to conventional manned aircraft, the small-scale, light- anti− /de-icing methods for aircraft icing protection/mitigation (Brown
* Corresponding author.
E-mail address: huhui@iastate.edu (H. Hu).
https://doi.org/10.1016/j.coldregions.2020.103196
Received 18 April 2020; Received in revised form 17 September 2020; Accepted 27 October 2020
Available online 31 October 2020
0165-232X/© 2020 Elsevier B.V. All rights reserved.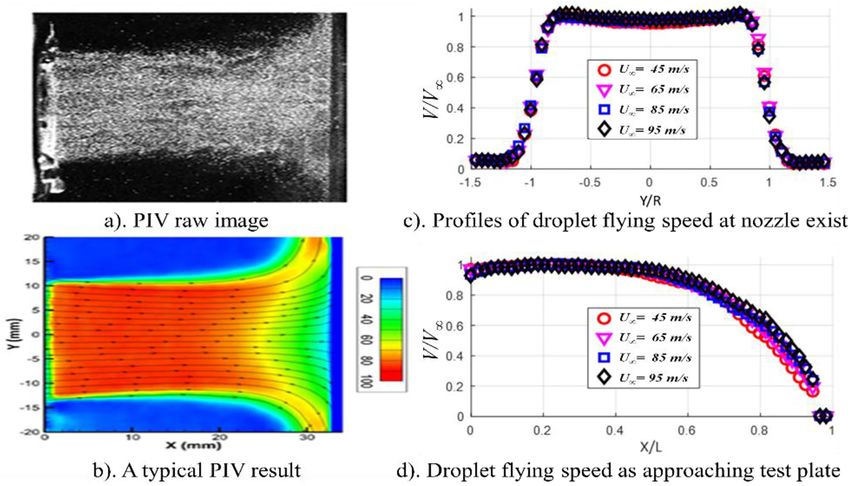
Z. Zhang et al. Cold Regions Science and Technology 181 (2021) 103196
et al., 2002; Liu et al., 2017; Parent and Ilinca, 2011; Thomas et al., It is well known that the hydrophobicity of a surface usually results
1996). While anti-icing refers to the prevention of any buildup of ice from a combination of chemical hydrophobicity with micro− /− nano-
structures on a surface, de-icing denotes the case where ice has already textured surface (Antonini et al., 2014; Dorrer and Rühe, 2009). As
formed on a surface, which is subsequently removed. Almost all the shown in Fig. 1, SHS repels water droplets by maintaining a non-wetting
anti− /de-icing methods currently used for aircraft inflight icing miti Cassie-Baxter state of water sitting on the top of micro− /nano-scale
gation can be classified in two categories: active and passive methods. roughness/textures, with an air layer filling the roughness voids (Cassie
While active methods rely on supplying external energy to the system for and Baxter, 1944; Yao et al., 2011). The large contact angles (CA) and
anti− /de-icing operation, passive methods take advantage of the phys small contact angle hysteresis (CAH, which is defined as the difference
ical properties of airframe surfaces to prevent or suppress ice formation/ between the advancing and receding contact angles) result in extremely
accretion. Currently, the most-commonly-used anti− /de-icing ap low adhesion stresses acting between the water and the surface.
proaches for aircraft inflight icing protection are thermal-based systems, Consequently, only very small forces tangent to the surface are required
i.e., utilizing electric resistant heating, hot air bleeding, or microwave to mobilize the water droplets (Deng et al., 2012; Li et al., 2007).
heating to warm up airframe surfaces to melt out accreted ice structures, However, the water droplets sitting on the micro-scale textured surfaces
and have been successfully implemented on large-scale, manned aircraft can also transition to the fully wetted state, i.e., Wenzel state, under
(Cao et al., 2018). However, those anti− /de-icing measures can be too sufficient external forcing. As a result, the water can be pushed into the
complex, too heavy or draw too much power to be effective, therefore, surface roughness, displacing the air and fully wetting the surface in the
will not be applicable to small-scale, light weighted UAS due to the Wenzel state (Nosonovsky, 2011).
limited payload and scant excess power (Muthumani et al., 2014). While SHS coatings with micro− /nano-scale surface textures were
Passive anti-icing approaches using hydro− /ice-phobic surface coatings reported to show promising performance in suppressing ice formation/
are currently being investigated for use as viable strategies for aircraft accretion, almost all the previous tests were conducted in a relatively
icing mitigation (Antonini et al., 2011; Kulinich and Farzaneh, 2011). static environment (i.e., by handily spraying water droplets or pouring
An ideal solution for UAS inflight icing mitigation would be a hybrid water onto SHS coated substrates and then freezing the test samples in
system that requires only a minimized power input to effectively refrigerators) to demonstrate their icephobic performance (Maitra et al.,
delaminate the ice accretion in the required locations, while utilizing 2014; Varanasi et al., 2010). Very little work has been done to evaluate
passive hydro− /ice-phobic coatings with ultra-low ice adhesion their icephobic capabilities for “impact icing” mitigation pertinent to
strength and good mechanical durability to reject ice accretion with the UAS inflight icing phenomena under either dry rime or wet glaze icing
requisite aerodynamic forces (Gao et al., 2019; Ma et al., 2020). condition(Gao et al., 2019; Liu et al., 2018). Here, the “impact icing” is
Inspired by the outstanding self-cleaning capability of lotus leaf or defined as ice formed due to the dynamic collision of water droplets onto
duck feather (Feng et al., 2002; Lv et al., 2014), a number of studies have a cold surface at a high impacting velocity. The structure of impact ice
been conducted in recent years to develop coatings to make super accretion can vary considerably depending upon the conditions in which
hydrophobic surfaces (SHS), on which water droplets bead up with a the ice is formed. Ambient temperature, airflow speed, water droplet
very large contact angle (i.e., > 150◦ ) and drip off rapidly when the size, liquid water content (LWC) in the airflow, and geometry of the
surface is slightly inclined. One attractive application of SHS, in addition airframe surfaces will all affect the ice structure that accretes.
to the extraordinary water-repellency, is their potentials to reduce For a representative case of UAS inflight icing scenario, super-cooled
accumulation of snow and ice on solid surfaces. Under a frost-free water droplets would impact onto the airframe surfaces at high
environment (e.g., low humidity conditions), SHS has been found to impacting speeds of ~100 m/s or higher. The impinged water droplets
show promising behaviors in delaying ice formation (Cao et al., 2009; would readily penetrate into the micro− /nano-scale surface textures, i.
Tourkine et al., 2009), even at temperatures as low as − 30 ◦ C (Mis e., transition from the partially-wetted Cassie-Baxter state to the fully-
hchenko et al., 2010). wetted Wenzel state, thereby, eliminating the hydrophobicity of the
Fig. 1. Schematics of bio-inspired superhydrophobic surface (SHS).
2
Z. Zhang et al. Cold Regions Science and Technology 181 (2021) 103196
surface (Nosonovsky, 2011). Once water freezes within the textures in would be impinging normally onto a test plates coated with a typical
the Wenzel state, it would very difficult to remove the ice, even more SHS coating to simulate the scenario of airborne, micro-sized water
than on non-textured surfaces, because of the interlocking between ice droplets in the cloud impacting onto UAS airframe surfaces. In the
and the textures (Lv et al., 2014; Nosonovsky and Hejazi, 2012; Sarshar context that follows, the experimental setup used in the present study for
et al., 2013). Furthermore, since UAS airframe surfaces would be the rain erosion testing and preparation of the SHS coated test surface
exposed to the high-speed impingement of water droplets for a relatively along with the measurement techniques/systems to be used to quantify
long time, the “rain erosion” resistance performance of hydro− /ice- the surface wettability and the ice adhesion strength over the test surface
phobic coatings (i.e., the ability to prevent the material wearing away of during the course of the rain erosion testing will be described at first.
the surface coatings from the substrates caused by the continuous high- After a brief introduction of the fundamental mechanisms of “rain
speed impingement of water droplets) would also be very critical in erosion damages” to a solid surface, the measurement results of the rain
considering a practical usage of hydro− /ice-phobic coatings to mitigate erosion testing experiments will be presented. Comprehensive analysis
ice accretion over UAS airframe surfaces. It should also be noted that, and discussions will also be presented to evaluate the rain erosion effects
while a number of previous studies were conducted to investigate rain on the SHS coating under various test conditions in the context to utilize
erosion effects on surface coatings (Dear and Field, 1988; Fujisawa et al., hydro− /ice-phobic coatings for UAS inflight icing mitigation.
2018; Sharifi et al., 2019; Valaker et al., 2015), majority of those studies
focused on mass loss of the coating materials caused by rain erosion 2. Experimental setup and preparation of the SHS coated test
effects, very little can be found in literature to study the degradation of plate
surface wettability and ice adhesion strength changes due to the rain
erosion effects. While SHS coatings were found to lose their super 2.1. A brief introduction of the rain erosion testing rig
hydrophobicity even for the test cases with relatively low droplet
impacting velocity (i.e., ~ 10 m/s) (Tarquini et al., 2014; Yeong et al., As shown schematically in Fig. 2, a specially-designed rain erosion
2014), systematic investigations to assess rain erosion effects on the testing rig available at Aerospace Engineering Department of Iowa State
surface wettability and ice adhesion characteristics of SHS coatings University was used to evaluate rain erosion effects on a typical SHS
undergoing continuous impingement of water droplets at relatively high coating undergoing continuous impingement of water droplets at rela
impacting velocity (i.e., up to ~100 m/s) pertinent to UAS icing phe tively high impacting speeds up to ~100 m/s. A high-thrust electric
nomena have not been explored. ducted fan (EDF, JP Hobby) is installed at the inlet of a circular-shaped
In the present study, a comprehensive experimental campaign was wind tunnel to drive airflow into the test rig. By manipulating the power
conducted to evaluate the variations of the surface wettability and ice supplied to the electric fan, the speed of the airflow exhausted from the
adhesion strength on a typical hydro− /ice-phobic surface before and nozzle of the wind tunnel (Dnozzle = 38 mm) can be adjusted, i.e., from
after undergoing continuous impingement of water droplets (i.e., rain 45 m/s to 95 m/s for the present study. While a water spray nozzle
erosion effects) at relatively high speeds (i.e., up to ~100 m/s) pertinent (BIMV-11002 nozzle) is integrated in the middle section of the wind
to UAS inflight icing mitigation. The experimental study was conducted tunnel, de-ionized water is supplied to the spray nozzle to generate
by leveraging a specially-designed rain erosion testing rig available at micro-sized water droplets and inject them into the airflow. By manip
Iowa State University to generate an air jet flow (i.e., up to ~100 m/s) ulating the water flow rate supplied to the spray nozzle, the liquid water
laden with micro-sized water droplets at different liquid water content content (LWC) levels in the air jet flow can be varied for different testing
(LWC) levels. The micro-sized water droplets carried by the air jet flow conditions. By changing the pressure settings of the air and water
Fig. 2. Schematic of the rain erosion testing rig used in the present study.
3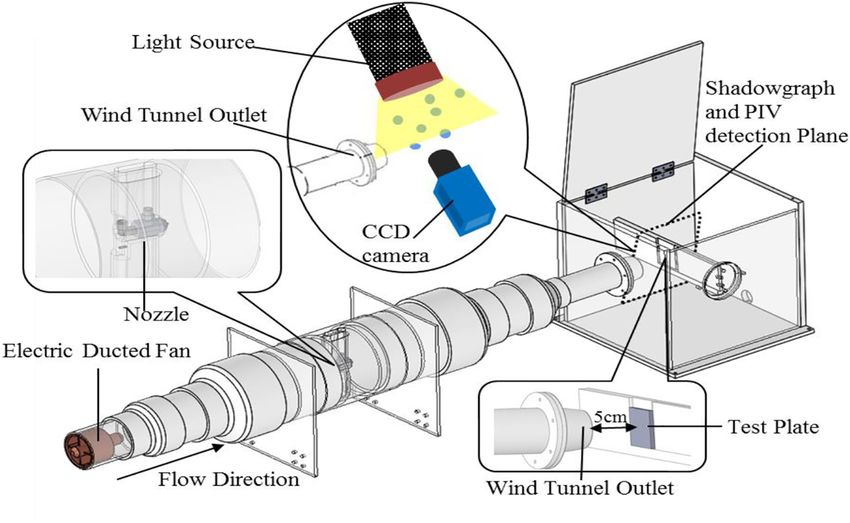
Z. Zhang et al. Cold Regions Science and Technology 181 (2021) 103196
supplying pipelines connected to the water spray nozzle, the size of the resolution) with a 12× zoom lens system (LaVision) was used to record
water droplets exhausted from the spray nozzle is also adjustable for the images of the water droplets siting on the SHS coated test plate in
different applications. order to determine the static and dynamic CAs. An “in-house” MATLAB-
based image processing software package was used to extract the CA
information from the recorded droplet images. The CA measurements
2.2. A typical SHS coating studied in the present study
were repeated 10 times for each case to minimize the random mea
surement errors. The CA measurement uncertainty was estimated to be
A set of square-shaped aluminum plates with 50 mm in width and
±5◦ .
6.5 mm in thickness were used as the test plates in the present study.
Table 1 summarizes the measured static, receding and advancing
Before applying a commercially-available SHS coating - Hydrobead®
angles of water droplets before and after applying the SHS coating onto a
onto the test plates, the surfaces of the test plates were polished with
test plate. It can be seen clearly that, before applying the SHS coating,
sandpaper grits ranging from 220 to 2000 according to ASTM standards
the static CA of water droplets on the uncoated test plate was found to be
(E3-11) (Beeram et al., 2017). The pretreatment could strengthen the
obviously smaller than 90◦ (i.e., θstatic ≈ 65◦ ), confirming the hydrophilic
bond between SHS coating and the substrates as well as enhance the
nature of bare aluminum surface. The corresponding CAH value (i.e., the
homogeneity of the SHS coating. Following the procedure suggested by
difference between the advancing and receding contact angles of the
the coating manufacturer, both Hydrobead® standard and Hydrobead®
water droplets, Δθ = θadv - θrec) was found to be bigger than 70◦ . In
enhancer were applied onto the surfaces of the test plates. The thickness
comparison, after applying the SHS coating, while the static CA of water
of the SHS coating sprayed on the test surfaces was found to be about 25
droplets on the SHS coated test surface was found to become θstatic ≈
μm as measured by using a wet film gauge. Fig. 3 shows typical images of
156◦ , the corresponding CAH value is only ~3◦ .
water droplets on a test plate before and after applying the SHS coating.
By using a similar measurement technique as the one described in
It can be seen clearly that, before applying the SHS coating, the static
Beemer et al. (2016) and Meuler et al. (2010), the variations of the ice
contact angle of the sessile water droplet was found to be only ~65◦ . As
adhesion strengths, τice, on the test plate as a function of the duration of
revealed from the Scanning Electron Microscope (SEM) image for the
the rain erosion testing were also measured in the present study. With
SHS coated test surface given in Fig. 3(b), micro− /nano-scale surface
the similar experiment setup as that described in Beeram et al. (2017);
textures were found to be generated after applying the Hydrobead®
the test plate undergoing different duration of the rain erosion testing
coating onto the test plate. In addition to its hierarchical polymeric
was mounted in a temperature controlled test chamber for the ice
superhydrophobic shell on the surface, fluorinated compounds in the
adhesion measurements. For the test cases of the present study, while
Hydrobead® coating will also provide promise to achieve the super
the surface temperature of the test plate was maintained at Tw = − 10 ◦ C,
hydrophobicity. As a result, the static contact angle of a sessile water
ice adhesion measurements were repeated ~10 times for each test cases.
droplet on the SHS coated test surface was found to be about 156◦ ,
The uncertainty for the ice adhesion measurements was estimated to be
indicating that the Hydrobead® coated test surface is indeed
±20 kPa. The measured ice adhesion strengths on the test plate before
superhydrophobic.
and after applying the SHS coating are also listed in Table 1 for com
parison. It can be seen that, the ice adhesion strength on the bare
2.3. Measurements of the contact angles and ice adhesion strength on the aluminum surface of the test plate (i.e., before applying the SHS coating)
test surfaces was found to be ~450 kPa, which is within the range of the values re
ported in Saleema et al. (2011) for bare aluminum surfaces. In com
In the present study, the changes of the surface wettability of the SHS parison, the ice adhesion strength on the SHS coated surface (i.e., the
coated test plate (i.e., in the terms of static contact angles (CA), θstatic; newly prepared test surface before undergoing rain erosion testing) was
advancing CA, θadv.; and receding CA, θrec, of water droplets on the test found to become τice, = ~ 105 kPa, which is only about ¼ of the cor
surfaces) as a function of the duration of the rain erosion testing were responding value of the test case without applying the SHS coating. It
quantified by using a needle-in-the-sessile-drop method similar as that confirms that the SHS coating used in the present study is also icephobic.
described in Korhonen et al. (2013). Fig. 4 gives the experimental setup
used in the present study. While the static CA, θstatic, were measured by
placing sessile water droplets (~50 μL deionized water in volume) on 2.4. Surface topology measurements with an Atomic Force Microscopy
the test plate, the advancing CA, θadv. and receding CA, θrec. were (AFM) system
measured by expanding and contracting the water droplets with a rate of
10 μL/s. The expanding and contracting of the water droplets were In the present study, the surface topology variations of the SHS
controlled by using a programmable Syringe pump (Genie Touch™). A coated test plate as a function of the duration of the rain erosion testing
digital camera (PCO2000 with 2000 pixels × 2000 pixels in spatial experiments were also characterized by using a high-resolution Atomic
Fig. 3. Images of water droplets on the test plate before and after applying SHS coating.
4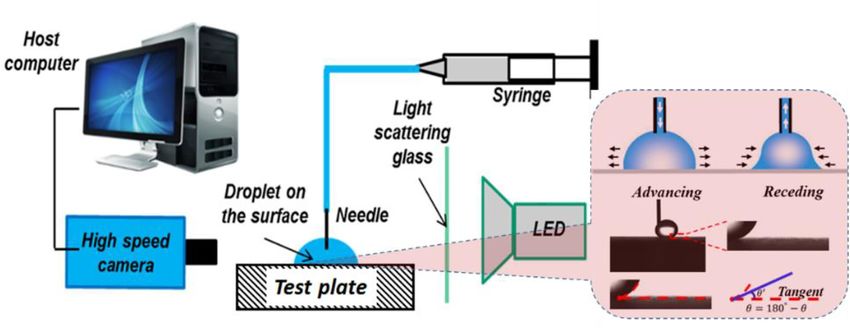
Z. Zhang et al. Cold Regions Science and Technology 181 (2021) 103196
Fig. 4. The experimental setup to measure contact angles of droplets on the test surfaces.
Table 1
Measured contact angles and ice adhesion strength on the test plate.
Studied Surface Wettability Static CA θstatic Advancing CA, θadv Receding CA, θrec Hysteresis Δθ Ice adhesion strength
(KPa)
Before applying the SHS coating on the test Hydrophilic ~65◦ ~105◦ ~35◦ >70◦ ~450
plate
After applying the SHS coating on the test plate Super- ~156 ◦
~163 ◦
~160 ◦
~3 ◦
~105
Hydrophilic
Force Microscopy (AFM) system (Bioscope Resolve, Bruker Inc.) inte
grated with an inverted optical microscope (IX73, Olympus). The drive
voltage, the piezo displacement data and cantilever deflection of the
AFM probe were acquired using a DAQ board (National Instrument,
PCIe-6353). An AFM probe (DNP, Bruker) with a nominal conical radius
of 20 nm and an opening angle of 20 degree was used for the topo
graphic imaging of the SHS coated test surface. Before characterizing of
the topology of the test surface, the radius of the AFM probe radius was
calibrated carefully by using a polycrystalline titanium roughness sam
ple (Bruker Inc). While the AFM system was operated in the tapping
mode, the cantilever spring constant for the AFM measurements was set
as 0.03 N/m. The AFM probe was placed in contact with the SHS coated
test surface to produce high-resolution topographical images, then lifted
off from the test surface and moved to next measurement position.
Further information about the AFM system used in the present study and
the operation procedure for the AFM measurements can be found at Xie
and Ren (2019) and Mollaeian et al. (2019).
3. Fundamental mechanism of the damages to a solid surface by
“rain erosion effects” Fig. 5. Rain erosion mechanism after a droplet impacting onto a solid surface.
The fundamental mechanism of “rain erosion” damages to a solid later and propagate along the surface and into the substrate,
surface (i.e., surface damages caused by the continuous impingement of respectively.
water droplets) is closely related to the impinging dynamic of water While water is usually considered to be incompressible, water
droplets (Jackson and Field, 2000). As described in Grundwürmer et al. droplet however, can be compressible at the initial stage of the
(2007), the impinging dynamics of a droplet onto a solid surface can be impinging process, and a shock wave would be generated at the solid-
divided into three stages: the first is the compressible stage where the liquid interface, as described in Slot et al. (2015). This phenomenon is
liquid droplet is considered to be compressible due to the generation of a called “water hammer effect”, and the pressure generated in this stage is
shockwave at the initial impinging zone with an extremely high “water named as “water hammer pressure” (Fujisawa et al., 2018; Ghidaoui
hammer” pressure; the second is the impacting wave generation stage et al., 2005; Thomas and Brunton, 1970). The magnitude of the “water
featured by the fast propagation of surface Rayleigh waves and bulk hammer pressure” is a function of the droplet impinging velocity as well
waves in a relatively large area; and the final one is the incompressible as the physical properties of the liquid and solid (e.g., density and speed
stage mainly involving in momentum transfer of the impinging droplet of sound), and can be expressed as:
(Slot et al., 2015). As shown schematically in Fig. 5, while a shock wave ( )
1
is generated in the initial impinging zone highlighted in blue color, the Phammer = ρL cL U∞ (1)
1 + (ρL cL /ρS cS )
longitudinal Rayleigh waves and transverse bulk waves are generated
5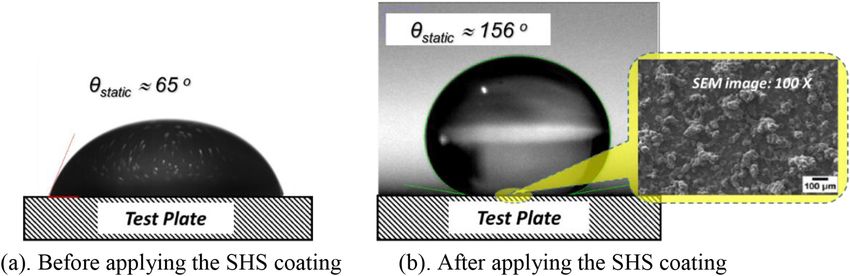
Z. Zhang et al. Cold Regions Science and Technology 181 (2021) 103196
where U∞ is the impacting speed of the droplet, ρL and ρS are the density above, although the dynamic pressure of the impinging droplet is much
of the liquid and the solid substrate, cL and cS are the speed of sound in smaller than the “water hammer pressure”, the acting area of the dy
the liquid and solid, respectively. namic pressure is much greater than that of the “water hammer pres
It should be noted that, the “water hammer pressure” could be much sure”. As described in Thomas and Brunton (1970), while the effective
higher than the dynamic pressure of an impinging water droplet. For area of the dynamic pressure for an impinging droplet can be estimated
example, for a water droplet impinging onto an aluminum surface at the as πR2, the effective area for the water hammer pressure is only
impacting speed of U∞ = 50 m/s, while the droplet dynamic pressure is π(rhammer)2 = π (R U∞/c)2. More specifically, for a water droplet
Pdynamic = ρU2∞ ≈ 2.5 MPa, the corresponding “water hamper pressure” impinging onto a solid surface with the impacting velocity of U∞ = 50
can reach up to Phammer ≈ 75 MPa, which is about 30 times greater than m/s, the acting area of the dynamic pressure would be about 1000 times
the droplet dynamic pressure. According to Thomas and Brunton greater than that of the water hammer pressure. The significantly
(1970), while the duration of the “water hammer effect” is ultra-short, i. greater acting area of the dynamic pressure would lead to surface
e., on the order of nanoseconds, the radius of the area experiencing the damages over a much larger area.
“water hammer pressure” can be estimated byrhammer = RU∞/c, where R In summary, the damages to a solid surface caused by the dynamic
is the droplet radius, and c is the sound speed in the liquid. impacting of liquid droplets can be categorized mainly at two levels
As shown schematically in Fig. 6, Rayleigh surface waves and bulk (Thomas and Brunton, 1970). The first level occurs when the water
waves would also be generated and propagate immediately due to the droplet impacts onto the solid surface to initiate a deformation and first
sudden surface distortion caused by the droplet impacting (Blowers, cracks due to the tremendous “water hammer pressure” at the initial
1969). Since the moving speed of the contact edge is much greater than stage of the impacting process, as shown schematically in Fig. 6(a).
the wave propagation speed at the initial stage of the droplet impacting Then, the generation of the Rayleigh waves and bulk waves would
process, the “water hammer effect” is much more violent, while the induce high velocity of the lateral water jets to tear away any uneven
wave effects are of little importance in the compressible stage (Slot et al., ness in the surface material to augment the damages to the solid surface
2015). However, as the droplet spreads over the solid surface, the (i.e., lateral jetting effects), as shown in Fig. 6(b). Fig. 6(c) illustrates
moving speed of the contact edge would become slower and slower due how the cracks would become cavities due to the subsequent droplets
to liquid viscosity and friction force given by the substrate. As a result, impacting onto the surface, allowing for large pieces to become dis
the Rayleigh and bulk waves would become dominant factors to cause lodged. In the case where the cavity does not propagate further into the
material degradation at the second stage. According to Jackson and substrate, shear failure may also occur to the tips of the prone material,
Field (2000), while bulk waves are more critical for thin specimen, as shown in Fig. 6(d).
Rayleigh surface waves would be more destructive for the thick test
plate used in the present study (i.e. ~6.5 mm in thickness). As described 4. Measurement results and Discussions
in Blowers (1969), the stress level induced by Rayleigh surface waves
can be estimated as: 4.1. Quantification of the water spray flow exhausted from the rain
( )( erosion test rig
1 rhammer )0.5
PRayleigh (r) = ρL cL U∞ (4)
1 + (ρL cL /ρS cS ) ξ As aforementioned, by changing the pressure settings of the air and
water supplying pipelines connected to the water spray nozzle mounted
where ξ is the distance to the impact center. Based on Eq. (2), for a water in the middle section of the rain erosion test rig, the size of the water
droplet impinging onto an aluminum surface at the impacting speed of droplets exhausted from the spray nozzle is adjustable. In the present
U∞ = 50 m/s, the magnitude of the stress induced by Rayleigh surface study, the size distribution of the water droplets exhausted from the
waves would be about 40 MPa as the waves propagating to ξ = 3rhammer, wind tunnel nozzle of the rain erosion test rig was monitored by using a
while the corresponding value for the bulk waves is only about 8 MPa. LaVision’s ParticleMaster™ imaging system, which composes of a high-
At the end of the compressible stage, while the released waves would speed digital camera (PhotronFastCam MINI WX100) to record the
finally propagate to the contact line and neutralize the effects of the shadow images of water droplets along with a bright backlight iumil
shock wave, the impact stress would decrease significantly, and the lation provided by a high-speed pulsed LED lamp (MiniConstellation).
liquid would become incompressible (Slot et al., 2015). As described The droplet images are then analyzed by LaVision ParticleMaster™
Fig. 6. Schematics of the damaging process due to rain erosion effect. (a). initiating a deformation and first cracks due to the tremendous “water hammer pressure” at
the initial stage of the droplet impacting process; (b). Subsequent water jetting effects induced by the Rayleigh surface waves, pushing prone material, and creating
cracks; (c). Crack propagating into a cavity; (d). Shear failure of prone materials. Reprint from Heyman (1970).
6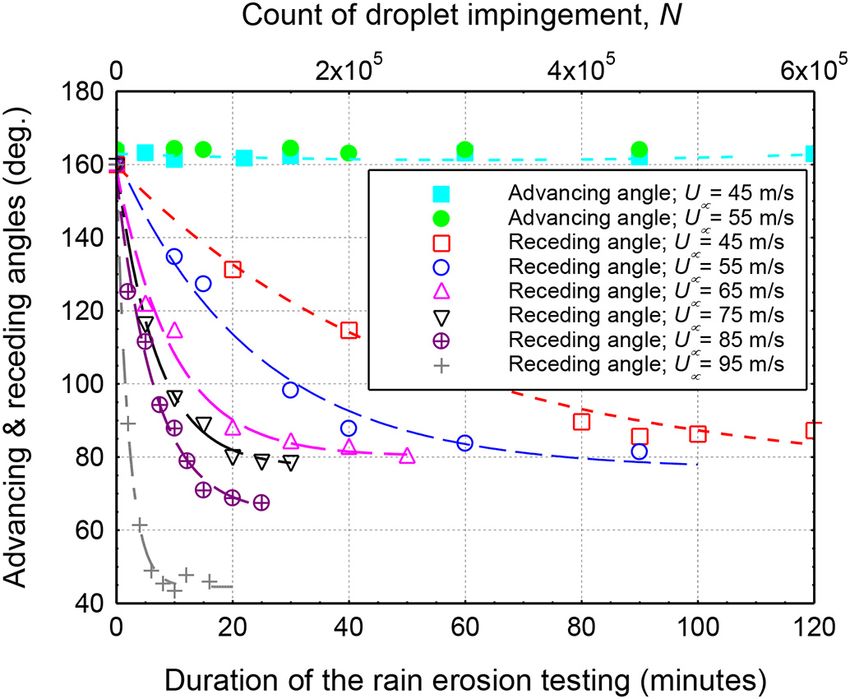
Z. Zhang et al. Cold Regions Science and Technology 181 (2021) 103196
software to obtain the statistics of the water droplets, e.g., size distri Table 2
bution and mean size diameter. In order to simulate the rain erosion The LWC levels in the airflow under different rain erosion testing conditions.
effects caused by the micro-sized, airborne water droplets in the cloud Airflow speed, U∞, (m/s) 45 55 65 75 85 95
impacting onto UAS airframe surfaces, the size of the water droplets LWC level in the airflow, (g/m3) 21.7 17.7 15.0 13.0 11.5 10.3
exhausted from the water spray nozzle was set to range from 10 μm to
100 μm with a median volumetric diameter (MVD) being about 20 μm
≈ 10.3 g/m3 for the test case of U∞ = 95 m/s. It should be noted that, in
for the test cases of the present study.
comparison to the LWC levels within typical UAS flight envelopes of
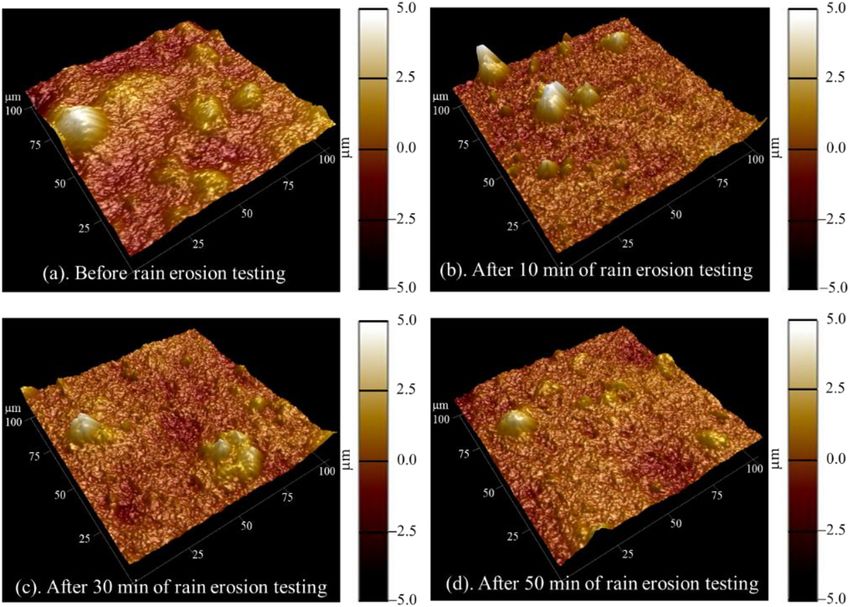
In the present study, a high-resolution digital particle image veloc
LWC < 2.0 g/m3, the rain erosion testing cases of the present study were
imetry (PIV) system was used to quantify the flying speed of the water
designed intentionally with much higher LWC levels (i.e., about 10 times
droplets after exhausted from the nozzle of the wind tunnel. Fig. 7(a)
higher) in order to accelerate the degradation of the hydro− /ice-phobic
shows a typical PIV raw image of the water droplets laden in the airflow
coating caused by the rain erosion effects.
with the freestream airflow velocity of U∞ = 95 m/s, while Fig. 7(b)
As summarized in (Slot et al., 2015), in addition to material prop
gives the velocity distribution of the flying water droplets derived from
erties and surface roughness of the solid substrate, a number of pa
the acquired PIV images. The transverse velocity profiles of the water
rameters relevant to droplet impinging dynamics, including droplet size
droplets exhausted from the wind tunnel nozzle under different test
and shape, impacting velocity, impacting angle, number of droplet
conditions (i.e., with the airflow velocity ranging from 45 m/s to 95 m/
impingement, also play very important roles in determining the resul
s) were shown in Fig. 7(c). It can be seen clearly that, the velocity of the
tant damages to solid surfaces due to the rain erosion effects. Since the
flying water droplets was found to be rather uniform within the water
rain erosion damages to a surface coating will be related directly to the
spray flow and have almost the same velocity as the freestream airflow
accumulated effects of the continuous impingement of water droplets
velocity (i.e., U∞). Therefore, the freestream airflow velocity, U∞, is
onto the test surface at the same spot. A new parameter, named as “count
referred as the nominal impacting velocity of the water droplets in the
of droplet impingement”, is defined in the present study to characterize
present study. Fig. 7(d) reveals the variations of the flying velocity of the
the rain erosion effects under different test conditions. The count of
water droplets along the spray flow direction as they approach to the test
droplet impingement, N, is referred as the number of duty cycles of the
plate. It can be seen clearly that, due to the existence of a strong adverse
damages to the test surface due to the continuous droplet impingement
pressure gradient near the impingement point, the water droplets were
at the same location on the test surface. As described in Thomas and
found to decelerate as approaching to the test plate, as expected. Upon
Brunton (1970), while the effective impingement area of a droplet of R
continuous impingement of the water droplets onto the test plate, the
in radius can be estimated as πR2, the count of the droplet impingement,
rain erosion characteristics of the hydro− /ice-phobic coating on the test
N, for different rain erosion testing cases of the present study can be
plate are examined under different test conditions.
estimated by:
During the rain erosion testing, while the water flowrate supplied to
the spray nozzle was kept at a constant value (i.e., Q̇=4.0 l/h), the wind n π R2 n π R2
N= = (3)
speed of the airflow exhausted from the wind tunnel nozzle was varied Simpingement Snozzle
from U∞ = 45 m/s to U∞ = 95 m/s for different test cases. As a result,
Where n is the total number of the water droplets exhausted from the
the corresponding liquid water content (LWC) levels in the airflow
wind tunnel nozzle, Snozzle is the exit area of the wind tunnel nozzle,
would be different as the speed of the airflow changes. Table 2 sum
which equals to the impingement area of the spray jet flow onto the test
marizes the LWC level in the airflow under different rain erosion testing
plate.
conditions. It can be seen clearly that, the LWC level in the airflow would
For a rain erosion testing case with a given LWC level and droplet
change from LWC ≈ 21.7 g/m3 for the test case of U∞ = 45 m/s to LWC
Fig. 7. PIV measurement results of the water spray flow before impacting onto the test plate.
7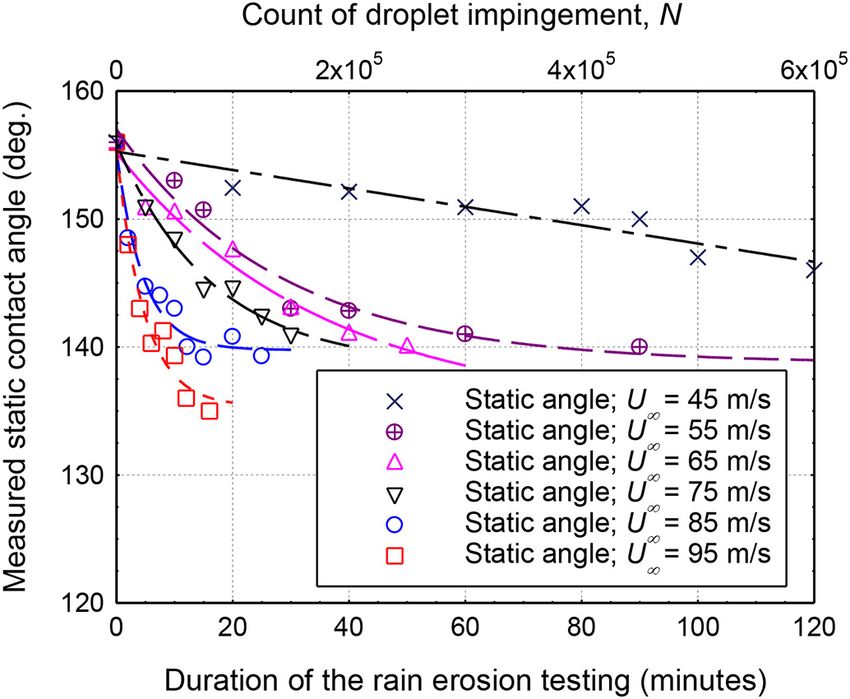
Z. Zhang et al. Cold Regions Science and Technology 181 (2021) 103196
impacting speed of U∞, the total amount of the water mass exhausted
from the wind tunnel nozzle can be calculated as mwater = LWC ⋅ U∞ ⋅
Snozzle ⋅ t, where t is the duration of the rain erosion testing. As afore
mentioned, since the water droplets exhausted from the wind tunnel
nozzle for the rain erosion testing have a median volumetric diameter
(MVD) of ~20 μm (i.e., the averaged radius of R ≈ 10 μm), the total
number of the water droplets, n, can be estimated by taking the ratio
between the total water mass exhausted from the wind tunnel nozzle to a
mass of the individual water droplet:
mwater 3LWC⋅t⋅U∞ ⋅Snozzle
n= = (5)
mdroplet 4ρπ R3
Substituting n into Eq. (3), the count of the droplet impingement, N,
can be expressed as:
3LWC⋅U∞ ⋅t
N= (6)
4ρR
Under a given rain erosion testing condition, the count of the droplet
impingement, N, would increase linearly with the duration of the rain
erosion testing, t. Therefore, the count of the droplet impingement, N,
could also be considered as the non-dimensional time to characterize the
Fig. 9. Measured advancing & receding angles vs. the time of the rain
rain erosion damages to the SHS coated test surface. erosion testing.
4.2. Wettability degradation of the SHS coated test surface due to rain during the entire duration of the rain erosion testing experiments. It
erosion effects indicates that, the advancing CA is not sensitive to the changes of the
surface textures/roughness caused by rain erosion effects, which agrees
Figs. 8 and 9 present the measurement results of the rain erosion with the experimental findings reported by Zografi and Johnson (1984).
testing experiments to reveal the surface wettability degradation of the It should also be noted that, the wettability degradation characteristics
SHS coated test plate (i.e., in terms of static contact angles (CA), θstatic, of the SHS coating (i.e., the time variations for both the measured static
advancing CA, θadv., and receding CA, θrec, of water droplets on the test CA, θstatic, and the receding CA, θrec data) were found to be fitted
surface) as a function of the duration of the rain erosion testing exper reasonably well by using exponential functions, as shown by the dashed
iments. Since the count of droplet impingement, N, could also be lines given in the plots.
considered as the non-dimensional time to characterize the rain erosion The measurement results given in Fig. 8 and Fig. 9 also revealed
effects, the corresponding count of the droplet impingement, N, was also clearly that, after undergoing the same number of the droplet
given in the plots as the second X-axis on the top of the plots. It can be impingement, wettability degradation of the SHS coated surface (i.e.,
seen clearly that, under the same rain erosion testing conditions (i.e., the decreasing rates for both the static CA, θstatic, and the receding CA,
with the same LWC level in the airflow and droplet impacting speed of θrec) was found to be much faster for the test cases with higher droplet
U∞), both the static CA, θstatic, and the receding CA, θrec, were found to impinging speed, in comparison to those with relatively lower droplet
decrease monotonically with the increasing time of the rain erosion impacting speed. More specifically, for the test case with the nominal
testing experiment (i.e., with more and more droplets impinging onto droplet impacting speed of U∞ = 45 m/s, the measured static and the
the test surface). However, the measured values of the advancing CA, receding contact angles were found to decrease from their initial values
θadv were found to stay almost at a constant value (i.e., θadv = 163◦ ± 2◦ ) of θstatic ≈ 156◦ and θrec ≈ 160◦ to θstatic ≈ 146◦ and θrec ≈ 82◦ , respec
tively, after 120 min of the rain erosion testing (i.e., after about 600,000
times of the droplet impingement). However, as the nominal droplet
impacting speed increases to U∞ = 95 m/s, the corresponding static and
the receding contact angles were found to become θstatic ≈ 140◦ and θrec
≈ 45◦ , respectively, after a much shorter duration of the rain erosion
testing of 20 min (i.e., after only about 100,000 times of the droplet
impingement). It should be noted that the bare aluminum surface of the
test plate (i.e., the bare test surface without the SHS coating) is hydro
philic with the static contact angles being only θstatic ≈ 65◦ . For the
eroded SHS coated test surface, even though both the static CA, θstatic,
and the receding CA, θrec were found to decrease substantially due to
rain erosion efforts, the measured static contact angles on the eroded
SHS coated surface were still found to be much greater than 90◦ . It in
dicates that the eroded SHS coated surface would still be hydrophobic
due to the existence of a layer of the SHS coating material remaining on
the surface of the test plate. However, the eroded SHS coated surface
was found to loss its superhydrophobicity rapidly due to the grinding
away of the hierarchical texture/roughness structures over the SHS
coated surface after undergoing the rain erosion experiments, which will
be revealed quantitatively in the later section to discuss the AFM mea
surement results.
Fig. 8. Measured static contact angle, θstatic, vs. the time of the rain
erosion testing.
8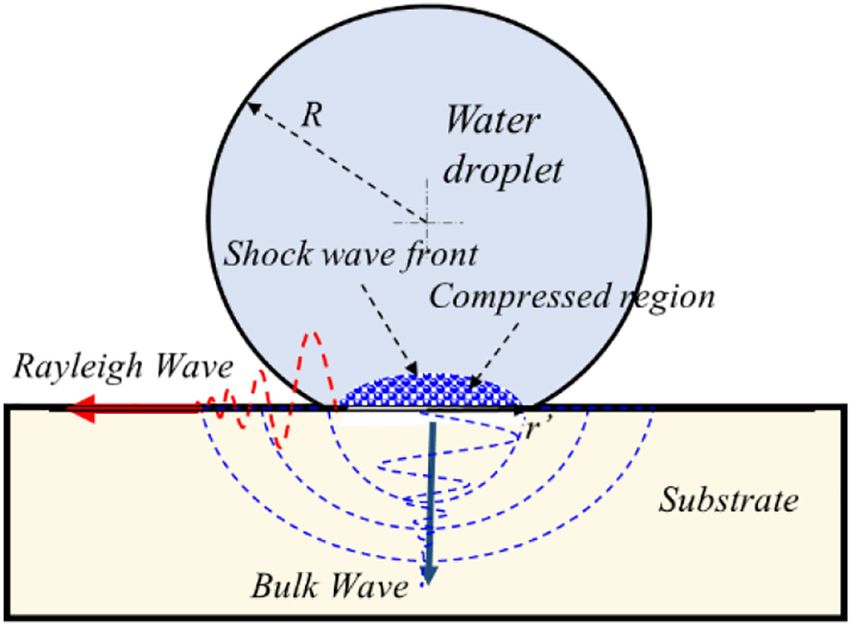
Z. Zhang et al. Cold Regions Science and Technology 181 (2021) 103196
4.3. The changes of ice adhesion strength on SHS coated surface due to work of adhesion can be rewritten as Wadh ≈ γwa + γ sa − γ sw(Makkonen,
rain erosion effects 2012; Makkonen, 1997; Meuler et al., 2010). The hydrophobicity or
hydrophilicity of a non-textured solid material is given by the Young’s
As aforementioned, the variations of the ice adhesion strength on the equation asγwa cos θY = γsa − γ sw, where θY is the Young’s contact angle
SHS coated test plate as a function of the rain erosion testing duration of water on the solid surface. By combining the Young’s equation with
were also measured under different testing conditions. Fig. 10 given the the work of adhesion, Wadh ≈ γ wa(1 + cos θY) can be obtained. This
measurement results for the test case with the nominal droplet impact equation is known as Young-Dupre equation. From this equation, it is
ing speed of U∞ = 75 m/s. The ice adhesion strength measurements were evident that non-textured hydrophobic materials with θY > 90◦ display
performed in a temperature-controlled test chamber with the surface lower adhesion to ice, in comparison to hydrophilic materials with θY <
temperature of the SHS coated test plate being set at Tsurface = − 10.0 ◦ C. 90◦ .
It can be seen clearly that, the ice adhesion strength on the SHS coated Based on their measurements of the ice adhesion strength on steel
test plate was found to increase very rapidly at the earlier stage of the discs coated with fluorodecyl POSS-containing materials, Meuler et al.
rain erosion testing (i.e., within the first 10 min), and then increase with (2010) reported a strong correlation between the measured ice adhesion
much more moderate rates later as the time of the rain erosion testing data and the receding angle of water droplets on the nominally smooth
increases. More specifically, while the ice adhesion strength on the SHS surface. More specifically, Meuler et al. (2010) suggested that the
coated test surface was found to be τice ≈ 105 kPa before starting the rain measured strength of ice adhesion, τice, would change linearly with a
erosion testing, the corresponding value was found to increase to contact angle scaling parameter of [1 + cos θrec], which can be expressed
become τice ≈ 350 kPa (i.e., ~ 3.5 times greater) after 10 min of the rain as:
erosion testing (i.e., after ~50,000 times of droplet impingement) with
τice = A⋅(1 + cosθrec ) (7)
the nominal droplet impacting speed of U∞ = 75 m/s. After 30 min of the
rain erosion testing (i.e., after ~150,000 times of droplet impingement), where A is a constant determined by the substate material, θrec, is the
the ice adhesion strength on the SHS coated test surface was found to receding angle of water droplets on the solid surface.
become τice ≈ 400 kPa, which is slightly smaller than the value over bare More recently, Hejazi et al. (2013) investigated the parallelism be
aluminum surface (i.e., the test surface without SHS coating). It is also tween the hydrophobicity and icephobicity based on fracture mechanics
revealed clearly in Fig. 10 that the relationship between the measured theory and force balance analysis. They suggested that the main
ice adhesion strength data against the rain erosion testing duration parameter affecting water droplet adhesion to a solid surface is CA
would be fitted very well by using an exponential function. It should be hysteresis, while both receding CA and the size of voids/defects are
noted that, after the rain erosion experiments, the SHS coating on the important for the adhesion of ice particles. Hejazi et al. (2013) also
test plate was not completely grinded away, and the eroded SHS coated suggested that ice adhesion strength to a surface can be estimated by:
surface was still found to be icephobic with the static CA (i.e., θstatic, ≈ √̅̅̅̅̅̅̅̅̅̅̅̅̅̅̅̅̅̅̅̅̅̅̅̅̅̅̅̅̅̅̅̅̅̅̅̅̅̅
140◦ ) being much greater than that of the bare aluminum surface (θstatic, 2Eγia (1 + cos(θrec )
τice = (8)
≈ 65◦ ). The significant increase of the ice adhesion strength over the πa
eroded SHS coated surface is believed to be closely related to the van
ishing of the hierarchical texture/roughness structures over the SHS where E is the Young’s modulus of ice, γia is the ice-air interaction en
coated surface due to the rain erosion effects, which will be discussed in ergy, and a is the crack length. Based on the measured ice adhesion
further detail later based on the AFM measurement results. strength and the receding angle values given in Table 1, the nominal
It has been reported that, a hydrophobic material usually also dis crack length of the SHS coated surface before undergoing rain erosion
plays lower ice adhesion strength in comparison to a hydrophilic ma was estimated to be about 3 mm (i.e., a≈ 3 mm) by using the Eq. (8).
terial. This can be explained from a thermodynamic perspective by It should be noted that, after undergoing the rain erosion testing,
invoking the work of adhesion. The work of adhesion Wadh between ice while some of the large-scale texture/roughness structures over the SHS
and a solid material is given as, Wadh = γia + γsa − γ si, where γia is ice coated surface were found to be grinded away due to the rain erosion
surface energy (i.e., ice-air interfacial energy), γ sa is the solid surface effects, the changes in the characteristics scales for the texture/rough
energy (i.e., solid-air interfacial energy) and γ si is the solid-ice interfacial ness structures over the eroded SHS coated surfaces were found to be
energy. Recognizing that the ice surface energy (γia = 75 mJ/m2) is sub-micrometers (i.e., 200–300 nm as revealed quantitatively from the
approximately equal to the water surface energy (or surface tension, γ wa AFM measurement results to be discussed in the next section), which are
= 72 mJ/m2) and assuming that the ice-surface interfacial energy γsi is significantly smaller than the nominal crack length of the SHS coated
approximately equal to the water-surface interfacial energy γ sw, the surface (i.e., a ≈ 3 mm). Since the ice adhesion measurements were
performed with the same test apparatus and follow a same testing pro
cedure, the nominal crack lengths before and after the rain erosion ex
periments were assumed to be almost unchanged for simplicity in
analyzing the measured ice adhesion strength. Therefore, the model of
Hejazi et al. (2013) suggests that the measured strength of ice adhesion,
τice, would change as a square-root function against the contact angle
scaling parameter of [1 + cos θrec].
Fig. 11 gives the measured ice adhesion strength on the SHS coated
test plate against the corresponding receding angle scaling parameter of
[1 + cos θrec] after different duration of the rain erosion testing. Both the
empirical model suggested by Meuler et al. (2010b) (i.e., the linear
function model) and the fracture mechanics model of Hejazi et al. (2013)
(i.e., the square-root-law model) were used to fit the measured ice
adhesion strength data, and the best-fitted curves were also given in the
plot for comparison. It can be seen clearly that, the square-root-law
model of Hejazi et al. (2013) was found to fit the measured ice adhe
sion strength data much better, in comparison to the linear-function
model suggested by Meuler et al. (2010b). This can be explained by
Fig. 10. Measured ice adhesion strength vs. duration of the rain erosion testing. the fact that the empirical model of Meuler et al. (2010b) were actually
9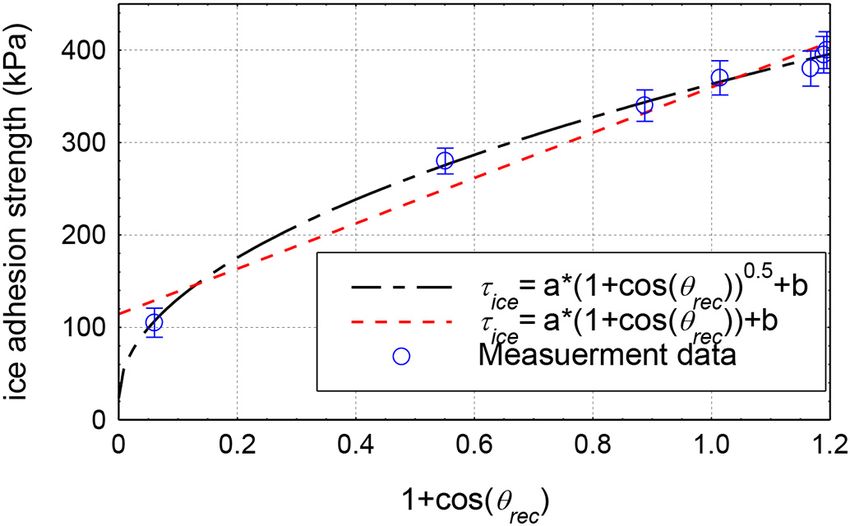
Z. Zhang et al. Cold Regions Science and Technology 181 (2021) 103196
4.4. Variations in the surface topologic characteristics of the SHS coated
surface as a function of the duration of the rain erosion testing
As aforementioned, the variations in the surface topologic charac
teristics of the SHS coated test plate as a function of the duration of the
rain erosion testing were also quantified in the present study by using an
Atomic Force Microscopy (AFM) system, which can be used elucidate
the underlying physics behind the experimental observations presented
above. Fig. 12 shows the AFM scanned images to reveal the significant
changes in the surface topology of the SHS coated test plate before and
after different durations of the rain erosion experiments (i.e., after 10,
30 and 50 min of the rain erosion testing with the nominal droplet
impacting speed of U∞ = 65 m/s). Based on the quantitative AFM
measurement results as those shown in Fig. 12, the key parameters to
characterize surface topology, i.e., the averaged surface roughness (Ra)
and the coresponding root-mean-square (Rq) values, were obtained to
Fig. 11. Measured ice adhesion strength on the SHS coated test plate at Tsurface
quantify the changes of the surface topology characteristics of the SHS
= − 10 ◦ C against the contact angle scaling parameter of [1 + cos θrec].
coated surface due to the rain erosion effects. More specifically, the Ra
value represents the arithmetic average of the absolute heights of the
only applicable for the test cases with nominally smooth/flat surface. surface roughness over the test surface, i.e., Ra = 〈h〉, where h is the local
However, as revealed clearly from SEM images given in Fig. 2, obvious height of the surface roughness. The corresponding Rq value represents
micro− /nano-textures were found to be generated over the SHS coated the root-mean-square of the roughness height over the test surface, i.e.,
test surface, which will enable incident water drops to freeze in the √̅̅̅̅̅̅̅̅̅̅̅
〈 〉
partially wetted Cassie-Baxter state. Since the assumption of nominally Rq = h2 , which is used to indicate the significance of the roughness
smooth/flat surface used to derive the linear-function model of Meuler
et al. (2010) cannot be satisfied anymore, the variation characteristics of
Table 3
the measured ice adhesion strength on the SHS coated test surface could
Measured surface roughness parameters before and after rain erosion testing.
not be fitted well by the linear-function model of Meuler et al. (2010).
Duration of the rain erosion testing (minutes) 0 10 30 50
Ra (nm) 562 380 369 334
Rq (nm) 775 623 573 491
Fig. 12. Typical AFM images to reveal the changes surface topology of SHS-coated test plate after undergoing rain erosion testing with the nominal droplet impacting
speed of U∞ = 65 m/s.
10Z. Zhang et al. Cold Regions Science and Technology 181 (2021) 103196
peaks over the test surface. Table 3 listed the measurement data derived droplets at different liquid water content (LWC) levels. The micro-sized
from the AFM images given in Fig. 12. water droplets carried by the airflow were impinging normally onto a
As shown in Fig. 12(a), obvious nano− /micro-scaled textures/ test plates coated with a typical SHS coating to simulate the scenario
roughness with different sizes and heights were found over the SHS with airborne, micro-sized water droplets in the cloud impacting onto
coated test plate before conducting the rain erosion experiment (i.e., airframe surfaces of an Unmanned-Aerial-System (UAS). During the
existence of hierarchical texture/roughness structures over the test experiments, the surface wettability (i.e., in terms of static, advancing
surface), indicating that the SHS coated test surface is rough enough to and receding contact angles of water droplets siting on the test surfaces)
maintain its superhydrophobicity, as expected. The corresponding sur and the resultant ice adhesion strength on the SHS coated test plate were
face roughness parameters were found to be Ra = 532 nm and Rq = 775 quantified as a function of the duration of the rain erosion experiments.
nm, As revealed clearly from the AFM images given in Fig. 4(b) to (d), The evolutions of the surface topology characteristics of the SHS coated
after undergoing the rain erosion testing, while the texture/roughness surface against the duration of the rain erosion testing were also
structures with relatively smaller size and lower roughness height were examined quantitatively by using an Atomic Force Microscope (AFM)
still observed on the test surface, the large and sharp roughness/texture system.
structures (i.e., textures/roughness with relatively larger size and It was found that, under the same rain erosion testing condition (i.e.,
greater roughness height) were found to be grinded away rapidly due to with the same LWC level in the airflow and droplet impacting speed of
continuous impingement of the water droplets onto the test surface. The U∞), both the static contact angle (CA), θstatic, and the receding CA, θrec,
schematics of the rain erosion effects given in Fig. 6 can be used to of water droplets on the SHS coated test surface were found to decrease
explain the how the large-scale texture/roughness on the SHS coated test monotonically with the increasing duration of the rain erosion testing
surface were grinded away by the impinging water droplets. Upon the experiment (i.e., with more droplets impinging onto the test surface).
dynamic impinging of the water droplets on the test plate at the The wettability degradation of the SHS coated surface (i.e., the
impacting speed of U∞ = 65 m/s, significant deformations and cracks decreasing rates for both the static CA, θstatic, and the receding CA, θrec)
would be initiated over the SHS coated test plate due to the extreme was found to be much faster for the test cases with higher droplet
“water hammer pressure” generated at the initial stage of the droplet impinging speed, in comparison to those with relatively lower droplet
impacting process, as shown schematically in Fig. 6(a). The tremendous impacting speed, as expected. The wettability degradation characteris
“water hammer pressure” (i.e., up to ~100 MPa) would smash the large tics (i.e., the time variations for both the measured static CA, θstatic, and
and sharp roughness/textures on the SHS coated surface directly. the receding CA, θrec) were found to be fitted reasonably well by using
Furthermore, the lateral water jetting effects induced by the Rayleigh exponential functions. The ice adhesion strength on the SHS coated test
surface waves as shown in Fig. 6(b) would also facilitate the tearing plate was found to increase monotonically as the duration of the rain
away of the sharp unevenness/roughness on the test surface. As a result, erosion testing increases. The variations of the resultant ice adhesion
while the surface roughness parameters of the SHS coated test surface strength on the SHS coated test surface against the contact angle scaling
were found to reduce to Ra ≈ 380 nm and Rq ≈ 623 nm after 10 min of parameter of [1 + cos θrec] were found to be fitted well by using a
the rain erosion testing, the corresponding parameters become Ra ≈ 369 square-root-law model reported in the previous study.
and 334 nm, and Rq ≈ 573 and 491 nm, after 30 and 60 min of the rain The variation characteristics of the surface wettability and ice
erosion testing, respectively. It indicates that, the SHS coated test sur adhesion strength were found to correlate well with the surface topology
face would become smoother and smoother as the time of the rain changes of the SHS coated test surface caused by the rain erosion effects
erosion experiment increases. It is well known that the existence of hi revealed from the AFM measurement results. After undergoing the rain
erarchical texture/roughness structures over the SHS coated test surface erosion testing, large and/or sharp roughness/texture structures on the
is the key to maintain its superhydrophobicity. Corresponding to the SHS coated test surface were found to be grinded away rapidly due to the
continuous grind away of the hierarchical texture/roughness structures continuous droplet impinging onto the test surface. Upon the dynamic
over the test surface, the eroded SHS coated test plate was found to lose impacting of water droplets onto the test surface, both the extreme
its superhydrophobicity gradually as the duration of the rain erosion “water hammer pressure” generated at the initial stage of the droplet
testing experiment increases. Therefore, as shown quantitatively in impacting process and the lateral jetting effects associated with the
Figs. 8 and 9, both the static CA, θstatic, and receding CA, θrec, were found generation of Rayleigh surface waves are suggested to be responsible for
to decrease exponentially as the duration of the rain erosion testing tearing away of the shape roughness/unevenness on the SHS coated test
increases. Furthermore, due to the vanishing of the hierarchical texture/ surface. As a result, the SHS coated test surface was found to become
roughness structures over the SHS coated test surface, droplet waters on smoother and smoother as the time of the rain erosion testing increases.
the test surface would be more readily to transition from the partially- Corresponding to the vanishing of the hierarchical texture/roughness
wetted Cassie-Baxter state to the fully-wetted Wenzel state (Nosonov structures on the test surface, the water droplets on the test surface
sky, 2011). Once water freezes within the surface textures in the Wenzel would become more readily to transition from the partially-wetted
state, it would be very difficult to remove the ice, even more than on Cassie-Baxter state to the fully-wetted Wenzel state, eliminating the hy
non-textured surfaces, because of the interlocking between ice and the drophobicity of the test surface. Therefore, both the static CA, θstatic, and
textures (Lv et al., 2014; Nosonovsky and Hejazi, 2012; Sarshar et al., receding CA, θrec, were found to decrease exponentially as the duration
2013). Consequently, as shown quantitatively in Fig. 12, the measured of the rain erosion experiment increases. Furthermore, once water
ice adhesion strength over the SHS coated test surface were found to freezes within the surface textures in the Wenzel state, it would be very
increase monotonically with the increasing duration of the rain erosion difficult to remove the ice, because of the interlocking between ice and
testing experiments. the textures. As a result, the ice adhesion strength over the eroded SHS
coated test surface were found to increase monotonically with the
5. Conclusions increasing duration of the rain erosion testing experiment.
While the primary objective of the present study is to characterize
A comprehensive experimental investigation was conducted to the wettability degradation of SHS coatings induced by the rain erosion
evaluate the variation characteristics of the surface wettability and ice effects, rain erosion effects would also induce surface damages to the
adhesion strength on a typical superhydrophobic surface (SHS) after other state-of-the-art icephobic coatings (e.g., pitcher-plant-inspired
undergoing continuous impingement of water droplets at relatively high slippery liquid-infused porous surfaces (SLIPS) or elastic soft mate
speeds (i.e., up to ~100 m/s). The experimental study was conducted by rials/surfaces) as well as bare metal surfaces. A set of comprehensive
leveraging a specially designed rain erosion testing rig available at Iowa experimental campaigns will be conducted in the near future to examine
State University to exhaust an air jet flow laden with micro-sized water rain erosion effects on surface topology changes and wettability
11You can also read