Impact of long-range transport over the Atlantic Ocean on Saharan dust optical and microphysical properties based on AERONET data - Atmos. Chem. Phys
←
→
Page content transcription
If your browser does not render page correctly, please read the page content below
Atmos. Chem. Phys., 18, 9411–9424, 2018
https://doi.org/10.5194/acp-18-9411-2018
© Author(s) 2018. This work is distributed under
the Creative Commons Attribution 4.0 License.

Impact of long-range transport over the Atlantic Ocean on Saharan
dust optical and microphysical properties based on AERONET data
Cristian Velasco-Merino1 , David Mateos1 , Carlos Toledano1 , Joseph M. Prospero2 , Jack Molinie3 ,
Lovely Euphrasie-Clotilde3 , Ramiro González1 , Victoria E. Cachorro1 , Abel Calle1 , and Angel M. de Frutos1
1 Grupo de Óptica Atmosférica, Dpto. de Física Teórica Atómica y Óptica, Universidad de Valladolid, Valladolid, Spain
2 Cooperative Institute for Marine and Atmospheric Studies, Rosenstiel School of Marine and Atmospheric Science,
University of Miami, Miami, Florida, USA
3 Laboratory of Geosciences and Energy, Université des Antilles, Pointe-à-Pitre, Guadeloupe, France

Correspondence: Carlos Toledano (toledano@goa.uva.es)

Received: 23 November 2017 – Discussion started: 20 December 2017
Revised: 24 May 2018 – Accepted: 10 June 2018 – Published: 5 July 2018

Abstract. Arid regions are a major source of mineral dust          centration, mainly in the coarse mode. The single scattering
aerosol. Transport from these sources can have a great impact      albedo, refractive indexes, and asymmetry factor remain un-
on aerosol climatology in distant regions. In order to assess      changed. The difference in the effective radius over western
the impact of dust on climate we must understand how dust          Africa sites with respect to Caribbean sites ranges between
properties change after long distance transport from sources.      0 and −0.3 µm. Finally we conclude that in about half of the
This study addresses the changes in columnar aerosol prop-         cases only non-spherical dust particles are present in the at-
erties when mineral dust outbreaks from western Africa ar-         mosphere over the western Africa and Caribbean sites, while
rive over the eastern Caribbean after transport across the At-     in the other cases dust particles were mixed with other types
lantic Ocean, a transit of 5–7 days. We use data from the          of aerosol particles.
NASA Aerosol Robotic Network (AERONET) located at
five Caribbean and two western Africa sites to characterize
changes in columnar aerosol properties: aerosol optical depth
(AOD), size distribution, single scattering albedo, and refrac-    1   Introduction
tive indexes. We first characterized the local aerosol climatol-
ogy at each site and then using air mass back trajectories we      Mineral dust is one of the most abundant aerosol types in the
identified those days when trajectories over Caribbean sites       global atmosphere and as such it could play an important role
back-tracked to western Africa. Over the period 1996–2014          in climate. Mineral dust absorbs and scatters terrestrial and
we identify 3174 days, an average of 167 days per year, when       solar radiation and thus affects the Earth’s radiation budget
the air mass over the Caribbean sites could be linked to at        (Choobari et al., 2014). Dust is also involved in cloud micro-
least one of the two western Africa sites. For 1162 of these       physical processes which in turn affect radiation properties
days, AOD data are available for the Caribbean sites as well       and the hydrological cycle (Karydis et al., 2017; DeMott et
as for the corresponding western Africa sites about 5–7 days       al., 2010). Dust also serves as a major source of nutrients for
earlier, when the air mass passed over these sites. We identi-     ocean and terrestrial ecosystems and in this way dust depo-
fied dust outbreaks as those air masses yielding AOD ≥ 0.2         sition can impact the carbon cycle (Jickells et al., 2005). All
and an Ångström exponent below 0.6. On this basis of the           these processes could have a significant impact on climate.
total 1162 days, 484 meet the criteria for mineral dust out-       Given the importance of dust there is a need to understand
breaks. We observe that the AOD at 440 nm decreases by             the factors affecting African dust source activity, the proper-
about 0.16 or 30 % during transport. The volume particle           ties of the dust so produced, and how those properties change
size distribution shows a similar decrease in the volume con-      during transport. Africa is the world’s largest dust source,
                                                                   estimated to produce over half the global total (Huneeus et

Published by Copernicus Publications on behalf of the European Geosciences Union.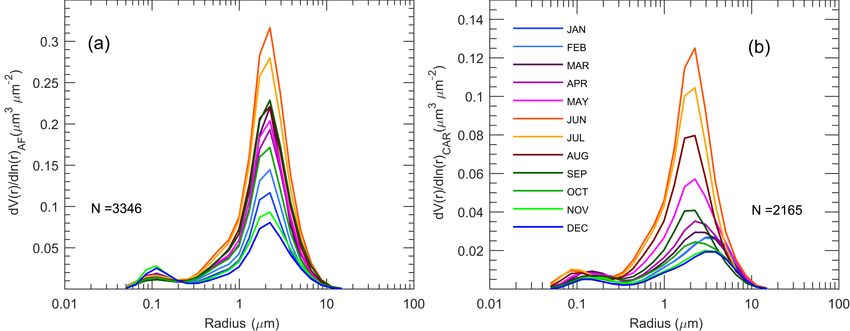
9412                                     C. Velasco-Merino et al.: Impact of long-range transport over the Atlantic Ocean

al., 2011). Much African dust is transported to the west and      tion, and single scattering albedo, among others after the
significant quantities reach South America (Prospero et al.,      long-range transport. Finally the conclusions are presented
2014; Yu et al., 2014, 2015), the Caribbean Sea (Prospero         in Sect. 6.
and Lamb, 2003), and southern United States (Bozlaker et
al., 2013).
   Studies of the dust transport from Africa to the Ameri-        2     Database and methodology
cas have been carried out using meteorological information
linked to in situ and satellite aerosol data (e.g., Jickells et   2.1    AERONET measurements and sites
al., 2005; Rodríguez et al., 2015; García et al., 2017). Re-
                                                                  The main database for this study includes the daily mean
cently developed techniques such as MACC (Monitoring At-
                                                                  values of columnar aerosol data measured by CIMEL CE-
mospheric Composition and Climate; Chouza et al., 2016)
                                                                  318 Sun photometer in the AERONET framework (Hol-
or MOCAGE (Modélisation de la Chimie Atmosphérique
                                                                  ben et al., 1998). The direct sun algorithm provides a
Grande Echelle; Martet et al., 2009) models have been also
                                                                  database that contains instantaneous values (every 15 min)
used to monitor dust plumes.
                                                                  of spectral AOD at 7 wavelengths in the range 340–
   Long-term (e.g., Prospero and Lamb, 2003; Prospero and
                                                                  1020 nm (in some cases also 1640 nm depending on the
Mayol-Bracero, 2013) and short-term (e.g., Reid et al., 2003;
                                                                  instrument model) and the associated Ångström exponent
Colarco et al., 2003; Kaufman et al., 2005; Valle-Díaz et al.,
                                                                  (AE) based on the wavelengths 440 and 870 nm. We only
2016) studies show a seasonal dependence in the intensity
                                                                  use AOD and AE quality-assured cloud-screened level
of dust transport to the Caribbean with the greatest transport
                                                                  2.0 data (version 2) which ensures the reliability of the mea-
in boreal summer. In the SALTRACE program (Weinzierl et
                                                                  surements (see http://aeronet.gsfc.nasa.gov/new_web/PDF/
al., 2017) an aircraft was used to carry out atmospheric col-
                                                                  AERONETcriteria_final1.pdf; last access: 18 June 2018). In
umn closure experiments performed in June and July 2013
                                                                  this work we use only the 440 nm measurements. Figure 1
at western Africa and Caribbean sites. A unique Lagrangian
                                                                  and Table 1 present the five AERONET sites in the Caribbean
in situ study was carried out in SALTRACE wherein a dusty
                                                                  (CAR) area and the two sites in the western Africa (AF) re-
air mass was sampled aboard an aircraft over the islands of
                                                                  gion chosen in this study.
Cabo Verde and again 5 days later over Barbados, a distance
                                                                     In addition the CIMEL instrument takes hourly measure-
of more than 4000 km. They measured a distinct change in
                                                                  ments of sky radiances in almucantar geometry at certain
particle size during transit across the Atlantic and noted that
                                                                  wavelengths in the range 440–1020 nm (in some cases also
the removal rate of large super-micron particles was slower
                                                                  1640 nm; number of wavelengths depends on the instru-
than expected based on simple sedimentation calculations
                                                                  ment model). The sky radiances, together with the AOD, are
(Weinzierl et al., 2017). Similar results had been obtained on
                                                                  used to derive optical and microphysical properties of the
comparisons between surface based measurements at sites in
                                                                  aerosol using inversion procedures (Dubovik et al., 2006).
the Canary Islands and Puerto Rico (Maring et al., 2003).
                                                                  The inversion-derived parameters used in this study are vol-
   Our study is inspired by that experiment, although our
                                                                  ume particle size distribution (dV (r)/d ln(r); VPSD) and the
approach is to use columnar aerosol data collected from
                                                                  volume concentration for the fine, coarse, and total size dis-
CIMEL sun photometers of the AERosol RObotic NET-
                                                                  tribution (VCF , VCC , VCT , respectively), sphericity fraction
work (AERONET) in two areas, western Africa and on is-
                                                                  (SF), total effective radius (ERT ), real part of the refractive
lands in the eastern Caribbean. The temporal coverage of the
                                                                  index (REFR), imaginary part of the refractive index (REFI),
AERONET data is large in both regions, 19 years from 1996
                                                                  single scattering albedo (SSA), and asymmetry parameter
to 2014. Therefore, the aim of this work is to investigate the
                                                                  (g).
changes in dust optical and microphysical properties due to
                                                                     The Level 2 inversion requirement rejects AOD values less
the long-range transport, by comparing AERONET observa-
                                                                  than 0.4 which dramatically reduces the amount of data. In
tions in western Africa and the Caribbean sites using a cli-
                                                                  order to increase the number of measurements in the data
matological approach.
                                                                  set we used level 1.5 inversion products but we applied an
   In Sect. 2 we present an overview of the database and
                                                                  extra level of quality control to ensure the reliability of the
methodology used to match daily averaged AERONET data
                                                                  inversion data:
at both sides of the Atlantic Ocean using air mass back-
wards trajectories. Section 3 describes, separately, the long-        – VPSD and ERT : same as AERONET level 2.0 criteria
term aerosol climatology observed at the western Africa and             (solar zenith angle > 50◦ , number of symmetrical an-
the Caribbean sites and the correlation between aerosol op-             gles, and sky error between 5 and 8 % depending on
tical depth (AOD) and dust concentration observed at the                AOD; see above), but without threshold with respect to
Caribbean sites. Section 4 presents the monthly variability of          AOD.
size-related aerosol parameters. Section 5 presents the sea-
sonality of African–Caribbean Sea air mass connections, as            – SSA, g, REFR, REFI, and SF: same as AERONET
well as the change in aerosol optical depth, size distribu-             level 2.0 criteria but with AOD ≥ 0.20 (see Dubovik et

Atmos. Chem. Phys., 18, 9411–9424, 2018                                            www.atmos-chem-phys.net/18/9411/2018/
C. Velasco-Merino et al.: Impact of long-range transport over the Atlantic Ocean                                                   9413

Figure 1. AERONET sites in the Caribbean area (a) and western Africa region (b). For acronyms see Table 1.

Table 1. Geographical coordinates, considered time period, and total number of level 2.0 AOD daily data from the different AERONET sites
used for the global African and Caribbean databases. To highlight the number of available inversion products, the number of daily data of
volume particle size distribution (VPSD) is presented.

                    Area    Site                            Coordinates             Time period    Number of AOD/
                                                            (◦ N, ◦ E, m a.s.l.)                   VPSD daily data
                    AF      Capo_Verde (CV)                 (16.71, −22.93, 60)     1993–2014      4635/1910
                            Dakar (DK)                      (14.38, −16.95, 0)      1996–2014      3593/2466
                    CAR     Barbados (BA)                   (13.15, −59.62, 114)    1996–2000      938/50
                            Barbados_SALTRACE (BA)          (13.15, −59.62, 114)    2013–2014      181/7
                            Ragged_Point (RG)               (13.15, −59.42, 40)     2007–2014      1768/415
                            Guadeloup (GU)                  (16.22, −61.53, 39)     1997–2014      1949/441
                            La_Parguera (LP)                (17.97, −67.03, 12)     2000–2014      3303/1467
                            Cape_San_Juan (SJ)              (18.38, −65.62, 15)     2004–2014      1901/401

     al., 2006; Mallet et al., 2013; Mateos et al., 2014) in-           2.2    Linkage between Caribbean and western Africa by
     stead of > 0.4.                                                           air mass back trajectories
   The use of level 1.5 filtered data with an extra quality con-        All the air mass links between western Africa and Caribbean
trol has been previously used by other authors (e.g., Burgos et         sites are examined. This task requires separate analysis for
al., 2016) with minor loss of accuracy (Mateos et al., 2014).           each Caribbean site. For example, the methodology used in
All the available inversion products are daily averaged in this         this study for Barbados is the following:
study. With the threshold of AOD ≥ 0.2, estimated uncer-
tainty for dust retrievals of the single scattering albedo is              – Step 1: We calculated three-dimensional 10-day back
0.03, REFR is 0.04, REFI is 50 %, and the VPSD is 35 %                       trajectories with 1 h time resolution using the Hybrid
(see Dubovik et al., 2000). The climatology of key aerosol                   Single Particle Lagrangian Integrated Trajectory (HYS-
properties measured at western Africa and Caribbean sites is                 PLIT) model version 4.0 (Stein et al., 2015). The ge-
addressed in Sect. 3. All daily available records (see Table 1)              ographical coordinates used as the start point for Bar-
at the two western Africa and five Caribbean sites are av-                   bados are presented in Table 1. As mineral dust can
eraged in the 1996–2014 period, resulting in two databases                   be transported at altitude levels higher than the bound-
with 5656 and 5099 days of data, respectively.                               ary layer, most notably in the Saharan Air Layer (SAL;
                                                                             Carlson and Prospero, 1972; Yu et al., 2014; Groß et al.,
                                                                             2016), back trajectories were calculated at 750, 2500
                                                                             and 4500 m (a.g.l.). The core of the SAL is typically

www.atmos-chem-phys.net/18/9411/2018/                                                    Atmos. Chem. Phys., 18, 9411–9424, 2018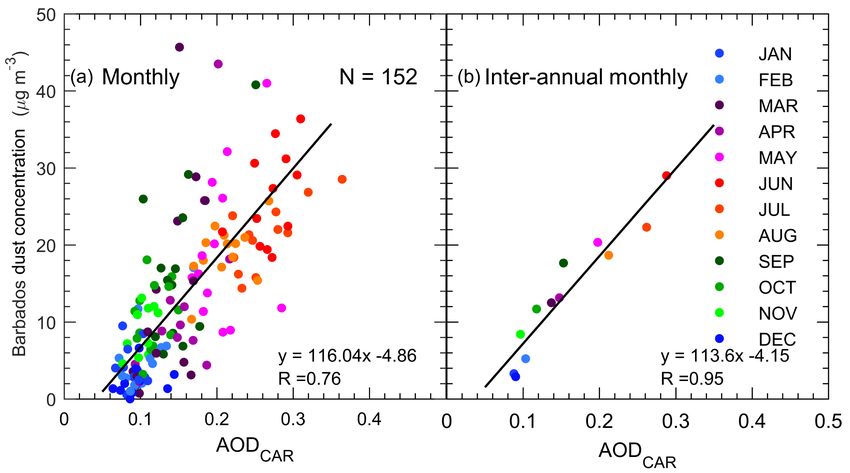
9414                                      C. Velasco-Merino et al.: Impact of long-range transport over the Atlantic Ocean

     at around 2500 m. For the trajectory vertical motion,
     we used the model vertical velocity. The meteorologi-
     cal database used as input for HYSPLIT is the global
     NCAR/NCEP Reanalysis (Kalnay et al., 1996). The
     evaluation is performed for each day in the period 1996–
     2014 at 16:00 UTC (around local noon).

  – Step 2: If any of these trajectories for Barbados (at one,
    two or three heights) passes through a 3◦ × 3◦ box cen-
    tered on the western Africa sites, we consider that a link
    has been established between the two sites. The tran-
    sit time is typically about 5–7 days. In some cases an
    air mass back trajectory may link both the Capo_Verde
    and Dakar boxes. In such cases the mean of the aerosol         Figure 2. Monthly average of AOD and AE from 1996 to 2014 in
    observations is used.                                          the western Africa area. The number of daily means used in the
                                                                   multi-annual averages is 5656.
  – Step 3: Once the dates in which the air mass is mea-
    sured in Barbados and in Capo_Verde or Dakar (or both)
    sites are established, the associated AERONET aerosol          Africa sites. In the global database there are, therefore, three
    data are identified. In the case of Barbados site, the cor-    different cases which are extensively analyzed in Sect. 5:
    responding daily means of all AERONET products are                 a. DAF + DCAR : desert dust conditions occur in both
    used. However, the western Africa site analysis requires              Caribbean and western Africa sites;
    a special procedure. The visual inspection of many of
    the cases shows that the aerosol records for the spe-              b. DAF + NoDCAR : dust conditions in western Africa sites
    cific date obtained in the trajectory analysis often fell             but no-dust condition at the Caribbean sites;
    on a day without data (e.g., due to cloudy or rainy con-
    ditions) or did not capture the central days of the dust           c. NoD: no-dust conditions or dust conditions at the
    event. To resolve this problem, we introduced a ±1-                   Caribbean sites with unproven origin.
    day adjustment to the back-trajectory-estimated date at           We found a total of 3174 days with connections be-
    Capo_Verde and Dakar. This is in line with previous            tween western Africa and Caribbean sites. Only 1162 out
    studies which state that desert dust episodes in western       of 3174 days yielded AERONET data (level 2.0) for AOD
    Africa sites usually last for several days (e.g., Knippertz    and AE. Of these 1162 acceptable days, 484 meet the cri-
    and Stuut, 2014). The aerosol values for each western          teria for mineral dust outbreaks (AOD ≥ 0.2 and AE ≤ 0.6,
    Africa site are therefore averaged over the 3 days (the        “DAF + DCAR ” case). However for the analysis of micro-
    estimated date and ±1 day). For the Barbados–African           physical and radiative properties, the number of matching in-
    cases with air masses overflowing both Capo_Verde and          version data is much smaller (just 71 cases) because of the
    Dakar sites, the corresponding average of aerosol data is      more stringent requirements. The frequent cloudiness at the
    used.                                                          Caribbean sites is the main difficulty in the inversion of sky
                                                                   radiances (see Table 1).
   These three steps described above are applied to all
Caribbean sites as shown in Table 1. This methodology
yields five databases (one per site) in which each Caribbean       3    Seasonal variability of aerosol load at the western
site is linked with data for western Africa sites. For each             Africa and Caribbean sites
day between 1996 and 2014 we determine which Caribbean
sites present an air mass link with western Africa sites. If       In this section the analysis of the monthly seasonal cycle
more than one western Africa site yields a link for a specific     of the main aerosol properties at the Caribbean and western
Caribbean event, we use the mean properties as discussed           Africa sites is presented separately since there is no require-
above.                                                             ment that trajectories connect the sites. This section sum-
   We identify a desert dust event on the basis of the fol-        marizes overall multi-year statistics (from 1996 to 2014) of
lowing criteria: AOD ≥ 0.2 and AE ≤ 0.6 (e.g., Dubovik             AOD, AE, and VPSD quantities.
et al., 2002; Guirado et al., 2014). In the evaluated                 Figures 2 and 3 present the multiannual AOD and
global Caribbean–African linked database, the Caribbean            AE monthly averages of 19 years in western Africa and
and African data are analyzed separately. Hence, there are         Caribbean regions, respectively. There is a significant differ-
two different inventories that contain all days meeting the cri-   ence between the “cold” (October–April) and “warm” (May–
teria for mineral dust events over the Caribbean and western       September) seasons in both areas.

Atmos. Chem. Phys., 18, 9411–9424, 2018                                              www.atmos-chem-phys.net/18/9411/2018/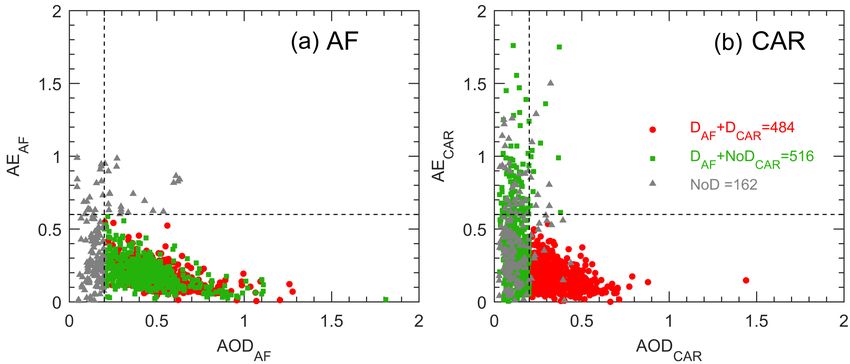
C. Velasco-Merino et al.: Impact of long-range transport over the Atlantic Ocean 9415
deserts and biomass burning episodes. In particular, the large
change in AE in the cold season is largely due to the advec-
tion of pollutant aerosols from higher latitudes (e.g, Savoie
et al., 2002; Zamora et al. 2013).
Previous work (e.g., Smirnov et al., 2000) has shown
that high concentrations of dust at the surface are corre-
lated with high column optical depths measured by a col-
located AERONET instrument. Yu et al. (2014) has shown
that CALIPSO (Cloud-Aerosol Lidar and Infrared Pathfinder
Satellite Observations) dust concentrations over Barbados
track the surface-based measurements of dust. In Fig. 3
we show the relationship between the long-term measure-
Figure 3. Monthly average of AOD and AE in the Caribbean area ments of dust concentrations at the surface with the colum-
from 1996 to 2014 and surface dust concentrations in Barbados nar aerosol load manifested in AOD. We use the surface dust
in the period 1996–2011. The number of daily means used in the concentration measured at the Ragged Point site, Barbados
multi-annual averages is 5099 for AODCAR and AECAR and 5167 (e.g., Prospero and Lamb, 2003; Prospero and Mayol, 2013)
for surface dust concentration in Barbados. between 1996 and 2011. Daily surface dust concentrations
are obtained with high-volume filter samplers using mea-
sured aluminum concentrations and assuming an Al content
In the winter season there is a weak variation of AOD and of 8 % in soil dust (e.g., Prospero, 1999) or from the weights
AE at the western Africa sites (see Fig. 2) with values around of filter samples ashed at 500 ◦ C after extracting soluble com-
0.3 and 0.3–0.5, respectively. In contrast in the summer sea- ponents with water (Prospero, 1999; Prospero et al., 2014;
son there is an increase of AOD together with a decrease of Savoie et al., 2002).
AE until June when the maximum of AOD (0.6) coincides Surface dust concentration seasonal cycle (Fig. 3) presents
with a minimum of AE (0.16). The AOD peak was also ob- a significant increase between low values during October–
served by, e.g., Tegen et al. (2013). After June there is a pro- April season up to larger concentrations in May–September
gressive decrease of AOD values and increase in AE until season. Overall, the shapes of the annual cycles of AOD and
once again reaching winter levels. Overall, the large AOD surface dust concentration at Barbados are similar and the
and low AE values suggest dominant effect of coarse parti- same seasonal pattern in both variables is observed.
cles in dust episodes. The ranges of AOD between 0.3 and Monthly mean AOD is highly correlated with surface
0.6 and AE below 0.5 were also obtained by previous studies dust concentrations as shown in Fig. 4 which is based on
in western Africa sites (e.g., Dubovik et al., 2002; Horowitz 3700 pairs of daily data, a total of 192 monthly mean values,
et al., 2017). Haywood et al. (2008), Derimian et al. (2008), and 12 interannual monthly mean values, the latter calcu-
and Leon et al. (2009) reported that M’Bour site (western lated as the average of the available daily data from the same
Senegal, 70 km away from Dakar) is strongly influenced by month over a multi-annual period. The seasonal distribution
desert dust throughout the year. The effects of biomass burn- of the surface–columnar values seems to follow a linear in-
ing are seen in November and December when AE reaches its creasing pattern from winter (bluish colors) to summer (red-
maximum of about 0.5; this is the time of year when biomass dish colors). The slope of the fit between dust concentration
burning is at a maximum in the Sahel. and AOD is about 115 µg m−3 per unit of AOD for the two
The annual cycle of AOD at the Caribbean sites (see cases analyzed here: using 192 monthly means (Fig. 4a) and
Fig. 3) shows a bell shape with the maximum in June 12 interannual monthly means (Fig. 4b). The Barbados dust
(AOD = 0.3) and the minimum values in December–January. concentration vs. AOD shows very good correlation when
In contrast, the AE displays a larger variability along the the same months are averaged along the years. However, the
year: an increase from January to April when AE = 0.7 (the monthly agreement between these two variables displays a
annual maximum), followed by a steady sharp decline un- certain degree of dispersion with a moderate correlation co-
til the absolute minimum in June–July with AE = 0.26. Lev- efficient. The positive intercepts on AOD in the fits are most
els remain constant around 0.55 from September to Decem- likely attributable to the effects of sea salt aerosol on AOD.
ber. These features in the AOD and AE seasonality can be
understood as the fingerprint of the occurrence of mineral
dust transport from Africa. The AE variability evidenced by 4 Monthly variability of size-related aerosol
the standard deviations is largely driven by the changes in parameters
aerosol mixture that occur in this area (e.g., Reid et al., 2003).
Clean maritime conditions, associated with background val- Figure 5 displays the average monthly cycle of the vol-
ues, have low AOD and low AE (Smirnov et al., 2000), but ume particle size distribution (VPSD) for the western Africa
they can be modified by mineral dust outbreaks from African and Caribbean sites, respectively. These figures are based on
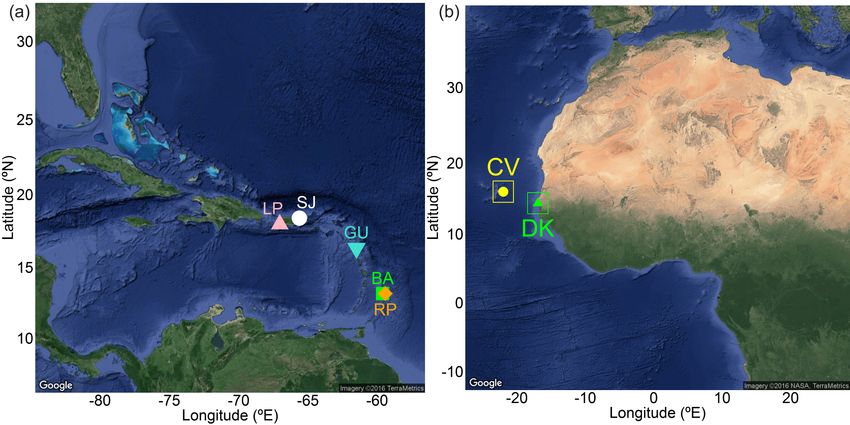
www.atmos-chem-phys.net/18/9411/2018/ Atmos. Chem. Phys., 18, 9411–9424, 20189416 C. Velasco-Merino et al.: Impact of long-range transport over the Atlantic Ocean Figure 4. Scatter plot of (a) monthly and (b) interannual monthly means of surface dust concentration and AOD in the Caribbean Basin in the period 1996–2011. Solid line indicates the linear fit between both quantities and R indicates the correlation coefficient. Figure 5. Monthly averages of the volume particle size distribution (dV (r)/d ln(r)) from 1996–2014 in western Africa (a) and Caribbean (b) areas. 3346 and 2165 daily mean values of the AERONET inver- than 0.6 µm) with VPSD peaks in the coarse mode at 2 µm, sion products selected as described above. which are independent of the aerosol load. The coarse-mode predominance can be observed through- The conditions observed at the Caribbean sites (Fig. 5b) out the year in both areas. The seasonal cycle of VPSD in show a change in the mean size of the aerosol particles during western Africa sites (Fig. 5a) shows a clear change of coarse- the course of the year. In the warm season (May–September) mode concentration throughout the year, although the coarse- the maximum concentration peaks of about 2 µm radius iden- mode effective radius does not change, with peak concentra- tical to the coarse-mode size distribution found at the western tion of about 2 µm. The coarse-mode concentration ranges Africa sites (Fig. 5a), although the concentration values are between maximum values in June with 0.32 µm3 µm−2 and lower (as is AOD). In the cold season (October–April), how- minima in November–December with 0.05 µm3 µm−2 . In ever, the coarse-mode maximum concentration is shifted to terms of volume concentration the fine mode plays an al- larger radii (> 3 µm) highlighting the predominance of large most negligible role throughout the year for the DAF + DCAR sea salt particles. This difference in the coarse-mode radii cases. This seasonal pattern was already reported by previ- between marine aerosol and dust has been observed in other ous studies at the western Africa sites (e.g., Dubovik et al., coastal locations affected by dust outbreaks (e.g., Prats et 2002; Eck et al., 2010; Guirado et al., 2014). These studies al., 2011). In addition, the maximum volume concentration showed the domination of large particles (i.e., radius greater of the coarse-mode exhibits maximum values in June with Atmos. Chem. Phys., 18, 9411–9424, 2018 www.atmos-chem-phys.net/18/9411/2018/
C. Velasco-Merino et al.: Impact of long-range transport over the Atlantic Ocean                                          9417

                                                                  in aerosol load observed in the seasonal cycle at the western
                                                                  Africa sites (see Fig. 2).
                                                                     With the beginning of the warm season (May–September)
                                                                  the number of connections shows a notable increase achiev-
                                                                  ing its maximum in July with almost all the days at the
                                                                  Caribbean sites being connected with those in western
                                                                  Africa. From October to December there is a progressive de-
                                                                  cline in links from 20 to 10 days per month.
                                                                     Unfortunately, columnar aerosol data are not available for
                                                                  all of the 3174 connection days. A total of 1162 out of
                                                                  3174 days (36 % of the total) are present in AERONET AOD
                                                                  and AE data of level 2.0 (see Sect. 2.1). Furthermore, only
                                                                  484 cases (15 % of the total) meet the dusty criteria in both
                                                                  areas (DAF + DCAR case described in Sect. 2.2). This is due
                                                                  to the limitation in the data coverage and to the strict cri-
                                                                  teria used to unambiguously identify desert dust events. It
                                                                  should be noted that this procedure underestimates the ac-
                                                                  tual number of desert dust events observed by ground-based
Figure 6. Seasonal cycle of number of African–Caribbean Sea air
                                                                  measurements. For instance, during June–July–August at the
mass connections. The number of air mass links is 169 per year,   Caribbean sites there is essentially continuous dust (e.g.,
with a total of 3174 links in the 19-year period analyzed.        Prospero et al., 2014), which is corroborated in this study
                                                                  with an average of 23–28 connection days in these months.

0.12 µm3 µm−2 and minimum ones in November–December               5.2   Scatter plot of AE–AOD in the western Africa and
with 0.02 µm3 µm−2 . In terms of volume concentration the               Caribbean areas
fine mode plays a minor role throughout the year at the
                                                                  The next step focuses on the comparison of the aerosol prop-
Caribbean sites. The entire size range of VPSD in the cold
                                                                  erties observed at the Caribbean sites and the values of the
season is in line with previous studies carried out in oceanic
                                                                  same properties which were observed 5–7 days earlier over
environments (e.g., Dubovik et al., 2002) with low particle
                                                                  the western Africa sites. In this way, the impact of the long-
volume concentrations peaking at very large radius (> 3 µm).
                                                                  range transport can be quantified. Figure 7 presents the scat-
                                                                  ter plot of AE–AOD for those days with aerosol data and air
                                                                  mass links between the two areas. When the criteria for iden-
5     Air mass connections between western Africa and             tifying mineral dust (AOD ≥ 0.2 and AE ≤ 0.6) are applied
      Caribbean areas                                             to the global Caribbean–African connected database, three
                                                                  different cases are identified (see Sect. 2.2).
In this section, we select only those days when the back tra-        At the western Africa sites (Fig. 7a), as expected be-
jectories link western Africa sites with Caribbean sites as ex-   cause of the proximity to the Saharan Desert, the influence
plained in Sec. 2.2. In this way, the aerosol properties ob-      of the mineral dust aerosol properties is predominant: 86 %
served at the Caribbean sites can be compared those observed      of the available data have AOD ≥ 0.2 and AE ≤ 0.6, (1000
5–7 days earlier over the western Africa sites.                   out of 1162 days). We identified the occurrence of 498 dusty
                                                                  days at the Caribbean sites, about 42 % of the entire global
5.1    Overview over air mass connections                         Caribbean–African connected database, but just 484 days (in
                                                                  the period 1996–2014) are shown to be dusty days at the
Following the methodology described in steps 1 and 2 of           Caribbean sites with aerosol origin in the Saharan desert (in-
Sect. 2.2, we obtained a list of days when Caribbean air          dicated as a DAF + DCAR case in Fig. 7). Intense dusty days
masses could be linked to western Africa. Figure 6 shows          (AOD larger than 0.5) occur in western Africa and Caribbean
the seasonal cycle of the total number of days with this con-     sites in 430 and 67 cases, respectively. This difference is
nection in the period 1996–2014. Overall, almost half of the      attributable to a decrease in aerosol load during transport
days each year (∼ 167 days per year) display a Caribbean–         between the two regions. Out of the total of 1162 cases
African linkage with a total of 3174 cases in 19 years.           516 meet the dusty criteria only in the African database
   The total number of air mass connections between both          (DAF + NoDCAR case in Fig. 7). This decrease in dust loads
areas exhibits small values from January through April with       is also observed in the change of the AE and AOD using
an absolute minimum in April of only 2 days per month. This       ground-based and satellite measurements (see, e.g., Yu et al.,
minimum at the Caribbean sites coincides with the minimum         2014). For instance, there are 102 cases in the Caribbean

www.atmos-chem-phys.net/18/9411/2018/                                             Atmos. Chem. Phys., 18, 9411–9424, 2018
9418 C. Velasco-Merino et al.: Impact of long-range transport over the Atlantic Ocean
Figure 7. AE–AOD scatter plot for all data days in (a) western Africa and (b) Caribbean Sea. Red circles are dust days in both Africa (DAF )
and Caribbean (DCAR ) databases, green squares are dust days in western Africa that are not dusty in Caribbean area (NoDCAR ), and grey
triangles are non-dusty days (“NoD”). Dashed lines indicate the criteria for identifying mineral dust (AOD ≥ 0.2 and AE ≤ 0.6). See text in
Sect. 2.2.
Figure 8. Scatter plot of AOD in the Caribbean (AODCAR ) versus Figure 9. Volume particle size distribution, dV (r)/d ln(r), in the
AOD in the western Africa region (AODAF ) when dust is observed western Africa (AF) and the Caribbean (CAR) areas under desert
in both areas (DAF + DCAR case; see Sect. 2.2). The color scale dust conditions (DAF + DCAR case; see Sect. 2.2).
indicates the AE in the Caribbean area (AECAR ). Dashed line in-
dicates no change in AOD between both areas, and R indicates the
correlation coefficient.
5.3 Scatter plot of connected AOD data
database where AE > 0.6, whereas the same air mass yielded Once the connections have been detected, changes in AOD
AE < 0.6 at the western Africa sites days before. Probably due to the long-range transport over the Atlantic Ocean are
there are days with presence of dust with AOD and AE val- studied depending on the AE values. The results are shown in
ues close to the required thresholds (156 and 59 days in the Fig. 8. The AODCAR has been plotted as a function of AOD
interval of 0.15 < AOD < 0.20 at the Caribbean and western at the western Africa sites (AODAF ).
Africa sites, respectively). We considered lowering the AOD The scatter plot in Fig. 8 shows that there is, as expected,
threshold so as to include more cases but this would reduce a decrease in AOD in air masses transiting the Atlantic.
confidence about the actual presence of dust. The mean decrease of AOD between western Africa and
Caribbean sites is 0.16, a decrease of about 30 % with re-
spect to the values at Dakar and Cabo Verde. They are great-
est for cases where AOD values are large (AOD > 0.8) at the
Atmos. Chem. Phys., 18, 9411–9424, 2018 www.atmos-chem-phys.net/18/9411/2018/C. Velasco-Merino et al.: Impact of long-range transport over the Atlantic Ocean 9419
Figure 10. Histogram of the differences between the total effec- Figure 11. Sphericity fraction values in the western Africa region
tive radii in the western Africa region and in the Caribbean area and in the Caribbean area for those cases with desert dust in both
for those cases with connected desert dust conditions in both areas areas (DAF + DCAR case; see Sect. 2.2).
(DAF + DCAR case).
The VPSD at the Caribbean sites for the DAF + DCAR
western Africa sites, with decreases up to 70 %. In the inter- case is similar to that at the western Africa sites: average
val 0.5 < AOD < 0.8 the decreases are in the range of about coarse-mode volume concentration of 0.22 µm3 µm−2 , maxi-
28–45 %, while those in the interval 0.2 < AOD < 0.5 are in mum peak of about 2 µm radius, and very low fine-mode con-
the range 11–27 %. These percentages based on long-term centration (average of 0.02 µm3 µm−2 peaking at 0.086 µm,
and ground-based data are a first approach to assess the es- fine-mode volume fraction of 0.09). The coarse-mode vol-
timations done by studies dealing with satellite data. For in- ume concentration decreases from 0.34 µm3 µm−2 in western
stance, Yu et al. (2015) have reported, in a latitudinal belt of Africa to 0.22 µm3 µm−2 at the Caribbean sites. Hence, there
10◦ S–30◦ N, a loss of 70 % (±45–70 %) of the dust amount is a loss of about 35 % in the coarse-mode concentration be-
(in Tg yr−1 ) between western Africa (at 15◦ W) and the end tween both areas caused by the long-range transport over the
of the Caribbean sites (at 75◦ W). Hence, our estimations are Atlantic Ocean.
in line with these findings considering that the measured vari- To quantify the change in the mean aerosol size caused
able and studied area are not identical. by the long-range transport, Fig. 10 shows the histogram of
The cases with low AE values are those cases with a wider the differences between the effective radius of the total size
variability in AOD difference. In addition, there are some distribution (ERT ) in the two areas. On average, ERT shows
cases in which AOD is larger at the Caribbean sites. There values of 0.88 and 0.76 µm in western Africa and Caribbean
could be different reasons which explain this effect: inhomo- sites, respectively. Most of the differences in the ERT values
geneity of the dust layer, addition of other aerosol particles at are negative, thus indicating the size distribution in western
the Caribbean sites, temporal gaps in the instantaneous mea- Africa generally having larger particles than at the Caribbean
surements that cause non-representative daily averages, and sites. The differences in the effective radii are mostly con-
cloud contamination not detected by the cloud-screening al- fined (about 70 % of the cases) between no change and a de-
gorithm, for example. crease in the effective radius of about 0.3 µm between both
areas. The maximum of occurrence is found for a decrease
5.4 Aerosol microphysical properties for of about 0.2 µm. Positive differences (15 % of the cases),
African–Caribbean Sea connections meaning larger particle size at the Caribbean sites, could be
attributed to the presence of other aerosol layers (e.g., sea
In this section we focus on the key aerosol microphysical salt) in the atmospheric column. Uncertainties of the inver-
properties for those cases where we found a link between sion could also explain the positive differences.
the western Africa and Caribbean sites. Figure 9 shows the The third microphysical property studied here is the frac-
average VPSD for the case analyzed before: dust conditions tion of spherical particles found in the inversion process.
in both areas (DAF + DCAR ). The main characteristics of the In the retrieval, particles are modeled both as spheres and
VPSD curve for this collection of data in the western Africa spheroids, and the inversion finds which fraction of spherical
sites are the same as described in detail in Sect. 4. The fine- and non-spherical particles better fits the observations (for
mode volume fraction (obtained as the ratio VCF / VCT ) is details, see Dubovik at al., 2006). The results are presented
on average 0.077. in Fig. 11. This figure shows that at the western Africa sites
www.atmos-chem-phys.net/18/9411/2018/ Atmos. Chem. Phys., 18, 9411–9424, 20189420 C. Velasco-Merino et al.: Impact of long-range transport over the Atlantic Ocean
Figure 12. Average values of (a) single scattering albedo (SSA) and asymmetry parameter (g), (b) imaginary part of the refractive index
(REFI), and (c) real part of the refractive index (REFR) for those cases with desert dust in both the western Africa region (black lines) and
Caribbean area (red lines; DAF + DCAR case; see Sect. 2.2).
there is a large predominance of non-spherical particles, that range transport. SSA in Fig. 12a and REFI in Fig. 12c are the
is, SF < 0.05. Respectively, about 80 and 53 % of the values same in both areas within the limits of uncertainty. The SSA
at the western Africa and Caribbean sites were completely at Dakar and Cabo Verde increases with wavelength: from
non-spherical. Overall, in 32 out of 71 cases (45 %) there is 0.94 at 440 nm up to 0.98 at 670, 870, and 1020 nm. These
no change between both areas and the shape of the particles is figures are in line with previous studies in this area (Dubovik
predominantly non-spherical. Cases with sphericity fraction et al., 2002; Eck et al., 2010; Kim et al., 2011; Toledano et al.,
below 0.05 in western Africa sites display a wide variability 2011; Giles et al., 2012, among others) and also with mea-
in the observed fraction at the Caribbean sites, even achiev- surements at various Spanish and Mediterranean sites dur-
ing values of 0.7. This increase could be explained by the ing desert dust outbreaks (e.g., Meloni et al., 2006; Cachorro
mixture of mineral dust with other (spherical) aerosol parti- et al., 2010; Valenzuela et al., 2012; Burgos et al., 2016).
cles, such as maritime aerosols. Note that we use column ob- The SSA in dust events at the Caribbean sites is essentially
servations; therefore the mixture in this case does not mean identical to that at the western Africa sites. The same is true
that dust and other aerosol particles are necessarily in the for REFI: 0.0025 at 440 nm and 0.001–0.0015 in the inter-
same layer; they can be separated in different atmospheric val 670–1020 nm. The values in the visible and near infrared
layers. For instance, during the SALTRACE experiment the ranges are slightly larger than those reported by Dubovik et
main four dust events recorded presented a vertical structure al. (2002) which were about 0.0007; their value at 440 nm is
with up to three layers: the boundary layer, the entrainment very similar to the value we present here. There is no signifi-
or mixing layer, and the pure Saharan dust layer (Groß et al., cant change in the REFR either, as it is the mean real part of
2015). Uncertainties of the inversion method can also be a the refractive index in the African and Caribbean database,
reason for the high fraction of spherical particles. The in situ at about 1.45 ± 0.01. This value is slightly lower than that
measurements at Barbados collect dust in the boundary layer reported by Dubovik et al. (2002) which was about 1.48. Fi-
(Prospero, 1999; Smirnov et al., 2000; Yu et al., 2014), so nally, the asymmetry factor g at 440 nm decreases slightly
that dust is collected simultaneously with sea salt and other from 0.77 in western Africa sites to 0.755 at the Caribbean
aerosol types (e.g., Ansmann et al., 2009; Toledano et al., sites. The g values reported in this study are slightly larger
2011; Groß et al., 2011). There is a correlation between high than those reported by previous studies for desert dust in
in situ dust mass concentrations, high total aerosol optical Africa (e.g., Dubovik et al., 2002). Overall, the intensive op-
depth, and low Ångström exponent (Groß et al., 2016). How- tical properties (both absorption and scattering quantities) do
ever the highest concentrations of dust are found in the ele- not change significantly in spite of the long-range transport.
vated Saharan Air Layer (Yu et al., 2014), where there are no
significant concentrations of sea salt aerosol (Savoie et al.,
2002). 6 Conclusions
5.5 Aerosol radiative properties for The objective of this study was to characterize changes in
African–Caribbean Sea connections aerosol physical–radiative properties that occur in dust-laden
air masses that transit the Atlantic from Africa to the eastern
Figure 12 compares the main radiative properties (SSA, g, Caribbean. To this end we compared AERONET sun pho-
REFR, and REFI) at the Caribbean and western Africa sites tometer measurements and inversion products made over the
to assess changes in optical properties that occur after long- period 1996–2014 at five island sites in the eastern Caribbean
Atmos. Chem. Phys., 18, 9411–9424, 2018 www.atmos-chem-phys.net/18/9411/2018/C. Velasco-Merino et al.: Impact of long-range transport over the Atlantic Ocean 9421
with those made at two sites in western Africa. Focusing first Special issue statement. This article is part of the special issue
on the results observed from the two western Africa sites, we “The Saharan Aerosol Long-range Transport and Aerosol-Cloud-
find that the dust properties are quite similar to those pre- interaction Experiment (SALTRACE; ACP/AMT inter-journal SI)”.
viously reported for Saharan dust in field experiments and It is not associated with a conference.
previous studies using AERONET data.
We focused efforts on paired measurements made on the
same dust outbreaks in a procedure that identified trajectories Acknowledgements. The authors gratefully acknowledge the
NASA AERONET program for the very valuable data used in
from the Caribbean island sites that back-tracked to one or
this study. We thank Brent Holben (Barbados, La_Parguera),
both of the western Africa sites. We find that there is no sub-
Didier Tanre (Capo_Verde, Dakar), and Olga Mayol-Bracero
stantial change in the intensive radiative properties in west- (Cape San Juan) for their effort in establishing and maintaining
ern Africa air masses after a journey of 5–7 days over a dis- their sites. This work has received funding from the European
tance of 4000 km. There is a decrease of about 30 % in the Union’s Horizon 2020 research and innovation programme
coarse-mode concentration of the size distributions but the under grant agreement no. 54109 (ACTRIS-2). The authors are
coarse-mode effective radius does not change. Non-spherical grateful to Spanish MINECO for the financial support of the IJCI-
particles characteristic of dust are the predominant shape in 2014-19477 grant, PTA2014-09522-I grant, and POLARMOON
both areas. In general there were no substantial changes in project (ref. CTM2015-66742-R). We also thank “Consejería
the spectral dependence of the absorbing and scattering prop- de Educación” of “Junta de Castilla y León” for supporting the
erties of dust during transit. GOA-AIRE project (ref. VA100P17). Prospero received support
from NSF AGS-0962256 and NASA NNX12AP45G.
Our findings that suggest uniformity in properties are sim-
ilar to those reached in Bozlaker et al. (2017), who mea- Edited by: Bernadett Weinzierl
sured the concentrations and isotopic composition of a broad Reviewed by: three anonymous referees
suite of elements in Barbados dust samples collected in 2013
and 2016. Although dust concentrations were highly vari-
able, the elemental and isotopic abundances fell within a rela-
tively narrow range compared to wide-ranging compositions
reported for hypothesized dust sources in North Africa. In References
contrast the Barbados composition was very similar to that
Ansmann, A., Baars, H., Tesche, M., Müller, D., Althausen, D., En-
reported in the literature for samples collected at sites on the
gelmann, R., Pauliquevis, T., and Artaxo, P.: Dust and smoke
coast of western Africa on islands or ships close to the coast. transport from Africa to South America: Lidar profiling over
These results suggest that during large dust events, the dust Cape Verde and the Amazon rainforest, Geophys. Res. Lett., 36,
from different sources which may have different signatures L11802, https://doi.org/10.1029/2009GL037923, 2009.
becomes homogenized during transport from the interior of Bozlaker, A., Prospero, J. M., Fraser, M. P., and Chellam, S.: Quan-
North Africa to the coast and that there is relatively little tifying the contribution of long-range Saharan dust transport on
change in dust properties during transit of the Atlantic. particulate matter concentrations in Houston, Texas, using de-
The results of our study and that of Bozlaker et al. (2017) tailed elemental analysis, Environ. Sci. Technol., 47, 10179–
suggest that the modeling of the radiative effects of dust over 10187, https://doi.org/10.1021/es4015663, 2013.
the Atlantic can be simplified in that it can be assumed that Bozlaker, A., Prospero, J. M., Price, J., and Chellam, S.: Link-
ing Barbados Mineral Dust Aerosols to North African Sources
the radiative properties of dust are relatively uniform and un-
Using Elemental Composition and Radiogenic Sr, Nd, and Pb
changing during transport within the context of the range of
Isotope Signatures, J. Geophys. Res.-Atmos., 123, 1384–1400,
properties discussed here. https://doi.org/10.1002/2017JD027505, 2017.
Burgos, M. A., Mateos, D., Cachorro, C., Toledano, C., and de Fru-
tos, A. M.: Aerosol properties of mineral dust and its mixtures
Data availability. Backward trajectories analysis has been sup- in a regional background of north-central Iberian Peninsula, Sci.
ported by air mass transport computation with the NOAA (Na- Total Environ., 572, 1005–1019, 2016.
tional Oceanic and Atmospheric Administration) HYSPLIT (HY- Cachorro, V. E., Toledano, C., Antón, M., Berjón, A., de Frutos,
brid Single-Particle Lagrangian Integrated Trajectory) model using A. M., Vilaplana, J. M., Arola, A., and Krotkov, N. A.: Com-
GDAS meteorological data (Stein et al., 2015). AERONET sun pho- parison of UV irradiances from Aura/Ozone Monitoring Instru-
tometer data are downloaded from the AERONET web page (Hol- ment (OMI) with Brewer measurements at El Arenosillo (Spain)
ben et al., 1998). – Part 2: Analysis of site aerosol influence, Atmos. Chem.
Phys., 10, 11867–11880, https://doi.org/10.5194/acp-10-11867-
2010, 2010.
Competing interests. The authors declare that they have no conflict Carlson, T. N. and Prospero, J. M.: The Large-Scale Movement of
of interest. Saharan Air Outbreaks over the Northern Equatorial Atlantic, J.
Appl. Meteorol., 11, 283–297, 1972.
Choobari, O. A., Zawar-Reza, P., and Sturman, A.: The
global distribution of mineral dust and its impacts on the
www.atmos-chem-phys.net/18/9411/2018/ Atmos. Chem. Phys., 18, 9411–9424, 20189422 C. Velasco-Merino et al.: Impact of long-range transport over the Atlantic Ocean climate system: A review, Atmos. Res., 138, 152–165, burning aerosols and dust by means of multi-wavelength https://doi.org/10.1016/j.atmosres.2013.11.007, 2014. depolarization and Raman lidar measurements during SA- Chouza, F., Reitebuch, O., Benedetti, A., and Weinzierl, B.: Saharan MUM 2, Tellus B, 63, 706–724, https://doi.org/10.1111/j.1600- dust long-range transport across the Atlantic studied by an air- 0889.2011.00556.x, 2011. borne Doppler wind lidar and the MACC model, Atmos. Chem. Groß, S., Freudenthaler, V., Schepanski, K., Toledano, C., Phys., 16, 11581–11600, https://doi.org/10.5194/acp-16-11581- Schäfler, A., Ansmann, A., and Weinzierl, B.: Optical prop- 2016, 2016. erties of long-range transported Saharan dust over Barba- Colarco, P., Toon O., and Holben B.: Saharan dust transport to dos as measured by dual-wavelength depolarization Raman li- the Caribbean during PRIDE: 1. Influence of dust sources and dar measurements, Atmos. Chem. Phys., 15, 11067–11080, removal mechanisms on the timing and magnitude of down- https://doi.org/10.5194/acp-15-11067-2015, 2015. wind aerosol optical depth events from simulations of in situ Groß, S., Gasteiger, J., Freudenthaler, V., Müller, T., Sauer, D., and remote sensing observations, J. Geophys. Res., 108, 8589, Toledano, C., and Ansmann, A.: Saharan dust contribution https://doi.org/10.1029/2002JD002658, 2003. to the Caribbean summertime boundary layer – a lidar study DeMott, P. J., Prenni, A. J., Liu, X., Kreidenweis, S. M., Petters, M. during SALTRACE, Atmos. Chem. Phys., 16, 11535–11546, D., Twohy, C. H., Richardson, M. S., Eidhammer, T., and Rogers, https://doi.org/10.5194/acp-16-11535-2016, 2016. D. C.: Predicting global atmospheric ice nuclei distributions and Guirado, C., Cuevas, E., Cachorro, V. E., Toledano, C., Alonso- their impacts on climate, P. Natl. Acad. Sci. USA, 107, 11217– Pérez, S., Bustos, J. J., Basart, S., Romero, P. M., Camino, 11222, https://doi.org/10.1073/pnas.0910818107, 2010. C., Mimouni, M. Zeudmi, L. Goloub, P., Baldasano, J. M., Derimian, Y., Leon, J.-F., Dubovik, O., Chiapello, I., Tanré, and de Frutos, A. M.: Aerosol characterization at the Saharan D.,Sinyuk, A., Auriol, F., Podvin, T., Brogniez, G., and Hol- AERONET site Tamanrasset, Atmos. Chem. Phys., 14, 11753– ben, B.: Radiative properties of aerosol mixture observed dur- 11773, https://doi.org/10.5194/acp-14-11753-2014, 2014. ing the dry season 2006 over M’Bour, Senegal (African Mon- Haywood, J., Pelon, J., Formenti, P., Bharmal, N., Brooks, M., soon Miltidisciplinary Analysis campaign), J. Geophys. Res., Capes, G., Chazette, P., Chou, C., Christopher, S., Coe, H., 113, D00C09, https://doi.org/10.1029/2008JD009904, 2008. Cuesta, J., Derimian,Y., Desboeufs, K., Greed, G., Harrison, Dubovik, O., Smirnov, A., Holben, B., King, M. D., Eck, T. F., M., Heese, B., Highwood, E. J., Johnson, B., Mallet, M., Mar- Kaufman, Y. J., and Slutsker, I., and Eck, T. F.: Accuracy as- ticorena, B., Marsham, J., Milton, S., Myhre, G., Osborne, S. sessments of aerosol optical properties retrieved from Aerosol R., Parker, D. J., Rajot, J.-L., Schulz, M., Slingo, A., Tanré, Robotic Network (AERONET) Sun and sky radiance measure- D., and Tulet, P.: Overview of the dust and biomass burn- ments, J. Geophys. Res., 105, 9791–9806, 2000. ing experiment and African monsoon multidisciplinary analy- Dubovik, O., Holben, B., Eck, T. F., Smirnov, A., Kaufman, Y. J., sis special observing period-0, J. Geophys. Res., 113, D00C11, King, M. D., Tanre, D., and Slutsker, I.: Variability of absorption https://doi.org/10.1029/2008JD010077, 2008. and optical properties of key aerosol types observed in world- Holben, B. N., Eck„ Slutsker, I., Tanré, D., Buis, J. P., Setzer, A., wide locations, J. Atmos. Sci., 59, 590–608, 2002. Vermote, E., and Smirnov, A.: AERONET – A federated instru- Dubovik, O., Sinyuk, A., Lapyonok, T., Holben, B. N., Mishchenko, ment network and data archive for aerosol characterization, Re- M., Yang, P., Eck, T. F., Volten, H., Munoz, O., Veihel- mote. Sens. Environ., 66, 1–16, https://doi.org/10.1016/S0034- mann, B., van der Zande, W. J., Leon, J. F., Sorokin, 4257(98)00031-5, 1998. M., and Slutsker, I.: Application of spheroid models to ac- Horowitz, H. M., Garland, R. M., Thatcher, M., Landman, W. A., count for aerosol particle nonsphericity in remote sensing Dedekind, Z., van der Merwe, J., and Engelbrecht, F. A.: Eval- of desert dust, J. Geophys. Res.-Atmos., 111, 2156–2202, uation of climate model aerosol seasonal and spatial variability https://doi.org/10.1029/2005JD006619, 2006. over Africa using AERONET, Atmos. Chem. Phys., 17, 13999– Eck, T. F., Holben, B. N., Sinyuk, A., Pinker, R. T., Goloub, P., 14023, https://doi.org/10.5194/acp-17-13999-2017, 2017. Chen, H,. Chatenet, B., Li, Z., Singh, R. P., Tripathi, S. N., Reid, Huneeus, N., Schulz, M., Balkanski, Y., Griesfeller, J., Prospero, J. S., Giles, D. M., Dubovik, O., O’Neill, N. T., Smirnov, A., J., Kinne, S., Bauer, S., Boucher, O., Chin, M., Dentener, F., Wang, P., and Xia, X.: Climatological aspects of the optical prop- Diehl, T., Easter, R., Fillmore, D., Ghan, S., Ginoux, P., Grini, erties of fine/coarse mode aerosol mixtures, J. Geophys. Res., A., Horowitz, L., Koch, D., Krol, M. C., Landing, W., Liu, 115, D19205, https://doi.org/10.1029/2010JD014002, 2010. X., Mahowald, N., Miller, R., Morcrette, J.-J., Myhre, G., Pen- García, M. I., Rodríguez, S., and Alastuey, A.: Impact of North ner, J., Perlwitz, J., Stier, P., Takemura, T., and Zender, C. S.: America on the aerosol composition in the North Atlantic free Global dust model intercomparison in AeroCom phase I, At- troposphere, Atmos. Chem. Phys., 17, 7387–7404, 10.5194/ mos. Chem. Phys., 11, 7781–7816, https://doi.org/10.5194/acp- acp-17-7387-2017, 2017. 11-7781-2011, 2011. Giles, D. M., Holben, B. N., Eck, T. F., Sinyuk, A., Jickells, T.D., An, Z. S., Andersen, K. K., Baker, A. R., Berga- Smirnov, A., Slutsker, I., Dickerson, R. R., Thompson, metti, C., Brooks, N., and Cao, J. J., Boyd, P., W. Duce, R. A., A. M., and Schafer, J. S.: An analysis of AERONET Hunter, K. A., Kawahata, H., Kubilay, N., LaRoche, J., Liss, aerosol absorption properties and classifications representative P. S., Mahowald, N., Prospero, J. M., Ridgwell, A. J., Tegen, of aerosol source regions, J. Geophys. Res., 117, D17203, I., and Torres, R.: Global Iron Connections Between Desert https://doi.org/10.1029/2012JD018127, 2012. Dust, Ocean Biogeochemistry, and Climate, Science, 308, 67– Groß, S., Tesche, M., Freudenthaler, V., Toledano, C., Wiegner, M., 71, https://doi.org/10.1126/science.1105959, 2005. Ansmann, A., Althausen, D., and Seefeldner, M.: Characteriza- Kalnay, E., Kanamitsu, M., Kistler, R., Collins, W., Deaven, D., tion of Saharan dust, marine aerosols and mixtures of biomass- Gandin, L., Iredell, M., Saha, S., White, G., Woollen, J., Zhu, Y., Atmos. Chem. Phys., 18, 9411–9424, 2018 www.atmos-chem-phys.net/18/9411/2018/
C. Velasco-Merino et al.: Impact of long-range transport over the Atlantic Ocean                                                         9423

  Chelliah, M., Ebisuzaki, W., Higgins, W., Janowiak, J., Mo, K.C.,       cations for regional air quality, J. Geophys. Res.-Atmos., 104,
  Ropelewski, C,. Wang, J., Leetmaa, A., Reynolds, R., Jenne, R.,         15917–15927, 1999.
  and Joseph, D.: The NCEP/NCAR 40-year reanalysis project, B.         Prospero, J. M. and Mayol-Bracero O. L.: Understanding the trans-
  Am. Meteorol. Soc., 77, 437–470, 1996.                                  port and impact of African dust on the Caribbean Basin, B. Am.
Karydis, V. A., Tsimpidi, A. P., Bacer, S., Pozzer, A., Nenes, A.,        Meteorol. Soc., 94, 1329–1337, https://doi.org/10.1175/BAMS-
  Lelieveld, J.: Global impact of mineral dust on cloud droplet           D-12-00142.1, 2013.
  number concentration, Atmos. Chem. Phys., 17, 5601–5621,             Prospero, J. M. and Peter J. L.: African Droughts and Dust Trans-
  https://doi.org/10.5194/acp-17-5601-2017, 2017.                         port to the Caribbean: Climate Change Implications, Science,
Kaufman, Y. J., Koren, I., Remer, L. A., Tanré, D., Ginoux,               302, 1024–1027, https://doi.org/10.1126/science.1089915, 2003.
  P., and Fan, S.: Dust transport and deposition observed              Prospero, J. M., Collard, F. X., Molinié, J., and Jeannot, A.:
  from the Terra-Moderate Resolution Imaging Spectroradiometer            Characterizing the annual cycle of African dust transport to
  (MODIS) spacecraft over the Atlantic Ocean, J. Geophys. Res.,           the Caribbean Basin and South America and its impact on
  110, D10S12, https://doi.org/10.1029/2003JD004436, 2005.                the environment and air quality, Global Biogeochem. Cy., 28,
Kim, D., Chin, M., Yu, H., Eck, T. F., Sinyuk, A., Smirnov, A.,           GB004802, https://doi.org/10.1002/2013GB004802, 2014.
  and Holben, B. N.: Dust optical properties over North Africa and     Reid, J. S., Kinney, J. E., Westphal, D. L., Holben, B. N., Welton,
  Arabian Peninsula derived from the AERONET dataset, Atmos.              E. J., Tsay, S.-C., Eleuterio, D. P., Campbell, J. R., Christopher,
  Chem. Phys., 11, 10733–10741, https://doi.org/10.5194/acp-11-           S. A., Colarco, P. R., Jonsson, H. H., Livingston, J. M., Mar-
  10733-2011, 2011.                                                       ing, H. B., Meier, M. L., Pilewskie, P., Prospero, J. M., Reid,
Knippertz, P. and Stuut, J.-B. W.: Chapter 1 Introduction, in:            E. A., Remer, L. A., Russell, P. B., Savoie, D. L., Smirnov, A.,
  Mineral Dust: A Key Player in the Earth System, edited by:              and Tanré, D.: Analysis of measurements of Saharan dust by
  Knippertz, P. and Stuut, J.-B. W., Springer, New York, 1–14,            airborne and ground-based remote sensing methods during the
  https://doi.org/10.1007/978-94-017-8978-3, 2014.                        Puerto Rico Dust Experiment (PRIDE), J. Geophys. Res., 108,
Leon, J. F., Derimian, Y., Chiapello, I., Tanre, D., Podvin, T.,          8586, https://doi.org/10.1029/2002JD002493, 2003.
  Chatenet, B., Diallo, A., and Deroo, C.: Aerosol vertical distri-    Rodríguez, S., Cuevas, E., Prospero, J. M., Alastuey, A., Querol,
  bution and optical properties over M’Bour (16.96◦ W; 14.39◦ N),         X., López-Solano, J., García, M. I., and Alonso-Pérez, S.: Mod-
  Senegal from 2006 to 2008, Atmos. Chem. Phys., 9, 9249–9261,            ulation of Saharan dust export by the North African dipole, At-
  https://doi.org/10.5194/acp-9-9249-2009, 2009.                          mos. Chem. Phys., 15, 7471–7486, https://doi.org/10.5194/acp-
Mallet, M., Dubovik, O., Nabat, P., Dulac, F., Kahn, R., Sciare, J.,      15-7471-2015, 2015.
  Paronis, D., and Léon, J. F.: Absorption properties of Mediter-      Savoie, D. L., Arimoto, R., Keene, W. C., Prospera, J. M., Duce,
  ranean aerosols obtained from multi-year ground-based remote            R. A., and Galloway, J. N.: Marine biogenic and anthropogenic
  sensing observations, Atmos. Chem. Phys., 13, 9195–9210,                contributions to non-sea-salt sulfate in the marine boundary layer
  https://doi.org/10.5194/acp-13-9195-2013, 2013.                         over the North Atlantic Ocean, J. Geophys. Res.-Atmos., 107,
Maring, H., Savoie, D. L., Izaguirre, M. A., Custals, L., and             4356, https://doi.org/10.1029/2001JD000970, 2002.
  Reid, J. S.: Mineral dust aerosol size distribution change           Smirnov, A., Holben, B. N., Savoie, D., Prospero, J. M., Kaufman,
  during atmospheric transport, J. Geophys. Res., 108, 8592,              Y. J., Tanre, D., Eck, T. F., and Slutsker, I.: Relationship between
  https://doi.org/10.1029/2002JD002536, 2003.                             column aerosol optical thickness and in situ ground based dust
Martet, M., Peuch, V. H., Laurent, B., and Marticorena, B.:               concentrations over Barbados, Geophys. Res. Lett., 27, 1643–
  Evaluation of long-range transport and deposition of desert             1646, 2000.
  dust with the CTM MOCAGE, Tellus B, 61, 446–463,                     Stein, A. F., Draxler, R. R, Rolph, G. D., Stunder, B. J. B., Co-
  https://doi.org/10.1111/j.1600-0889.2008.00413.x, 2009.                 hen, M. D., and Ngan, F.: NOAA’s HYSPLIT atmospheric trans-
Mateos, D., Antón, M., Toledano, C., Cachorro, V. E., Alados-             port and dispersion modeling system, B. Am. Meteorol. Soc., 96,
  Arboledas, L., Sorribas, M., and Baldasano, J. M.: Aerosol              2059–2077, 2015.
  radiative effects in the ultraviolet, visible, and near-infrared     Tegen, I., Schepanski, K., and Heinold, B.: Comparing two years
  spectral ranges using long-term aerosol data series over the            of Saharan dust source activation obtained by regional modelling
  Iberian Peninsula, Atmos. Chem. Phys., 14, 13497–13514,                 and satellite observations, Atmos. Chem. Phys., 13, 2381–2390,
  https://doi.org/10.5194/acp-14-13497-2014, 2014.                        https://doi.org/10.5194/acp-13-2381-2013, 2013.
Meloni, D., di Sarra, A., Pace, G., and Monteleone, F.: Aerosol        Toledano, C., Wiegner, M., Groß, S., Freudenthaler, V., Gasteiger,
  optical properties at Lampedusa (Central Mediterranean). 2.             J., Müller, D., Müller, T., Schladitz, A., Weinzierl, B., Torres, B.,
  Determination of single scattering albedo at two wavelengths            and O’Neill, N. T.: Optical properties of aerosol mixtures derived
  for different aerosol types, Atmos. Chem. Phys., 6, 715–727,            from sun-sky radiometry during SAMUM-2, Tellus B, 63, 635–
  https://doi.org/10.5194/acp-6-715-2006, 2006.                           648, 2011.
Prats, N., Cachorro, V. E., Berjón, A., Toledano, C., and De Frutos,   Valenzuela, A., Olmo, F. J., Lyamani, H., Antón, M., Quirantes,
  A. M.: Column-integrated aerosol microphysical properties from          A., and Alados-Arboledas, L.: Aerosol radiative forcing dur-
  AERONET Sun photometer over southwestern Spain, Atmos.                  ing African desert dust events (2005–2010) over South-
  Chem. Phys., 11, 12535–12547, https://doi.org/10.5194/acp-11-           eastern Spain, Atmos. Chem. Phys., 12, 10331–10351,
  12535-2011, 2011.                                                       https://doi.org/10.5194/acp-12-10331-2012, 2012.
Prospero, J. M.: Long-term measurements of the transport of            Valle-Díaz, C. J., Torres-Delgado E., Colón-Santos S. M., Lee
  African mineral dust to the southeastern United States: Impli-          T., Collett Jr. J. L., McDowell W. H., and Mayol-Bracero O.
                                                                          L.: Impact of long-range transported African dust on cloud

www.atmos-chem-phys.net/18/9411/2018/                                                     Atmos. Chem. Phys., 18, 9411–9424, 2018
You can also read