Snow-darkening versus direct radiative effects of mineral dust aerosol on the Indian summer monsoon onset: role of temperature change over dust ...
←
→
Page content transcription
If your browser does not render page correctly, please read the page content below
Atmos. Chem. Phys., 19, 1605–1622, 2019
https://doi.org/10.5194/acp-19-1605-2019
© Author(s) 2019. This work is distributed under
the Creative Commons Attribution 4.0 License.

Snow-darkening versus direct radiative effects of mineral dust
aerosol on the Indian summer monsoon onset: role of
temperature change over dust sources
Zhengguo Shi1,2,3 , Xiaoning Xie1 , Xinzhou Li1 , Liu Yang1 , Xiaoxun Xie1 , Jing Lei1 , Yingying Sha1 , and Xiaodong Liu1
1 StateKey Laboratory of Loess and Quaternary Geology, Institute of Earth Environment, Chinese Academy of Sciences,
Xi’an 710061, China
2 Center for Excellence in Quaternary Science and Global Change, Chinese Academy of Sciences, Xi’an 710061, China
3 Open Studio for Oceanic-Continental Climate and Environment Changes, Qingdao National Laboratory for

Marine Science and Technology, Qingdao, China

Correspondence: Zhengguo Shi (shizg@ieecas.cn)

Received: 11 May 2018 – Discussion started: 7 June 2018
Revised: 17 January 2019 – Accepted: 26 January 2019 – Published: 7 February 2019

Abstract. Atmospheric absorptive aerosols exert compli-             sults further highlight an important role of surface/low tro-
cated effects on the climate system, two of which are through       pospheric temperature changes over dust source areas, which
their direct radiative forcing and snow-darkening forcing.          can also significantly modify the response of summer mon-
Compared to black carbon, the snow-darkening effect of dust         soon. Thus, links between the climatic impact of dust and
on climate has been scarcely explored till now. When de-            complicated thermal conditions over Asia are of importance
positing in snow, dust can reduce the albedo of snow by dark-       and need to be clarified accurately.
ening it and increasing the snowmelt. In this study, the snow-
darkening effect of dust, as well as the direct radiative effect,
on the Indian summer monsoon are evaluated by atmospheric
general circulation model experiments. The results show that        1   Introduction
the snow-darkening and direct radiative forcing of dust both
have significant impacts on the onset of the Indian monsoon,        Mineral dust, a kind of natural aerosol in the atmosphere,
but they are distinctly opposite. The snow-darkening effect         mainly originates from the global deserts, including the Sa-
of dust weakens the Indian monsoon precipitation during             hara, the Arabian Peninsula, central Asia and East Asia. Dust
May and June, opposite to black carbon. The surface tem-            emitting into the atmosphere is carried by atmospheric circu-
perature over central Asia and the western Tibetan Plateau          lation and can be transported downwind for a long distance
becomes warmer due to the dust-induced decrease in snow             (Zhang et al., 1997; Zhao et al., 2006; Kallos et al., 2006;
cover, which leads to a local low-level cyclonic anomaly as         Schepanski et al., 2009; Shi and Liu, 2011). Mineral dust
well as an anticyclonic anomaly over the Indian subcontinent        aerosol affects global and regional energy budgets, forma-
and Arabian Sea. This circulation pattern allows air currents       tion of clouds and precipitation as well as various climate
penetrating into the Indian subcontinent more from central          systems through their direct, semi-direct and indirect effects
Asia but less from the Indian Ocean. In contrast, the direct        (e.g., Tegen and Lacis, 1996; Ramanathan et al., 2001; Miller
radiative forcing of dust warms the low troposphere over the        et al., 2004; Shao et al., 2011; Huang et al., 2014; Mahowald
Arabian Peninsula, which intensifies moisture convergence           et al., 2014). Among the climatic effects of dust, the direct
and precipitation over the Indian monsoon region. The upper         radiative effect (DRE) and snow-darkening effect (SDE) are
tropospheric atmospheric circulation over Asia is also sen-         two important components, which exert great impacts on the
sitive to both effects. Compared to previous studies which          radiative balance (Haywood et al., 2001; Flanner et al., 2009;
emphasized the temperature over the Tibetan Plateau, our re-        Huang et al., 2014; Qian et al., 2015).

Published by Copernicus Publications on behalf of the European Geosciences Union.
1606                                                                         Z. Shi et al.: Dust effect on the Indian monsoon

   The DRE of dust is that the particles can directly scatter      (+0.02 to +0.09) W m−2 for SDE (Bond et al., 2013). Over
and absorb the solar shortwave and black-body longwave ra-         the Tibetan Plateau (TP) where most areas are covered by
diation. In the fifth Assessment Report (IPCC, 2013), the an-      snow, the absorbing aerosols in snow in particular remark-
nual mean DRE of dust is approximately −0.10 W m−2 on              ably influence the snow albedo and promote the snowmelt
the global scale, which varies from −0.30 to +0.10 W m−2           (Lau et al., 2010; Yasunari et al., 2011; He et al., 2014; Zhao
among different global climate models. However, it is still        et al., 2014; Lee et al., 2017; Niu et al., 2017). The SDE of
unclear whether dust aerosol has a net warming or cooling          black carbon generates positive changes in the surface radia-
effect on global climate (e.g., Tegen and Lacis, 1996; Miller      tive flux of about 5–25 W m−2 over the TP during spring-
and Tegen, 1998; Mahowald et al., 2014; Kok et al., 2017;          time, warms the surface TP obviously and intensifies both
Xie et al., 2018a). Due to the underestimation of coarser          the Indian and East Asian summer monsoon by enhancing
dust in climate models than in the atmosphere, the consid-         the elevated heat source (Qian et al., 2011, 2015).
ered DRE may be more cooling in the current model ensem-              Compared to that of black carbon, the SDE of mineral dust
ble, and the possibility that dust may cause a net warming is      over the TP and Asia, especially its influence on the Asian
highlighted (Kok et al., 2017).                                    monsoon, is still not clear. Theoretically, the SDE of dust is
   Following the changes in radiative balance, specific cli-       considered to be larger than that of black carbon over the TP
mate systems or atmospheric circulations also respond sig-         (Flanner et al., 2009; Ming et al., 2013), primarily because
nificantly to the DRE of aerosols. During the emission sea-        the concentration of dust is much higher. The spatial distribu-
sons, dust from inland Asian and Arabian deserts is deliv-         tion and deposition of dust is also different from black carbon
ered downwind by the westerlies and Asian monsoon (Uno             in that the dust can be deposited over both central Asia and
et al., 2009; Shi and Liu, 2011; Vinoj et al., 2014) to east-      the TP where a fraction of snow cover exists, while black car-
ern China and India, and is even deposited on the Tibetan          bon is primarily restricted to South and East Asia and down-
Plateau (Huang et al., 2007; Xu et al., 2009; Zhang et al.,        wind areas. In actuality, the dust is a kind of natural aerosol,
2018). Such distributions of atmospheric dust largely affect       differing from black carbon, which is mainly anthropogeni-
the Asian climate, including both the Indian and East Asian        cally produced. Besides the modern period, the climatic ef-
monsoon (Lau et al., 2006, 2017; Zhang et al., 2009; Sun           fects of Asian dust are also of great importance in the geolog-
et al., 2012; Vinoj et al., 2014; Jin et al., 2014; Gu et al.,     ical stages, such as the Last Glacial Maximum (Harrison et
2016; Lou et al., 2017). Via a strong effect of the elevated       al., 2001; Claquin et al., 2003; Takemura et al., 2009). During
heat pump, the DRE of absorbing aerosols including dust en-        the late Cenozoic, the dust effect ought to become gradually
hances the heat source over the TP and results in a northward      larger as deserts expand and atmospheric dust increases with
shift of the Indian summer monsoon during the late spring          plateau uplift and climatic cooling (Shi et al., 2011). Thus, it
and early summer (Lau et al., 2006, 2017). The aerosol-            is necessary to explore in detail the effect of dust during the
induced upper tropospheric warming intensifies the updraft         present-day and geological periods.
air motion, which pumps more moist air from the southern              In this paper, as a first step, we employed a set of numer-
oceans to northern India. However, this hypothesis is still        ical experiments by a general circulation model to evaluate
being debated and lacks observational support (Nigam and           the SDE and DRE of dust on Indian summer monsoon during
Bollasina, 2010). Beside the TP warming, the tropospheric          the onset under present-day conditions. In Sect. 2, the model
warming over the Arabian Sea and surrounding regions due           and experiments are described. The model performance, re-
to mineral dust from the Middle East can intensify the Indian      sponse of Indian monsoon and role of temperature changes
summer monsoon and precipitation (Vinoj et al., 2014; Jin et       over dust sources are presented in Sect. 3. The discussion and
al., 2014). In addition, the East Asian monsoon and the east-      conclusions are summarized in Sects. 4 and 5, respectively.
ern precipitation are also significantly affected by dust and
a northeasterly wind anomaly over eastern China seems to
weaken the monsoon circulation (Sun et al., 2012; Tang et          2   Model and experiments
al., 2018).
   The SDE is another important effect of dust on climate,         An atmospheric general circulation model, namely Com-
which is not mentioned as intensively as the DRE. Light-           munity Atmosphere Model 4 (CAM4), which is improved
absorbing aerosols can darken the snow and reduce the sur-         with a new bulk aerosol model (BAM) parameterization,
face albedo when deposited in snow, and it can also absorb         is employed to evaluate the response of the Indian sum-
the radiation and warm the snow surface, which both accel-         mer monsoon to the forcing of mineral dust. CAM4 is
erate the melt process of snowpack (Hansen and Nazarenko,          the atmospheric component of Community Climate Sys-
2004; Xu et al., 2009; Lee et al., 2013; Qian et al., 2015). Due   tem Model 4 (CCSM4), which is coupled with Community
to the reduction of snow, the SDE of absorbing aerosols gen-       Land Model 4 (CLM4) for land surface processes. The ver-
erally induces a net regional warming over the snow cover          tically Lagrangian and horizontally Eulerian coordinates are
areas. Black carbon, as the most important anthropogenic ab-       used in the finite-volume discretization of this model. The
sorbing aerosol, has a global-mean radiative forcing of +0.04      dust cycle, including the emission, transport and deposition,

Atmos. Chem. Phys., 19, 1605–1622, 2019                                             www.atmos-chem-phys.net/19/1605/2019/
Z. Shi et al.: Dust effect on the Indian monsoon                                                                                   1607

Figure 1. Averaged dust aerosol optical depth over Asia for May and June in CAM4 (a) and in Cloud-Aerosol Lidar and Infrared Pathfinder
Satellite Observation (CALIPSO)-retrieved data for 2007–2011 (b); and mean dust deposition flux including both dry and wet deposition for
April (c) (kg m−2 yr−1 ) and for May and June (d). Yellow line shows the profile of the Tibetan Plateau above 2500 m.

is parameterized in CAM4 and its radiative feedbacks are               melt water when dust deposits on the surface. Dust optical
also calculated online. The dust sizes in CAM4 contain four            properties in snow ranged from 0.88 to 0.99 with decreas-
bins of 0.1–1.0, 1.0–2.5, 2.5–5.0 and 5.0–10.0 µm in diame-            ing particle size (Flanner et al., 2009). Of note is that SCI-
ter, respectively (Mahowald et al., 2006). The CAM4-BAM                NAR assumes external mixing between aerosols and spheri-
has been improved by an optimized soil erodibility map and             cal snow grains; however, aerosol–snow internal mixing and
a new size distribution for dust emission (the percentages             nonspherical snow shape could significantly affect aerosol-
for the four bins are 0.02, 0.09, 0.27, 0.62, respectively), as        induced snow albedo effects, based on recent studies (Flan-
well as updated optical properties for the radiation budget,           ner et al., 2012; Liou et al., 2014; Räisänen et al., 2017; He
to present a better performance in simulating the global dust          et al., 2018).
cycle (Albani et al., 2014). In CAM4-BAM, the SDEs of all                 Three sensitivity experiments are conducted in this study
aerosols are enabled, but the indirect effect is not considered,       to evaluate the SDE and DRE of mineral dust. Both the snow-
which means that the aerosol changes in cloud process as               darkening and direct radiative effects of dust are turned on
condensation nuclei are prescribed. Wet removal through in-            in the experiment, namely EXP1d, while only the direct ra-
cloud process is not considered, which may induce bias of              diative effect is enabled in the experiment of EXP2d. Nei-
dust deposition on snow over Asia. The snow-darkening pro-             ther effect is taken into consideration in the third experiment
cesses are considered based on the Snow, Ice and Aerosol               (EXP3d). Thus, the differences in climate responses between
Radiative (SNICAR) module (Flanner et al., 2007, 2009)                 EXP1d and EXP2d, and between EXP2d and EXP3d, are de-
in which the dust and black carbon aerosols are included.              noted as the SDE and DRE of dust, respectively. Of note is
The SNICAR applies Mie scattering to the particle mixture              that the dust column loading over Asia is slightly larger by
and a multi-layer radiative transfer approximation (Toon et            the online feedbacks when both effects are enabled, com-
al., 1989) to represent vertical inhomogeneity in the snow.            pared to when the DRE only is enabled. However, the bias
The radiative transfer in the snow is affected by the vertical         does not affect our discussion, which will be mentioned later
particle profile controlling by fresh snow and flushing with           in this work. The reason for the intensified dust cycle over

www.atmos-chem-phys.net/19/1605/2019/                                                    Atmos. Chem. Phys., 19, 1605–1622, 2019
1608 Z. Shi et al.: Dust effect on the Indian monsoon
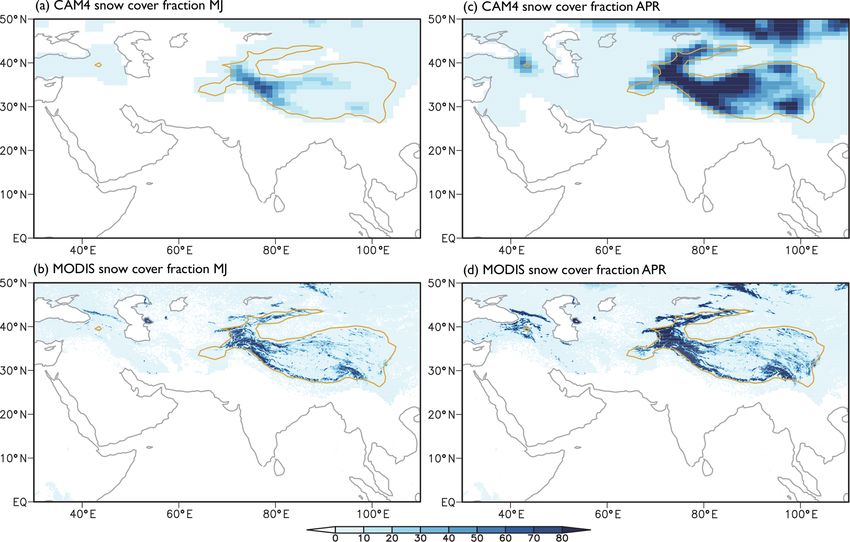
Figure 2. Snow cover fraction (%) over Asia in CAM4 (a, c) and in Moderate Resolution Imaging Spectroradiometer (MODIS)-retrieved
observation (b, d) for May to June and for April, respectively. Yellow line shows the profile of the Tibetan Plateau above 2500 m.
Asia by the SDE is analyzed in detail in a parallel study ducted atmospheric model experiments in this study and cou-
(Xie et al., 2018b). Other species of aerosols except min- pled ocean–atmosphere model experiments are not included.
eral dust are neglected in these experiments to avoid the bi- Actually, slow ocean response can play a dominant role in
ases induced by their different spatial distributions in dif- the response of Indian summer monsoon to aerosol forcing
ferent experiments. In order to compare with previous stud- (Ganguly et al., 2012).
ies with a main focus on black carbon, three experiments
on the SDE and DRE of black carbon are also conducted
(EXP1bc, EXP2bc and EXP3bc, respectively) and the design 3 Results
is similar. For these six experiments, the boundary condi-
tions, including the sea surface temperature and greenhouse 3.1 Model validation
gas concentrations, are kept as their modern values (the year
Before the examination of monsoon response, the model’s
AD 2000). The sea surface temperature and sea ice are given
ability to simulate the climatology of dust aerosol optical
from HadOIBI data and the atmospheric CO2 concentration
depth (AOD), snow cover and the Indian monsoon during
is set to 367 ppmv.
May and June in experiment EXP1d is first evaluated using
In these experiments, the horizontal resolution of CAM4-
modern observation and reanalysis data. The distributions of
BAM is set to approximately 0.9◦ ×1.25◦ in latitude and lon-
the AOD and deposition flux of mineral dust in the model
gitude. All the experiments are integrated for a total period
over Asia are shown (Fig. 1). The maximal values of May–
of 21 years and the results of the last 15 years are analyzed.
June mean dust AOD are found over the arid and semi-arid
Both monthly and daily mean values of variables are out-
regions, including the Sahara, the Arabian Peninsula, and
putted to examine the sensitivity of the monsoon. The re-
central Asian and East Asian deserts (Fig. 1a). The AOD
sponse of Indian monsoon circulation and precipitation dur-
reaches above 0.2 over major source areas. This simulated
ing May and June (i.e., the onset) is focused in this study
pattern is similar to the Cloud-Aerosol Lidar and Infrared
since the monsoon onset is sensitive to external thermal forc-
Pathfinder Satellite Observation (CALIPSO)-retrieved AOD
ing. Due to the limit of calculation resources, we only con-
over the deserts (Fig. 1b), which indicates that CAM4-BAM
Atmos. Chem. Phys., 19, 1605–1622, 2019 www.atmos-chem-phys.net/19/1605/2019/
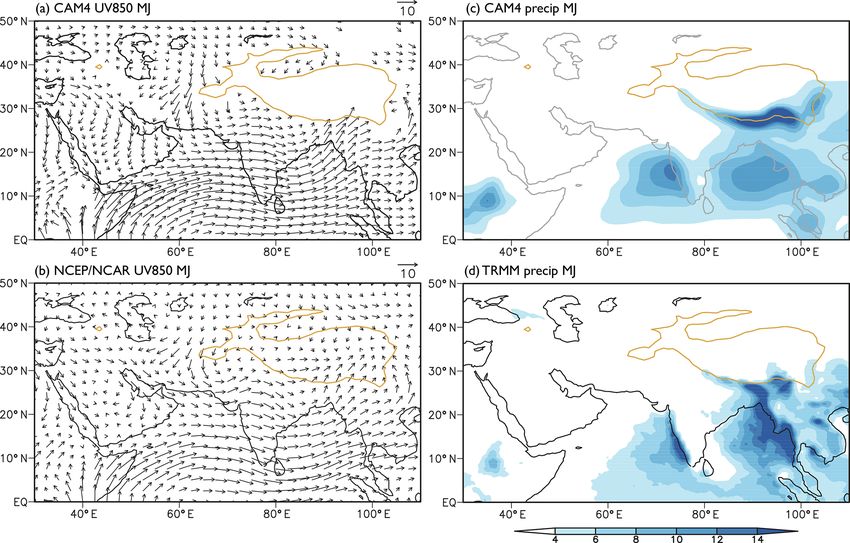
Z. Shi et al.: Dust effect on the Indian monsoon                                                                                  1609

Figure 3. Averaged 850 hPa wind vectors (m s−1 ) over the Indian monsoon region for May and June in CAM4 (a) and in National Centers for
Environmental Prediction/National Center for Atmospheric Research (NCEP/NCAR) reanalysis data (b); and precipitation rates (mm day−1 )
for May and June in CAM4 (c) and in Tropical Rainfall Measuring Mission (TRMM)-retrieved data (d). Yellow line shows the profile of the
Tibetan Plateau above 2500 m.

has a good performance in the dust cycle. The simulated ab-           cated over Mongolia and the western and southeastern TP
solute values of dust AOD over the Arabian Peninsula and              (Fig. 2b), which is qualitatively consistent with that in the
southwestern slope of the TP and Taklimakan desert are bi-            EXP2d simulation. Over the western TP, the MODIS obser-
ased low because the considered dust particles are restricted         vation presents a fraction larger than 80 %, but the simulated
to less than 10.0 µm and the dust forcing is underestimated           fraction is smaller. In particular, the model underestimates
due to less coarse dusts in the current global climate models         the elevations of finer-scale mountains and corresponding
(Kok et al., 2017). The total deposition fluxes during April          snow cover fractions due to the coarser resolution, e.g., over
and May–June (Fig. 1c, d) show that there are remarkable              the Tianshan mountains. In April, the snow cover fractions
dust depositions over Asia and the adjacent oceans in both            over central Asia and the TP are larger than those in May
periods. In April, the dust deposition over East and central          to June (Fig. 2c, d). Over the TP, the amplitudes are similar
Asian deserts and downwind regions is larger than that in             for both simulation and observation, but around the Caspian
May and June. In contrast, the deposition over the Arabian            Sea the simulated values are smaller. The dust deposition in
Peninsula is more obvious in May and June, which is also              the surface snow over Asia implies a potential influence on
detected over the Arabian Sea and western Indian continent.           surface snow.
Over the western and northeastern TP, the deposition flux is             For the Indian monsoon climatology, a feature where the
simulated with a range of about 0.02–0.16 kg m−2 yr−1 .               monsoon westerly winds are divided into two branches (e.g.,
   The simulated snow cover fractions over Asia during May            Wu et al., 2012), with the northern one from central Asian dry
to June show that surface snow exists over central Asia, East         regions and the southern one from the moist Indian Ocean,
Asia and the whole TP, with the largest fractions over the            is simulated in the 850 hPa winds during May and June
western TP (Fig. 2a). In Moderate Resolution Imaging Spec-            (Fig. 3a). During the monsoon onset, the southerly winds
troradiometer (MODIS) data, the observed snow cover is                over this region gradually develop from the south to the
found over the same regions where maximal values are lo-              north. During the same period, the Indian monsoon precip-

www.atmos-chem-phys.net/19/1605/2019/                                                   Atmos. Chem. Phys., 19, 1605–1622, 2019
1610 Z. Shi et al.: Dust effect on the Indian monsoon
3.2 Response of the Indian monsoon
The daily precipitation differences during May and June be-
tween EXP1d and EXP2d, as well as between EXP2d and
EXP3d, are calculated to examine the responses of monsoon
onset to the SDE and DRE of dust (Fig. 4). It is clearly
seen that in all three experiments the precipitation rates over
the Indian monsoon area (10–25◦ N, 65–100◦ E) increase
abruptly by an amount of approximately 10 mm day−1 during
several weeks in the onset (Fig. 4a). In this 2-month period,
the dust SDE-induced difference is mostly negative, while
the dust DRE-induced difference is positive (Fig. 4b), which
means that the SDE tends to weaken the Indian summer mon-
soon, but the DRE tends to intensify it. This is also the reason
why we choose May and June as the monsoon onset in the
following analysis. The SDE-induced precipitation decrease
exceeds the DRE-induced increase in June, which results in a
net reduction in precipitation; however, these two effects al-
most counteract each other, and the total precipitation change
in May is not significant.
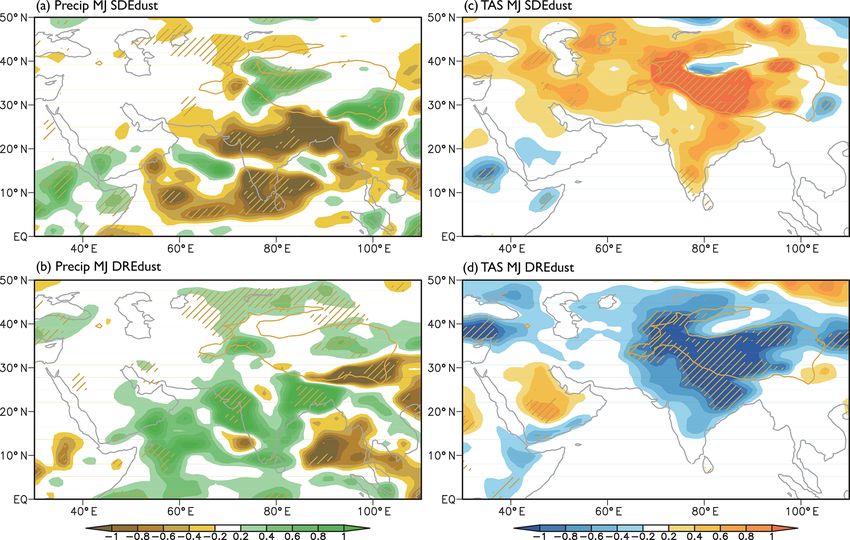
The spatial distributions of May–June mean precipitation
show that the precipitation rate is decreased by the SDE over
most Indian monsoon regions, and a remarkable difference
of 1 mm day−1 is detected over India (Fig. 5a). Other regions
with statistically significant precipitation changes are found
over the western and southeastern TP, parts of central Asia
and northeastern Africa. For DRE-induced responses, the
precipitation is promoted over the Indian Peninsula, Arabian
Sea and central Asia but suppressed over the Bay of Ben-
gal and the southeastern TP (Fig. 5b). Thus, the responses of
Figure 4. Daily precipitation rates (mm day−1 ), averaged for mon- Indian monsoon precipitation to the SDE and DRE are dis-
soon area (10–25◦ N, 65–100◦ E), during May and June in three
tinctly different during the onset, which highlights the com-
experiments (a), and the differences (mm day−1 ) induced by the
snow-darkening effect and direct radiative effect of dust (b). Thin
plicated influence of mineral dust. The surface temperature
lines show the daily values and thick ones are 5-day smoothed. In becomes warmer over most of Asia, which responds to the
(b), red lines donate the snow-darkening effect and blue lines donate SDE (Fig. 5c). The most obvious warming, with an ampli-
the direct radiative effect. tude of larger than 1 ◦ C, is found over the whole western TP
where the surface snow cover is larger, which indicates that
the SDE is significant in these regions. Another significant
warming center is around the Caspian Sea in central Asia,
also with certain snow covers at this time. In contrast, the
surface temperature difference induced by the DRE is sig-
nificantly negative over the whole TP and northeastern India
itation is mainly produced over the western sides of the In- (Fig. 5d). However, it is simulated to be warming over the
dian and Indo-China peninsulas as well as the southern slope surface and low-level troposphere over the Arabian Penin-
of the TP (Fig. 3c). These features of Indian monsoon cir- sula/Middle East (Figs. 5d, S1a in the Supplement), which
culation and precipitation are generally in agreement with amplifies the zonal thermal gradient over the Indian monsoon
the National Centers for Environmental Prediction/National region.
Center for Atmospheric Research (NCEP/NCAR) reanalysis The responses of Indian monsoon circulation to the SDE
and Tropical Rainfall Measuring Mission (TRMM) satellite- and DRE of dust are examined by the differences in 850 hPa
retrieved data (Fig. 3b, d). Compared to the observations, the wind vectors between experiments (Fig. 6a, b). In the SDE-
simulated precipitation is lighter over the western sides of the induced difference, a significant cyclonic anomaly is sim-
two peninsulas but heavier over the southern slope of the TP. ulated over the western TP and to its west there is also a
In brief, CAM4-BAM performs well in both the monsoon cli- cyclonic anomaly around the Caspian Sea (Fig. 6a), follow-
matology and dust cycle over Asia, which builds confidence ing the surface temperature changes (Fig. 5c). These two cy-
for assessing the climate sensitivity to dust forcing. clonic anomalies tend to intensify the northern branch of the
Atmos. Chem. Phys., 19, 1605–1622, 2019 www.atmos-chem-phys.net/19/1605/2019/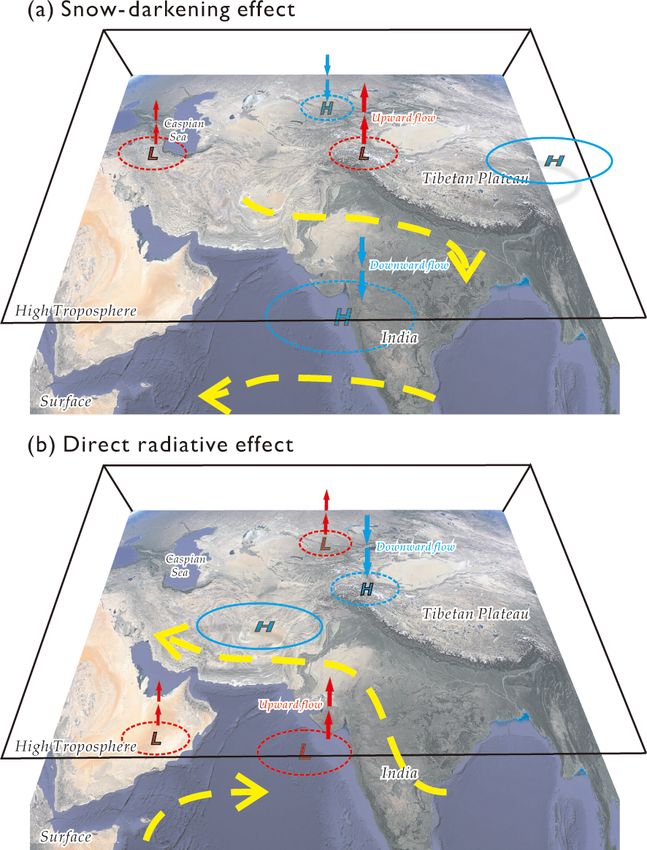
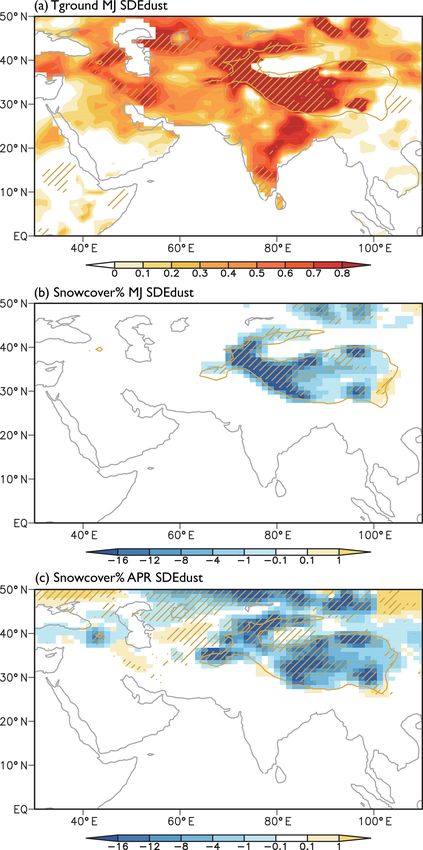
Z. Shi et al.: Dust effect on the Indian monsoon                                                                                      1611

Figure 5. Spatial distribution of changes in precipitation rates (a, b, mm day−1 ) and surface air temperature (c, d, ◦ C) in May and June
induced by the snow-darkening effect (a, c) and the direct radiative effect of dust (b, d), respectively. Oblique lines indicate differences
significant at the 95 % confidence level. Yellow line shows the profile of the Tibetan Plateau above 2500 m.

Indian monsoon westerly, allowing more dry air from cen-                the Indo-China Peninsula; however, they bring water vapor
tral Asia to penetrate into the monsoon region. However, the            to the Indian Peninsula. The differences in the moisture con-
southern branch of the monsoon westerly is significantly de-            vergence induced by the SDE and DRE show that the water
creased with the associated anticyclonic anomaly over the               vapors diverge and converge over most Indian monsoon re-
Arabian Sea and India, which weakens the moisture transport             gions, respectively (Fig. 6c, d), consistent with the responses
from oceans in the south. This circulation anomaly over the             of precipitation (Fig. 5a, b).
monsoon area agrees well with the simulated lighter precip-                Compared to the dust, the SDE and DRE of black car-
itation, which supports that the Indian summer monsoon is               bon on the Indian summer monsoon onset are also analyzed
weakened by the SDE during its onset. In addition, the west-            (Figs. S2, S3). The black carbon’s SDE-induced surface tem-
erly winds become stronger to the north of the TP, which                perature change is similar to dust but is restricted to the west-
might affect the dust emission further over that region. In             ern TP, with no warming over central Asia (Fig. S2a). The
the DRE-induced difference, the situation is quite different            TP warming intensifies the Indian monsoon and leads to a
in that a low-pressure anomaly (Fig. S1b) and correspond-               strong anomaly in southerly winds over India, which sub-
ing cyclonic anomaly (Fig. 6b) are simulated over the Ara-              sequently brings more rainfall over this region (Fig. S2b,
bian Peninsula in the low troposphere, in response to the               c). The SDE of black carbon is distinctly different to that
surface and low-level warming (Figs. 5d, S1a). The north-               of dust, which indicates the complicated SDE of absorbing
ern branch of the monsoon westerly is remarkably reduced                aerosols on Indian monsoon not mentioned before. For the
in its intensity across the southern slope of the TP, the Per-          DRE of black carbon, a surface warming over the western
sian Gulf and the northern Arabian Peninsula (Fig. 6b). The             TP is simulated (Fig. S3a). The warming is also over Pak-
southern branch of the Indian monsoon westerly over the                 istan and Afghanistan, although it is not significant. This ef-
Arabian Sea is simulated to be stronger, which intensifies              fect strengthens the southwesterly winds over the Arabian
the water vapor transport from oceans (Fig. S1c). The west-             Sea and moisture transport from the ocean (Fig. S3b), and the
erly winds are also decreased over the Bay of Bengal and                precipitation is intensified over the Arabian Sea and southern

www.atmos-chem-phys.net/19/1605/2019/                                                      Atmos. Chem. Phys., 19, 1605–1622, 2019
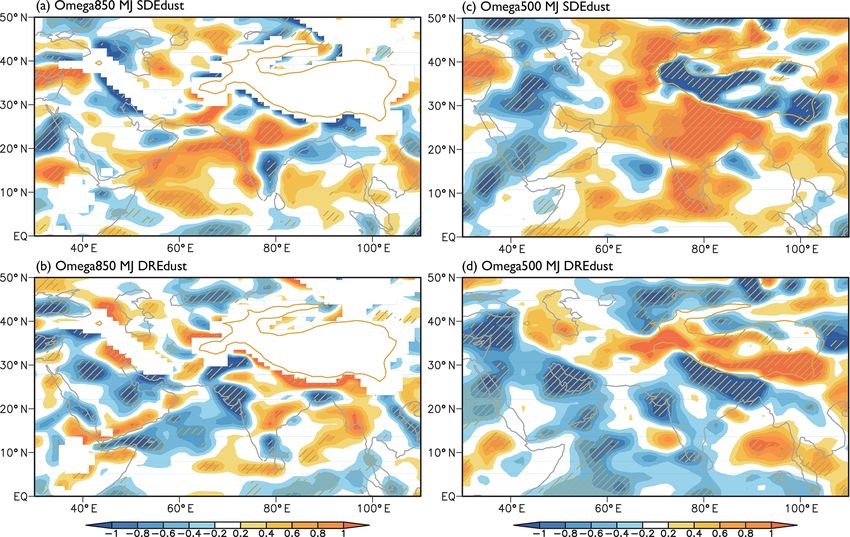
1612                                                                                Z. Shi et al.: Dust effect on the Indian monsoon

Figure 6. Spatial distribution of changes in 850 hPa wind vectors (a, b, m s−1 ) and moisture convergence (c, d, g s kg−1 m−1 ) in May
and June induced by the snow-darkening effect (a, c) and direct radiative effect of dust (b, d), respectively. Positive values in (c) and (d)
mean divergence anomaly and a negative value means convergence. Black arrows and green dots indicate differences significant at the 90 %
confidence level. Yellow line shows the profile of the Tibetan Plateau above 2500 m.

India (Fig. S3c). Thus, the SDE and DRE of black carbon                  which might help the long-distance transport of mineral dust
consistently intensify the Indian monsoon during the onset.              over East Asia.
   The responses of Indian monsoon in the high troposphere                  Changes in vertical motion show that low and middle tro-
are examined (Fig. 7) because the anomalous heating center               pospheric subsidence occurs over most of the monsoon areas
over the TP as well as the high-pressure cell are both impor-            with the SDE, but the DRE leads to ascending motion over
tant for the monsoon development. As seen in the 200 hPa                 the Arabian Sea and western India (Fig. 8). Strong ascend-
climatology, a SDE-induced dipole pattern of meridional                  ing motion due to the SDE is found over the TP and Caspian
temperature changes over central Asia and the TP (Fig. 7a)               Sea (Fig. 8a, c), which is closely linked with local surface
results in a western weakening and an eastern strengthen-                warming (Fig. 5c). In contrast, the subsidence dominates the
ing of the South Asian high-pressure cell, i.e., an eastward             adjacent areas outside the TP, including the Indian and Indo-
shift of a high-pressure cell (Fig. 7c). In contrast, the oppo-          China peninsulas, as well as regions to the west and north
site dipole temperature changes caused by the DRE make the               of the TP (Fig. 8a, c), which is in good agreement with low-
high-pressure cell move westward (Fig. 7b, d). The strong                level circulation changes (Fig. 6a). For the DRE, the ascend-
Arabian Peninsular warming over the high troposphere is in               ing motion is presented over northern India, although surface
agreement with the surface (Fig. 5d), which indicates that               cooling produces local subsidence over the TP (Fig. 8d). The
this warming is significant throughout the column atmo-                  spatial distributions of anomalous vertical motion over the
sphere. Differences in 200 hPa wind vectors also show a cou-             Indian monsoon region are in qualitative agreement with the
ple of reversed circulation changes in cyclonic/anticyclonic             simulated precipitation changes by the SDE and DRE, re-
cells in the west and anticyclonic/cyclonic cells in the east            spectively. Such circulation changes are also clearly seen in
responding to the SDE and DRE, respectively (Fig. 7e, f),                the cross sections for vertical versus meridional winds (not
consistent with the temperature and pressure changes. To the             shown).
north of the TP, the westerly winds are weakened by the SDE,

Atmos. Chem. Phys., 19, 1605–1622, 2019                                                    www.atmos-chem-phys.net/19/1605/2019/
Z. Shi et al.: Dust effect on the Indian monsoon                                                                                          1613

Figure 7. Spatial distribution of changes in 200 hPa temperature (a, b, ◦ C), geopotential height (c, d, gpm) and wind vectors (e, f, m s−1 ) in
May and June induced by the snow-darkening effect (a, c, e) and direct radiative effect of dust (b, d, f), respectively. Oblique lines and black
arrows indicate differences significant at the 90 % confidence level. Yellow line shows the profile of the Tibetan Plateau above 2500 m.

   From the analysis above, in brief, the suppressed and in-              Although the DRE of dust is similar to that of black car-
creased monsoon precipitation during May and June funda-                  bon, the simulated surface temperature changes over the TP
mentally resulted from the SDE- and DRE-induced changes                   are distinctly different. In our sensitivity runs, the intensified
in atmospheric temperature structure, respectively, especially            monsoon by the dust DRE is more likely ascribed to the low
over the low-level atmosphere where most mineral dust ex-                 tropospheric atmospheric warming over the Arabian Penin-
ists. Compared to black carbon, the SDE effect of dust is                 sula. Thus, the potential importance of temperature changes
opposite because the range for dust-induced temperature in-               over dust sources (i.e., central Asia and Arabian Peninsula,
crease does not occupy the western TP only, but also expands              respectively) is highlighted in the SDE and DRE of dust.
to central Asia, which indicates the role of central Asian tem-              The possible reasons for the SDE- and DRE-induced low
perature changes in modulation of the SDE on the monsoon.                 tropospheric temperature changes over dust source areas are

www.atmos-chem-phys.net/19/1605/2019/                                                        Atmos. Chem. Phys., 19, 1605–1622, 2019
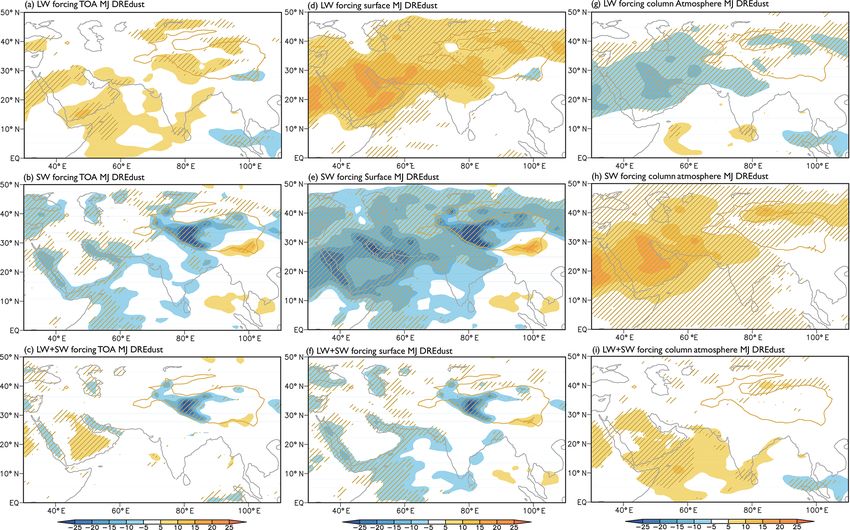
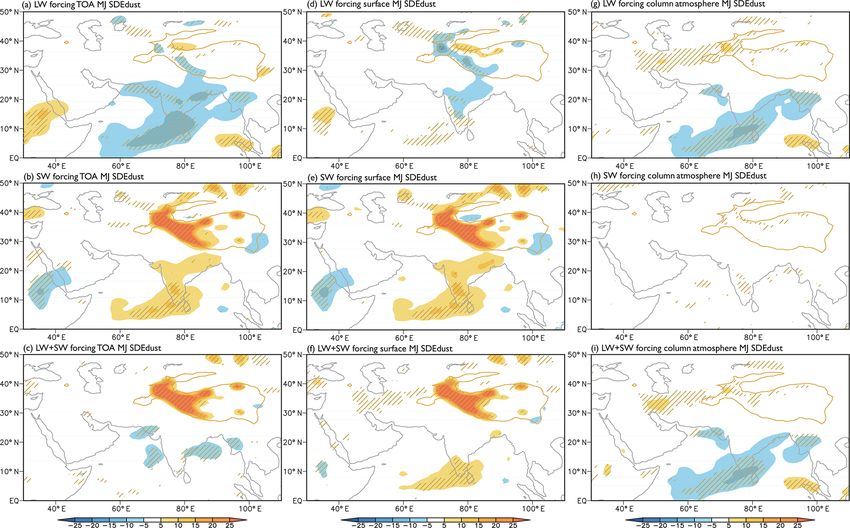
1614                                                                                Z. Shi et al.: Dust effect on the Indian monsoon

Figure 8. Spatial distribution of changes in 850 (a, b) and 500 hPa (c, d) vertical wind speed (×100, Pa s−1 ) in May and June induced by
the snow-darkening effect (a, c) and direct radiative effect of dust (b, d), respectively. Negative values indicate upward flow and positive
values indicate downward flow. Oblique lines indicate differences significant at the 95 % confidence level. Yellow line shows the profile of
the Tibetan Plateau above 2500 m.

analyzed from the perspective of the energy budget. The                 ever, the change in surface shortwave radiative forcing is not
SDE-induced differences in longwave and shortwave radia-                visible over central Asia (Fig. 9e), indicating that the SDE
tion fluxes for all-sky conditions during May and June at the           over this region is not significant during May and June. For
top of atmosphere (TOA), at the surface and in the column               the column atmosphere, the shortwave radiation flux does not
atmosphere are shown in Fig. 9. For both the TOA and the                vary, supporting the view that the slight dust loading differ-
surface, the primary forcing of the SDE is via shortwave ra-            ence between EXP1d and EXP2d merely presents negligible
diation change since it is albedo-induced. Due to large snow            radiation changes. The negative longwave radiation differ-
cover, the strongest shortwave radiation change is found to             ence is merely found near the Indian Peninsula (Fig. 9g, h,
be positive over the western TP and Mongolia (Fig. 9b, e),              i), indicating that the atmosphere loses energy over this re-
which indicates that both the TOA and the surface receive               gion.
more shortwave radiation, while the scattering becomes less.               For the DRE, the radiative forcing is characterized by posi-
The positive shortwave forcing near the Indian Peninsula, not           tive longwave and negative shortwave radiation differences at
as strong as that over the TP, is offset by the negative long-          both the TOA and the surface (Fig. 10a, b, d, e) owing to the
wave one (Fig. 9a, d), in which these changes should be as-             absorbing and scattering of radiation by dust. However, the
sociated with internal adjustment of climate, e.g., the water           TOA changes are less evident than the surface changes be-
vapor change. As a result, the SDE in total means a posi-               cause the dust aerosol is primarily distributed in the low level.
tive net radiative forcing over the western TP at the TOA and           Notably, a significant difference of larger than 20 W m−2 in
the surface (Fig. 9c, f), which is the reason for local surface         shortwave radiation is seen over the western TP (Fig. 10b,
warming (Fig. 5c). Additionally, the net surface and column             e), highlighting the potential feedback of snow albedo. The
radiative forcing are also positive and statistically significant       net surface forcing is also positive over the Arabian Penin-
to the south of the Caspian Sea, which contributes partly to            sula but not statistically significant. Further, the positive net
the warming over this region, although its absolute value is            TOA forcing is obvious over the Arabian Peninsula (Fig. 10c,
not as large as that over the western TP (Fig. 9f, i). How-             f), which indicates that the pattern of surface air temperature

Atmos. Chem. Phys., 19, 1605–1622, 2019                                                    www.atmos-chem-phys.net/19/1605/2019/
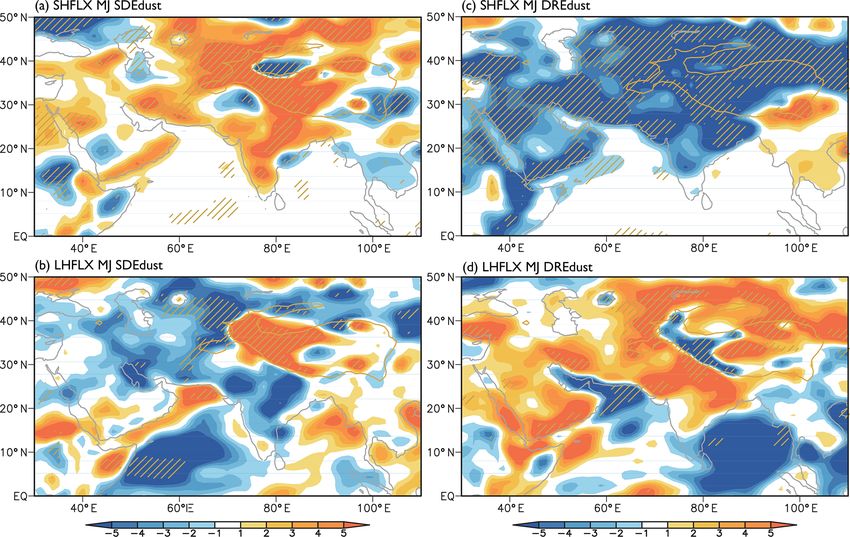
Z. Shi et al.: Dust effect on the Indian monsoon                                                                                     1615

Figure 9. Changes in longwave (a, d, g, W m−2 ), shortwave (b, e, h, W m−2 ) and net (longwave + shortwave, c, f, i, W m−2 ) radiative
fluxes during May and June by the snow-darkening effect of dust for the top of atmosphere (TOA, a–c), the surface (d–f) and the column
atmosphere (g–i). Oblique lines indicate differences significant at the 95 % confidence level. Yellow line shows the profile of the Tibetan
Plateau above 2500 m.

change by the DRE (Fig. 5d) is more likely controlled by the            all the source areas (Fig. 11c, d). Both of the heat fluxes over
TOA radiation change. As absorbing aerosol, the longwave                the TP are negative due to the snow-induced feedback.
and shortwave forcing for the column atmosphere is nega-                   The reason for the sensible heat change by the SDE is
tive and positive, respectively (Fig. 10g, h), with maximal             shown in the responses of surface ground temperature and
values distributed over the large dust AOD region (Fig. 1a).            snow cover fraction (Fig. 12). Consistent with surface air
The positive net total forcing of dust is found to be remark-           temperature and sensible heat flux, the surface ground tem-
ably positive over the Arabian Peninsula but not so large over          perature is also increased by more than 0.5 ◦ C and is statisti-
East Asia (Fig. 10i), which explains the simulated low-level            cally significant over the western TP and near the Caspian
tropospheric warming over the Arabian Peninsula (Fig. S1a).             Sea areas (Fig. 12a). Responsible for increased sensible
   Changes in surface sensible and latent heat fluxes over              heat fluxes over these regions, the large ground temperature
Asia due to the SDE and DRE of dust are shown, respec-                  change resulted from the decrease in surface snow covers
tively (Fig. 11). For the SDE, the sensible heat flux obviously         (Fig. 12b, c). However, the snow cover change over cen-
increases over the western TP and near Caspian Sea areas                tral Asia is different from that over the western TP. In May
(Fig. 11a). The increase in sensible heat flux is found to be in        and June, the snow covers over the TP are significantly de-
good agreement with the surface warming (Fig. 5c), which                creased by the SDE, but those over central Asia do not vary
indicates that the sensible heat helps to explain the surface           (Fig. 12b). In contrast, the snow covers around the Caspian
warming, especially over central Asia. The latent heat flux             Sea become less in April (Fig. 12c) and the decreased snow
also increases over the western TP but decreases over central           covers share a similar pattern to the local ground tempera-
Asia (Fig. 11b). As a result, the simulated TP warming is ac-           ture (Fig. 12a). The ground warming over central Asia dur-
tually from changes in radiation and sensible and latent heat;          ing May and June is actually controlled by the snow cover
in contrast, the central Asian warming around the Caspian               change in April and this delayed response of ground tem-
Sea is mainly from sensible heat changes. For the DRE, the              perature is possibly due to the thermal inertia of land. These
sensible heat is negative, but the latent heat is positive over         seasonal differences in central Asian snow covers are also in

www.atmos-chem-phys.net/19/1605/2019/                                                     Atmos. Chem. Phys., 19, 1605–1622, 2019
1616                                                                                  Z. Shi et al.: Dust effect on the Indian monsoon

Figure 10. Similar to Fig. 9 but for the direct radiative effect of dust.

good agreement with the diagnostic surface forcing of dust-                 and anticyclone anomaly is found over the Bay of Bengal and
in-snow in the model (Fig. 13). In May and June, the forc-                  India where the subsidence suppresses the formation of mon-
ing is merely restricted to the western TP (Fig. 13a), but in               soon rainfall. For the circulation, the anticyclone strength-
April, the forcing expands to the Caspian Sea areas (Fig. 13b)              ens the westerly air flow from the dry central Asia but lim-
and promotes the snowmelt. Thus, the warming over central                   its that from the moist Indian Ocean. In contrast, the forc-
Asia during May and June is primarily from the preceding                    ing of the DRE induces a low tropospheric warming over the
SDE forcing. The SDE forcing in April induces a decrease in                 Arabian Peninsula, which produces a low-pressure anomaly
surface snow covers and then a delayed warming of ground                    (Fig. 14b). Such a pattern gives a SDE-opposite impact of
temperature in May and June. The ground warming intensi-                    circulation, which intensifies the cross-equatorial southerly
fies the sensible heat exchange and contributes significantly               and weakens the dry air flows from the north. The role of the
to the surface air temperature change. For black-carbon-in-                 western TP cooling and high-pressure anomaly is not cer-
snow, there is no surface forcing over central Asia during                  tain considering that they are different from black-carbon-
both April and May–June (Fig. S4), highlighting their spatial               induced changes.
differences in the SDE between black carbon and dust.                          The radiative forcing and remarkable TP warming at the
                                                                            surface and high troposphere, as a direct response to the SDE
                                                                            of dust or other absorbing aerosols (e.g., black carbon), is
4   Discussion                                                              also found in previous studies (Flanner et al., 2009; Lau et
                                                                            al., 2010; Qian et al., 2011). They proposed that the snowmelt
The physical mechanisms for the SDE and DRE of mineral                      process is rapid and efficient during the late spring and early
dust on the Indian summer monsoon during the onset are                      summer (Lau et al., 2010; Qian et al., 2011, 2015), and this
summarized by schematic diagrams, respectively (Fig. 14).                   sensitive response of snow cover to SDE in the melting sea-
The forcing of the SDE occurs over the western TP and cen-                  son supports its significant role in Indian monsoon devel-
tral Asia, which becomes warmer due to decreased snow                       opment simulated in this study. Changes in thermal condi-
cover. Subsequently, two anomalous surface low-pressure                     tions over the surface TP, which acts as a heat source and
centers are produced and upward air flow dominates over                     emits great sensible heat flux into the atmosphere, have been
these areas (Fig. 14a). To their south, a forced high-pressure              proven to be essential in the establishment of the Indian mon-

Atmos. Chem. Phys., 19, 1605–1622, 2019                                                      www.atmos-chem-phys.net/19/1605/2019/
Z. Shi et al.: Dust effect on the Indian monsoon 1617 Figure 11. Changes in surface sensible and latent heat fluxes (W m−2 ) in May and June induced by the snow-darkening effect (a, b) and direct radiative effect of dust (c, d), respectively. Oblique lines indicate differences significant at the 95 % confidence level. Yellow line shows the profile of the Tibetan Plateau above 2500 m. soon (e.g., Yanai et al., 1992; Li and Yanai, 1996; Liu et central Asia. These differences in surface warming by dust al., 2001). Furthermore, change in snow cover over the TP and black carbon are also simulated in the experiments by the can also obviously affect the Indian monsoon by modifying NASA Goddard Earth Observing System Model (Yasunari et the thermal TP forcing (e.g., Vernekar et al., 1994; Senan al., 2015). We agree that the importance of TP temperature et al., 2016), and those over different parts of the TP may proposed in the SDE of absorbing aerosols and TP temper- play different roles (Wang et al., 2017). The response of the ature is certainly vital for the Indian summer monsoon de- Indian monsoon to the SDE of black carbon during the on- velopment (Qian et al., 2011), from a general perspective, set (Qian et al., 2011, hereafter Qian2011) is similar to what although the responses to dust and black carbon have indi- we found here for black carbon. As a result, it seems that vidual features. Our results further promote the complexity the SDE of dust in this study is reasonable, although it is of monsoon response to temperature pattern because central different from black carbon. Qian2011 emphasized that the Asia is one of the dust sources and is also covered by snow. polluted snowpack by black carbon over the TP warms the If a perturbance indeed occurs over this region, it may mod- local surface and enhances the sensible heat flux, which re- ulate the response of monsoon to TP warming. sults in an earlier onset of the Indian monsoon and heavier The DRE-strengthened Indian summer monsoon in this precipitation over northern India. The opposite monsoon re- paper is in qualitative agreement with previous studies (Lau sponse to dust originates from different locations of surface et al., 2006 (hereafter Lau2006), 2017; Gu et al., 2016), warming where the warming due to black carbon is just over in which either dust or black carbon, or both of them, are the TP but the warming due to dust extends quite westward included. However, the results may share different mech- to central Asia. The westward extension of warming forces anisms. For example, the DRE-strengthened Indian sum- the southerly winds over India (see Fig. S2 in this study and mer monsoon in Lau2006 by both dust and black carbon Fig. 15c in Qian2011) to the Arabian Peninsula (Fig. 6a). is ascribed to an elevated heat pump (EHP) mechanism by Black carbon, mainly emitted from the industrial countries, which the aerosols heat the southern slope of the TP by ab- is generally transported eastwards and scarcely into upwind sorbing the radiation and the hot air rises, which draws in www.atmos-chem-phys.net/19/1605/2019/ Atmos. Chem. Phys., 19, 1605–1622, 2019
1618                                                                               Z. Shi et al.: Dust effect on the Indian monsoon

                                                                        Figure 13. Surface forcing of dust-in-snow during May to June
                                                                        (W m−2 , a) and April (W m−2 , b). Yellow line shows the profile
                                                                        of the Tibetan Plateau above 2500 m.

                                                                        black carbon experiment and Lau2006. The TP warming in
                                                                        Lau2006 is more likely induced by black carbon and we do
                                                                        not make sure whether it can be produced by dust only. In-
                                                                        terestingly, there are consistent intensified summer monsoon
                                                                        and upward air motion over northern India in these stud-
                                                                        ies (Lau et al., 2006; Gu et al, 2016). In this study, the in-
                                                                        tensified summer monsoon due to dust is from low tropo-
                                                                        spheric warming over the Arabian Peninsula (Figs. 5d, S1a),
                                                                        which drives moisture from the southern oceans to Indian
                                                                        monsoon areas. This mechanism gains support from previ-
Figure 12. Changes in surface ground temperature in May and June
(◦ C, a) and snow cover fraction during May to June (%, b) and
                                                                        ous studies (Vinoj et al., 2014; Jin et al., 2014; Solmon et al.,
April (%, c) induced by the snow-darkening effect. Oblique lines        2015), which emphasized the modulation of western African
indicate differences significant at the 95 % confidence level. Yellow   dust on Indian monsoon rainfall. In our study, the western
line shows the profile of the Tibetan Plateau above 2500 m.             African dust warms the low-level troposphere and produces
                                                                        a low-pressure anomaly over the Arabian Peninsula, which
                                                                        is in good agreement with their studies. The intensified high-
moisture convergence over India. In our black carbon ex-                pressure cell in the high troposphere over the Arabian Penin-
periments, consistent response of Indian monsoon is simu-               sula is also emphasized in an observation study to affect the
lated, although the 3-D distribution of black carbon is dif-            onset of Indian monsoon (Zhang et al., 2014). Worth being
ferent. However, the EHP mechanism fails to be obvious                  pointed out is that the DRE of dust on surface temperature
when only mineral dust is considered here, because the DRE              is largely uncertain and depends closely on the size distri-
of dust only induces a remarkable surface cooling over the              butions, optical properties, etc. (Kok et al., 2017), which re-
TP during May and June, not a warming as shown in our                   stricts our accurate understanding of dust effects. The differ-

Atmos. Chem. Phys., 19, 1605–1622, 2019                                                  www.atmos-chem-phys.net/19/1605/2019/
Z. Shi et al.: Dust effect on the Indian monsoon 1619
Figure 14. Schematic diagrams showing the forcing mechanisms of the snow-darkening effect (a) and direct radiative effect (b) of mineral
dust on the Indian monsoon during the onset. The circles and abbreviations in them denote the anomalous pressure centers: high pressure
(blue), low pressure (red), near surface (dashed) and high troposphere (solid). The red and blue arrows indicate the upward and downward
air flows, respectively, and the yellow ones present the differences in horizontal winds.
ent performance of dust-induced radiative forcing and tem- onset, are proposed to the SDE and DRE of mineral dust,
perature changes over East Asia and northern Africa can be which is closely associated with surface and/or tropospheric
explained by different surface albedo background and par- temperature changes over dust sources. The SDE and DRE
ticle sizes (Liu et al., 2008; Takemura et al., 2009; Su and of dust are found to exert different impacts on monsoon sys-
Toon, 2011; Xie et al., 2018a). tems due to distinct temperature changes over Asia, high-
lighting the complexity of the climate effect of dust. The
forcing mechanisms of dust effect and the responses of In-
5 Conclusions dian monsoon may also be different from black carbon. Com-
pared to black-carbon-induced warming over only the west-
In this study, significant responses of Indian summer mon- ern TP, the SDE of dust warms the surface over both central
soon, including both circulation and precipitation during the Asia and the western TP, which weakens the monsoon de-
www.atmos-chem-phys.net/19/1605/2019/ Atmos. Chem. Phys., 19, 1605–1622, 20191620 Z. Shi et al.: Dust effect on the Indian monsoon
velopment and precipitation during May and June. Different References
from the TP, the central Asian warming mainly resulted from
the SDE-induced snow cover change in the preceding month,
which warms the ground and intensifies the sensible heat ex- Albani, S., Mahowald, N. M., Perry, A. T., Scanza, R. A., Zen-
der, C. S., Heavens, N. G., Maggi, V., Kok, J. F., and Otto-
change. The DRE of dust warms the low troposphere over
Bliesner, B. L.: Improved dust representation in the Commu-
the Arabian Peninsula and intensifies the monsoon onset. As nity Atmosphere Model, J. Adv. Model. Earth Sy., 6, 541–570,
a net result of SDE and DRE of dust, the precipitation in June https://doi.org/10.1002/2013MS000279, 2014.
is reduced. Besides the Indian monsoon, East Asian monsoon Bond, T. C., Doherty, S. J., Fahey, D. W., Forster, P. M., Berntsen,
should also be affected by the dust-induced thermal change, T., Deangelo, B. J., Flanner, M. G., Ghan, S., Kächer, B., Koch,
which will be examined in future. Compared to black car- D., Kinne, S., Kondo, Y., Quinn, P. K., Sarofim, M. C., Schultz,
bon presenting positive TOA forcing, the DREs of dust on M. G., Schulz, M., Venkataraman, C., Zhang, H., Zhang, S.,
atmospheric radiation budget and thermal structure are still Bellouin, N., Guttikunda, S. K., Hopke, P. K., Jacobson, M.
uncertain, which adds difficulty to evaluating the sensitivity Z., Kaiser, J. W., Klimont, Z., Lohmann, U., Schwarz, J. P.,
of specific climate systems to dust effects. Nevertheless, the Shindell, D., Storelvmo, T., Warren, S. G., and Zender, C. S.:
role of dust still needs to be deeply explored due to it be- Bounding the role of black carbon in the climate system: A sci-
entific assessment, J. Geophys. Res.-Atmos., 118, 5380–5552,
ing natural, and ought to be important during past climate
https://doi.org/10.1002/jgrd.50171, 2013.
change. In particular, several times larger dust burden and de- Claquin, T., Reolandt, C., Kohfeld, K., Harrison, S., Tegen, I., Pren-
position during the Last Glacial Maximum (Mahowald et al., tice, I., Balkanski, Y., Bergametti, G., Hansson, M., Mahowald,
2006; Maher et al., 2010), as well as higher snow cover frac- N., Rodhe, H., and Schulz, M.: Radiative forcing of climate by
tion due to cold climate, are likely to induce stronger DRE ice-age atmospheric dust, Clim. Dynam., 20, 193–202, 2003.
and SDE than the present day. Flanner, M. G., Liu, X., Zhou, C., Penner, J. E., and Jiao, C.:
Enhanced solar energy absorption by internally-mixed black
carbon in snow grains, Atmos. Chem. Phys., 12, 4699–4721,
Data availability. All model results are archived on the cluster sys- https://doi.org/10.5194/acp-12-4699-2012, 2012.
tem at Institute of Earth Environment, Chinese Academy of Sci- Flanner, M. G., Zender, C. S., Randerson, J. T., and Rasch,
ences, and available upon request. Please contact Zhengguo Shi P. J.: Present day climate forcing and response from
(shizg@ieecas.cn) for access. black carbon in snow, J. Geophys. Res., 112, D11202,
https://doi.org/10.1029/2006JD008003, 2007.
Flanner, M. G., Zender, C. S., Hess, P. G., Mahowald, N. M.,
Supplement. The supplement related to this article is available Painter, T. H., Ramanathan, V., and Rasch, P. J.: Springtime
online at: https://doi.org/10.5194/acp-19-1605-2019-supplement. warming and reduced snow cover from carbonaceous particles,
Atmos. Chem. Phys., 9, 2481–2497, https://doi.org/10.5194/acp-
9-2481-2009, 2009.
Ganguly, D., Rasch, P. J., Wang, H., and Yoon, J.: Fast
Author contributions. ZS designed the research and analyzed the
and slow responses of the South Asian monsoon system
results. XiaonX and XL conducted the experiments. ZS prepared
to anthropogenic aerosols, Geophys. Res. Lett., 39, L18804,
the manuscript with contributions from all the co-authors.
https://doi.org/10.1029/2012GL053043, 2012.
Gu, Y., Xue, Y., De Sales, F., and Liou, K. N.: A GCM investigation
of dust aerosol impact on the regional climate of North Africa
Competing interests. The authors declare that they have no conflict and South/East Asia, Clim. Dynam., 46, 2353–2370, 2016.
of interest. Hansen, J. and Nazarenko, L.: Soot climate forcing via snow and
ice albedos, P. Natl. Acad. Sci. USA, 101, 423–428, 2004.
Harrison, S. P., Kohfeld, K. E., Roelandt, C., and Claquin, T.: The
Acknowledgements. The authors appreciate two anonymous role of dust in climate changes today, at the last glacial maximum
reviewers for their insightful comments, which were of great and in the future, Earth Sci. Rev., 54, 43–80, 2001.
help for the manuscript. This work was jointly supported by Haywood, J. M., Francis, P. N., Glew, M. D., and Taylor, J. P.: Opti-
the National Key Research and Development Program of China cal properties and direct radiative effect of Saharan dust: A case
(2016YFA0601904), the National Natural Science Foundation of study of two Saharan dust outbreaks dusing aircraft data, J. Geo-
China (41888101, 41572160), and the Strategic Priority Research phys. Res.-Atmos., 106, 18417–18430, 2006.
Program of the Chinese Academy of Sciences (XDA20070103). He, C., Li, Q., Liou, K., Takano, Y., Gu, Y., Qi, L., Mao, Y., and Le-
Zhengguo Shi also acknowledged the support of the Youth Inno- ung, L.: Black carbon radiative forcing over the Tibetan Plateau,
vation Promotion Association CAS and “Light of West China” Geophys. Res. Lett., 41, 7806–7813, 2014.
Program. He, C., Liou, K., Takano, Y., Yang, P., Qi, L., and Chen, F.: Im-
pact of grain shape and multiple black carbon internal mixing
Edited by: Toshihiko Takemura on snow albedo: Parameterization and radiative effect analysis,
Reviewed by: two anonymous referees J. Geophys. Res.-Atmos., 123, 1253–1268, 2018.
Huang, J., Minnis, P., Yi, Y., Tang, Q., Wang, X., Hu, Y., Liu, Z.,
Ayers, K., Trepte, C., and Winker, D.: Summer dust aerosols de-
Atmos. Chem. Phys., 19, 1605–1622, 2019 www.atmos-chem-phys.net/19/1605/2019/Z. Shi et al.: Dust effect on the Indian monsoon 1621
tected from CALIPSO over the Tibetan Plateau, Geophys. Res. internally mixed BC/dust in snow grains for application to cli-
Lett., 34, L18805, https://doi.org/10.1029/2007GL029938, 2007. mate models, J. Geophys. Res.-Atmos., 119, 7616–7632, 2014.
Huang, J., Wang, T., Wang, W., Li, Z., and Yan, H.: Cli- Lou, S., Russell, L. M., Yang, Y., Liu, Y., Singh, B., and Ghan, S.
mate effects of dust aerosols over East Asian arid and semi- J.: Impacts of interactive dust and its direct radiative forcing on
arid regions, J. Geophys. Res.-Atmos., 119, 11398–11416, interannual variations of temperature and precipitation in winter
https://doi.org/10.1002/2014JD021796, 2014. over East Asia, J. Geophys. Res., 122, 8761–8780, 2017.
IPCC: Climate Change 2013: The Physical Science Basis. Contri- Maher, B. A., Prospero, J. M., Mackie, D., Gaiero, D., Hesse,
bution ofWorking Group I to the Fifth Assessment Report of the P., and Balkanski, Y.: Global connections between aeolian
Intergovernmental Panel on Climate Change, edited by: Stocker, dust, climate and ocean biogeochemistry at the present day
T. F., Qin, D., Plattner, G.-K., Tignor, M., Allen, S. K., Boschung, and at the last glacial maximum, Earth-Sci. Rev., 99, 61–97,
J., Nauels, A., Xia, Y., Bex, V., and Midgley, P. M., Cambridge https://doi.org/10.1016/j.earscirev.2009.12.001, 2010.
University Press, Cambridge, United Kingdom and New York, Mahowald, N. M., Muhs, D. R., Levis, S., Rasch, P. J., Yoshioka,
NY, USA, 1535 pp., 2013. M., Zender, C. S., and Luo, C.: Change in atmospheric mineral
Jin, Q., Wei, J., and Yang, Z.: Positive response of Indian summer aerosols in response to climate: Last glacial period, preindustrial,
rainfall to Middle East dust, Geophys. Res. Lett., 41, 4068–4074, modern, and doubled carbon dioxide climates, J. Geophys. Res.,
2014. 111, D10202, https://doi.org/10.1029/2005JD006653, 2006.
Kallos, G., Papadopoulos, A., Katsafados, P., and Nickovic, Mahowald, N. M., Albani, S., Kok, J. F., Engelstaedter, S., Scanza,
S.: Transatlantic Saharan dust transport: Model simula- R., Ward, D. S., and Flanner, M. G.: The size distribution of
tion and results, J. Geophys. Res.-Atmos., 111, D09204, desert dust aerosols and its impact on the Earth system, Aeolian
https://doi.org/10.1029/2005JD006207, 2006. Res. 15, 53–71, https://doi.org/10.1016/j.aeolia.2013.09.002,
Kok, J. F., Ridley, D. A., Zhou, Q., Miller, R. L., Zhao, 2014.
C., Heald, C. L., Ward, D. S., Albani, S., and Haustein, Miller, R. L. and Tegen, I.: Climate response to soil dust aerosols,
K.: Smaller desert dust cooling effect estimated from analy- J. Clim., 11, 3247–3267, 1998.
sis of dust size and abundance, Nat. Geosci., 10, 274–278, Miller, R. L., Perlwitz, J., and Tegen, I.: Feedback upon
https://doi.org/10.1038/ngeo2912, 2017. dust emission by dust radiative forcing through the plan-
Lau, K. M., Kim, K. M., Shi, J., Matsui, T., Chin, M., Tan, Q., etary boundary layer, J. Geophys. Res., 109, D24209,
Peters-Lidard, C., and Tao, W. K.:. Impacts of aerosol-monsoon https://doi.org/10.1029/2004JD004912, 2004.
interaction on rainfall and circulation over Northern India and the Ming, J., Wang, P., Zhao, S., and Chen, P.: Disturbance of
Himalaya Foothills, Clim. Dynam., 49, 1945–1960, 2017. light-absorbing aerosols on the albedo in a winter snow-
Lau, K. M., Kim, M. K., and Kim, K. M.:. Asian monsoon anoma- pack of Central Tibet, J. Environ. Sci.-China, 25, 1601–1607,
lies induced by aerosol direct forcing: the role of the Tibetan https://doi.org/10.1016/S1001-0742(12)60220-4, 2013.
Plateau, Clim. Dynam., 26, 855–664, 2006. Nigam, S. and Bollasina, M.: “Elevated heat pump” hy-
Lau, K.-M., Kim, M. K., Kim, K.-M., and Lee, W. S.: Enhanced pothesis for the aerosol-monsoon hydroclimate link:
surface warming and accelerated snow melt in the Himalayas “Grounded” in observations?, J. Geophys. Res., 115, D16201,
and Tibetan Plateau induced by absorbing aerosols, Environ. Res. https://doi.org/10.1029/2009JD013800, 2010.
Lett., 5, 025204, https://doi.org/10.1088/1748-9326/5/2/025204, Niu, H., Kang, S., Zhang, Y., Shi, X., Shi, X., Wang, S., Li, G., Yan,
2010. X., Pu, T., and He, Y.: Distribution of light-absorbing impurities
Lee, W.-L., Liou, K. N., He, C., Liang, H., Wang, T., Li, Q., Liu, in snow of glacier on Mt. Yulong, southeastern Tibetan Plateau,
Z., and Yue, Q.: Impact of absorbing aerosol deposition on snow Atmos. Res., 197, 474–484, 2017.
albedo reduction over the southern Tibetan plateau based on Qian, Y., Flanner, M., Leung, L., and Wang, W.: Sensitivity stud-
satellite observations, Theor. Appl. Climatol., 129, 1373–1382, ies on the impacts of Tibetan Plateau snowpack pollution on
2017. the Asian hydrological cycle and monsoon climate, Atmos.
Lee, W. S., Bhawar, R. L., Kim, M. K., and Sang, J.: Study of Chem. Phys., 11, 1929–1948, https://doi.org/10.5194/acp-11-
aerosol effect on accelerated snow melting over the Tibetan 1929-2011, 2011.
Plateau during boreal spring, Atmos. Environ., 75, 113–122, Qian, Y., Yasunari, T. J., Doherty, S. J., Flanner, M. G., Lau, W. K.
2013. M., Jing, M., Wang, H., Wang, M., Warren, S. G., and Zhang,
Li, C. and Yanai, M.: The Onset and Interannual Variability of the R.: Light-absorbing Particles in Snow and Ice: Measurement
Asian Summer Monsoon in Relation to Land-Sea Thermal Con- and Modeling of Climatic and Hydrological impact, Adv. At-
trast, J. Clim., 9, 358–375, 1996. mos. Sci., 32, 64–91, https://doi.org/10.1007/s00376-014-0010-
Liu, D., Wang, Z., Liu, Z., Winker, D., and Trepte, C.: A height 0, 2015.
resolved global view of dust aerosols from the first year Räisänen, P., Makkonen, R., Kirkevåg, A., and Debernard, J. B.:
CALIPSO lidar measurements, J. Geophys. Res., 113, D16214, Effects of snow grain shape on climate simulations: sensitivity
https://doi.org/10.1029/2007JD009776, 2008. tests with the Norwegian Earth System Model, The Cryosphere,
Liu, X. and Yanai, M.: Relationship between the Indian monsoon 11, 2919–2942, https://doi.org/10.5194/tc-11-2919-2017, 2017.
rainfall and the tropospheric temperature over the Eurasian con- Ramanathan, V., Crutzen, P. J., Kiehl, J. T., and Rosenfeld, D.:
tinent, Q. J. Roy. Meteor. Soc., 127, 909–937, 2001. Aerosols, climate, and the hydrological cycle, Science, 294,
Liou, K. N., Takano, Y., He, C., Yang, P., Leung, L. R., Gu, Y., and 2119–2124, 2001.
Lee, W. L.: Stochastic parameterization for light absorption by Schepanski, K., Tegen, I., and Macke, A.: Saharan dust transport
and deposition towards the tropical northern Atlantic, Atmos.
www.atmos-chem-phys.net/19/1605/2019/ Atmos. Chem. Phys., 19, 1605–1622, 2019You can also read