Changes in Fog, Ice Fog, and Low Visibility in the Hudson Bay Region: Impacts on Aviation
←
→
Page content transcription
If your browser does not render page correctly, please read the page content below
atmosphere
Article
Changes in Fog, Ice Fog, and Low Visibility in the
Hudson Bay Region: Impacts on Aviation
Andrew C. W. Leung 1 , William A. Gough 1, * and Ken A. Butler 2
 1   Department of Physical & Environmental Sciences, University of Toronto Scarborough, 1265 Military Trail,
     Toronto, ON M1C 1A4, Canada; andrewc.leung@utoronto.ca
 2   Department of Computer & Mathematical Sciences, University of Toronto Scarborough, 1265 Military Trail,
     Toronto, ON M1C 1A4, Canada; butler@utsc.utoronto.ca
 *   Correspondence: william.gough@utoronto.ca

 Received: 15 December 2019; Accepted: 6 February 2020; Published: 10 February 2020

 Abstract: Fog and low visibility present a natural hazard for aviation in the Hudson Bay region.
 Sixteen communities on the eastern and western shores of Hudson and James Bays, Canada, were
 selected for fog, ice fog, and low visibility statistical analyses for a range of 21 to 62 year time
 series. Both fog hours and ice fog hours were found to be in general decline, with some locations
 experiencing statistically significant declines. Spatial asymmetries for fog and ice fog were observed
 among the various areas within the Hudson Bay region. The more northerly locations in this study
 experienced statistically significant declines in fog hours while the southerly locations’ declines were
 not significant. Fog was significantly declining in some western Hudson Bay locations during spring
 and fall and in James Bay during winter and summer, but minimal trends were observed in eastern
 Hudson Bay. For ice fog hours, all of the locations in the western shore of Hudson Bay experienced a
 significant decline in winter while only one-third of the locations in eastern shores were found to be
 declining significantly during winter. Blowing snow, snow, ice and fog were the leading causes for
 reduced and low visibilities at the majority of the locations. Other factors such as rain contributed a
 minor role to low visibility.

 Keywords: fog observation; time series analysis; spatial variability; subarctic; flight safety; airport

1. Introduction
     Fog reduces visibility, making it difficult for pilots to find the runway to land [1]. Reduced
visibility accounted for one-half of all weather-related accidents in Canada [2]. The low visibility
accident rates are lower in the US (21%) and India (16%) [3]. Low visibility is caused by a number of
atmospheric conditions, including fog, heavy rain, blowing snow, and haze. In the Hudson Bay region
(Figure 1), flights often carry fuel and groceries or transport medivac patients to medical facilities.
Therefore, delayed and cancelled flights negatively affect the health and well-being of those living in
these communities. Safety issues including fatal accidents are a major concern
     At major airports, poor visibility below 800 m hampers takeoff and landings [6]. Within the
Hudson Bay region, airports are serviced by smaller aircraft and they require greater visibility threshold
to safely takeoff and land [1]. Helicopters, often used for search and rescue missions, demand even
greater visibility than smaller aircraft since they fly closer to the ground and are more vulnerable to
severe weather at the surface [6]. Coastal communities along the Hudson Bay frequently encounter sea
fog resulting from cold air moving over relatively warmer open waters [7]. The air just above the open
waters is warmer than the cold air moving in by advection, causing the warmer air to cool and water
vapour to condense into steam fog [8]. In addition, ice fog is formed in extremely cold temperatures in
winter when high relative humidity allows ice crystals to suspend in the air. Percentage frequency of

Atmosphere 2020, 11, 186; doi:10.3390/atmos11020186                          www.mdpi.com/journal/atmosphere
Atmosphere 2020, 11,
Atmosphere 2020, 11, 186
186 22 of
of 19
18
in the air. Percentage frequency of fog and ice fog were also higher in summer than in winter at
fog and ice fog were also higher in summer than in winter at Hudson Bay and the Canadian Arctic
Hudson Bay and the Canadian Arctic Islands [8,9]. While there are fog studies in this area in the
Islands [8,9]. While there are fog studies in this area in the context of marine navigation, sea ice
context of marine navigation, sea ice restricted the fog sampling by shipping vessels to narrow
restricted the fog sampling by shipping vessels to narrow corridors and only during ice-free periods in
corridors and only during ice-free periods in summer [10]. Their study found that mean fog
summer [10]. Their study found that mean fog occurrence in summer was significantly rising between
occurrence in summer was significantly rising between 1950 and 2007 in the Grand Banks area near
1950 and 2007 in the Grand Banks area near Newfoundland. However, there was no discernible
Newfoundland. However, there was no discernible difference for fog observations by ships in the
difference for fog observations by ships in the summer in Ungava Bay, along the coastline of northern
summer in Ungava Bay, along the coastline of northern Labrador or Gulf of St. Lawrence.
Labrador or Gulf of St. Lawrence. [2,4,5].
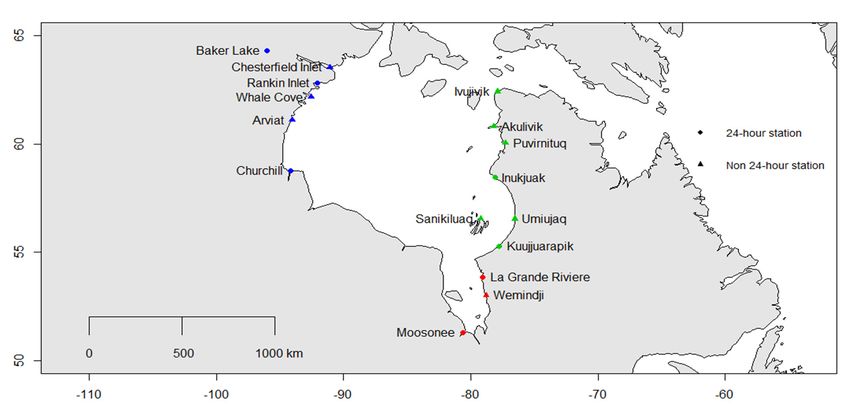
Figure
Figure 1. Locationofofairport
1. Location airportsites
sites used
used in in
thisthis study.
study. Diamond
Diamond points
points indicate
indicate stations
stations with with
24 h
24 h observations and triangles for those stations that do not. Stations in Western Hudson Bay,
observations and triangles for those stations that do not. Stations in Western Hudson Bay, Eastern
Eastern Hudson Bay and James Bay are mapped in blue, green and red respectively based on their
Hudson Bay and James Bay are mapped in blue, green and red respectively based on their regional
regional groupings.
groupings.
Hudson Bay is the dominant feature in the Canadian northern landscape (Figure 1). Its physical
Hudson Bay is the dominant feature in the Canadian northern landscape (Figure 1). Its
characteristics enable the marine influence of the Arctic Ocean into the centre of the North American
physical characteristics enable the marine influence of the Arctic Ocean into the centre of the North
continent. Sea ice is the key climate control [11–18]. The sea ice is seasonal, breaking up in July and
American continent. Sea ice is the key climate control [11–18]. The sea ice is seasonal, breaking up in
early August and freezing up in November. Between December and June, the Bay is completely
July and early August and freezing up in November. Between December and June, the Bay is
ice covered. September is typically ice free as are much of August and October [19]. Sea ice with its
completely ice covered. September is typically ice free as are much of August and October [19]. Sea
strong insulating properties enables the Bay when fully covered act similarly, from a climate energetic
ice with its strong insulating properties enables the Bay when fully covered act similarly, from a
standpoint, to the surrounding land. The slow breakup of the sea ice in the spring and early summer
climate energetic standpoint, to the surrounding land. The slow breakup of the sea ice in the spring
enables a lingering cooling as the ice slowly melts leading to what Rouse [11] refers to as the local
and early summer enables a lingering cooling as the ice slowly melts leading to what Rouse [11]
“winterization” of summer. Hudson Bay is characterized by the seasonal interplay of large scale air
refers to as the local “winterization” of summer. Hudson Bay is characterized by the seasonal
masses [20]. The dominant balance is between dry, polar (DP) and moist, polar (MP) air masses.
interplay of large scale air masses [20]. The dominant balance is between dry, polar (DP) and moist,
The former originates over the ice covered Canadian Archipelago while the latter originates either
polar (MP) air masses. The former originates over the ice covered Canadian Archipelago while the
locally over Hudson Bay or remotely from the North Atlantic. Leung and Gough [20] found a decrease
latter originates either locally over Hudson Bay or remotely from the North Atlantic. Leung and
in DP that was well documented at all stations with a corresponding increase in MP and at times DM
Gough [20] found a decrease in DP that was well documented at all stations with a corresponding
(dry, moderate) and/or MM (moist moderate), consistent with a gradual, but heterogenous, in space
increase in MP and at times DM (dry, moderate) and/or MM (moist moderate), consistent with a
and time, temperature increase.
gradual, but heterogenous, in space and time, temperature increase.
The Hudson Bay region has experienced warming in recent decades. Hochheim and Barber [17]
The Hudson Bay region has experienced warming in recent decades. Hochheim and Barber
documented a concurrent reduction in seasonal sea ice with an increase in surface air temperature.
[17] documented a concurrent reduction in seasonal sea ice with an increase in surface air
These changes were not homogeneous, with substantive fall temperature increase and related ice
temperature. These changes were not homogeneous, with substantive fall temperature increase and
changes only occurring in recent years [19].
related ice changes only occurring in recent years [19].
We address the following research questions in this study:
We address the following research questions in this study:
(1) Has fog
(1) Has fog and
andiceicefogfog
frequency
frequencyat the
at 16
thecommunities around
16 communities Hudson
around Bay region
Hudson Baychanged between
region changed
1953 and 2014? Were there significant temporal trends?
between 1953 and 2014? Were there significant temporal trends?
(2)
(2) IfIf there
there is
is aa change,
change, what
what isis the
the nature
nature ofof this
this change?
change?
(3) Were there changes to restricted visibility over time?Atmosphere 2020, 11, 186 3 of 19
(3) Were there changes to restricted visibility over time?
2. Methods
2.1. Weather Conditions
Most airports in the Hudson Bay Region operate during the day as they do not have the flight
frequency that merits operating the airport 24 h a day. The normal operation starts at 07:00 or 08:00
local time and the airports are staffed for 10 to 12 h on weekdays. Staffed operation hours are reduced
on weekends and holidays, during poor visibility such as blizzards that results in early airport closure.
With the exception of medical evacuation (medevac) flights, the airport is closed at night and no
weather observations are typically made. The hourly weather observer records various climatological
parameters, such as temperature, humidity, precipitation, wind, cloud ceiling, visibility, significant
weather and obstructions to visibility such as fog, rain, and blowing snow. According to the most recent
version of the Environment and Climate Change Canada’s Manual of Surface Weather Observations
(MANOBS), fog is defined as small water droplets or ice crystals suspended in the air, reducing the
visibility to 0.5 statute mile (0.8 km) or less at the surface [21]. The definition for freezing fog is identical
to fog, except that the temperature is between −0.1 and −30.0 ◦ C and the visibility is 0.5 statute mile
(0.8 km) or less, or at temperatures below −30.0 ◦ C with physical evidence of ice accretion from fog
and visibility was 0.5 statute mile (0.8 km) or less [21]. Fog could also be reported at below −30.0 ◦ C if
no icing was observed. Prior to 1 November 1999, freezing fog was recorded as ice fog. Ice fog was a
subset of fog and both were reportable from 0 to 6 statute miles (9.7 km) of visibility before 1 November
1999. Ice fog could be reported at temperatures below freezing if there was no sign of icing. Starting
from 1 November 1999, fog and freezing fog were only reported when the visibility was 0.5 statute
mile (0.8 km) or less. The change in MANOBS definition was required because freezing fog contained
supercooled liquid as part of is definition, but supercooled liquid was very unlikely to exist at and
below −30.0 ◦ C [22,23]. The change also brought consistency in aerodrome observations within North
America and developed consensus for best practices in weather reporting with other countries [22].
Since ice fog and freezing fog were recorded using similar definitions and that freezing fog replaced ice
fog in aerodrome reports in 1999, their numbers were combined and treated as ice fog. It is important
to note that studies related to fog around the world use visibility under 1 km as the threshold [24–26].
Since the visibility at Hudson Bay airports were made by human observers, MANOBS stipulated
that visibility must be reported in increments of one-eighth of a statute mile (every 200 m) when the
visibility was below 1 statute mile (1.6 km) [21]. Hence, there were no data points between 800 m and
1 km exclusively. Therefore, data examined in this study (fog and ice fog with visibility of 800 m or
less) are identical to other fog studies which used the threshold of less than 1 km.
In MANOBS, the atmospheric phenomena that cause reduced and low visibilities include fog,
ice fog, drizzle, rain, freezing drizzle, freezing rain, snow, snow pellets, ice pellets and blowing
snow [21]. Drizzle is liquid water precipitation with the droplet diameter less than 0.5 mm. Rain is
liquid water precipitation with the droplet diameter exceeding 0.5 mm or smaller but widely scattered
droplets. Freezing drizzle is any drizzle which freezes upon impact with the ground or other objects.
Freezing rain is any rain event which freezes upon impact with the surface. Snow is hexagonal frozen
precipitation falling towards the surface. Snow pellets are spherically or conically-shaped opaque ice
particles with a diameter of 2 to 5 mm. Ice pellets are irregular or spherically-shaped translucent ice
particles with a diameter of 5 mm or less. Blowing snow is any snow being lifted by the strong winds
such that the horizontal visibility at eye level is 6 statute miles (9.7 km) or less. For the purpose of this
study, snow and snow pellets were grouped together and treated as snow. Fog, ice fog and freezing
fog were combined as fog for this part of the study. It is possible for the observer to attribute multiple
weather phenomena to the same hour of observation.
Since fog tends to appear just before sunrise, airports that operate 24 h a day in the region capture
the presence of fog more accurately than the non-24 h airports. Nonetheless, the observation recordsAtmosphere 2020, 11, 186 4 of 19
from the non-24 h airport weather stations had its purpose for analyzing the hours at which flights
arrive and depart, during hours that are aviation relevant.
2.2. Visibility
Visibility at each airport was determined by human observers by comparing against surrounding
landmarks at known distances noted on the visibility chart [21]. They examine the visibility around
the airport at eye-level (1.5 m above ground). If visibility was obscured in less than a quadrant in
the surrounding areas, the observers would report the prevailing visibility. If visibility was obscured
greater than a quadrant, the observer would factor in the obstruction and estimate the prevailing
visibility from all directions. Unlike automatic visibility sensor, human approach did not provide a
precise visibility value. However, automated sensor was only capable of sensing the visibility between
the transmitter and the receiver, which might not be representative of the prevailing conditions around
the airport.
2.3. Data Collection
Sixteen communities with airports in the Hudson Bay region were chosen for this study (Figure 1).
They were grouped, in a geographical manner similar to the Canadian Ice Service Ice Regime
subregions [27], into eastern Hudson Bay and western Hudson Bay regions (Table 1). In addition,
La Grande Riviere, Wemindji and Moosonee were grouped as the James Bay region instead of eastern
Hudson Bay. Seven of these sites operated 24 h a day. The other nine stations operated only during
the day. Hourly ground level visibility conditions at 1.5 m and the significant weather events that caused
reduced and low visibilities were obtained from the study sites through Environment and Climate
Change Canada’s Climate Data Online [28]. The sites were chosen as they were the only long-term
weather stations located at airports in the Hudson Bay and James Bay regions. Station records ranged
from 21 to 62 years (Table 1). The study period for each site was based on the most recent, longest
period of records where observation frequency did not change (e.g., observation taken once every 3 or 6
h became hourly observations, 24 h weather station converted to a daytime-only station, etc.), with the
end year of 2014. Moosonee is the exception to this selection period criterion as the end year was 1992
due to the sporadic nature of the data collection post-1992. The temperature evolution for each of these
stations is presented in Table 2 which lists the mean annual temperature for 30-year climate normal
periods from 1941–1970 to 1981–2010 [29–33]. As noted in the Introduction, these data indicate a
gradual warming in the Hudson Bay region, particularly starting from the 1971–2000 climate normals.
The seasons are defined in climatological months: winter (December, January, February),
spring (March, April, May), summer (June, July, August) and fall (September, October, November).
Annual is defined as the total for the four seasons, which includes the December of the previous year
to be consistent with climatological seasons.
Number of hours with fog and ice fog were counted and combined into seasonal and annual
data to assess temporal trends using the modified Mann–Kendall test to account for the possibility
of autocorrelation in the trend by changing the variance of the data [34]. Annual number of
hours of fog and ice fog were plotted in LOWESS (locally weighted scatterplot smoothing) time
series graphs. We examined the frequencies of reduced visibility (≤0.5 statute mile) and low visibility
(≤0.25 statute mile), as defined by Transport Canada [35]. They are equivalent to ≤0.8 km and ≤0.4 km
respectively. Hours of reduced and low visibility per year were also plotted in LOWESS time series
graphs. The magnitudes of change in hours per year for fog, ice fog, reduced visibility and low visibility
were determined by Theil–Sen slope estimator [36,37]. Similar to autocorrelation in fog data, trends in
visibility were assessed to detect the presence of autocorrelation and adjusted in the same manner
as [34]. Top three causes of reduced and low visibilities were calculated by examining the significant
weather events that were present within the observed hour. These significant weather events were
assumed to be the cause for reduced and low visibilities. Multiple significant weather events (e.g.,Atmosphere 2020, 11, 186 5 of 19
snow and blowing snow) could be recorded by the weather observer in the same hour and each factor
was considered as one event for their corresponding category for that hour.
Table 1. The length of study in the selected communities and their regional groupings, with asterisks
(*) to indicate 24 h stations.
Region Location Study Period Length of Study (years)
Baker Lake * 1963–2014 52
Chesterfield Inlet 1992–2014 23
Rankin Inlet * 1981–2014 34
Western Hudson Bay
Whale Cove 1985–2014 30
Arviat 1985–2014 30
Churchill * 1953–2014 62
Ivujivik 1993–2014 22
Akulivik 1993–2014 22
Puvirnituq 1994–2014 21
Eastern Hudson Bay Inukjuak * 1993–2014 22
Umiujaq 1993–2014 22
Kuujjuarapik * 1957–2014 58
Sanikiluaq 1988–2014 27
La Grande Riviere * 1977–2014 38
James Bay Wemindji 1993–2014 22
Moosonee * 1972–1992 21
Table 2. The 30-year normal mean temperature (◦ C) for all station locations in the Hudson Bay region
[29–33]. N/A indicates that data are not available for the location in that normals period.
Location 1941–1970 1951–1980 1961–1990 1971–2000 1981–2010
Baker Lake −12.3 −12.2 −12.2 −11.8 −11.3
Chesterfield Inlet −11.6 −11.6 N/A N/A −10.6
Rankin Inlet N/A N/A N/A −11.0 −10.5
Whale Cove N/A N/A N/A N/A −10.0
Arviat N/A N/A N/A N/A −9.3
Churchill −7.3 −7.2 −7.1 −6.9 −6.5
Ivujivik N/A N/A N/A N/A N/A
Akulivik N/A N/A N/A N/A N/A
Puvirnituq N/A N/A N/A N/A N/A
Inukjuak −6.7 −6.7 −6.8 −7.0 N/A
Umiujaq NA N/A N/A N/A N/A
Kuujjuarapik −4.1 −4.3 −4.5 −4.4 −4.0
Sanikiluaq N/A N/A N/A N/A N/A
La Grande Riviere N/A N/A N/A −3.1 −2.9
Wemindji N/A N/A N/A N/A N/A
Moosonee −0.9 −1.1 −1.3 −1.1 −0.5
3. Results
3.1. Fog
Fog hours at each location are presented in Figure S1. Fog had high spatial variability as these
plots illustrate. There was a general declining trend for fog hours per year at each study community
across all seasons (Table 3). Autocorrelation was present in some locations and the significanceAtmosphere 2020, 11, 186 6 of 19
levels were adjusted to account for positive and negative autocorrelations. In Western Hudson Bay,
the northern sites experienced the most significant decline (p < 0.05) in spring and fall. Chesterfield
Inlet, Rankin Inlet and Whale Cove experienced a significant annual reduction of 3 to 7 h of fog
(p < 0.05) each year. Arviat was the only location with significantly increased fog hours in summer
(p < 0.01). In Eastern Hudson Bay, Puvirnituq experienced significantly fewer fog hours on an annual
scale while Kuujjuarapik had significantly less in spring and summer (both at p < 0.05).
Table 3. Trends in fog hours per year with significance level adjusted for autocorrelation. Significance
level: *** p < 0.001; ** p = < 0.01; * p < 0.05; ˆ p < 0.10.
Region Location Winter Spring Summer Fall Annual
Baker Lake +0.08 −0.25 −0.38 −1.00 * −1.33
Chesterfield Inlet No change +0.26 −1.87 ˆ −2.47 * −4.00 *
Rankin Inlet +0.09 −2.43 *** −1.91 −2.0 * −6.93 **
Western Hudson Bay
Whale Cove −0.07 −0.70 * −0.67 −1.57 ** −3.25 **
Arviat No change No change +1.30 ** +0.38 +1.29
Churchill No change −0.50 −0.23 −0.29 −1.21
Ivujivik +1.38 +0.10 −0.45 +1.00 +1.29
Akulivik No change −0.53 −0.58 −0.67 −1.71
Puvirnituq −1.12 −2.21 −0.67 −1.75 −6.34 *
Eastern Hudson Bay Inukjuak No change −0.67 −1.38 −0.94 −2.86
Umiujaq −0.53 −0.75 −0.69 No change −2.00
Kuujjuarapik −0.08 −0.96 * −2.38 * +0.59 −2.72
Sanikiluaq +0.17 −0.46 +1.67 ˆ +0.15 ˆ +1.26
La Grande Riviere +0.82 −0.82 −2.23 ** −1.67 * −5.80 **
James Bay Wemindji −0.33 * −0.69 −0.75 ** −0.83 −2.85 **
Moosonee −0.22 * −1.79 ˆ −4.46 ˆ −3.28 −8.71 ˆ
3.2. Ice Fog
Ice fog hours are presented in Figure S2. Unlike fog, there was an overall decline for ice fog at
almost all locations. There was a slight increase in ice fog at Baker Lake, Churchill, Kuujjuarapik,
Inukjuak from approximately 1975 to 1985 followed by a downward trend. After adjusting the
significance level to account for autocorrelation (Table 4), each community in western Hudson Bay
experienced significantly less ice fog (p < 0.05) in winter and all but Chesterfield Inlet experienced
significantly less (p < 0.05) on an annual scale. Only two communities in eastern Hudson Bay had
significantly less ice fog (p < 0.05) in winter and four communities in spring (p < 0.05). The magnitude
of decline was greater in western Hudson Bay than eastern Hudson Bay. The decline was the weakest
in James Bay. No changes were observed across all stations during the summer months and at all
Eastern Hudson Bay stations during fall.Atmosphere 2020, 11, 186 7 of 19
Table 4. Trends in ice fog hours per year with significance level adjusted for autocorrelation. Significance
level: *** p < 0.001; ** p = < 0.01; * p < 0.05; ˆ p < 0.10. N/A = not applicable due to small sample size
across the years.
Region Location Winter Spring Summer Fall Annual
Baker Lake −5.13 * −2.13 *** No change −0.44 ** −8.03 *
Chesterfield Inlet −0.43 * +0.17 * No change No change −0.57
Rankin Inlet −9.17 *** −2.10 No change −0.36 ˆ −10.32 *
Western Hudson Bay
Whale Cove −1.67 * −0.20 No change No change −2.00 ***
Arviat −1.82 *** −0.47 * No change No change −2.50 **
Churchill −1.83 ** −0.06 No change No change −1.76 ***
Ivujivik −3.33 −1.20 * No change No change −4.25 **
Akulivik −1.00 −0.27 * No change No change −1.00
Puvirnituq −2.46 −1.47 No change No change −4.13
Eastern Hudson Bay
Inukjuak −1.00 * −0.40 * No change No change −1.2 ˆ
Umiujaq −0.94 −0.29 * No change No change −1.50 *
Kuujjuarapik −1.00 *** −0.03 No change No change −1.04 **
Sanikiluaq −2.65 −0.54 No change No change −3.19 ˆ
La Grande Riviere −0.86 *** +0.04 No change +0.19 ˆ −0.47 ˆ
James Bay Wemindji N/A N/A N/A N/A N/A
Moosonee −0.17 * No change No change No change −0.45 **
3.3. Reduced and Low Visibilities
Reduced visibility (≤0.8 km) trends at each location were presented in Figure S3 and low visibility
(≤0.4 km) trends were presented in Figure S4. Arviat experienced the highest percentage of reduced
and low visibility during the study period (Table 5). While the Arviat airport was operating, there was
a 10% likelihood that the visibility was below 0.8 km and 5.3% likelihood that the visibility was below
0.4 km. Western Hudson Bay experienced a higher likelihood of the airport encountering reduced
visibility (3.3% to 10.0%) and low visibility (1.7% to 5.3%) than Eastern Hudson Bay (2.0% to 3.8% and
0.9% to 2.4% respectively). James Bay region had the least likelihood of encountering reduced visibility
(0.6% to 1.9%) and low visibility (0.2% to 0.9%).
Table 5. Historical percentage of the reduced and low visibilities during study airports’
operational hours.
Region Location Reduced Visibility (≤0.8 km) Low Visibility (≤0.4 km)
Baker Lake 5.1% 3.3%
Chesterfield Inlet 6.7% 3.7%
Rankin Inlet 6.2% 2.2%
Western Hudson Bay
Whale Cove 4.2% 2.1%
Arviat 10.0% 5.3%
Churchill 3.3% 1.7%
Ivujivik 2.4% 1.6%
Akulivik 2.0% 0.9%
Puvirnituq 3.2% 1.5%
Eastern Hudson Bay Inukjuak 2.5% 1.3%
Umiujaq 3.8% 2.4%
Kuujjuarapik 3.1% 1.6%
Sanikiluaq 3.7% 1.7%
La Grande Riviere 1.9% 0.9%
James Bay Wemindji 0.7% 0.3%
Moosonee 0.6% 0.2%Atmosphere 2020, 11, 186 8 of 19
Baker Lake, Arviat, Churchill, Inukjuak and Moosonee had positive autocorrelation while Rankin
Inlet had negative autocorrelation for reduced visibility (Table 6). After adjusting for autocorrelation
to account for the impact on significance level, the frequency of encountering reduced visibility was
significantly decreasing (p < 0.05) at Baker Lake, Churchill, Kuujjuarapik, La Grande Riviere and
Moosonee while less significantly (p < 0.10) at Rankin Inlet. The overall decrease for sites with
significant change was approximately 2 to 6 h of reduced visibility per year. Significantly increasing
frequency of reduced visibility (p < 0.05) was found at Ivujivik, Akulivik, Puvirnituq, and Sanikiluaq
while less significantly (p < 0.10) at Arviat. Sites with significant increase experienced about 1.5 to 4
additional hours of reduced visibility conditions per year.
For the time series on the frequency of low visibility over time, Arviat, Churchill and Akulivik
had positive autocorrelation (Table 6). Adjusted for autocorrelation, low visibility conditions were less
significantly occurring at Baker Lake, Churchill, Kuujjuarapik, La Grande Riviere and Moosonee at
p < 0.05, and Whale Cove at p < 0.10. About 1 to 6 fewer hours per year of low visibility was observed
at these locations. Ivujivik was the only site with a significant increase in low visibility conditions at
p < 0.01 while Arviat and Puvirnituq also experienced more often low visibility at p < 0.10. These three
sites experienced about 1 to 4 additional hours of low visibility per year.
The top three causes for reduced visibility (≤0.8 km) and low visibility (≤0.4 km) at each of
the community are reported in Table 7. In western Hudson Bay, blowing snow (blizzard) was the
leading factor in northern communities while fog was the leading factor at Churchill, southernmost
community in this region. In eastern Hudson Bay, fog was the leading factor for reduced and low
visibility at Ivujivik, the northernmost community in this region, while blowing snow and rain were
the second and third most common factor. Three eastern Hudson Bay communities south of Ivujivik
share the same restricted visibility factors as those in western Hudson Bay. Starting from Sanikiluaq
and Umiujaq southwards, the leading factor became fog. Rain at Umiujaq was the second leading
factor, accounting for 24% to 25% for all hours with reduced and low visibilities. In the James Bay
region, rain accounted for 40% of reduced visibility and 59% of low visibility while fog accounted
for 50% and 64% respectively. At Moosonee, snow was the leading cause for reduced visibility (47%)
followed by fog (33%). However, fog was the leading cause for low visibility (62%) while snow only
accounted for 26%. Ice pellets was one of the top three leading cause in western Hudson Bay but not in
eastern Hudson Bay nor James Bay. Other factors such as haze from forest fires did not contribute to
severe restrictions on visibility except for a few hours during the entire study period.Atmosphere 2020, 11, 186 9 of 19
Table 6. Trends for change in number of reduced (≤0.8 km) and low (≤0.4 km) visibility hours with significance level before and after adjusted for autocorrelation.
Shaded cells indicated the presence of autocorrelation. Significance level: *** p < 0.001; ** p = < 0.01; * p < 0.05; ˆ p < 0.10.
Reduced Visibility (with Reduced Visibility (Adjusted for Low Visibility (with Low Visibility (Adjusted for
Region Location Autocorrelation) Autocorrelation) Autocorrelation) Autocorrelation)
(h/year) (h/year) (h/year) (h/year)
Baker Lake −6.29 *** −6.29 *** −6.13 *** −6.13 ***
Chesterfield Inlet +1.85 +1.85 −0.14 −0.14
Western Hudson Bay Rankin Inlet −1.73 −1.73 ˆ −0.30 −0.30
Whale Cove −0.46 −0.46 −1.20 ˆ −1.20 ˆ
Arviat +6.46 ** +6.46 ˆ +4.19 * +4.19 ˆ
Churchill −2.40 *** −2.40 *** −1.32 *** −1.32 ***
Ivujivik +2.08 * +2.08 * +2.20 ** +2.20 **
Akulivik +1.50 * +1.50 * +0.50 +0.50
Puvirnituq +4.30 * +4.30 * +1.46 ˆ +1.46 ˆ
Eastern Hudson Bay Inukjuak −3.05 −3.05 −1.42 −1.42
Umiujaq +2.53 +2.53 +1.50 +1.50
Kuujjuarapik −1.95 *** −1.95 *** −1.75 *** −1.75 ***
Sanikiluaq +2.56 *** +2.56 *** +0.57 +0.57
La Grande Riviere −2.57 *** −2.57 *** −1.57 *** −1.57 ***
James Bay
Wemindji +0.20 +0.20 +0.33 +0.33
Moosonee −2.44 *** −2.44 * −0.67 ** −0.67 **Atmosphere 2020, 11, 186 10 of 19
Table 7. Top three causes and their proportions for reduced and low visibilities at study airports. Total
percentages can exceed 100% as multiple weather events can be recorded within the same hour.
Region Location Reduced Visibility (≤ 0.8 km) Low Visibility (≤ 0.4 km)
1. Blowing snow (55%) 1. Blowing snow (60%)
Baker Lake 2. Fog (16%) 2. Fog, Snow and Ice pellets (each
3. Snow and Ice pellets (each tied at tied at 13%)
14%)
1. Blowing snow (46%) 1. Blowing snow (49%)
Chesterfield Inlet 2. Fog (31%) 2. Fog (32%)
3. Snow (14%) 3. Snow (10%)
1. Blowing snow (48%) 1. Blowing snow (51%)
Rankin Inlet 2. Fog (22%) 2. Fog (21%)
Western Hudson Bay 3. Ice pellets (16%) 3. Ice pellets (16%)
1. Blowing snow (43%) 1. Blowing snow (47%)
Whale Cove 2. Fog (23%) 2. Fog (23%)
3. Snow (16%) 3. Snow and Ice pellets (tied at 13%)
1. Blowing snow (39%) 1. Blowing snow (38%)
Arviat 2. Snow (30%) 2. Snow (30%)
3. Ice pellets (15%) 3. Ice pellets (14%)
1. Fog (45%) 1. Fog (50%)
Churchill 2. Blowing snow (37%) 2. Blowing snow (34%)
3. Ice pellets (9%) 3. Ice pellets (7%)
1. Fog (35%) 1. Fog (35%)
Ivujivik 2. Blowing snow (27%) 2. Blowing snow (26%)
3. Rain (21%) 3. Rain (22%)
1. Blowing snow (49%) 1. Blowing snow (58%)
Akulivik 2. Snow (31%) 2. Snow (28%)
3. Rain (17%) 3. Rain (13%)
1. Blowing snow (38%) 1. Blowing snow (38%)
Puvirnituq 2. Snow (30%) 2. Snow (28%)
3. Fog (26%) 3. Fog (26%)
1. Snow (34%) 1. Snow (32%)
Eastern Hudson Bay Inukjuak 2. Blowing snow (29%) 2. Blowing snow (30%)
3. Fog (27%) 3. Fog (29%)
1. Fog (38%) 1. Fog (39%)
Umiujaq 2. Rain (24%) 2. Rain (25%)
3. Snow (20%) 3. Blowing snow and Snow (tied at
18%)
1. Fog (36%) 1. Fog (40%)
Kuujjuarapik 2. Snow (26%) 2. Snow (23%)
3. Blowing snow (24%) 3. Blowing snow (23%)
1. Fog (45%) 1. Fog (48%)
Sanikiluaq 2. Blowing snow (29%) 2. Blowing snow (29%)
3. Snow (18%) 3. Snow (17%)
1. Rain (40%) 1. Rain (59%)
La Grande Riviere 2. Snow (33%) 2. Snow (19%)
3. Blowing snow (18%) 3. Blowing snow (12%)
1. Fog (50%) 1. Fog (64%)
James Bay Wemindji 2. Snow (26%) 2. Snow (13%)
3. Blowing snow (13%) 3. Blowing snow (12%)
1. Snow (47%) 1. Fog (62%)
Moosonee 2. Fog (33%) 2. Snow (26%)
3. Blowing snow (11%) 3. Blowing snow (11%)Atmosphere 2020, 11, 186 11 of 19
4. Discussion
4.1. Fog and Ice Fog
There was a strong signal for reduction of fog and ice fog in the Hudson Bay and James Bay
regions on seasonal and annual scales, with the greatest significant declines for fog on an annual scale
and ice fog in winter and annually (Tables 3 and 4). Reduction in fog was found as well in Hanesiak
and Wang [1], in which both studies shared Baker Lake and Churchill as one of the study sites and their
study period was from 1953 to 2004. They found fog was declining significantly (p < 0.05) at Baker
Lake on annual, spring, summer and fall. This finding slightly differed from the current work where
only fall had significant decline trends (Table 3). Hanesiak and Wang [1] also identified a significant
declining trend (p < 0.05) at Churchill in fall but we did not identify any trends on annual and seasonal
scales. They summarized that southeastern stations in the Arctic tended to show a decline in fog in
all seasons except fall while our study showed regional differences and geographic locations appear
to be a greater factor than seasons. Our study found that northern sites in western Hudson Bay had
significant declines (p < 0.05) in spring, fall while southern sites in this region either generally had no
change. In Eastern Hudson Bay, only two southern sites (Kuujjuarapik and Sanikiluaq) experienced
significant changes (p < 0.10) in fog hours. Kuujjuarapik experienced less in spring and summer
while Sanikiluaq experienced more in summer and fall. In the James Bay region, La Grande Riviere
experienced a decline in summer and fall, Wemindji had less fog in winter and summer, and Moosonee
had less fog in all seasons except fall. The difference between our study and Hanesiak and Wang [1]
could be explained by station selection, data period and how the data were handled. Our study used a
combination of 24 h and non-24 h stations while Hanesiak and Wang [1] only used two 24 h stations in
their study. Also, our study used an additional 10 years of data that were not available to Hanesiak
and Wang [1]. In addition, we used the raw observation count of fog by the airport observers while
their study transformed the raw observation through a data homogenization process.
A reduction in ice fog may be attributed to general warming in the region, and the lowering of the
frequency of liquid water droplet frozen to the surface or forming ice crystal in the air. A reduction
in fog may be caused by warmer temperatures since the vapour pressure of water increases at an
exponential rate for higher temperatures, relative humidity would be lower even if air temperature
and dew point temperature were raised at the same linear rate as a result of a warmer surface. This is
consistent with a study of northern Russia [38]. The results found that warmer air temperature was the
most important factor in the reduction of fog in the cold environment. However, Tjernström et al. [39]
documented a moist air mass moving northwards in the East Siberian Sea, causing dense fog to form
due to a temperature inversion at the surface, but their study cautioned that a single event might not
be applicable to all circumstances. The air mass pattern in the Hudson Bay region is trending towards
more southern, warm air masses and replacing northern, cold air masses [20]. The dynamics of air
mass is consistent with the decline in fog due to warmer air from the south which could contain more
water vapour in general than cold air from the north. However, as noted above, the air would be drier
(lower relative humidity) even if the dry bulb and dew point temperatures increased at the same rate.
Hudson Bay can also be a major source for advection fog or sea fog at any coastal community
during spring to fall when the Bay is not ice covered [1,40]. Advection fog is formed when warm air
from the south is cooled by wind blowing northward over cold Hudson Bay water while sea fog is
formed when cold Arctic air moves south and heated up by relatively warmer Hudson Bay water.
This observation was also made by meteorological station inspectors during their annual inspection
visit to Churchill in May 1972 [41]. They mentioned that the tide at the mouth of Churchill River
sometimes created open water, which led to fog patches over the airport. In addition, open water
in Hudson Bay can be formed after prolonged southerly winds and if the wind shifted northwards,
fog could result inland. Ye [38] suggested that future warming in northern Russia and Siberia would
result in less radiative fog but higher advective fog at locations near large bodies of water. However,
our study was not consistent with this suggestion as all communities experienced a decline in fogAtmosphere 2020, 11, 186 12 of 19
and ice fog. Even with polynya around Sanikiluaq [42], ice fog decreased significantly by 1 to 1.5 h
per year at Kuujjuarapik and Umiujaq (p < 0.05) and less significantly but still declining (p < 0.10) by
3.2 h per year at Sanikiluaq (Table 4). These three communities are closest to this polynya. Another
possibility is that the polynya provided open water and generated dense fog in these communities.
If Hudson Bay is completely frozen over, the ice blocks the heat and moisture exchange between water
and atmosphere. However, with a polynya, the open water allows evaporation and contributes to
fog formation if the wind direction blows into the communities. Both possibilities are equally likely
because the visibility formed by ice fog is highly variable [2]. This idea is also supported by Hanesiak
and Wang [1] as they found that fog in the Arctic was highly variable by seasons and by locations.
This evidence suggested that a combination of factors, including radiative and advective forces, are
affecting the formation frequency of fog in our study area.
The longer ice-free season in Hudson Bay due to earlier break-up and later freeze-up of sea ice [19]
should have provided a longer duration for fog formation in spring and fall due to advection from
the Bay [40], yet fog hours continued to drop significantly in these seasons in western Hudson Bay
in this study and in Hanesiak and Wang [1] at Baker Lake for all seasons and Churchill in winter,
spring and summer. This might suggest that the reduction in fog by lower relative humidity was
not fully offset by an increase in fog due to a longer ice-free period. The lack of significant trend for
winter in Hudson Bay was not unexpected as there was little moisture available while the Bay is ice
covered [40]. Between 1975 and 1985, these 24 h stations reported about three to four times the number
of ice fog than the average number before 1975. Ice fog trends appeared to be captured by both 24 h
stations as well as non-24 h stations as there were no noticeable trend differences between these types
of stations. Other than Wemindji that had almost no ice fog hours and Moosonee that had a limited
record ending in 1992, all of the remaining 14 stations had a declining trend in ice fog observation since
1995 (Figure S3). On an annual scale, 24 h stations experienced a change rate of −0.45 to −10.32 h of ice
fog per year while non-24 h stations experienced −0.57 to −4.25 h per year (Table 4). The lack of change
for ice fog across all stations in summer was likely due to summer surface temperature typically above
0o C in this region such that fog was classified instead of ice fog [21]. Fog is more nuanced because
most of the 24 h stations as well as some non-24 h stations which began records in the 1980s recorded
a dramatic increase in fog from 1980 to 1990 (Figure S2). The pattern was not as clearly observed at
stations which began records in the 1990s. On an annual scale, 24 h stations encountered a trend of
−1.21 to −8.71 fog hours per year while non-24 h stations encountered +1.29 to −6.34 fog hours per year
(Table 3). The magnitude of the decrease is understandably lower at non-24 h stations because they did
not observe weather at night and in the early morning such that ice fog occurring at these times would
not be recorded. They also observe less frequently and therefore had less opportunity to record fogs
and ice fogs. Since fog and ice fog were observed to be declining at both 24 h and non-24 h stations, it
follows that these events were occurring less frequently in daytime and nighttime. Trends for reduced
and low visibilities (Table 6) were equally impacted by this observation frequency issue.
This study found different regimes for fog, ice fog and reduced visibility percentages between
the eastern and western sides of Hudson Bay and James Bay. Some locations in western Hudson
Bay showed a decline for fog in spring and fall, eastern Hudson Bay had minimal significant trends
while James Bay had a significant decline in winter and summer. Ice fog trends also showed temporal
differences. Western Hudson Bay recorded significantly fewer ice fog hours in winter and spring.
Eastern Hudson Bay recorded a significant decline in spring and James Bay observed significantly
fewer ice fog hours only in winter. This is similar to the sea ice thickness asymmetry in Hudson Bay [15].
Further evidence of weather asymmetry was identified [43,44]. In this study, while Kuujjuarapik’s
expected long-term average frequency for encountering blowing snow from 1953 to 2004 in fall was
2.8%, Baker Lake and Churchill in western Hudson Bay region had a much higher frequency, at 10.9%
and 6.2% respectively. The average frequency for blowing snow in winter was 20.8% at Baker Lake,
11.4% at Churchill and 5.4% at Kuujjuarapik. The blowing snow frequency was less than 1% in spring
at the aforementioned locations. While Wang [43] found that there was more blowing snow in both fallAtmosphere 2020, 11, 186 13 of 19
and winter in western Hudson Bay than in eastern Hudson Bay, the reverse was true for fog in summer.
Kuujjuarapik had a long-term average of 16.2% for fog in summer, much greater than Baker Lake’s
3.8% and Churchill’s 8.7%. This evidence further shows that other weather patterns also exhibited
east-west asymmetry.
4.2. Visibility
In the three regions investigated, western Hudson Bay had the highest percentage of encountering
reduced and low visibilities during the airport’s operating hours while James Bay had the lowest
(Table 5). Low visibility at the airports in this region prevented flights from departing or landing. Thus,
frequency of low visibility conditions serves as a proxy for the operational capacity of the airports and
how often the airports could not operate due to poor weather. Therefore, flights into western Hudson
Bay airports were generally more likely to experience delays or cancellations due to visibility concerns
than eastern Hudson Bay or James Bay airports. There were mixed signals for reduced visibility and
low visibility trends within each region (Table 6).
Visibility studies in this region were scant [45] and mostly related to tourism in the Arctic region,
particularly in Scandinavia [27,46,47]. Poor visibility not only affects the safe operations of aircraft but
also the tourism sector. Denstadli and Jacobsen [47] described that having poor visibility diminished
the satisfaction of tourists. Our research suggests that fog hours per year would be largely unchanged
as the scales of the changes were minimal at these locations (Table 6). The visibility conditions were also
not in favour for tourists heading to Hudson Bay region. All of the communities except those in James
Bay had at least 2.0% of reduced visibility. This contrasted with Arctic tourist destinations in Norway
where six out of seven locations studied had improved visibility [46]. Each of those six Norwegian
locations had less than 1.4% of observation meeting the criteria for reduced visibility. Further south
of Hudson Bay, Hori et al. [48] interviewed the indigenous population near Moosonee on winter
roads usage. Their study participants described snowstorms and blizzards in the region to be weaker
and shorter in duration. Wendler and Shulski [49] examined Fairbanks, Alaska. They determined that
extreme cold days (below −40 ◦ C) were decreasing by 6 days over the last 100 years and extreme cold
days was associated with the formation of ice fog. These studies all point to a decline in hours with
ice fog, reduced visibility and low visibility.
Visibility trends appeared to be highly variable depending on the location (Table 6), yet significant
weather events that impede visibility were not investigated in studies for the marine shipping season
for communities around Hudson Bay in summer. Instead, their focuses were mostly on the sea ice
thickness, break-up and freeze-up dates which restrict the window for the shipping season [50,51].
One paper examined possible implications of weather on shipping in this area, but its scope was limited
to winds and waves [52] even though marine shipping is affected by fog and reduced visibility [53]
and would further narrow the window of the summer shipping season. Two communities (Baker Lake
and Churchill) in western Hudson Bay, one community (Kuujjuarapik) in eastern Hudson Bay and two
communities in James Bay (La Grande Riviere, Moosonee) experienced a significant decline (p < 0.05)
in the frequency of reduced visibility. However, three communities in the northern part of eastern
Hudson Bay (Ivujivik, Akulivik and Puvirnituq) and Sanikiluaq in southern part of eastern Hudson
Bay region experienced a significant increase (p < 0.05) in the frequency of reduced visibility. Similar
results could be seen for low visibility. Same communities that encountered reduced visibility less
often were also facing less low visibility. On the other hand, only Ivujivik in eastern Hudson Bay faced
a significantly higher (p < 0.01) frequency of low visibility. Despite being furthest south in all stations,
fog, snow and blowing snow in James Bay region were usually the top factors which caused reduced
and low visibility (Table 7). This finding was identical to the stations in Western and Eastern Hudson
Bay regions. Since fog and ice fog events were declining at most locations and yet the overall visibility
did not improve to the same degree, this hints at non-fog events were becoming more frequent and
offsetting some of the visibility improvements gained through less fog and ice fog.Atmosphere 2020, 11, 186 14 of 19
4.3. Uncertainties in Fog and Ice Fog Observation
The mandated change of fog and ice fog definitions plus the shift of reporting ice fog to freezing
fog in MANOBS in 1999 was required for Canada’s aviation meteorological observation to remain
consistent with other countries. This change that brought in freezing fog was due to ICAO’s desire for
due diligence [22]. The change lowered the number of observations for fog and ice fog after 1999 as the
surface horizontal visibility required for reporting either event was lowered from under 6 statute miles
(9.7 km) to under 0.5 statute miles (0.8 km), thus narrowing the range where fog and ice fog could be
reported by the human observer. It skewed the trends for both observations after 1999. However, the
impact from changes in MANOBS appeared to be less than anticipated.
Trends in fog appeared to be more affected by the change in MANOBS visibility requirements
than ice fog (Figure S2). After 1999, increase in fog hours were observed at two stations (Ivujivik and
Wemindji). No trends were observed after 1999 at three stations (Arviat, Churchill and Puvirnituq) and
no data were available at Moosonee due to lack of consistent data after 1992. Declining trends were
observed at ten stations (Akulivik, Baker Lake, Chesterfield Inlet, Inukjuak, Kuujjuarapik, La Grande
Riviere, Rankin Inlet, Sanikiluaq, Umiujaq and Whale Cove). Of these ten stations reporting declining
fog hour trends, only four locations (Akulivik, Chesterfield Inlet, Sanikiluaq and Umiujaq) appeared
to be affected by the change in MANOBS as the declining trend began after 1999. The other six
locations recorded declining fog hours before the change in MANOBS in 1999. Thus, declining fog
hours prior to 1999 is likely due to warmer temperatures that led to a decline in relative humidity [38]
while the decline after 1999 is likely due to both warmer temperatures (Table 2) and the change in
observation procedures.
For ice fog (Figure S3), Sanikiluaq appeared to have an increasing trend prior to 1999 and reversed
into a decreasing trend after 1999. Moosonee had no data available after 1992 and Wemindji had
no ice fog trend due to it being next southernmost location after Moosonee, which suggested that
the temperature was possibility too warm for ice fog to occur at Wemindji. The remaining locations
experienced less ice fog even before the MANOBS reporting requirements for ice fog changed in 1999.
Interestingly, under WMO Manual No. 306 published in 1995, freezing fog became a mandatory
reported observation whether or not ice accretion was occurring between 0 and −30.0 ◦ C while fog
was present due to safety concerns [22,23]. Yet there was no increase in ice/freezing fog observation
after 1999 despite the requirement for fog to be reported. This evidence suggested that the decreasing
observation for freezing fog due to warmer temperature was greater than the increase in freezing
fog reports by mandatory reporting requirements. Therefore, similar to the trends in fog hours,
the declining trends for ice fog prior to 1999 was due to warmer temperatures (Table 2) that led to
unfavourable conditions for the formation of ice fog. The continued decline of ice fog after 1999 was
due to warmer temperatures, and to a lesser extent, change in MANOBS and switchover from reporting
as ice fog to freezing fog.
4.4. Weather Monitoring
An external, non-climatic, factor was identified as a potential source for influencing fog observation
at Rankin Inlet. According to the weather station inspection report from 26 May, 1985 [54], an inspector
made the following comment:
“Visibility chart–although having been signed off by a previous inspector, the staff complained of
the lack of accurate markers on the chart. Using airport diagrams, topographic maps and much effort,
a vsby chart agreeable to the staff was prepared.”
Based on this information, it is very likely that the staff lacked the proper tools to assess visibility
accurately. The correction was made and as a result, the accuracy of visibility improved. Low visibility
appears to be more accurate because the distance is much closer (400 m) and less prone to deceive
observer’s eyes while distance further away may appear to be within the definition of reduced visibility
(800 m) but in fact could be over this threshold. Therefore, some of the significant declines for fog and
ice fog at Rankin Inlet could be attributed to inaccurate observation. Similar findings were mentionedAtmosphere 2020, 11, 186 15 of 19
in 24–28 November 19860 s station inspection report for Churchill [55]. The inspector noted that the
visibility chart had yet to be updated by the local office. This issue was noted in multiple subsequent
annual station inspection reports. The visibility chart was only updated some time before the next
inspection visit on 13 June 1989. At La Grande Riviere, inspection report on 23 September 1993 stated
that visibility chart was not completed and requested to draw a station visibility chart [56]. This was
resolved by the next inspection on 26 May 1995. At Moosonee, multiple inspectors over the course of
several years noted that high aircraft traffic volume at the airport negatively interfered with the weather
watch. The inspectors mentioned that the weather observers were also responsible for checking in
passengers, taking reservations over the phone, and loading and unloading freight from aircraft in
addition to monitoring changes in the weather [57]. At Chesterfield Inlet, in 1 October 19720 s report,
inspector mentioned that the northern half of the horizon was restricted by a ridge beyond one mile
(1.6 km) and that a new visibility chart was created because the inspector felt that more visibility
markers should be added [58]. Furthermore, in 15 November 19750 s inspection report, there were
questions about the accuracy of the reported visibility at Chesterfield Inlet [59]. The inspector wrote:
“It has been noted by other stations that ceilings and visibility were better at Chesterfield Inlet
than at nearby stations during periods of poor weather . . . Suspicions of this type are difficult to verify
unless there are complaints from aircraft. It is also apparent in northern settlements that Parkinson’s
law might be extended to include Ceilings and Visibility improve in direct proportion to the urgency
of the requirement of an in-bound aircraft.”
Fortunately, our sampling period at Chesterfield Inlet began in 1992 and not susceptible to
inaccuracy visibility observations made in 1975. It is unclear whether similar observation issues
were present at other stations, but the possibility for this as a source for error cannot be ruled out [1].
Another non-climatic factor for fog was documented by inspectors in May 1972. They noted that
during winter, the steam plant at Churchill injected enough moisture into the air to cause fog patches in
the community under the right wind and temperature conditions [41]. Hanesiak and Wang [1] noted
that visibility arose from fog and blowing snow and had an error rate of 10%. Nonetheless, with the
exception of Churchill, each of the community studied has very little industry and population due to
their remoteness, which allows them to be good study sites to monitoring fog frequency caused by
environmental change and anthropogenic climate change while minimizing other anthropogenic factors
such as air pollution from vehicle emissions, intense human activities and urban heat island [60–62].
4.5. Flight Safety
Any of the factors that cause low visibility impedes safe aircraft navigation during takeoff, landing,
and taxiing. Gultepe et al. [2] stated that ice fog posed a greater risk to aviation than snow because ice
fog could adhere to the surface of the aircraft better than snow in a cold environment. Less ice fog
would lead to less frequent ice build up on the wings and the fan blades of the engines. Accidents in
the US, particularly take-off overruns and crashes after takeoff, occur more often when the visibility
was below 0.3 km [63]. Pilots described that they had to taxi at one-half to one-third of the normal
speed under low visibility conditions and feared that they would not see obstacles such as other aircraft
or fuel trucks, which could lead to collision with vehicles and personnel in the ramp area [64]. Pilots are
also concerned that they could lose spatial awareness and taxied to wrong area under low visibility
conditions [65]. Low visibility requires greater separation distance between departing and arriving
aircraft. These safety precautions lead to flight delays or cancellations. Moreover, these weather
conditions are often the contributing factors that lead to emergency response and search and rescue
missions [66]. From these evidences, we conclude that fog and ice fog frequencies were decreasing
and that risks presented by these factors alone will be reduced under warmer conditions in the area
from climate change. Since ice fog was reported as freezing fog after 1999 [22], the declining trends for
freezing fog after 1999 were also partly attributable to warmer temperatures in this region. Except for
several important transfer points which operate their airports 24 h a day, the delays are unlikely to
cause capacity issues at the airports studied in our research due to the low volume of traffic theyAtmosphere 2020, 11, 186 16 of 19
receive. The overall visibility conditions in this region was rather nuanced. Some locations had fewer
hours of reduced visibility while other locations had more. Generally, hours with low visibility were
declining in this region. Blowing snow, snow, ice and fog remained as weather hazards to flying into
and out of these communities. These meteorological events can cause flight delays and cancellations
that lead to a backlog of cargo and passengers at the transfer airports until the weather improves.
5. Conclusions
Ice fog was declining rapidly by 1 to 10 h per year at the sixteen airports during the study period.
Fog was also declining mostly at western Hudson Bay and James Bay airports by 3 to 7 h per year. Both
of these trends appeared to be linked to warmer air temperature in the region caused by climate change.
James Bay airports had the lowest frequency in encountering reduced and low visibilities, followed by
eastern Hudson Bay. Western Hudson Bay airports had the greatest number of hours with reduced and
low visibilities while the airports were operating. There was no consistent trend for reduced visibility
as some locations experienced significantly more hours with reduced visibility while some locations
experienced significantly fewer. The trend was clearer for low visibility. Most locations had fewer
hours of low visibility. The leading causes for reduced and low visibilities were fog, blowing snow and
snow. Since fog and ice fog were declining, the risks presented by these factors would also decline.
However, non-fog weather factors such as blowing snow, snowfall, ice pellets and rainfall continued
to present risks during reduced and low visibility conditions which could affect both aircraft and
airport operations.
Supplementary Materials: The following are available online at http://www.mdpi.com/2073-4433/11/2/186/s1,
Figure S1: Number of fog hours per year; Figure S2: Number of ice fog hours per year; Figure S3: Time series
trend for reduced visibility; Figure S4: Time series trend for low visibility.
Author Contributions: A.C.W.L. conceptualized the experiment and methodology; A.C.W.L. and K.A.B. conducted
statistical analysis and visualization of the results; A.C.W.L. and W.A.G. prepared original draft, editing and
revision; W.A.G. acquired funding, resources and supervised the project. All authors have read and agree to the
published version of the manuscript.
Funding: This research was funded by NSERC, grant number RGPIN-2018-06801.
Acknowledgments: The authors would like to thank Lorne Baker from Prairie & Northern Operations and John
Macphee from Atmospheric Monitoring & Data Services Division in Environment and Climate Change Canada
for their information on ICAO and changes to MANOBS. The authors are grateful to Chris Kocot from Archive
and Data Services and Pascal Normand from National Monitoring Desk in Environment and Climate Change
Canada for their information on visibility measurements and procedures. A.L. would like to acknowledge Bushra
Zara Hossain and Tashi Lhamo in University of Toronto Scarborough for their assistance with the visibility dataset.
All authors are thankful to the two anonymous reviewers for their insightful comments and suggestions which
helped improve the manuscript.
Conflicts of Interest: The authors declare no conflict of interest.
References
1. Hanesiak, J.M.; Wang, X.L. Adverse-Weather Trends in the Canadian Arctic. J. Clim. 2005, 18, 3140–3156.
[CrossRef]
2. Gultepe, I.; Zhou, B.; Milbrandt, J.; Bott, A.; Li, Y.; Heymsfield, A.; Ferrier, B.; Ware, R.; Pavolonis, M.;
Kuhn, T.; et al. A review on ice fog measurements and modeling. Atmos. Res. 2015, 151, 2–19. [CrossRef]
3. Jenama, R.K.; Kumar, A. Bad weather and aircraft accidents-global vis-à-vis Indian scenario. Curr. Sci. 2013,
104, 316–325.
4. Aviation Investigation Report A11H0002; Transportation Safety Board of Canada: Gatineau, QC, Canada, 20
August 2011.
5. Weick, K.E. The Vulnerable System: An Analysis of the Tenerife Air Disaster. J. Manag. 1990, 16, 571–593.
[CrossRef]
6. Thornes, J.; Rennie, M.; Marsden, H.; Chapman, L. Climate Change Risk Assessment for the Transport Sector;
Department for Environment: Food and Rural Affairs (DEFRA): London, UK, 2012; Volume 6426, p. 139.You can also read