Recreational fishing in the Bay of Islands: intense pressure contributes to stress on fishstocks and to local ecological degradation John Booth ...
←
→
Page content transcription
If your browser does not render page correctly, please read the page content below
Recreational fishing in the Bay of Islands:
intense pressure contributes to stress on fishstocks
        and to local ecological degradation

                     John Booth
              A paper prepared for Fish Forever

                       December 2016

                                                   1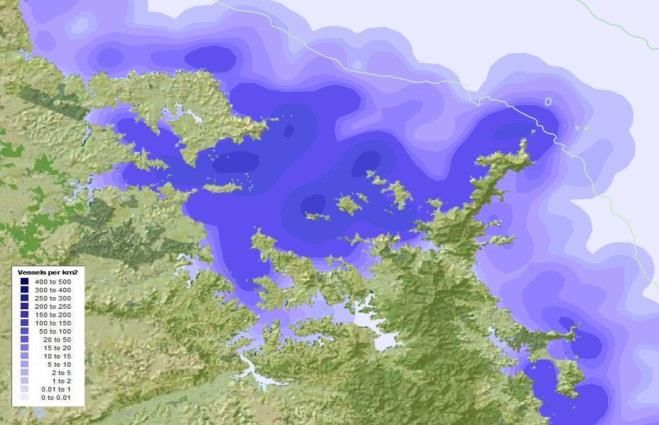
Recreational fishing in the Bay of Islands: intense pressure contributes
      to stress on fishstocks and to local ecological degradation

                                             John Booth

                   A paper prepared for Fish Forever, December 2016

Synthesis Bay of Islands contains probably the most extensive area of intensive recreational boat-
fishing in the whole of East Northland (North Cape to Cape Rodney), this fishing effort almost
certainly far exceeding that of the local commercial fleet. The principal fish recreationally sought and
caught in the Bay of Islands is snapper, followed by kahawai; the shellfish include red rock lobsters,
scallops, green-lipped mussels, cockles and pipi. For all species, the recreational harvest is
comparable with, or exceeds, the corresponding commercial catch where there is one. Because most
finfishes of recreational interest do not spend their entire lives in the Bay of Islands, the status of the
underlying stock is critical to the status of the respective Bay of Islands fish population; this also
applies to rock lobsters. The East Northland snapper substock of SNA 1 is overfished, and
recreational fishing in the Bay of Islands contributes significantly to this overfishing through the large
numbers of vessels going out to fish year round. The KAH 1 kahawai stock is not considered
overfished but, nevertheless, Bay of Islands recreational fishing contributes significantly to the
pressure on this stock. Although the CRA 1 red rock lobster stock is not considered overfished,
recreational fishing pressure is intense, with most lobsters taken in and near the Bay of Islands being
at or only a little above minimum legal size. Overfishing of keystone predators—especially large
snapper and large rock lobsters—has led to widespread loss of shallow-reef kelp in the Bay of
Islands, and consequential emergence of urchin barrens as extensive as those anywhere else in the
country.

1. Introduction

Sharing the ocean’s living resources, and issues around the social licence of fishers to extract more-
or-less willy-nilly, are topics of discussion in New Zealand at present, with a strong constituency
arguing that fishing pressure should be reduced, and that no-take areas be established. Fishing
pressure derives from commercial, recreational and customary users. The Bay of Islands has long
been known for its recreational fishing opportunities—not only for gamefish but also for other fishes
such as snapper and kahawai, as well as dive-quarry like rock lobsters and scallops. Also, the Bay of
Islands was one of the most significant commercial fishing ports of the country (see annual Reports
on Fisheries, published by the Marine Department from the late 1800s on), and, at its peak in the
1980s, it supported something like 170 commercial vessels (King 1985). And customary harvesting
has been—and remains—locally important, especially in remote coastal communities such as
Rawhiti.

Harvest pressure on fish stocks in northeast New Zealand—including the Bay of Islands—has been so
intense as to have had catastrophic impact on marine ecosystems—particularly the shallow-reef kelp
communities which in many places have been overgrazed by sea urchins (Booth 2015). Whereas the
reason for the emergence of ‘urchin/kina barrens’ in northern New Zealand was for a time contested,
there is now consensus that these barrens are a direct result of the overharvesting of keystone
predators (species whose impact on the ecosystem is disproportionately large relative to their
abundance) such as large snapper and large red rock lobsters. In a process which started to become
obvious in the 1970s, much of the shallow-reef kelp forests of the Bay of Islands (and elsewhere in
Northland) has disappeared (Booth 2015); it is no coincidence that this corresponded with the era
when highly mechanised commercial fishing pressure grew rapidly, leading to significant reductions
in both the proportion of large fish, as well as in individual-fish mean size.

                                                                                                         2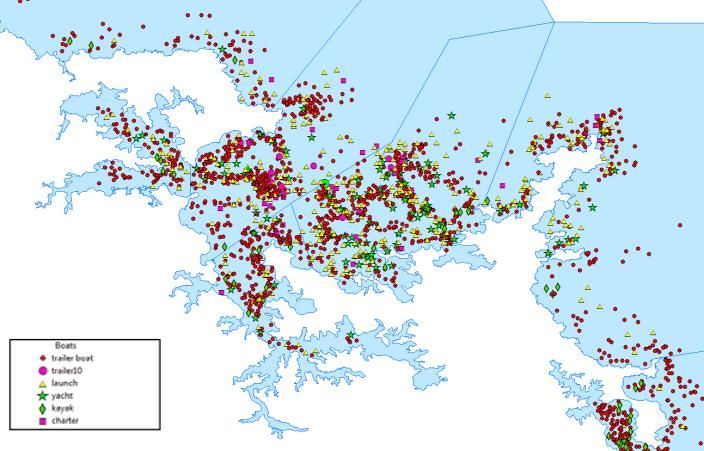
Recreational-fishing catch and effort data are notoriously difficult to pin down—particularly where, as
in New Zealand, no licence is required in order to fish. Accordingly, it has taken much longer to gain
a credible handle on the levels of recreational harvests than those of the commercial fishery. Most
fishery data—commercial and recreational—are reported by species according to a 1 October-30
September fishing-year and enormous Fishery Management Areas (FMAs) or Quota Management
Areas (QMAs); General Statistical Area 003 takes in the Bay of Islands (see Appendix 1). Recent
reports particularly useful in estimating recreational catches and effort for the Bay of Islands, a
subarea of FMA 1/QMA 1, include Hartill et al. (2007, 2013, 2015), Muller (2013), Armiger et al.
(2014), Holdsworth (2014), Wynne-Jones et al. (2014), Hartill & Davey (2015), and Hartill & Bian
(2016).

The purpose of this report is to summarise what is known about the catch, effort and individual-fish
mean size associated with Bay of Islands’ marine recreational fisheries. Such information, together
with that for the commercial and customary sectors, is important when considering where no-take
marine refuges might be placed, and in establishing where responsibility might settle when
considering the reasons for ongoing loss of shallow-reef kelp to sea-urchin overgrazing. Accordingly,
in this paper 1) first I summarise the overall Bay of Islands marine fishery, from first human
settlement to the present; 2) then I summarise recent recreational harvests for the Bay of Islands; 3) I
focus in some detail on the fishery biology and catch characteristics of the two main finfish species
(snapper Pagrus auratus, and kahawai Arripis trutta) and the main shellfish species (red rock lobster
Jasus edwardsii, scallop Pecten novaezelandiae, green-lipped mussel Perna canaliculus, cockle
Austrovenus stutchburyi, and pipi Paphies australis) harvested in the Bay of Islands by recreational
fishers, and the status of their respective fish stocks; and, finally, 4) I talk about the role of
overfishing, including the intense recreational fishing, in the loss of shallow-reef kelp in the Bay of
Islands.

2   Fishing history of the Bay of Islands from first human settlement

In early times, all fishing pressure in the Bay of Islands was, of course, customary; and then for a
good portion of the 20th century, commercial fishing trumped all others. Today, most harvest pressure
in the Bay of Islands almost certainly results from recreational fishing, seen, for example, in the high
numbers of boats, and in the estimated recreational harvests being similar to or exceeding those
commercial.

Even though the human population of the Bay of Islands may have been as great as 10 000 at the time
of James Cook’s arrival in 1769 (about half the total human population resident on its shores today;
http://profile.idnz.co.nz/far-north), midden analyses point to there having been no enduring impacts
on fish and shellfish stocks by pre-Contact fishing pressure—apart from local extirpation of the Cook
Strait limpet Cellana denticulata soon after the first East Polynesian settlement, in about 1300 (Booth
2016b). The first commercial fisheries in the Bay of Islands, from the mid- to late-1800s, were for
rock oysters and grey mullet (Booth 2016a), again without any known long-term consequences of
concern. The Marine Department annual Reports on Fisheries show how set-netters and liners then
came to dominate the commercial fleet, with a total of 30-60 vessels fishing the Bay of Islands and its
immediate environs during the 1920s and 1930s. For Northland generally, sail and row boats were
overtaken with a progression of more efficient commercial methods: beam trawls from about 1899;
long lines from about 1912; Danish seiners from about 1923; and pair trawling during the 1970s to
1980s (Parsons et al. 2009). And after the war, rock lobster vessels joined the fishing fleet. At its
peak, there were, all up, around 170 commercial vessels working out of the Bay of Islands (King
1985).

For the commercial landings, the published data from 1931 to the present show the following for the
Bay of Islands (Francis & Paul 2013; Booth 2016a).

                                                                                                       3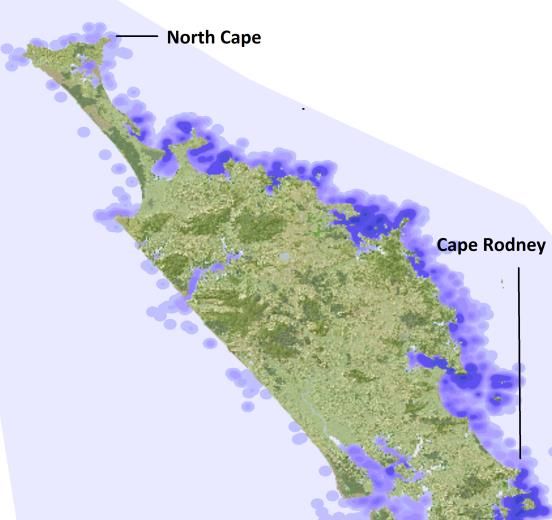
Up until the late 1970s, the mainstay species in terms of weight—albeit with modest annual
landings (up to about 100 t of each species)—were flounder, grey mullet, hapuku and
snapper;
Leading up to the management changes of the 1980s, annual snapper landings briefly
exceeded 1000 t;
Parore and yelloweyed mullet put on a bit of a show soon after World War II, the latter
netted in large quantities (up to 60 t a year) near Opua in particular;
Pelagic species such as blue and jack mackerel and skipjack tuna were first fished in the
1980s, after which large catches (thousands of tonnes) were being made in open waters just
outside the Bay;
The only invertebrate of significance has been the red rock lobster, fished to any extent only
since World War II, with recent local harvests averaging about 10 t a year.
In recent times only a handful of local commercial fishers have routinely worked the waters of the
Bay of Islands (Booth 2013), most boats < 7-m long. Their main finfish by weight have included
flounder, garfish (piper), grey mullet, kahawai, pilchard, snapper and trevally—totalling a few dozen
tonnes across the board each year, caught using mainly set nets and beach seines. The main
invertebrates taken within and near the Bay of Islands are potted or dived-for—particularly rock
lobsters, but also some kina. There is no commercial harvesting of scallops or other shellfish.
However, from time to time visiting vessels line, net and trawl for such fish as snapper, trevally,
flatfish and grey mullet within the Bay of Islands, and purse-seine pelagic species like skipjack tuna,
pilchards and mackerels near the mouth of the bay. The annual scale of these catches—apart from
those purse-seined—are probably modest (Booth 2013).
The recreational fishing opportunities of the Bay of Islands became internationally known early in the
1900s, largely as a result of the Department of Tourist and Health Resorts’ marketing of a
‘sportsman’s paradise’, and the visits and writings of Zane Grey (Warne 2010). During the latter
decades of the 20th century, in particular, Bay of Islands became a recreational mecca, fished by a
growing local fleet that was soon to be pipped by the great summer influx of visiting vessels, many
from Auckland. Bay of Islands is now arguably the most intensively recreationally-fished part of east
Northland (Hartill et al. 2007).
Annual customary harvests for the Bay of Islands in recent times are unlikely to have exceeded 10 t
across all species. But there is every chance the recreational catch estimates themselves include a
portion of the catch representing the customary take (Plenary 2015), as not all customary harvesting is
undertaken with permits issued under customary regulations.
3. Recreational harvests of the Bay of Islands
Recreational fishing can be undertaken all year round throughout the Bay of Islands, apart from the
exclusions shown in Figure 1.
Figure 1. Area prohibitions that apply to
recreational fishing in the Bay of Islands. Red,
where set netting is totally prohibited (circles
have 1-nautical mile radius); pink, where set
netting is prohibited 1 October to 30 April,
except for use of grey mullet and flatfish nets.
The black-hatched area is Te Puna Mataitai,
where there is customary and recreational
fishing only, but no special rules for fishers have
yet been instituted.
4
3.1 Species most sought and caught

               Snapper are the most-sought and most-caught finfish in the Bay of Islands, followed by kahawai
               (Hartill et al. 2015; Figure 2). Others of particular interest include john dory, kingfish, red gurnard,
               tarakihi and trevally (Muller 2013; Hartill et al. 2013, 2015; Holdsworth 2014). Among the
               invertebrates, red rock lobsters, scallops, green mussels, and cockles and pipi are the principal species
               on account of they being popular, as well as they being landed in significant numbers and/or weight.

                                   Waitangi Ramp av.                             Figure 2. Average annual recreational harvest of
                                   annual harvest (t)                               the two main finfish (snapper and kahawai)
                                                                                  landed over the Waitangi Ramp, 2011-14 (data
                                   30                                               from Hartill et al. 2015, who also give error
                     Harvest (t)

                                                                                    estimates). Waitangi landings are thought to
                                   20
                                                                                     reflect those of other ramps, and of shore-
                                                                                            fishing, in the Bay of Islands.
                                   10

                                    0
                                         Snapper Kahawai

               The recreational catches of snapper and kahawai in the Bay of Islands are significant relative to the
               commercial catch there; and in turn the estimated recreational harvests from Bay of Islands are
               significant constituents of the East Northland (North Cape to Cape Rodney) landings (Figure 3), even
               though the Bay makes up only about 10% of that coastline. For East Northland as a whole, estimated
               recreational harvests of snapper are highly significant, in some years almost equalling the commercial
               landings; for kahawai they usually far exceed the commercial harvest.

                                                   ENLD                                250                  ENLD
              1800
              1600
                                                                                       200
              1400
                                                                         Harvest (t)
Harvest (t)

              1200                                                                     150
              1000
               800                                                                     100
               600                 BoI                                                       BoI
               400                                                                     50
               200
                 0                                                                      0

                  Figure 3. Estimated recent commercial (red) and recreational (blue) harvests of snapper (left) and
                 kahawai (right) in the Bay of Islands (Bay of Islands) compared with those of East Northland (ENLD,
                  North Cape to Cape Rodney) (see Table 3). (There were no known commercial harvests of kahawai
                                                  within the Bay of Islands in 2011/12.)

               Among the shellfish, only lobsters are fished commercially in and near the Bay of Islands. Again, the
               recreational catch of rock lobsters in the Bay of Islands is high relative to the commercial catch; and
               in turn the Bay of Islands recreational harvest is a significant constituent of the East Northland
               landings (Figure 4).

                                                                                                                               5
35
              30
                                           ENLD                              Figure 4. Estimated recent commercial (red)
                                                                              and recreational (blue) catches of red rock
Harvest (t)

              25
                                                                            lobsters in the Bay of Islands (BoI) compared
              20      BoI                                                  with those of East Northland (ENLD), 2011-12
              15                                                           (see Table 3). No bar means no data available.
              10                                                           Bay of Islands makes up only about 10% of the
               5                                                                     coastline of East Northland.
               0

                           3.2 Fishing effort hotspots

                   Bay of Islands contains among the most extensive area of intensive recreational boat-fishing in the
                   whole of East Northland, this fishing effort almost certainly far exceeding that of the local
                   commercial fleet for most species. There are hotspots (>100 vessels per square kilometre, annualised)
                   of recreational boat-fishing north and southeast of Moturoa Island, near the Nine Pin and Whale Rock,
                   and north of Motuarohia Island (Figures 5 and 6).

                      Figure 5. Distribution of stationary vessels recreationally fishing (vessels per square kilometre), 1
                   December 2004 to 30 November 2005, North Cape to Cape Rodney (Hartill et al. 2007, downloaded from
                     NABIS [www.nabis.govt.nz/Map.aspx]). For the Bay of Islands, the areas with most-intense fishing
                                           activity (dark blue) contain 100-150 vessels per sq. km.

                                                                                                                          6
Figure 6. Distribution of stationary vessels recreationally fishing, 1 April 2011 to 31 March 2012 (Bruce
                                       Hartill, NIWA, pers. comm.).

A subsequent study of recreational harvests, in 2013-14, was entirely consistent with these: Bay of
Islands (Sections 4 and 5 in Figure 7) had nominally the greatest boat-fishing effort, followed by the
Whangarei area.

                                                                  4000

                                                                  3000           BoI
                                                         Number

                                                                  2000

                                                                  1000

                                                                    0
                                                                         1 2 3 4 5 6 7 8
                                                                             Section

  Figure 7. Sections of Holdsworth’s (2014) survey area (left), and nominal numbers of fishing vessels,
                           2013-14 (right, with Bay of Islands sections boxed).

Rock lobsters are sought in outer, more exposed parts of the Bay of Islands. For scallops, over the past
10 years the principal beds in the Bay of Islands have been in the east (Ipipiri), with other scallop beds
seemingly small and diffuse. In Ipipiri the main beds are 1) Albert Channel between Urupukapuka
Island and the Rawhiti mainland (including Urupukapuka Bay); 2) the area between Paramena Reef,
Poroporo Island and Ngatokaparangi Islands/reefs to the south of Motukiekie; and 3) Motukiekie
Channel between Urupukapuka and Motukiekie Islands (Pacific Eco-logic Ltd. 2016) (Figure 8). The
green-lipped mussel is harvested in open parts of the Bay of Islands, the foremost location probably
still being the Black Rocks. In contrast, cockles and pipi are hand-gathered widely in estuaries and
sheltered inner embayments (Figure 8).

                                                          Figure 8. Main shellfish-harvesting areas. Blue
                                                          numerals refer to the scallop grounds referred
                                                                          to in the text.

                                                                                                             7
3.3 Time series of effort and harvests

For finfish, the relative recreational fishing effort in the Bay of Islands, based on comings and goings
of boats at the Waitangi Ramp, has remained steady over nearly 10 years (Figure 9), as did snapper
harvest rates during 2011-14 (Figure 10). On the other hand, kahawai boat-harvests fell significantly
in 2013-14, to 0.75 kg (Figure 10).
                               Boats (‘000)

  Figure 9: Indices of recreational effort (number of boats returning to ramp ± SE), based on imagery
taken at Waitangi Ramp and a subsample of 60 days per fishing year, for the period 2004–05 to 2013–14
             (Hartill et al. 2015). Black curve, total; red curve, summer; blue curve, winter.

                        Boat numbers                         Proportion of boats                        Av. snapper
               10000                                           1     (%)                              harvest/boat (kg)
                                                                                               5
                      8000                                   0.8
                                                Percentage

                                                                                   Harvest (kg)
    Numbers

                                                                                               4
                      6000                                   0.6                               3
                      4000                                   0.4                               2
                      2000                                   0.2                               1
                           0                                     0                             0

              Annual snapper ramp                               Av. kahawai                           Annual kahawai
               30
                  harvest (t)                                2harvest/boat (kg)              10       ramp harvest (t)
                                              Harvest (kg)

                                                                                   Harvest (t)
        Harvest (t)

                                                         1.5
                      20
                                                             1                                    5
                      10
                                                         0.5
                       0                                     0                                    0

 Figure 10. Annual estimates of numbers of boats using Waitangi Ramp (based on web camera counts);
  the proportion of observed boats that were being used for fishing; the average weight of snapper and
kahawai harvested per boat; and the estimated annual snapper and kahawai harvests landed at the ramp
                       (Hartill et al. 2015, who also gave associated error values).

In 2013-14, east-Northland catch rates of kahawai greatly exceeded those of trevally, and, in turn, red
gurnard (no data were provided for snapper); Bay of Islands rates were averge or above average for
kahawai and trevally, but below average for red gurnard (Figure 11).

                                                                                                                          8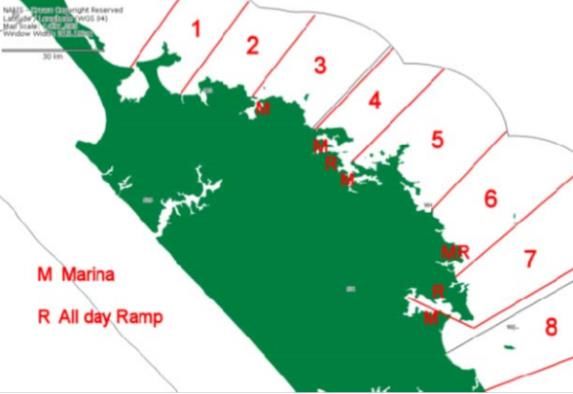
4                                         Kahawai

                                                      Average harvest
                                                                                                                  Trevally
                                                                        3                                         Gurnard
                                                                                                                  Boats
                                                                        2

                                                                        1

                                                                        0
                                                                                  1       2       3       4   5    6    7      8
                                                                                                       Section

 Figure 11. Sections of Holdsworth’s (2014) survey area (left), and average catch-rates (kg) for finfish by
 section, 2013-14 (right, with Bay of Islands sections boxed). (Nominal boat numbers are shown as x10-1.)

For FMA 1 invertebrates during 2011-12, Wynne-Jones et al. (2014) listed 17 individual and groups
of species harvested recreationally (Table 1, which gives a sense of relative scale of harvests of all
five of the Bay of Islands invertebrates because the Bay makes up perhaps 5% of the total FMA 1
coastline).

                                                                                  Table 1. Estimates of non-finfish species
                                                                                harvests (numbers of individuals) in FMA 1
                                                                                 (North Cape to Cape Runaway), 2011-12
                                                                                         (Wynne-Jones et al. 2014).

Unlike for finfish, there are no estimates of red rock lobster recreational harvests over time for the
Bay of Islands. However, for East Northland (in this case, Rangiputa to Mangawhai Heads—Figure
12) during 2013-14, recreational fishers were estimated to have landed 25.4 t, the highest average
catch rates being between the Bay of Islands and Whangarei (Sections 5 and 6) (Figure 12, Table 3)
(Holdsworth 2014). The Bay of Islands rock lobster catch rates were above average. (Part of the Bay
of Islands recreational harvest was an estimated 1709 lobsters, or about 1.25 t, taken in Te Puna
Mataitai over the last seven months of 2013-14.)

                                                    0.5
                                                                                          Rock lobster             Boats
                                                    0.4
                                                    0.3
                                                    0.2
                                                    0.1
                                                     0
                                                                            1         2       3       4       5    6       7   8
                                                                                                      Section

   Figure 12. Sections of Holdsworth’s (2014) survey area (left), and average catch-rates (kg) for rock
   lobsters by section (right, with Bay of Islands boxed). (Nominal boat numbers are shown as x10 -2.)

                                                                                                                                   9
Green-lipped mussel stocks in the Bay of Islands have declined markedly over the past 10 years. In
the eastern part, overharvesting of intertidal beds was followed by increasing focus on subtidal beds,
only a few of which are known to survive today, most of these on the west side of the Cape Brett
Peninsula (Pacific Eco-logic Ltd. 2016). At the Black Rocks, in the northwest Bay of Islands, there
are various levels of depletion among some dense intertidal and subtidal beds.

For cockles and pipi, the important sheltered-water shellfish-gathering bays of the Bay of Islands
include Te Haumi, Parekura and Whiorau (Figure 8); harvest rates are unknown. For Te Haumi,
surveys showed a significant decline in the numbers of cockles ≥ 30-mm length during the late 1990s,
but fairly constant stocks through until the most recent survey, in 2014/15; the pattern was similar for
pipi ≥ 50-mm long (Berkenbusch & Neubauer 2015).

4. Characterising stocks underpinning the Bay of Islands recreational fishery

None of the main recreational finfish species in the Bay of Islands (nor the red rock lobster) is
confined there throughout their entire lives. Because of general mixing during their life-histories, the
status of Bay of Islands’ main recreational fisheries ultimately depend on that of the QMA stock.

All exploited coastal fish species have declined dramatically in abundance since colonisation using
every acceptable measure, many species now being well below their optimal stock size (Francis 2003;
Plenary 2015). In northern New Zealand, many predatory finfish species (as well as the red rock
lobster) had by the mid-1980s declined in biomass to less than one quarter of their virgin state.
Despite advances in fishery modelling, and a lot more research, there is no information on, or there
still remains considerable uncertainty around, the status of all but a couple of the main
stocks/substocks underpinning the fisheries of the Bay of Islands (Table 2)—and there is evidence of
overfishing. (Overfishing is deemed to be taking place if FMSY [the maximum fishing pressure that can
be applied constantly without impairing the stock’s renewability through natural growth and
reproduction], or its proxy, is exceeded, on average.)

Table 2. Stock status of selected fish of recreational importance in the Bay of Islands, and of rock lobsters
(Plenary 2015). (None of the other invertebrates recreationally important in the Bay of Islands are part of
a formal stock assessment.) Fishstock, the stock or substock applying to the Bay of Islands; BMSY, the
average biomass associated with a maximum sustainable yield strategy; B0, the biomass of the unfished
stock; SSB0, the biomass of the unfished spawning stock; AW (1979-88), mean of beginning autumn-
winter vulnerable biomass for the period 1979-88. The terms used in relation to targets and limits are as
given in Plenary (2015). The target and limits for KIN 1 (East Northland) are based on those for KIN 1
(Bay of Plenty); TRE 1 are based on TRE 7.

Fishstock     Species    Last     Target      At or         Soft    Below the soft   Hard    Below the       Overfishing?
                         assess               above         limit   limit?           limit   hard limit?
                                              target?
GUR 1E        Red        2013     BMSY        Unclear       50%     Unlikely         25%     Very unlikely   Unknown
              gurnard                                       BMSY                     BMSY
KAH 1         Kahawai    2015     52% B0      Very likely   20%     Very unlikely    10%     Exceptionally   Very unlikely
                                                            B0                       B0      unlikely
KIN 1 (East   Kingfish   -        F40%        Unknown       20%     Unknown          10%     Unknown         Unknown
Northland)                                                  B0                       B0
SNA 1 (East   Snapper    2013     40% B0      Very          20%     Unclear          10%     Very unlikely   Likely
Northland)                                    unlikely      B0                       B0
TAR 1         Tarakihi   2012     BMSY        Unknown       20%     Unknown          10%     Unknown         Unknown
                                                            B0                       B0
TRE 1         Trevally   ?        40% SSB0    Unknown       20%     Unknown          10%     Unknown         Unknown
                                                            SSB0                     SSB0
CRA 1         Rock       2015     AW          Virtually     20%     Exceptionally    10%     Exceptionally   Exceptionally
              lobster             (1979-88)   certain       SSB0    unlikely         SSB0    unlikely        unlikely

                                                                                                                      10
4.1 Snapper: East Northland Substock of SNA 1 (North Cape to Cape Rodney)
4.1.1 Essential biology
Snapper are both abundant and widespread in Northland, most at depths of 15-60 m. Sexual maturity
is achieved at an age of 3-4 years and a length of 20-28 cm; snapper may live up to 60 years or more
(Plenary 2015).
There is little mixing between East Northland and the other two SNA 1 substocks (Hauraki Gulf and
Bay of Plenty) (Plenary 2015). There are no reported alongshore migrations, but there is seasonal
mixing within substocks once juveniles have dispersed from shallow nursery habitats (Plenary 2015).
Even so, there is anecdotal evidence for areas within East Northland having greater-than-average
proportions of large fish (suggesting stock mixing is gradual and/or incomplete), as well as for
localised depletions.
4.1.2 Harvest history and stock assessment
Snapper have always been an important harvest in the Bay of Islands, and in Statistical Area 003
generally (see Appendix 1). Harvest data, and Total Allowable Catch (TAC) allocations, are given in
Table 3.
The SNA 1 substock underpinning Bay of Islands snapper, East Northland, experienced a long, steep
decline, from 3500 t in 1970 to about a quarter of that by 1985, and has fluctuated without trend since
(Figures 13 and 14).
Figure 13. Commercial catch history by
method for East Northland (Plenary
2015). BT, bottom trawl; PBT, bottom
pair trawl; DS, Danish seine; BLL,
bottom long-line.
The East Northland Substock is overfished: the 2013 biomass was estimated to be only 24% of the
unfished state (Figure 14), compared with the target of 40% (Plenary 2015). Although five-year
projections pointed to increasing stock biomass, current catches were nevertheless considered likely to
lead to continued overfishing (MPI 2013).
Figure 14. East Northland snapper spawning stock biomass (SSB) trajectory (t) as percentage of B0
(virgin biomass). Dotted lines indicate the target (40% B0), soft limit (20% B0) and hard limit (10% B0)
(Plenary 2015).
114.1.3 Fish size
The mean size of snapper from early northern middens was around 50 cm (Figure 15), yet most fish
harvested recreationally from the East Northland substock (and SNA 1) in recent years have not been
much larger than 30 cm (the recreational MLS), with only small proportions of large fish (Figure 15;
Appendix 2) (Walsh et al. 2011, 2014), demonstrating a greatly fished-down stock. (Bay of Islands’
recreational snapper sizes closely approximate those for East Northland [Bruce Hartill, NIWA, pers.
comm.], even after the likely high-grading). Although there is evidence from the East Northland long-
line catch of a slight increase in mean age in recent times, most of the fish landed are younger than 10
years, and the proportion of fish older than 20 years is small (Plenary 2015).
Figure 15. Length-frequency distribution (mm fork length) of snapper from a pre-Contact archaeological
site at Houhoura, 100 km northwest of the Bay of Islands (Leach 2006) (left). Length-frequency
distribution (cm fork length) of snapper recreationally harvested in the East Northland substock of SNA
1 in 2011-12 (Hartill & Davey 2015; see also Appendix 2) (right). Arrows indicate 30-cm length MLS.
4.1.4 Wrapping up for snapper
Most of this discussion has been for East Northland, but, because of stock mixing, it applies to the
Bay of Islands too. Snapper are overfished in the Bay of Islands, most of the local pressure today
coming from recreational effort which has, anecdotally, led to areas of local depletion.
4.2 Kahawai: KAH 1 (North Cape to Cape Runaway)
4.2.1 Essential biology
Kahawai, a coastal-schooling pelagic fish, is widespread and abundant in Northland. Sexual maturity
is achieved at an age of 3-5 years and a length of 35-40 cm; kahawai may live up to 26 years or more
(Plenary 2015).
Northland kahawai are assumed to be part of a northern stock (the other stock being focussed at the
northern tip of the South Island) (Plenary 2015; Hartill & Bian 2016). Tagging suggests most kahawai
remain in any one general area for several years. Recreational fishers typically land a wider size-range
of kahawai, from a far greater number of geographically dispersed schools, than does the commercial
fishery (Armiger et al. 2014).
4.2.2 Harvest history and stock assessment
Harvest data, and TAC allocations, are given in Table 3. The KAH 1 stock was gradually fished down
until the late 1970s, followed by a steeper decline coinciding with the development of the purse seine
fishery during the 1980s (Figures 16 and 17). There have been marked fluctuations in stock size since
the early 2000s, with evidence of rebuild (Plenary 2015): only recently have landings become
12constrained by the TACC (total allowable commercial catch) (Figure 16), probably a result, at least in
part, of the halving of commercial landings over the past 10-15 years (Armiger et al. 2014). The KAH
1 stock is, therefore, not considered overfished, and is very likely to be above the reference target of
52% B0 (Figure 17; Plenary 2015), with high probability of this continuing into the near future (Hartill
& Bian 2016).
Figure 16. Commercial landings (t) and total allowable commercial catch (black line) for KAH 1 (Plenary
2015).
Figure 17. KAH 1 spawning stock biomass (SSB), with projection, relative to B0 (virgin biomass). The
52% B0 target set by the Minister of Fisheries in 2010 is denoted by a black dashed line and the 20% B0
soft limit is denoted by the grey dashed line (Plenary 2015).
4.2.3 Fish size
The median size of kahawai recently caught recreationally in East Northland is around 40 cm, but the
length-frequencies show strong bimodality (Figure 18) attributed to influxes of larger, older fish
(Hartill et al. 2013). (Other size-data for kahawai are given in Appendix 3.) No length-frequencies of
an unfished/lightly fished northern population were located to provide a comparison, but in an
archaeological site at Foxton, towards the south of the North Island, most kahawai were 45-60 cm and
longer (Figure 18). The suggestion is that the wide size-range of fish presently being caught
recreationally in East Northland aligns with a relatively lightly fished resource.
13Figure 18. Length-frequency of kahawai from pre-Contact middens at Foxton (sample size 114; Davidson
et al. 2000) (left). Length-frequency of kahawai from the 2011-12 East Northland recreational catch
(Hartill & Davey 2015) (right). There is no size limit for kahawai.
4.2.4 Wrapping up for kahawai
Despite a widely held belief that kahawai are presently overfished, the numbers and concentrations of
schooling fish having diminished greatly from even 20 years ago, the fish-size distribution of the
recreational harvest, as well as the stock assessment referred to above, suggest otherwise for KAH 1
East Northland. Seabirds working fish boil-ups are more apparent than the fish themselves, and it may
be that declines in seabird numbers is at least part of the reason for the apparent discrepancy.
4.3 Rock lobster: CRA 1
4.3.1 Essential biology
The red rock lobster is a keystone predator of the shallow reefs of East Northland even though it
mainly lives much deeper, at 20-60 m. Sexual maturity in East Northland is achieved at an age of
around 4 years by males and 6 years by females, and tail widths of about 48- and 55-mm respectively.
Red rock lobsters have a very long larval life (around 18 months) during which they become widely
dispersed; after settlement on reefs, they are thought to live several decades (Booth 2000). In
Northland, males reach MLS (54-mm tail width) at about 5 years of age; females (60-mm tail width)
at 6.5 years.
There is no evidence for genetic subdivision of lobster stocks within New Zealand (Plenary 2015).
Most postlarvae settling along the East Northland coast were spawned along the west coast of central
New Zealand; spawnings in East Northland result in settlement in eastern Bay of Plenty and as far
south as about Cook Strait (Chiswell & Booth 2008). There may be alongshore migrations northward
by some proportion of the juveniles approaching maturity, but in any event there is seasonal mixing
associated with inshore-offshore movements for moulting and mating (Booth 1997). Despite this,
there is anecdotal evidence for localised depletion within East Northland, as well as areas (often
remote) with higher proportions than average of large lobsters than elsewhere in the fishery,
suggesting stock mixing is gradual and/or incomplete.
4.3.2 Harvest history and stock assessment
Harvest data, and TAC allocations, are given in Table 3. CRA 1 catches built steadily after World
War II, rapidly peaking in the late 1960s as many new vessels joined the fleet, spurred along by the
Chatham Islands rock lobster fishing boon (Figure 19).
14Figure 19. Catch trajectories (t) for CRA 1, showing estimates for commercial, recreational, customary
and illegal categories (Plenary 2015).
The CRA 1 stock assessment shows how the vulnerable biomass collapsed to one quarter of its
original, from 3000 t in the mid-1940s to just 600 t, in the early 1970s. It has fluctuated since, with a
modest overall increase; projections are that the vulnerable biomass will remain steady (Figure 20).
Because the target biomass is that associated with the stock during 1979-88 (Table 2), when the
vulnerable biomass was near its nadir (Figure 20), it is little wonder that this fishery is not considered
overfished.
Figure 20. CRA 1 vulnerable biomass and
projected vulnerable biomass by season (AW,
autumn/winter; SS, spring/summer) (Plenary
2015). Shading shows the 90% confidence zones.
Bay of Islands lies within Rock Lobster Statistical Area 904 (Takou Bay to Bream Bay; Appendix 4)
where commercial CPUE over the past four years has averaged around 0.5 kg per pot lift, only 20% of
that of the other CRA 1 statistical areas (Plenary 2015). This points to severe regional depletion.
4.3.3 Lobster size
Consistent with intense fishing pressure, most rock lobsters caught recreationally and commercially in
and near the Bay of Islands are not much larger than the MLS (Figures 21 and 22). By way of
comparison, the wide size-distribution and predominance of large lobsters that made up a lightly
fished rock lobster population is illustrated in Figure 23.
15Figure 21. Rock lobster proportion of harvest by tail width by sex for the Bay of Islands (red) versus
north to Rangiputa (blue) and south to Mangawhai Heads (green) in 2013-14 (Holdsworth 2014). MLS
(arrows) are 54- and 60-mm tail width for males (left) and females (right) respectively.
Figure 22. Length-frequencies (tail width) of male (left) and female red rock lobsters (right) taken in
observer commercial-catch samples in Statistical Area 904, 2011-12 (D. Sykes, pers. comm.). The arrows
show the MLS (54 and 60 mm tail width for males and females respectively).
Figure 23. Percentage carapace-length (CL) frequency distribution of >1000 males (left) and >1000
females (right) red rock lobsters in October 1966, near to when commercial fishing began at the Chatham
Islands (Kensler 1969) in 10-mm groups. The current MLS for East Northland is roughly equivalent to
96-mm CL for males (left) and 97 mm for females (right) (red arrows).
4.3.5 Wrapping up for rock lobster
Although the CRA 1 lobster stock is said to be healthy overall, the low commercial CPUE in at least
Statistical Area 904, as well as the high proportion of lobsters near MLS and the low proportions of
large animals in both the recreational and commercial catches there, point to severe regional
depletion.
164.4 Scallop: SCA 1
4.4.1 Essential biology
Scallops are found in a variety of coastal and intertidal habitats, but particularly in semi-enclosed
areas (Plenary 2010, apparently the most recent year that SCA 1 was considered by the Plenary).
Scallops mature at about 60–70-mm shell length, and are extremely fecund. Larval development lasts
about 3 weeks, with initial settlement taking place on filamentous material or dead shells on or close
to the seabed. After reaching about 5-mm shell length, the juveniles may move several times before
taking up the relatively sedentary adult mode of life (Plenary 2010).
The very high fecundity, and likely variability in the mortality of larvae and pre-recruits, leads to
great variability in annual recruitment. This, combined with variable mortality and growth of adults,
leads to highly variable scallop populations from one year to the next, especially in areas of rapid
growth where the fishery may be supported by only one or two year classes (Plenary 2010). Such
variability is characteristic of scallop populations world-wide, and often occurs independently of
fishing pressure.
4.4.2 Harvest history
Scallops in the Bay of Islands have not been commercially harvested for many decades—if at all.
Anecdotally there has been a rising trajectory recently in recreational harvesting pressure, thought to
reflect increases in the local resident human population, together with more visiting vessels over the
summer when the beds are open. Harvest data, and TAC allocations, are given in Table 3.
Scallops in the Bay of Islands have become largely confined to the clear, near-oceanic waters of
Ipipiri, yet they were once common—among others—in the northwest off Rangihoua and Onewhero,
and off the west side of Motuarohia (Nevin 1984).
There have been two recent surveys of scallops on the Ipipiri beds, in 2006 and 2007 (Williams et al.
2008, Williams 2009) (Figure 24). The Rawhiti bed (1 in Figure 8) pre-season had relatively high
densities of legal-sized scallops compared with other northern beds in 2006, but there was a massive
reduction in density in 2007. The Urupukapuka beds (2 in Figure 8) had relatively high densities in
both years.
Figure 24. Density of legal scallops (≥ 100-mm
width per square metre) on the Urupukapuka
and Rawhiti grounds compared with other
northern scallop fisheries, winter 2006 and
winter 2007 (modified from Williams 2009).
4.4.3 Scallop size
The size-frequency histograms from the 2006 and 2007 pre-season surveys referred to above show
pre-recruit cohorts (Figure 25), and exemplify the high interannual and spatial variability in
abundance characteristic of scallop populations.
17Figure 25. Length-frequency distributions of scallops in the eastern Bay of Islands, 2006 (upper) and 2007
(lower) (Williams et al. 2008; Williams 2009), using the same methodologies. Shaded bars show scallops
90-mm or larger shell length and black bars show scallops 100-mm or larger.
4.4.4 Wrapping up for scallops
Scallops are keenly pursued by recreational fishers; they are now largely confined to the waters of
Ipipiri; and there is a lot of variation in harvests between areas and between years.
4.5 Green-lipped mussel: GLM 1
4.5.1 Essential biology
The green-lipped mussel is typical of the lower shore and open coast, and is most common in northern
and central parts of New Zealand where it can form dense beds of up to 100 per m2 (Plenary 2015).
The planktonic stage lasts 3-5 weeks, with larvae settling over a wide range of depths, preferring fine
filamentous surfaces including hydroids, bryozoans, and filamentous and turfing algae. Secondary
settlement, after a form of mucous drifting, is thought to be the means by which most juveniles recruit
into mussel beds, this drifting ability being lost once the mussels reach about 6-mm shell length
(Plenary 2015).
4.5.2 Harvest history
Green-lipped mussels in the Bay of Islands have not been commercially harvested for many
decades—if at all. Although huge reefs of green-lipped mussels overlying soft subtidal seafloors were
once characteristic of several Northland harbours—and particularly the Hauraki Gulf, very small
quantities of dredged mussels have been reported from the Bay of Islands, mostly in the late 1960s to
mid-1970s (Marine Department annual Reports on Fisheries). (Significant landings indicated for east
Northland in the 1920s by Paul [2012] are very unlikely to have come from the Bay of Islands.)
18For GLM 1 (see Appendix 1), the recreational and customary allowances are 162 t and 243 t
respectively (Plenary 2015). Anecdotally there has been a rising trajectory of recreational plus
customary harvesting pressure, in recent decades at least, thought to reflect increases in the local
resident human population, together with more with vessels from elsewhere visiting the Bay of
Islands during summer. Unlike scallops, the mussel beds are typically highly clumped and often very
visible—so can be rapidly overharvested.
4.5.3 Wrapping up for green-lipped mussels
Green-lipped mussels are keenly pursued by recreational fishers. Both intertidal and subtidal
populations have been heavily reduced by recreational/customary harvesting.
4.6 Cockle: COC 1B
4.6.1 Essential biology
The cockle is found in soft mud to fine sand on protected beaches and enclosed shores, and is often a
dominant species, with densities as high as 4500 per m2 (Plenary 2015). The planktonic larval stage
lasts about three weeks. Significant depression of larval settlement has been recorded for areas of
otherwise suitable substrate from which all live cockles have been removed, suggesting the need for
some conditioning factor.
Quite extensive movements of juveniles have been documented, but individuals over 25-mm long
remain largely sessile, moving only in response to disturbance (Plenary 2015).
4.6.2 Harvest history
Middens show how cockles in the Bay of Islands were highly sought by pre-Contact Maori, the extent
of harvestings in Kerikeri and Waikino inlets—where the cockle shells were later mined and kiln-
burnt to sweeten local soils—so prominent as to be singled out in the 1922 geological chart (Booth
2016b). Although arguably evidence of something more than mere artisanal harvesting of the shellfish
in at least parts of the Bay of Islands during the Late Period (AD 1650-1800) and perhaps into the
Historical Period, it seems there was no lasting ecological legacy (c.f., the failure of some of the
cockle beaches near Auckland to recover after closure in recent times (Kelly et al. 2014)). This is
probably because, for at least the easily accessible and highly sought species, there was ‘ownership’
and active stock management that prevented abundance and mean-size from plummeting.
For COC 1B (East Northland, excluding Whangarei Harbour; Appendix 1), both the recreational and
customary allowance is 22 t (Plenary 2015). Bay of Islands cockles have not been commercially
harvested for many decades—if at all. The shellfish remains one of the most widespread and abundant
in the Bay of Islands (Hewitt et al. 2010), with major harvesting beaches including Te Haumi,
Parekura and Whiorau (Figure 8). There are no known estimates of harvest rates over time, but
length-frequency distributions for Te Haumi show a significant reduction in shellfish size since the
late 1990s. Indeed, the mean size of the cockles present today will be much smaller than before
harvesting began for most, if not all, of the Bay of Islands.
4.6.3 Wrapping up for cockles
Cockles are popular among recreational and customary fishers. Surveys in 2009 showed moderate or
high densities of cockles in many inner areas of the Bay of Islands (Hewitt et al. 2010). They are
similar to scallops in that there is probably a great deal of variability in cohort-strength between years.
194.7 Pipi: PPI 1B
4.7.1 Essential biology
Pipi are characteristic of sheltered beaches, bays and estuaries (Plenary 2015). They are tolerant of
moderate wave action, and commonly inhabit coarse, shell/sand substrates in bays and at the mouths
of estuaries where silt has been removed by waves and currents. Larval settlement and metamorphosis
take place about three weeks after spawning. In general, pipi have been considered sedentary when
settled, although they may utilise water currents to disperse actively within waterways (Plenary 2015).
4.7.2 Harvest history
Pipi in the Bay of Islands were less-highly sought than cockles by pre-Contact Maori, but nevertheless
they form significant components of midden-contents (Booth 2016b). As for cockles, ‘ownership’ and
active stock management probably prevented abundance and mean-size from plummeting. Bay of
Islands pipi have not been commercially harvested for many decades—if at all, and the shellfish
remains one of the most widespread and abundant (Hewitt et al. 2010). There are no known estimates
of harvest rates over time, but length-frequency distributions for Te Haumi show a significant
reduction in shellfish size since the late 1990s. Indeed, the mean size of the pipi present today will be
much smaller than before harvesting began for most, if not all, of the Bay of Islands.
For PPI 1B (East Northland excluding Whangarei Harbour), both the recreational and customary
allowance is 76 t.
4.7.3 Wrapping up for pipi
Pipi are popular among recreational and customary fishers. They are similar to scallops in that there is
probably a great deal of variability in cohort strength between years.
5 Evidence for, and implications of, ecological overfishing of keystone predators
One consequence of overfishing in the Bay of Islands, as well as in other parts of eastern Northland,
has been reduction in the proportions of large-individual, keystone predatory finfish (particularly
snapper) and shellfish (particularly red rock lobsters) capable of preying on kina (sea urchin
Evechinus chloroticus). This has led to burgeoning kina populations and to the widespread loss of
shallow-reef kelp forests to sea-urchin overgrazing (Andrew & MacDiarmid 1991; Shears & Babcock
2002; Ayling & Babcock 2003; Ballantine 2014). The science around this is now secure, urchin
barrens being a world-wide phenomenon and one surprisingly difficult to reverse (Ling et al. 2014).
In a recent development, the long-spined urchin Centrostephanus rodgersii now seems implicated in
the overgrazing of shallow-reef kelp, particularly in the more exposed, outer parts of the Bay of
Islands (C. Richmond & V. Froude, pers. comm.). Centrostephanus, which also is found on the east
coast of Australia, was reported in the late 1960s to be extending its distribution and increasing its
abundance in the north of New Zealand (Morton & Miller 1968), and is now common in shallow open
waters of the Bay of Islands. In southeast Australia, this urchin has long been known as a significant
contributor to urchin barrens (Andrew & Underwood 1993), and the rock lobster there (also Jasus
edwardsii) is its primary predator (Sinauer Associates 2014).
The loss of the shallow-reef kelp forests throughout the main basin of the Bay of Islands has been
extensive, and among the most severe in the country. Booth (2015) distinguished 29 discrete locations
for which there was a series of aerial images, from the 1950s/1960s, through to 2009, in which the
extent of seaweed cover could be clearly discerned (Figures 26 and 27). For most parts the reduction
in kelp cover over the intervening decades has been monumental; loss of kelp was obvious by the
201970s, although some kelp forests did persist until quite recently. And no evidence has been found for
any kelp recovery since 2009.
Figure 26. Changes in kelp cover between the 1950s/early 1960s and 2009 (Booth 2015). For each site
there were at least four aerial images, each separated by at least a decade, and among which at least two
of the early images showed extensive dark shadows associated with reef (usually kelp but possibly
sometimes dark-coloured rock). The previously existing dark shadows had largely vanished by the 1970s
(red), or certainly by the 2000s (orange); green indicates little apparent change in the intensity or extent
of shadow (although thinning of kelp was sometimes obvious), most often seen near inlets where waters
are presumably too fresh for kina. Extensive dive surveys in 1985-86 (Trenery et al. 1987), and again in
1991 (Brook & Carlin 1992), recognised the presence of widespread kina barrens in the Bay of Islands at
those times.
Figure 27. Urchin barrens (red) are now widespread in the Bay of Islands, particularly in the main basin (aerial
photographs in 2009; Booth 2015). What appeared to be intact kelp forests persisted mainly near inlets (green). In top
left, the reef was too steep to assess, or was in shadow (1); or the reef itself appeared dark, most probably for reasons
other than kelp cover (2-4). In top right, the reef itself appeared dark, but not necessarily because of kelp cover (1 and
2). In the bottom row, open shores were often too steep, or were in shadow (blue).
21The Bay of Islands presents an extreme and extensive example of ecological overfishing resulting
from reduction in the abundance of the main predators of sea-urchins. The loss of significant areas of
the shallow-water kelp community is likely to have led to a multitude of cascading consequences,
most of them not yet recognised, let alone understood. On the bright side, the experience in the marine
reserve at Leigh and elsewhere is that once large keystone predators return, the sea urchins are held in
check, and the kelp recovers (Ayling & Babcock 2003, Ballantine 2014).
6 Overview
Table 3 (with Figures 3, 4 and 28) provide overviews of recreational versus commercial harvests by
FMA 1 (and subarea), not only for snapper, kahawai and rock lobster, but also for other finfish of
recreational interest in east Northland generally, and the Bay of Islands specifically.
Recreational harvests of snapper are high along the east coast of Northland, including in the Bay of
Islands, in recent years having been fully two-thirds or more of the corresponding-area commercial
catches. Most of the snapper landed recreationally in the Bay of Islands—and generally in east
Northland—are near MLS (even after some high-grading for larger fish that is likely to be taking
place). This all points to intensive overall fishing pressure, which is what the stock assessment says
(Table 2).
For kahawai it is a different story. Recreational catches are high—of similar scale to the commercial
catches—but there are significant proportions of large fish in the recreational catches. (The rather
large discrepancy between the 2013-14 estimates of 349 t and 97 t of kahawai landed recreationally
remains unresolved; Table 3.) This points to less-intensive overall fishing pressure, which is what the
stock assessment says (Table 2).
For finfish species with smaller recreational harvests, kingfish are of note: the estimated recreational
harvest in 2011-12 was five times that of the corresponding commercial harvest (Figure 28, Table 3).
Red gurnard, tarakihi and trevally recreational harvests are small compared with their respective
commercial harvests (Figure 28, Table 3). The stock status of these species is unclear (Table 2).
Rock lobsters are enigmatic. On the one hand, recreational harvests are only about 20% of the
commercial CRA 1 landings, and the stock assessment says a healthy and recovering stock. On the
other hand, 1) the reference period 1979-88 was when the landings were near their nadir (Figure 20);
2) most of those harvested recreationally (and commercially) are near the MLS, pointing to heavy
fishing pressure (Figures 21 and 22); and 3) the point-estimate of 42 t recreationally harvested in CRA
1 in 2013-14 (Holdsworth 2014) may mean that other recent recreational harvests have been
underestimates.
All the other shellfish are heavily harvested, with green-lipped mussels being the one to have been
least-well able to withstand high fishing pressure, perhaps because of its tendency to clump.
Bay of Islands’ recreational fishery is intensive and extensive, and is likely to continue to expand and
intensify even more over the next five years, mainly through more and more vessels visiting the Bay,
particularly from Auckland over the summer. Because of the biological links between the Bay of
Islands’ keystone predator populations and those of the FMA (or subarea), reduction of fishing effort
in the Bay of Islands alone is unlikely to bring much relief; across-the-board measures at the
stock/substock level are required. This sluggishness to respond has been seen at Maunganui Bay
where, after six years of prohibition from fishing (except for kina) under a rahui, it has not been
possible to detect any significant change in size or abundance of snapper, even though the anecdotal
reports suggest increases. A useful gauge of fishstock recovery in the Bay of Islands area will be the
revitalisation of the shallow-reef kelp forests, but because of the resilience of urchin barrens (Ling et
al. 2014), this will almost certainly take decades—if not centuries—to achieve unless there are urgent
and significant reductions in fishing pressure.
22Table 3. Overview of FMA 1 recreational and commercial harvests (t). TAC, current Total Allowable Catch; TACC, current Total Allowable Commercial Catch;
Rec, Recreational; Comm, Commercial. Sources: 1, Plenary 2015 (2016 for rock lobster); 2, Hartill et al. (2013); 3, Holdsworth (2014); 4, Hartill et al. (2015); 5,
Hartill et al. (2007); 6, Wynne-Jones et al. (2014); 7, 2010 Plenary is the most recent available; 8, meat weight x 8; 9, Sum of catches from Statistical Areas 002, 003 &
005 from NABIS, which together closely approximate ENLD; 10, Sum of catches from Statistical Areas 903 & 904 from NABIS, which together closely approximate
ENLD3; -, not applicable or not available.
Fishstock Species Current Current CRC CCC Rec Comm Rec Rec Comm Rec Comm Rec Comm
TAC TACC harvest harvest harvest harvest harvest harvest harvest harvest harvest
(Aerial) (Aerial) (Panel) (Access) (t) (Access)
2004-05 2004-05 2011-12 2011-12 2011-12 2012-13 2012-13 2013-14 2013-14
BCO 1 Blue cod 461 461 21 21 - 91 - 81 61 - 91 - 91
GUR 1 Red - 22881 - - - 13541 - 981 9811 - 11031 - 10051
gurnard
GUR 1 Red - - - - 1272 - 242 - - - - 63 -
(ENLD) gurnard
KAH 1 Kahawai 22001 10751 9001 2001 5301 11471 9421 9581 10041 - 10951 - 10621
KAH 1 Kahawai - - - - 1291 1129 1911 1981 1179 1864 1249 3493; 974 719
(ENLD)
KAH 1 Kahawai - - - - - - 84 - - 84 - 44 -
(Waitangi)
KIN 1 Kingfish 6731 911 4591 761 - 581 - 4881 871 - 881 - 1001
KIN 1 Kingfish - - - - 775 - - - - - - - -
(ENLD)
SNA 1 Snapper 80501 45001 30501 501 24191 46411 37541 37921 46141 - 44571 - 44591
SNA 1 Snapper - - - - 5571 ~10001 7181 8691 ~10001 8374 15379 5854 16649
(ENLD)
SNA 1 Snapper - - - - - - 224 - - 264 - 184 -
(Waitangi)
TAR 1 Tarakihi 20291 14471 4871 731 901 15271 671 971 11341 - 11841 - 14251
TRE 1 Trevally 15071 15071 - - 1051 9771 1241 1541 10501 - 13011 - 14311
TRE 1 Trevally - - - - - - - - - - - 883 -
(ENLD)
CRA 1 Rock 273.11 131.11 - - 243 1311 - 241 1301 - 1311 423 1311
lobster
CRA 1 Rock - - - - - 2710 - - 2610 - 3010 253 3210
(ENLD)3 lobster
SCA 1 Scallop 6007,8 3207,8 607,8 607,8 - 3197 - 846 ?7 - ?7 - ?7
2310
15
20
25
30
35
40
45
50
0
5
0
100
200
300
400
500
600
700
800
0
1000
1200
1400
1600
200
400
600
800
TAC TAC
TAC
TACC TACC
TACC
Rec 04/05 Aerial Rec 04/05 Aerial
Rec 04/05 Aerial
Commercial 04/05 Commercial 04/05
Commercial 04/05
KIN 1
TRE 1
BCO 1
Rec 11/12 Aerial Rec 11/12 Aerial
Rec 11/12 Aerial
Rec 11/12 Panel Rec 11/12 Panel Rec 11/12 Panel
Commercial 11/12 Commercial 11/12 Commercial 11/12
Rec 13/14 Access Rec 13/14 Access Rec 13/14 Access
50
0
100
150
200
250
300
0
1000
1500
2000
2500
500
0
1000
2000
3000
4000
5000
6000
7000
8000
9000
TAC TAC TAC
TACC TACC TACC
Rec 04/05 Aerial Rec 04/05 Aerial Rec 04/05 Aerial
Commercial 04/05 Commercial 04/05 Commercial 04/05
GUR 1
SNA 1
CRA 1
Rec 11/12 Aerial Rec 11/12 Aerial Rec 11/12 Aerial
Rec 11/12 Panel Rec 11/12 Panel Rec 11/12 Panel
harvest is relatively small.
Commercial 11/12 Commercial 11/12 Commercial 11/12
Rec 13/14 Access Rec 13/14 Access Rec 13/14 Access
0
100
200
300
400
500
600
700
0
1000
1500
2000
2500
500
0
1000
1500
2000
2500
500
TAC TAC TAC
TACC TACC TACC
Rec 04/05 Aerial Rec 04/05 Aerial Rec 04/05 Aerial
Commercial 04/05 Commercial 04/05 Commercial 04/05
TAR 1
KAH 1
SCA 1
Rec 11/12 Aerial Rec 11/12 Aerial Rec 11/12 Aerial
Rec 11/12 Panel Rec 11/12 Panel Rec 11/12 Panel
Commercial 11/12 Commercial 11/12 Commercial 11/12
Figure 28. Graphical interpretations of recent FMA 1 harvests (t) in Table 3. No bar means no data are
1. The main points are 1) recreational harvests of kahawai, kingfish and snapper (and possibly blue cod)
available (and, for GUR, no TAC established). For species acronyms and area boundaries, see Appendix
are of similar scale, or greater than, the commercial catches; and 2) for all other species, the recreational
24
Rec 13/14 Access Rec 13/14 Access Rec 13/14 AccessSummary
1. The principal finfish recreationally sought and caught in the Bay of Islands is snapper,
followed by kahawai. The most important invertebrates are red rock lobsters, scallops, green-
lipped mussels, cockles and pipi.
2. Bay of Islands takes in the most extensive area of intense recreational boat-fishing in the
whole of East Northland (North Cape to Cape Rodney). This fishing effort almost certainly
exceeds that of the commercial fleet, for several species the recreational catches being similar
to or exceeding those commercial.
3. There are hotspots (>100 vessels per square kilometre, annualised) of recreational boat-
fishing north and southeast of Moturoa Island, near Nine Pin and Whale Rock, and north of
Motuarohia Island. In contrast, only about five local boats—mostAcknowledgments
My thanks to Vicky Froude and Chris Richmond for their useful suggestions on an earlier draft of this
paper.
References
Andrew, N.L.; MacDiarmid, A.B. (1991). Interrelations between sea urchins and spiny lobsters in northeastern New
Zealand. Marine Ecology Progress Series 70: 211-222.
Andrew, N.L.; Underwood, A.J. (1993). Density-dependent foraging in the sea urchin Centrostephanus rodgersii on shallow
subtidal reefs in New South Wales, Australia. Marine Ecology Progress Series 99: 89-98.
Armiger, H.; Hartill, B.; Rush, N.; Buckthought, D.; Smith, M. (2014). Length and age compositions of recreational landings of
kahawai in KAH 1 from January to April in 2011 and 2012. New Zealand Fisheries Assessment Report 2014/60.
Ayling, T.; Babcock, R. (2003). Goat Island. In The Living Reef. The ecology of New Zealand’s rocky reefs. Craig Potton
Publishing, Nelson. Pp 224-229.
Ballantine, B. (2014). Fifty years on: Lessons from marine reserves in New Zealand and principles for a worldwide network.
Biological Conservation 176: 297-307.
Berkenbusch, K.; Neubauer, P. (2015). Intertidal shellfish monitoring in the northern North Island region, 2014–15. New
Zealand Fisheries Assessment Report 2015/59.
Booth, J.D. (1997). Long-distance movements in Jasus spp. and their role in larval recruitment. Bulletin of Marine Science 61:
111–128.
Booth, J.D. (2000). New Zealand’s rock lobster fisheries. In Spiny lobsters: fisheries and culture. (Eds Phillips, B.F.; Kittaka, J.).
Blackwell Scientific Publications Ltd. p. 78–89.
Booth, J. (2013). Commercial fisheries of the Bay of Islands and adjacent waters in relation to possible marine protected
areas. http://www.fishforever.org.nz/
Booth, J. (2015). Flagging kelp: potent symbol of loss of mauri in the Bay of Islands. http://www.fishforever.org.nz/
Booth, J. (2016a). Ecological upshot of seven centuries’ harvesting of Bay of Islands’ fish and shellfish. Russell Review
2015-2016: 17-32.
Booth, J. (2016b). Ecological consequences of pre-Contact harvesting of Bay of Islands fish and shellfish, and other marine
taxa, based on midden evidence. Journal of Pacific Archaeology 7: 73-86.
Brook, F.J.; Carlin, G.L.F. (1992). Subtidal benthic zonation sequences and fish faunas of rocky reefs in Bay of Islands,
northern New Zealand. Department of Conservation, Northland Conservancy.
Chiswell, S.M.; Booth, J.D. (2008). Sources and sinks of larval settlement in Jasus edwardsii around New Zealand: Where do
larvae come from and where do they go. Marine Ecology Progress Series 354: 201-217.
Davidson, J.; Leach, F.; Greig, K.; Leach, P. (2000). Pre-European Maori fishing at Foxton, Manawatu, New Zealand. New
Zealand Journal of Archaeology 22: 75-90.
Francis, M. (2003). Snapper. In The Living Reef. The ecology of New Zealand’s rocky reefs. Craig Potton Publishing,
Nelson. Pp 186-191.
Francis, M.P.; Paul, L.J. (2013). New Zealand inshore finfish and shellfish commercial landings, 1931-82. New Zealand
Fisheries Assessment Report 2013/55.
Hartill, B.; Bian, R. (2016). Stock assessment of kahawai (Arripis trutta) in KAH 1. New Zealand Fisheries Assessment
Report 2016/26.
Hartill, B.; Bian, R.; Armiger, H.; Vaughan, M.; Rush, N. (2007). Recreational marine harvest estimates of snapper,
kahawai, and kingfish in QMA 1 in 2004–05. New Zealand Fisheries Assessment Report 2007/26.
Hartill, B.; Bian, R.; Rush, N.; Armiger H. (2013). Aerial-access recreational harvest estimates for snapper, kahawai, red
gurnard, tarakihi and trevally in FMA 1 in 2011–12. New Zealand Fisheries Assessment Report 2013/70.
(https://www.mpi.govt.nz/document-vault/4334)
Hartill, B.; Davey, N. (2015). Mean weight estimates for recreational fisheries in 2011–12. New Zealand Fisheries
Assessment Report 2015/25. (https://www.mpi.govt.nz/document-vault/7191)
Hartill, B.; Rush, N.; Bian, R.; Miller, A.; Payne, G.; Armiger H. (2015). Web camera and creel survey monitoring of
recreational fisheries in FMAs 1, 8, and 9. New Zealand Fisheries Assessment Report 2015/52.
(https://www.mpi.govt.nz/document-vault/9677)
Hewitt, J.; Chiaroni, L.; Hailes, S. (2010). Bay of Islands OS20/20 survey report. Chapter 11: Soft-sediment habitats and
communities. (http://www.linz.govt.nz)
Holdsworth, J.C. (2014). Rock lobster amateur harvest estimates for CRA 1 in Northland, New Zealand 2013-14. New
Zealand Fisheries Assessment Report 2014/70. (https://www.mpi.govt.nz/document-vault/5068)
Kelly, S.; Sim-Smith, C.; Faire, S.; Pierre, J.; Hikuroa, D.C.H. (2014). State of our Gulf 2014. Hauraki Gulf - Tikapa Moana/
Te Moananui a Toi. State of the Environment Report 2014. Hauraki Gulf Forum.
Kensler, C.B. (1969). Commercial landings of the spiny lobster Jasus edwardsii (Hutton) at Chatham Islands, New Zealand
(Crustacea: Decapoda: Palinuridae). New Zealand Journal of Marine and Freshwater Research 3: 506-517.
King, M.R. (1985). Fish and shellfish landings by domestic fishermen, 1974-82. Fisheries Research Division Occasional
Publication: Data Series No. 20.
Leach, F. (2006). Fishing in pre-European New Zealand. Archaeofauna 15.
26You can also read


