Preservation and Study of Historical Guitars Museu de la Musica, Catalunya
←
→
Page content transcription
If your browser does not render page correctly, please read the page content below
Preservation and Study of Historical Guitars
      Museu de la Musica, Catalunya :
    Methodology Proposal to Play the Unplayable

                  Toros Ufuk Senan

              MASTER THESIS UPF / 2014

         Master in Sound and Music Computing

                    Master Thesis Supervisor: Enric Guaus, Paul Poletti
            Department of Information and Communication Technologies
                                   Universitat Pompeu Fabra, Barcelona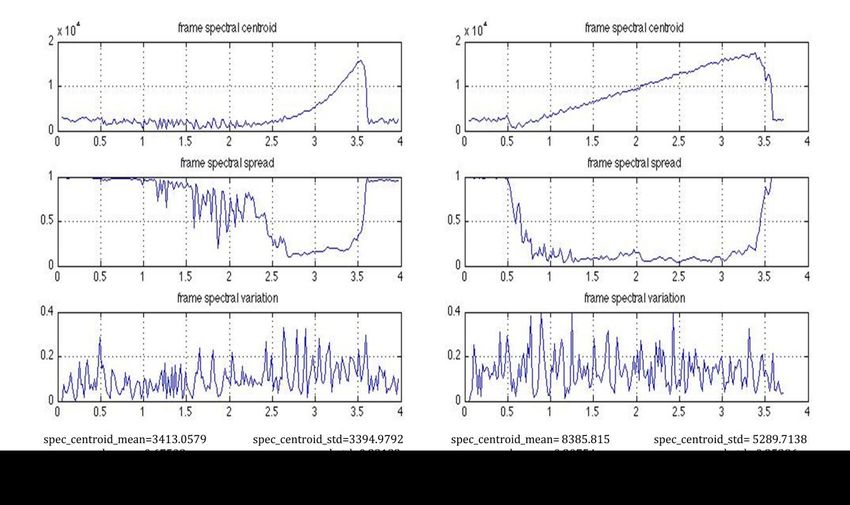
ii
Preservation and Study of Historical Guitars
Museum de la Musica : Methodology Proposal to Play the Unplayable

Toros Ufuk Senan

Philips Electronic Nederlands
High Tech Campus 36, p.118
5656 HA Eindhoven, Netherlands
Master's thesis

Abstract

WoodMusick project is a multi-disciplinary COST action research project. The main goal of the
project is to study museum instruments and preserve their physical and acoustical properties.
This paper aims to contribute the project by studying historical guitars in Museu de la Musica,
Catalunya, as well as to propose a global measurement methodology for prediction of acoustical
properties of guitars during the design stage. Two historical classical guitars, Torres 625 from
Antonio de Torres and Labrador from romantic period are studied, in addition to a test guitar.
Steady-state and impulse responses are recorded and spectral and physical properties are
extracted from recordings. The results are classified with WEKA by ESSENTIA descriptors and
two guitars are succefully identified and distinguished from each other. Extracted features and
physical properties are observed in the latter stage and sound feature estimations are
proposed.Besides the multi disciplinary nature of the study is already a challenging task, the
main obstacle turned out to be to build a methodology that ensures safety of the instrument
while collecting the necessary data. The results are promising for building a dataset with
proposed methodology to predict acoustical features of guitars in design stage as well as
creating an archive for historical instruments and monitor their physical state and its effect on
sound features in time.

                                                                                               iii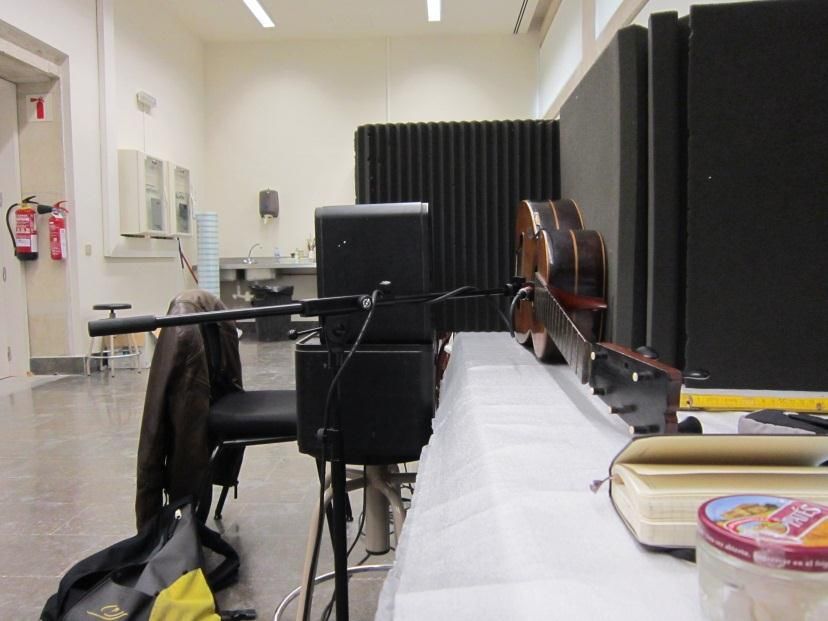
iv

Acknowledgements

I would like to thank my supervisors, Enric Guaus and Paul Poletti for their guidance and
support through the year and Xavier Serra for giving me the opportunity to join MTG. I
would also like to thank Marco Antonio Perez from UPC for sharing his extensive
knowledge of the classical guitars in the museum and giving me the opportunity to work on
the guitars with him. I thank my fellow students for the great times we had this year as well
as all the members of MTG, who had the patience for my questions. Last but not least,
everyone who helped me to work in Museu de La Musica and gave me access to work on
some of the most precious guitars in the museum.

                                                                                            v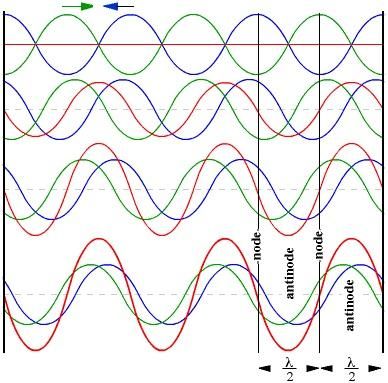
vi
Contents

Abstract...................................................................................................................................... iii
Acknowledgements ..................................................................................................................... v
List of Figures ............................................................................................................................ ix
List of Tables .............................................................................................................................. x
Introduction ................................................................................................................................ 1
           1.1 Motivation ................................................................................................................. 1
           1.2 Goals ........................................................................................................................ 1
           1.3 Structure of the thesis ............................................................................................... 2
State of the Art ........................................................................................................................... 3
           2.1 String instruments..................................................................................................... 3
           2.2 Physics of guitar ....................................................................................................... 4
           2.2.1 Transverse waves of plucked strings ..................................................................... 4
           2.2.2 Impulsive waves, interference, reflection ............................................................... 5
           2.2.3 Standing waves ..................................................................................................... 6
           2.2.4 Harmonics and modes ........................................................................................... 7
           2.2.5 Force exerted by the string .................................................................................... 8
           2.3 Guitar body ............................................................................................................... 8
           2.3.1 Coupled vibrators .................................................................................................. 9
           2.3.2 Modes of vibration of guitar body ........................................................................... 9
           2.3.3 Coupling between top plate and air cavity .............................................................11
           2.3.4 Low frequency resonances ...................................................................................12
           2.4 Sound quality ...........................................................................................................13
           2.4.1 Design and Construction ......................................................................................13
           2.4.1.2 Bridge, top plate thickness and bracing .............................................................14
           2.4.1.3 Bracing ..............................................................................................................14
           2.5 Wood .......................................................................................................................15
           2.5.1 Acoustical quality of wood.....................................................................................15
           2.5.2 Wood archetypes for string instruments ................................................................16
Methodology .............................................................................................................................18
           3.1 Measurement ..........................................................................................................18
           3.1.1 Experimental Modal Analysis ................................................................................18
           3.1.2 Sine-Sweep and Noise Responses.......................................................................20
           3.2 Classification and Feature Extraction.......................................................................21
           3.3 Acoustical Property Investigation .............................................................................21

                                                                                                                                              vii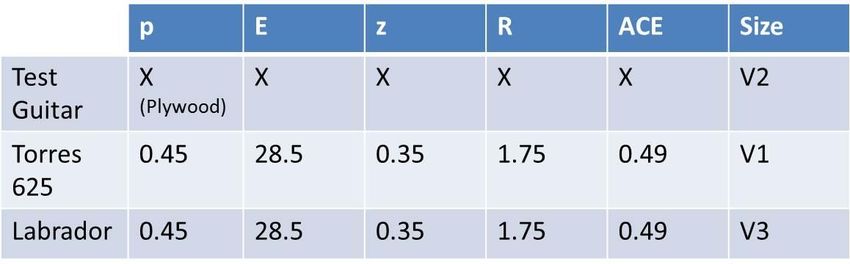
Results and Discussion .............................................................................................................23
          4.1 Feature Extraction ...................................................................................................23
          4.2 Physical properties ..................................................................................................26
          4.3 Wood type and material performance indexes .........................................................26
          4.4 General observations...............................................................................................27
Conclusion ................................................................................................................................31
          5.1 Contributions ...........................................................................................................31
          5.2 Future work .............................................................................................................31
Bibliography ..............................................................................................................................33

                                                                                                                                         viii
List of Figures
Figure 2.1: Superposition of Waves .............................................................................................................. 5
Figure 2.2: Nodes and antinodes of identical standing waves. ..................................................................... 6
Figure 2.3 : Frequency Analysis of a plucked string at its center. ................................................................ 7
Figure 2.4: Spectrum of a string plucked one-fifth of its length.(Rossing, 2010) .......................................... 7
Figure 2.5 : Simple schematic of guitar. ........................................................................................................ 9
Figure 2.6 : Vibration modes of guitar without bracings. ............................................................................. 10
Figure 2.7 : Vibration modes of plates with bracings .................................................................................. 11
Figure 2.9 : Three-mass model. .................................................................................................................. 12
Figure 3.1 : Experimental Modal Analysis (Torres 625) .............................................................................. 19
Figure 3.2 : Impulse response of Experimental Modal Analysis of point 14, Torres 625............................ 19
Figure 3.3 : Signal chain and microphone/loudspeaker positioning. .......................................................... 20
Figure 3.4: Recording setup for “Labrador”................................................................................................. 21
Figure.4.1 : Torres 625 (left) peak position at 74 Hz and Labrador (right) peak position at 71 Hz ............. 23
Figure 4.2 : Torres 625 (left) peak position at 423 Hz and Labrador (right) peak position at 488 Hz ......... 24
Figure 4.3 : Mel Bands spectrum plot for Torres 625 (left) and Labrador (right) ........................................ 24
Figure 4.4: Spectral centroid, spread and variation plots for Torres 625 (left) and Labrador (right). ......... 25
Figure 4.5 : Spectral flatness plots are are presented for Torres 625 (left) and Labrador (right). .............. 25
Figure 4.6 : Spectral descriptors’ results ..................................................................................................... 28
Figure 4.7: Level of 1/3 octave energy bands ............................................................................................. 29
Figure 4.8: Comparison graph .................................................................................................................... 29

                                                                                                                                                 ix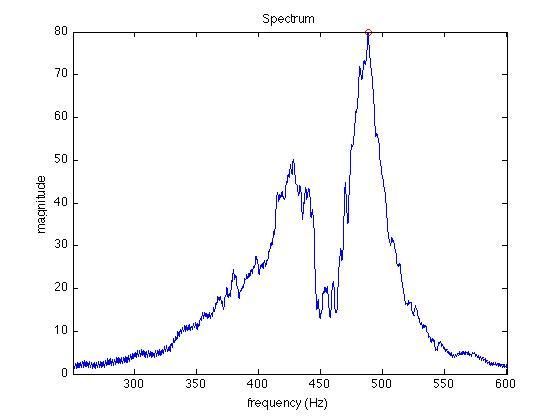
List of Tables
Table 1: Acoustical properties of spruce with comparison to several species of Picea family. .................. 17
Table 2 : Spectral features of Torres 625 and Labrador. ............................................................................ 26
Table 3: Material performance Index and Size of Torres 625, Test Guitar and Labrador. ......................... 27

                                                                                                                                     x
xi
Chapter 1
Introduction
1.1 Motivation
Research in the field of musical acoustics is of great importance for large variety of branches,
instrument making, ecology and eco-acoustics, acoustics and physics, sound engineering and
music technology since years for different reasons. Finding new sound-board materials for eco-
acousticians as well as predicting the sound quality of the instrument for luthiers, understanding
lip pressure of wind instruments for physicians and acoustical radiation patterns of instruments
for acousticians are some of the pre dominant research areas of these branches, as well as
many others.
“WoodMusick” aims to preserve and study historical wood instruments which are part of
different museums and collections all around Europe. The diversity of parties that are part of the
project corresponds to the multi-disciplinary nature of the study. This paper, however, focuses
on the study of sound, particularly for the historically important classical guitars which are the
part of the rich collection of Museu De La Musica in Barcelona, Catalunya.
Guitars as well as the other members of the string instruments’ family are particularly
challenging and tempting for researchers especially because of its inharmonic nature and
complex vibrational behavior. The major difference between guitar and its well-known family
members, violin, cello and piano, is that there is considerably less amount of resources and
papers (not as less as there is for lute and vihuela, considered as ancestors of guitar) in the
state of the art, simply because guitar has been accepted by major orchestras around 1800-
1850, and world-wide in the second half of 19.Century, by the help of legendary musicians like
Francesco Tarrega. Even though the history of guitars and string instruments is beyond the
scope of this paper, a slight introduction is presented at the beginning of the second chapter.
1.2 Goals
This study aims to create a substantial ground to build a scientific relation between structural
and physical aspects and acoustical properties of guitar in the first scope. This will improve the
chances of creating a suitable acoustical property model which can help predicting sound
aspects of guitars from the early stage of guitar construction. The research and methodology
applied in order to achieve this goal is as follows:
Examining the state of the art review, focusing from physics of musical instruments
to audio measurement techniques as well as acoustical properties of wood material
that has been used for making string instruments.
Physical and acoustical measurements of the data set.
1 Feature extraction of the captured audio samples and observation of frequency
response functions.
Investigation of physical dimensions and their effect on the extracted results.
Acoustical property model proposal and testing its reliability for bigger datasets.
1.3 Structure of the thesis
In chapter 2, the physics of string instruments, mostly focused on guitar, and acoustical
properties of wood is reviewed. Furthermore, different measurement techniques, string and
plate resonances, and high quality sound criterion is examined. Chapter three introduces the
methodology covering from measurements to the sound prediction model proposal. Chapter
four focuses on the results obtained by feature extraction. All the results and corresponding
measurements are presented in a table. Chapter five discusses the sound prediction model
proposal under the light of the results reviewed in the chapter four as well as an overview as a
summary, stating the contribution to the state of the art.
2Chapter 2
State of the Art
This section reviews the concept and relative research work in the physical and acoustical
analysis of musical wood string instruments, emphasizing on guitar, with an overview of history,
and acoustic and vibro-acoustic measurement methods. The first subsection briefly describes
physical aspects of wood string instruments, from both constructional and acoustical point of
view, mainly focusing on the working principles and structural development of guitars including
overview of acoustic properties of wood and influence of guitar design on sound quality.
2.1 String instruments
Quite a number of resources are available about histories of acoustics in research domain
(Lindsay 1966, 1973; Hunt 1992; Beyer 1999), and these histories include musical acoustics as
well. Carleen Hutchins has written about history of violin research((Hutchins, 2000), but less has
been documented regarding other string instruments.
Most early acoustical studies were tied to musical acoustics (Rossing, 2010), beginning from
Pythagoras studying length of the strings and vibrations as well as Galileo reviewing the
relationship of pitch of a string to its vibrating length (Hunt, 1992), and his accomplishment of
revealing the relationship of the number of vibrations per unit time and the pitch. The English
mathematician Brook Taylor provided a dynamical solution for the frequency of a vibrating string
based on the assumed curve for the shape of the string when vibrating in its fundamental mode.
Daniel Bernoulli set up a partial differential equation for the vibrating string and obtained
solutions which d’Alembert interpreted as waves traveling in both directions along the string
(Beyer 1999).
History of guitars
There are basically two types of guitars: acoustic and electric guitars. Acoustic guitar family
includes flamenco guitars, Portuguese fado guitars, classical guitars, flat-top guitars, resonator
guitars, archtop guitars, acoustic bass guitars and 12-string guitars.
Vihuela is the ancestor of modern six string guitar, which has its roots in antiquity. The modern
word guitar was adopted in English from Spanish guitarra, which was derived from Greek
kithara. In the renaissance period, the renaissance guitar, which was not a dominant instrument,
had four courses of double strings, and towards the baroque period, fifth course was added. At
the end of baroque period, the strings have been turned into single strings and an additional
string was added, reaching its final state. Although some composers of eighteenth century, like
Boccherini, included guitar into some of their chamber music, settlement of guitar as a concert
3instrument took place largely in nineteenth century. Fernando Sor (1778–1839) was the first in a
long line of Spanish virtuosos and composers for the guitar.
Substantial contribution was presented to the structure of guitars, by Spanish luthier Antonio de
Torres (1817-1892), with the enlargement of body and introducing the fan shaped bracing to the
top plate. Francesco Tarrega (1852–1909), on the other hand, one of the greatest players of
nineteenth century, perhaps the best one, introduced the apoyando stroke, generally extended
the expressive capabilities of modern classical guitar performance (Jahnel, 1981;Turnbull,1974).
Unlike its ancestors, lute and vihuela, which very little scientific research has been conducted,
the guitar has been studied extensively, by multidisciplinary scientists. In addition to scientific
papers, acoustic journals such as, Acustical Acta Acustica, Applied Acoustics, Acoustics
Technology and Journal of the Acoustical Society of America have directed significant
importance towards guitars. More specialized journals like, Catgut Acoustical Journal, American
Lutherie, Journal of Guitar Acoustics, and Frets have also reserved space for research papers
and investigations. Almost all of the international symposiums of musical acoustics (ISMA)
included papers on acoustics of guitars, a special session of these papers were published in the
September 1982 issue of Journal of Guitar Acoustics, a dedicated journal, not being issued after
1983.
Guitar researchers have paid considerable attention towards resonances of the guitar body, and
how the low-frequency resonances can be acknowledged being due to the coupled vibrations of
top plate, back plate and enclosed air (air cavity). Different bracing patterns, especially in the
top plate, has been experimented by luthiers. Unlike the violin, which has changed very little
since decades, guitar is still evolving.
2.2 Physics of guitar
This section reveals a brief overview on physics of guitar in two subsections consisting of
plucked string motion, 1-D continuous systems, and 2-D continuous systems such as top plates
and back plates of guitars. Strings are considered as primary excitation mechanism in physics
as plates individually are referred fundamental vibrating elements and guitar body, mostly
because of its coupling motion is considered as resonator.(Roederer, 2008)
2.2.1 Transverse waves of plucked strings
The study of vibrating string is along and developed field, beginning from Pythagoras observing
how the division of a stretched string into two segments with the lengths of these two have a
simple ratio (2:1, 3:1, 3:2, etc.) gives us pleasing sounds. It is an example of normal modes of a
string fixed at its ends. Closer examination of this motion of a string reveals that normal modes
are dependent on the length of the string, applied tension, mass of the string and the end
conditions. The equation describing transverse wave motion in a vibrating string is (see e.g.,
Sect. 2.2 in Fletcher and Rossing 1999):
2y T 2y 2 y
2
c ,
t 2 x 2 x 2
(2.1)
4If a string with linear density m (kg/m) is stretched to a tension T, waves will propagate at a
speed c given by √(T/m). The general solution to (2.1) can be expressed in a form:
y f1 (ct x) f 2 (ct x)
(2.2)
The function f1 (ct x) represents a wave traveling to the right with a velocity c; similarly,
f 2 (ct x) corresponds to a wave traveling to the left with the same velocity. The nature of
functions and are arbitrary, for example, they can be sinusoidal. (Fletcher & Rossing,
1999).
2.2.2 Impulsive waves, interference, reflection
In order to understand wave reflection at the ends of a string, we first need to consider what
happens to a single pulse at fixed and free ends of a string (Rossing, 2002). If a rope is fixed in
one end and given a sinusoidal force, a single impulse by rapidly moving the other end up and
down, the impulse will travel in the speed of c while maintaining its shape towards the fixed end
of the rope. When the impulse reached the end, it will reflect back from the end with an almost
same shape except being upside-down. If the other end of the rope is not fixed, free to move,
the impulse would travel back in the shape of right-side-up.
This motion of strings creates superposition and phase interference between traveling waves.
When two waves are in motion at opposite directions, they can pass right through each other
and emerge with their original identities, the principle of linear superposition describes this
behavior ( Fletcher & Rossing, 1999). When the pulses are in the same sense, they add when
they meet, when they are in opposite senses, they subtract. These are called constructive and
destructive interferences. (Fig. 2.1)
Figure 2.1: Superposition of Waves
The superposition of wave pulses that travel in opposite directions: (a) pulses in the same direction; (b) pulses in
opposite directions; (c) pulses with different shapes
(Rossing, 2010)
52.2.3 Standing waves
When the both ends are of the string are fixed, waves reflect back from the fixed ends and
create standing waves (Fletcher & Rossing, 1999). The interaction of two waves, with equal
amplitude and frequency, traveling in opposite directions,(fig.2.2 : green to the right, blue to the
left , red one is the sum) there will be alternate regions of constructive and destructive
interference. The figure 2.2 below, is a time sequence (time increases from bottom to top)
representation of these alternate phase interferences, the points of destructive interferences
occur are called nodes, and points of constructive interferences are called antinodes.
Figure 2.2: Nodes and antinodes of identical standing waves.
(http://www.phys.unsw.edu.au/jw/strings.html)
At the antinodes, the displacement oscillates in the same frequency of individual waves but the
amplitude is equal to sum of their amplitudes. If the amplitudes of two waves are different, they
will not cancel each other unlike it is shown in the figure 2.2, above. These nodes do not move
on the string, as they are called standing waves.
62.2.4 Harmonics and modes
The string on a musical instrument is fixed in both ends, any vibration on string have nodes at
both ends. When a string is plucked, the pulse waves propagate to the opposite directions and
reflect back from the fixed ends, and create standing waves, as discussed above. The resulting
vibration can be considered as a combination of vibrations at several modes. A string with a
length L could have a standing wave of twice as long as the length of the string (wavelength of
2L). This creates two nodes at both ends, and an antinode in the middle. This is one of the
modes of a vibrating string. The relationship among the frequencies and these modes can be
measured by, where “n” is the number of harmonics “v” is the speed of the wave and
“ ” is the wavelength. For example, if a string is plucked at its center, the result will be the
fundamental frequency and the odd-harmonics.
Figure 2.3 : Frequency Analysis of a plucked string at its center.
((Fletcher & Rossing, 1999a)
If the string is plucked any other position than its center, the spectrum of the modes is different
(Rossing, 2010). Figure 2.4 shows the spectrum of a string plucked at one-fifth of its length.
Figure 2.4: Spectrum of a string plucked one-fifth of its length.(Rossing, 2010)
7The fifth-harmonic is missing in the fig 2.4.If the string is plucked at one-fourth of its length
fourth harmonic will be suppressed and so on.
2.2.5 Force exerted by the string
For a first approximation, the force exerted by a plucked string can be written considering the
force normal to the bridge is Tsin , and parallel to the soundboard or plate is Tcos , while T
represents the tension and θ represents the angle between string and the plate. The tension
changes during the cycle, as the length of the string changes, so if the string has a cross-
sectional area A, elastic (Young’s) modulus E, the transverse and longitudinal forces can be
expressed as follows:
FT (T0 T)sin ,
(2.3)
EAL
FL (T0 T)cosqT0
L0
(2.4)
The change in longitudinal force is due mainly to the slight change in length of the string during
cycles. Transverse force change, on the other hand, is mainly because of the change in the
direction or slope.
Amplitude of transverse force pulses, in a typical guitar pluck, is 40 times greater than the
amplitude of longitudinal force pulses in the same motion, and they couple more efficiently to
the top plate (Fletcher & Rossing, 1999). However, the longitudinal force pulses are proportional
to square of the plucking amplitude, so the difference diminishes with the increasing amplitude.
(Rossing, 2010; Fletcher & Rossing, 1999).
Plucking of guitars is examined under the physical modeling of strings subsection, towards the
end of chapter 2.
2.3 Guitar body
The earliest known six-string guitar was built in 1779 by Gaetano Vinaccia in Italy (Rossing,
2010). The modern guitar generally has six strings tuned to E2, A2, D3, G3, B3, and E4 (82,
110, 147, 196, 247, and 330 Hz, respectively). The top is usually cut from spruce or redwood,
planed to a thickness about 2.5 mm(Yoshikawa, 2007).The back is usually hardwood, such as
mahogany, rosewood or maple, and again its thickness is generally 2.5 mm(Fletcher & Rossing,
1999b; Rossing, 2010). The choice of wood material is briefly examined at the fourth subsection
of this chapter, however under the light of recent studies the well-known and generally accepted
species are still recognized as decent and functional choices for guitar making(Brémaud, 2012;
Pedgley, Norman, & Wood, 2014; Sedik, Hamdan, Jusoh, & Hasan, 2010; Timell, Wimmer,
Roberts, & Aloni, n.d.; Yoshikawa, 2007).
8Both the top and back plate are braced, and the bracing of the top plate is being one of the
critical design parameters(Fletcher & Rossing, 1999b).
2.3.1 Coupled vibrators
The guitar body can be recognized as a system of a coupled vibrator, the plucked string radiate
only small amount of sound directly, but acoustical radiation moves to top plate by the string
exciting the bridge, and from top plate to the air cavity. As an overall result of this energy
transfer process, efficient amount of sound radiates via the vibrating plates and the sound hole.
Figure 2.5 : Simple schematic of guitar.
(Fletcher & Rossing, 1999b)
Figure 2.5 summarizes the working principle of guitar. At low frequencies, top plate transfers the
energy to the back plate via both air cavity and the ribs, the bridge functions as a part of the top
plate, but at the high frequency range, top plate radiates most of the sound, the mechanical
properties of bridge becomes significant.
2.3.2 Modes of vibration of guitar body
A guitar top plate vibrates in many modes. The mode shape and resulting frequencies change
quite remarkably when the braces are added, in addition, they are totally different if the vibration
measurement has taken place with guitar’s edge free, clamped or simply supported.
Figure 2.6 shows the measured mode shapes and frequencies of a guitar plate without braces
and with a free edge, and figure 2.7 presents the observed modes of a plate with traditional fan
bracing. According to Richardson and Roberts (1985), the observed results are in good
agreement (Fletcher & Rossing, 1999b). Various experiments have taken places to understand
the effect of bracing systems towards the modes of vibration of top plates of guitars and violins,
mostly with similar results(Boullosa, 2002; Elejabarrieta, Santamaría, & Ezcurra, 2002; Fletcher
& Rossing, 1999b; Pizzigoni, 2010; Rossing, 2010; Torres & Boullosa, 2009).
9The complex vibrations of guitar body, can be referred as normal modes of vibration, they are
independent in ways which a structure vibrates(Rossing, 2010). They are characterized by the
nodal lines (along the lines the vibration motion is minimum) and by antinodes, where the
vibration motion is maximum. In the standing waves subsection of this chapter, nodes and
antinodes are described briefly, regarding the explanation of these, now the medium is two-
dimensional (guitar plate). The nodes create lines over the plates, and divide the plates into
different sections. When a force is applied to any point on the structure that is not a nodal line,
deflection of the structure creates modal shapes of particular frequency, called operating
deflection shape (ODS) (Schwarz & Richardson, 1999). ODS may result from the excitation of
more than one normal mode. When exciting a structure at a resonance frequency, the ODS will
be determined mainly by one mode, although if several modes have nearly the same frequency,
special techniques may be required to determine their contributions to the observed ODS.
Modes of a structure are functions of the entire structure. A mode shape describes how every
point on the structure moves when it is excited at a point. The distinction between a normal
mode, an operating deflection shape, and a resonance is an important one to make in order to
avoid misunderstanding (Richardson & Technology, 1997; Rossing, 2010).
Modal testing is a systematic method for identification of the modal parameters of a structure,
such as natural frequencies, modal shapes, and modal damping. In guitar testing, the excitation
is usually a sinusoidal force or an impulse. Detection methods include: measuring acceleration
with an accelerometer; measuring surface velocity with a vibrometer; determining deflection by
means of holographic interferometry; determining nodes with Chladni patterns. The
measurement techniques will be investigated in the next subsection.
Figure 2.6 : Vibration modes of guitar without bracings.
(Richardson, Roberts , 1985)
10Figure 2.7 : Vibration modes of plates with bracings
(Richardson, Roberts , 1985)
2.3.3 Coupling between top plate and air cavity
The coupling of the vibrating components at low frequencies has been modeled by several
investigators. If we fix the back plate and the ribs, the guitar can be viewed as a two-mass
vibrating system as shown in figure. 2.8a.The vibrating strings apply a force F(t) to the top
plate, whose mass and stiffness are represented by m p and K p . A second piston of mass m h
represents the mass of air in the soundhole, and the volume V of enclosed air acts as the
second spring. This model was proposed by (Caldersmith, 1995) and by (Christensen &
Vistisen, 1980) and further developed by (Richardson and Roberts, 1985). The two-mass model
predicts two resonances with an anti-resonance between them. These correspond to f1 , f 2 ,
and f A in figure 2.8b.The two resonances f1 and f 2 span the lowest top plate mode f p and
the Helmholtz resonance f A ; that is, f A and f p will lie between f1 and f 2 . In fact, it can be
shown that f1 f 2 f A f p (Ross and Rossing 1979; Ross 1979). If f p f A (as it is in
2 2 2 2
most guitars), f A will lie closer to f1 than to f 2 , as shown in figure 2.8b.
Figure 2.8 : Two-mass model
(Rossing, 2010)
11Coupling of the back plate can be modeled as three-mass model, like in the figure. 2.9. An
additional mass, mb , an additional spring, K b , is presented to represent the stiffness and mass
of the back plate. Figure 2.9b shows three peaks and two dips (anti-resonances) in the
spectrum graph. This model, proved to be true by several experiments carried out by (Rossing
et al, 1985), states the relationship as: f1 f 2 f 3 f A2 f p2 fb2 .
2 2 2
Figure 2.9 : Three-mass model.
(Rossing, 2010)
2.3.4 Low frequency resonances
The frequency response of guitar is characterized as series of resonances and anti-resonances.
In order to determine the vibration configuration of major resonances, it can be driven
sinusoidally at one or more points, and its motion can be observed, mechanically, electrically
and optically. Optical sensing techniques include holographic interferometry (Stetson, 1981),
laser velocimetry (Bulloasa, 1981) and acoustical detection techniques include scanning with a
single microphone (Ross and Rossing, 1979) and using an array of microphones (Strong et al,
1982).
Most of the guitars have three resonance frequencies between 100-250 Hz. It is because of the
coupling between back and (0,0) top modes and A0 (Helmholtz) air mode (Rossing, 2010).
In the lowest frequency of resonance, top and back plate moves in opposite direction and
makes the guitar move like it “breathes” in and out. With the second lowest resonance, both
plates act accordingly, in the same direction. The highest resonance of the three, top and back
plate once again moves in opposite direction but in this case air in the sound hole moves
opposite the way it moves in the lowest resonance. It is observed by (Fletcher & Rossing,
1999b), measuring the resonant frequencies with free edge and with fixed ribs, only effect the
second mode of resonance, as the center of mass moves. First and the third mode of
resonances remain unchanged in frequency, because they involve very little motion of ribs. It
can be assumed that because of the dependence of vibrational modes on the method of
support, the timbre of the instrument depends on the way it is being held by the player.
Above 400 Hz, the effect of coupling is weaker, so the observed resonances are due mainly to
resonances in one or the other one of the plates, usually top plate.
122.4 Sound quality
Most guitar players state that sustain and tonal strength is the most important single criterion for
quality, following by timbre and tone length (Jansson, Vi, Vii, Function, & Tone, 2002). How the
initial sound level and rate of decay in sound is examined in the previous section, stated these
aspects are depended on resonances of guitar body. Jansson, 2002 and Rossing, 2010 states a
questionnaire and its results of “sound quality” of guitars .Tones from recorded music were
analyzed with long time average spectra (LTAS) and was found out that better guitars have
higher level up to 3,000 Hz, and less good guitars tended to have lower level between 400 Hz –
2,000 Hz.
Extensive listening tests were conducted at the Physikalisch-Technische Bundesanstalt in
Germany to try to correlate quality in guitars to their measured frequency response (Rossing,
2010; Meyer, 1983). Some of the features that correlated best with high quality were:
1. The peak level of the third resonance (around 400 Hz);
2. The average level of one-third-octave bands in the range 80–125 Hz;
3. The average level of one-third-octave bands in the range 250–400 Hz;
4. The average level of one-third-octave bands in the range 315–5,005 Hz;
5. The average level of one-third-octave bands in the range 80–1,000 Hz;
6. The peak level of the second resonance (around 200 Hz).
In the next subsection, the effect and influence of design and materials will be examined to
understand the structure and acoustical relationship.
2.4.1 Design and Construction
Pioneering investigators such as Jansson and Meyer, as well as many others, have conducted
experiments to single out the influence of different parts of the guitar to the overall sound
quality. Meyer discovered using fewer struts, reducing the size of the bridge, varying struts
spacing have “desirable” effects (Meyer, 1983).
Jansson created an order of importance list for different parts of guitar, bridge, top plate
thickness and struts. Detailed overview of these three parts is presented in the next section,
under the light of Meyer, 1983, Jansson, 2002, Caldersmith and Williams, 1986 and Richardson
and Roberts, 1985.
132.4.1.2 Bridge, top plate thickness and bracing
The mass of the bridge has a significant effect on top plate. Heavier bridges have more
stiffening effect on top plate, resulting a decrease in the frequency of first top plate resonance.
Handmade Spanish Bridges are considerably lighter and less rigid (Jansson, 2002).
Top plate and strut thickness were studied by finite element method (Richardson and Roberts,
1985). The experiment started with top plate thickness being 2.9 mm, struts being 14 mm high,
5 mm wide. The results of their calculations showed that cross struts have large influence on the
low frequency resonance. Reducing the thickness of top plate, significantly thinning the edge of
the plate has greatest effect of all.
Australian luthier, Greg Smallman is famous because of using lightweight top plates, supported
by lattice braces. He generally used struts of carbon-fiber-epoxy to balsa wood to achieve
higher stiffness-to-mass ratio, high-frequency resonances (“lightness”) (Richardson and
Roberts, 1985).
2.4.1.3 Bracing
Bracing is the construction method to control the flexibility of top plate and its related motion to
back plate. There are various designs acknowledged also some promising experimental
approaches. Well-known designs shown in the Fig. 2.10 are traditional (a) fan bracing (Torres),
(b) Bouchet, (c) Ramirez and (d) crossed bracing.
Figure 2.10 : Bracing designs
(Rossing, 2010)
Most of the classical guitars have symmetrical bracing designs, figure. 2.10 (a,b,d), however
there are number of successful attempts of designing asymmetrical bracing systems. Hauser in
Germany and Ramirez (Fig. 2.10c) are recalled primarily. They have introduced varying
asymmetry to their designs, such as, use of shorter but thicker struts on the treble side to make
the plate stiffer. Three of such designs are shown in the figure. 2.11. The most asymmetric and
probably remarkable one of these designs was proposed by Kasha (1974), figure 2.11c, and
14developed further by some of the famous luthiers such as, R. Schneider and G, Eban (Fletcher
& Rossing, 1999b). Design of Kasha, has a split asymmetric bridge, struts of varying lengths are
positioned close to each other. The waist bar bridges two long struts and the soundhole liner.
Figure 2.11 : Asymmetric designs.
(a) Hauser, (b) Ramirez, (c) Eban
2.5 Wood
Wood selection is the most important parameter in stringed instrument design. The body of a
stringed instrument consists, in general, of a soundboard (top plate) and a frame board (back
plate and/or side plate) (Yoshikawa, 2007). Several investigations and research have been
concluded towards traditional choice of wood for string instruments (Bucur, 2006; Fletcher &
Rossing, 1999a), and also some experimental studies for classifying acoustical properties of
both traditional and untraditional choices of wood (Sedik et al., 2010; Timell et al., n.d.; Wegst,
2006; Yoshikawa, 2007).
This section addresses the components of woods regarding their acoustical quality. Instead of
focusing on experimental studies with the aim of substituting the traditional choices of wood for
string instruments, following section will examine why these traditional wood species were
chosen by luthiers in the first place.
2.5.1 Acoustical quality of wood
The considered parameters for measuring acoustical quality of wood are stiffness, internal
friction, density and in most cases wood texture for aesthetic concerns. One of the most
plausible of these parameters is, c/p (Schelleng, 2005), where c denotes the propagation
speed of the longitudinal wave along the wood grain, and p stays for density of the wood.
Schelleng stated that both the inertia and the stiffness should be the same if the wood will be
substituted with another one, to keep the vibrational properties same. Since the vibration of
wood plate will produce sound radiation, c/p can be called “vibration parameter”, or “radiation
ratio” (Yoshikawa, 2007). In addition to this, Schelleng found a strong correlation between the
resonant Q value and c/p . The Q is the bilateral of loss factor, determined by internal friction
15of wood. Given the significance of vibration damping in musical instruments, internal friction
( tan ) is especially relevant, being an essential material property, as opposed to other loss
mechanisms such as by radiation. Dynamic Young’s modulus E' and its ratio over density,
E' /p called specific modulus (Brémaud, 2012), which is proportional to the square of sound
propagation speed and of resonance frequencies of a piece of given geometry. The anisotropic
features of these properties play a naturally important role in the vibration modes of plates and
frequency spectrum (Bucur, 2006).
However, the contribution of wood to the functioning of different instrument parts often involves
several properties, which can be combined in “material performance indexes.” Frequently used
indexes include;
z cp Ep
(2.5)
E
R
p3
(2.6)
3
E/p
ACE
tan
(2.7)
These indexes are studied by Schelleng(1963), Wegst(2006), Yoshikawa(2007) in detail. For an
explanatory overview; ( z ), “characteristic impedance”, is related to the transmission of one
medium to another, form strings to soundboards or from soundboards to air for example.
“Radiation ratio” described earlier, functions as average amplitude, or loudness. “Acoustical
Conversion Efficiency”, (ACE), is the ability to convert vibrations into sound pressure, shows
itself as peak response.
2.5.2 Wood archetypes for string instruments
Stated in the early stages of this chapter, string instruments radiate through resonators. The
string vibration is transmitted through a bridge to the soundboard. The material of the
soundboard should allow for adequate transmission of energy from the string, and be able to
radiate efficiently.
The choice of spruce resonance wood for top plate of guitar is made carefully, according to
empirical rules (Bucur, 2006); A narrow grain spruce is preferred (2 mm annual ring width),
although cedar of Lebanon or Canadian red cedar (Tsuga heterophylla) could be used as well
as western cedar (Thuja plicata). Numerous studies are driven towards acoustical properties of
woods for top of violins, but those results will not be suitable for guitar top plates, as guitars
have considerably flat tops, unlike violins. Consequently, the stiffness required is different
(Bucur, 2006; Wegst, 2006).
Spruce selected as high-grade has a quite low density ( p 0.45gcm 3 ) and a very high specific
1
modulus of elasticity (around 26 36MPam3kg1 , leading to sound velocities up to 6000ms )
(Brémaud, 2012; Bucur, 2006). Internal friction of spruce is negatively correlated with radiation
ratio. Considering acoustical performance, high E' /p , with a low density leads to high radiation
16ratio (eq.2.6), and with low internal friction, higher acoustical efficiency (eq.2.7) is obtained.
According to (Yano, Kajita, & Minato, 1994), from the point of view of coincidence frequency
peaks of plates (100 – 250 Hz), high E' /p should ensure sufficient radiation in low frequencies
(Brémaud, 2012; Bucur, 2006; Rossing, 2010). As a light material, spruce has moderate
characteristic impedance (eq.2.5), which is advantage for sound transmission into the air
(Wegst, 2006). The geometry of guitar blanks allows testing “by hand” damping and
longitudinal/radial stiffness. Classification is just slightly better defined by basic acoustic
properties than for violins (Yano et al., 1994). In the study of (Brémaud, 2012), she concludes
these outcomes as follows : “Altogether, these different studies suggest that (i) wood selection
and qualification by string instrument makers is by essence multi-criteria; (ii) the relative
importance of mechanical -acoustical properties depends on the degree of freedom in the
geometry of the instrument and/or of blank plates; (iii) properties of different instrument making
grades can overlap, but form a distinct group within the Picea abies variability, with much higher
than average E’/q and anisotropy, and low tand.”
Table 1: Acoustical properties of spruce with comparison to several species of Picea family.
(Brémaud, 2012)
17Chapter 3
Methodology
In order to study the acoustical features of classical guitars, the study is divided into 3 stages:
Measurement, classification and feature extraction from the chosen descriptors and acoustical
property investigation. The results are examined to find a reliable difference that will suffice to
distinguish guitars from each other while creating the foundation of the sound quality model that
will be proposed based upon the features extracted.
3.1 Measurement
Two different recording techniques are used: Experimental modal analysis and sine-sweep and
noise response measurements. The aims of these techniques are different, EMA (experimental
modal analysis) is a vibration measurement method which is focused on the mode responses of
the guitar top plate however capturing impulse responses by microphone array aims to preserve
the “sound” of the guitar (nodes, anti-nodes), by obtaining the acoustical properties of guitar
body.
3.1.1 Experimental Modal Analysis
EMA consists of a hammer (with a frequency response measurement capsule in the head), and
an accelerometer being attached to the bridge of the guitar to capture the impulse responses
created by the hits of the hammer. All equipment for this particular study is provided by Bruel &
Kjaer.
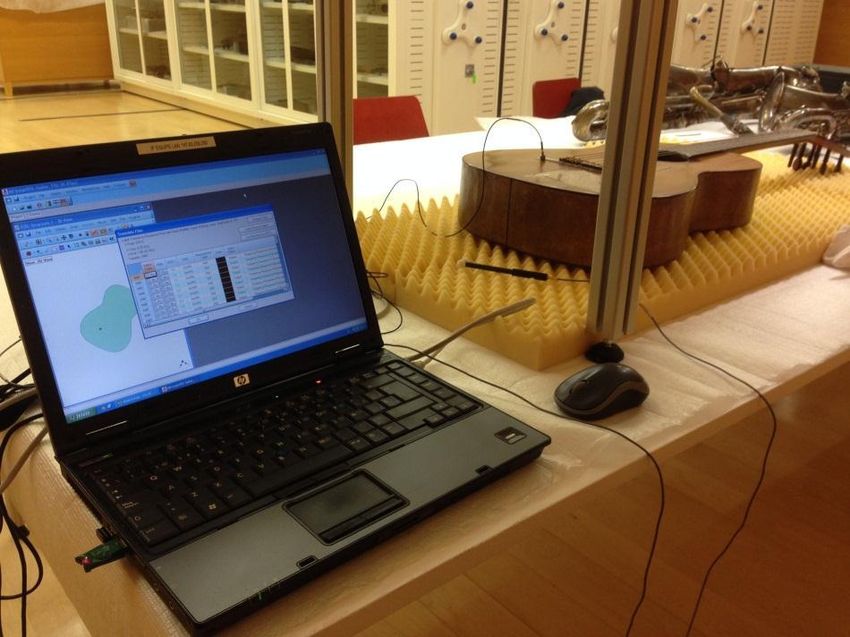
The guitar is laid upon an absorption foam, inside a rectangular prism structure. Top layer of the
prism is divided into points that are 1 cm away from each other, and each point is pierced so
laser light can get through the layer to the guitar top plate, from the correct point, which shows
where to hit hammer on. The overall setup is shown in the fig. 3.1.
Above the top layer of the structure, there lies a paper where the border of the guitar body is
drawn, with the points, so the points in the paper and layer correspond to each other.
18Limpid paper, square shaped is used to minimize the damage of hits, by putting between
hammer and guitar for every hit. Frequency response of each impulse is displayed
instantaneously on the computer screen, by the accompanying software. Even though it is
impossible to keep the frequency responses same for every hit, as they are manual actions,
momentary visualization creates an opportunity for correction and repeating the action for each
impulse.
For every impulse, two frequency response functions are obtained, one for the impulse and
second one for the response. Impulse response for Torres 625 at point 142 is shown in the
figure 3.2. This measurement technique is applied on two Torres guitars, Torres 625 and Torres
626.
Figure 3.1 : Experimental Modal Analysis (Torres 625)
Figure 3.2 : Impulse response of Experimental Modal Analysis of point 14, Torres 625
19In addition to vibrational and acoustical measurements, physical measurements are obtained
from each guitar to use for the third stage of the methodology.
3.1.2 Sine-Sweep and Noise Responses
Second measurement method is based on sine-sweep and steady state response techniques
usually used for room acoustics. Loudspeaker and an omni-directional calibration microphone is
patched through the soundcard and connected to computer, being operated by designated
digital audio workstation. Guitar is positioned as it is being played because of the microphone
positioning concerns. Back plate is damped by absorption foam and strings are unattached. The
surrounding environment is also covered with the same foam to reduce the noise and wall
reflections. Loudspeaker is positioned in front of the sound hole while the microphone is inside
the guitar body in two different positions as the signal chain illustration states in figure 3.3.
Figure 3.3 : Signal chain and microphone/loudspeaker positioning.
This measurement technique is applied on two different guitars, with 27 audio files generated for
each position, consisting of white noises, pink noises, noise sine-sweeps, log sine-sweeps,
linear sine-sweeps and impulses covering the frequency range 40 Hz-1000Hz to make sure
everything needed is recorded.
20Torres 625 and Labrador are the two guitars recorded. The latter one is chosen specifically for
two reasons; it is going to be restored after the experiment, so the difference can be observed
and secondly, it is a romantic period guitar which is apparently smaller in size so it will
contribute to the physical aspects and acoustical investigation of this study. (Fig.3.4)
Figure 3.4: Recording setup for “Labrador”
3.2 Classification and Feature Extraction
For the second stage of the methodology, the captured audio files from both measurements are
run through Essentia descriptors to Weka, to distinguish guitars from each other. The selected
descriptors are used to extract features of the audio files in addition to the global spectral low-
level descriptors. The intention is to observe the behavior of the descriptors towards these audio
files, and choose the sufficient ones for the third stage of the study.
3.3 Acoustical Property Investigation
Third stage of the methodology aims to investigate “Physikalisch-Technische Bundesanstalt,
Germany” proposal about sound quality prediction of guitars which is cited by Rossing, 2010;
Meyer,1983; Jansson,2002; as well as many other minor publications related. The proposal is:
1.The peak level of the third resonance (around 400 Hz);
2.The average level of the one-third octave bands in the range 80-125 Hz,
3.The average level of one-third octave bands in the range 250-400 Hz;
4.The average level of one-third octave bands in the range 315-500 Hz;
5.The average level of one-third octave bands in the range 80-1000Hz;
5.The peak level of the second resonance(around 200 Hz);
21These are the important aspects of guitar sound quality, as it is mentioned in the chapter 2. The
proposal states that, the results of these aspects should be higher to achieve a high quality
sound from a guitar.
“Sound Quality” statement is replaced with “acoustical property” in this study because of the
guitars being worked on are historically important but old guitars. Their “sound quality”
measures are related to time they belong to, and the technology and knowledge in those years.
The results of all these measurements and features will be presented in the chapter 4, results
section of the paper, and examined briefly to build a sound quality model that relates the
physical aspects, construction, type of material used and resonances of the guitar body.
22Chapter 4
Results and Discussion
Before extracting the sound features of recordings, WEKA, machine-learning software is applied
to classify guitars with Essentia descriptors as mentioned in previous chapter. Spectral features
of the guitars are assumed to make real difference and this prediction turned out to be true in
addition to ERB-Bands and Mel-Bands. The sine-sweep and noise recordings from the first
position (under the bridge, inside the guitar body) are used. For the sine-sweep recordings the
classification score with Bayesian algorithm is over 80%, and 75% for noise recordings. The
successful descriptors are then used to extract features and investigate the “sound quality”
model accordingly.
4.1 Feature Extraction
ERB-Bands and Mel-Bands descriptors are extracted from sine-sweep recordings for Torres
625 and Labrador for the 1st (Fig 4.1), 2nd (Fig 4.2) ERB-bands and Mel-bands (Fig.4.3)
(“Physikalisch-Technische Bundesanstalt, Germany”) :
Figure.4.1 : Torres 625 (left) peak position at 74 Hz and Labrador (right) peak position at 71 Hz
23Figure 4.2 : Torres 625 (left) peak position at 423 Hz and Labrador (right) peak position at 488 Hz
Figure 4.3 : Mel Bands spectrum plot for Torres 625 (left) and Labrador (right)
Spectral centroid, spread and variation plots are shown below in figure 4.4 for two guitars.
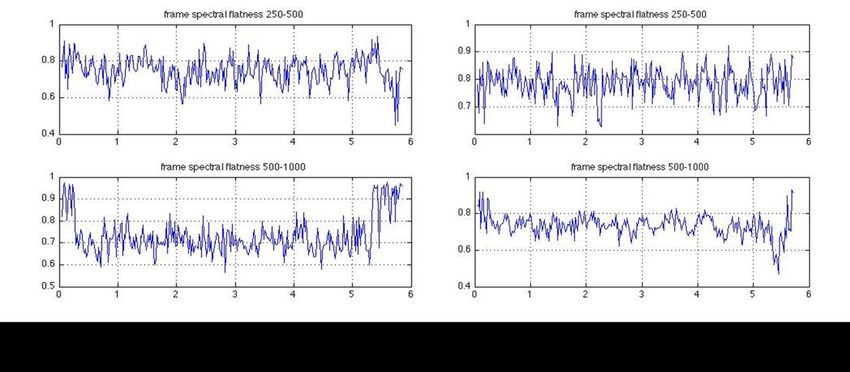
Spectral flatness plots are also presented on figure 4.5.
24Figure 4.4: Spectral centroid, spread and variation plots for Torres 625 (left) and Labrador (right).
Figure 4.5 : Spectral flatness plots are are presented for Torres 625 (left) and Labrador (right).
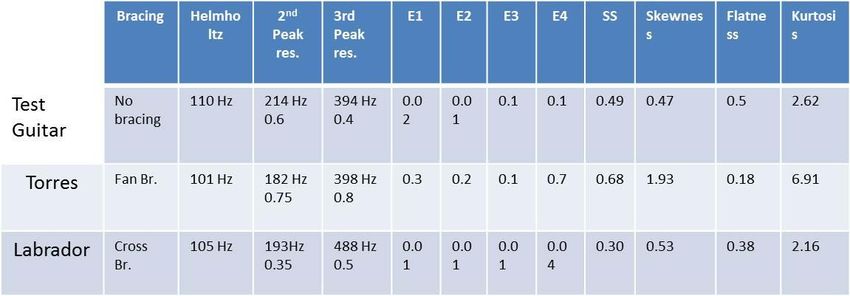
In addition to these information, the average levels of the 1/3 octave bands in the different
ranges, spectral skewness, spectral kurtosis and peak levels of Helmholtz resonance, 2nd and
3rd resonances are computed and presented in the table below (Table 2).
25Table 2 : Spectral features of Torres 625 and Labrador.
This table above summarizes the collected data cited from “Physikalisch-Technische
Bundesanstalt, Germany”.
4.2 Physical properties
Physical properties of guitar bodies are also examined for the study. Relationship between the
volumes of these three guitars is as follows:
Torres 625 (V1) > Test Guitar (V2) > Labrador (V3).
The bracing of these guitars are; fan bracing (Torres 625), without bracing (test guitar), and
cross bracing (Labrador) (Fig. 2.10). There are two set-backs which makes the bracing
comparisons in this study invalid: (1) Test guitar is not constructed with a bracing inside, so the
top plate and back plate are hold by ribs to each other only and (2) Labrador is in need of
restoration (that is why it is chosen, so a second measurement can be applied after restoration
is complete) so the bracing was not functioning properly when the recordings were made. The
bracing types are still noted for preserving the information about the guitars which may be useful
for further studies.
4.3 Wood type and material performance indexes
Literature review on the topic of the wood type and its acoustical performance as a “musical
instrument” is presented in the chapter 2. Table 1. at the end of the chapter 2 presents common
soundboard-quality woods used in string instruments production.
Sound board-quality woods are not only the best sound radiators of all, but they also have low
characteristic impedance. A low characteristic impedance is beneficial in sound transmission
into the air. The impedance of spruce (picae sp.) is very similar to that of maple, the traditional
material for the bridge, back plate and ribs. Maple also radiates sound well; its characteristic
impedance is sufficiently high to act as a reflector for the air oscillations within the corpus of the
instrument and to help them radiate into the room through the sound hole in the top plate.
26Common beliefs are that regular playing of the instrument and aging of wood improves the
acoustical properties of musical instruments. Guitars that are exhibited in museums have not
been played for long time and it should be assumed that they are not in perfect shape regarding
the aging of wood. However the new ones need to be “played-in”.
Humidity and creep are believed to play an important role in aging effect of wood on sound.
Hunt and Balsan (1996), Beavitt (1996), Segerman (1996, 2001) presents several experiments
in their studies regarding the “stiffness” and change in “loss coefficient” according to humidity.
Summarizing the state -of-the-art in this chapter is necessary as this study involves museum
instruments, which were being exhibited for some decades now. The effect of humidity and
ageing is ignored for this study, so the default values corresponding to the wood type are used
in the material performance index table below (table 3).
Table 3: Material performance Index and Size of Torres 625, Test Guitar and Labrador.
4.4 General observations
The values represented in table 2, should be observed under the light of physics of string
instruments briefly summarized in chapter 2. For instance, Torres 625, has a Helmholtz
resonance frequency at 101 Hz, lowest of the three guitars. Flexibility of top and back plate,
mostly related with bracing structure and size and wood type, states the range that a guitar is
allowed to “breathe”. 1st resonance’s (Helmholtz) position, 101 Hz in this case, indicates that
Torres 625 can be regarded as the “richest” guitar in spectrum among the other two. Spectral
spread value and spectral kurtosis also supports this assumption.
Spectral skewness generally may be interpreted as high frequency component indicator. For
guitars, the same value should be interpreted slightly differently. Guitar body resonances do not
occur approximately above 600-800 Hz, as the string forces are not sufficient enough to vibrate
the body. High spectral skewness values are indicators of the minimum low frequency
responses of the plates (top plate in this case) because of the in-harmonicity of string
instruments.
27You can also read