THE IMPACT OF ENERGY PERFORMANCE CERTIFICATES ON PROPERTY VALUES AND NEARLY ZERO-ENERGY BUILDINGS - An analysis for market professionals, owners ...
←
→
Page content transcription
If your browser does not render page correctly, please read the page content below

SEPTEMBER 2016

THE IMPACT OF ENERGY PERFORMANCE
CERTIFICATES ON PROPERTY VALUES AND
NEARLY ZERO-ENERGY BUILDINGS
An analysis for market professionals,
owners and tenants
Authors
Jose Santos, CIMME
Andrzej Rajkiewicz, NAPE
Indira de Graaf, TU Wien
Raphael Bointner, TU Wien

Review and editing team
Raphael Bointner, TU Wien
Meredith F. Davis, CIMME
                                                                                       Legal Notice
Andrzej Rajkiewicz, NAPE
                                                                                       The sole responsibility for the content of this publication lies with the authors. It does
                                                                                       not necessarily reflect the opinion of the European Union. Neither EASME nor the
Graphic design
                                                                                       European Commission is responsible for any use that may be made of the information
Ine Baillieul
                                                                                       contained therein
                                                                                       All rights reserved; no part of this publication may be translated, reproduced, stored in
                                                                                       a retrieval system, or transmitted in any form or by any means, electronic, mechanical,
                 Financial support for ZEBRA2020 has been received from the
                                                                                       photocopying, recording or otherwise, without the written permission of the
                 European Union’s Intelligent Energy Europe Programme under
                                                                                       publisher. Many of the designations used by manufacturers and sellers to distinguish
                 Contract N°: IEE/13/675.S12.675834.
                                                                                       their products are claimed as trademarks. The quotation of those designations in
                                                                                       whatever way does not imply the conclusion that the use of those designations is
                                                                                       legal without the consent of the owner of the trademark.
2016 © All rights reserved – All photos/graphics remain the copyright of ZEBRA2020 –
Any use is subject to consent by BPIE or TU Wien.

WWW.ZEBRA2020.EU

                                                                                                                                                                                    EPC Impact | 3
ABOUT ZEBRA2020                                                                   EXECUTIVE SUMMARY
    NEARLY ZERO-ENERGY BUILDING STRATEGY 2020                                         This report has been developed with two independent investigations: a survey
                                                                                      market analysis among real estate agents and an assessment of regression
    Sustainability of the European society and economy will be based on renewable     study on EPC price surpluses. Therefore, conclusions have been made in these
    energy and high resource efficiency. For the building sector, this implies the    two areas.
    large scale deployment of nearly zero-energy buildings (nZEB). European
    legislation (recast Energy Performance of Buildings Directive) makes nZEBs a      On one hand, the results of the real estate agent`s survey provides significant
    standard for new buildings by 2020. Therefore, the key objective of ZEBRA2020     recommendations on how to increase the impact of EPCs on the property value
    is to monitor the market uptake of nZEBs across Europe and provide data and       and how to overcome obstacles in wider use of EPC`s across the EU. For instance,
    as well as recommendations on how to reach a high level nZEB standard. The        in some countries EPCs are not yet mandatory at all stages of real estate use (e.
    resulting ZEBRA2020 observatory for nZEBs will be based on market studies         g. new promotions, sales and rental market transactions, and renovations). In
    and various data tools and will thereby generate data and evidence for policy     the countries where EPCs are already mandatory, this accreditation might be
    evaluation and improvement.                                                       better respected if EPCs were also requested by lawyers/notaries as witnesses
                                                                                      of real estate transactions. Bureaucratic hurdles in issuing EPCs will be reduced
    ZEBRA2020 covers 17 European countries and about 89% of the European              when the evaluation of energy performance certificates is well conducted in
    building stock and population. Thus, it is actively contributing to meeting the   terms of reliability. Improved training and qualifying of the certifiers and proper
    ambitious target of 100%- share of nZEBs for new buildings from 2020 and a        quality control would increase reliability and credibility of EPCs.
    substantial increase of deep nZEB renovations.
                                                                                      On the other hand, the regression results on EPC price surpluses have
    Learn more at www.zebra2020.eu                                                    demonstrated the existence of a price surplus due to energy efficiency in all
                                                                                      but one of the countries analysed. In addition, in cases where sufficient data
                                                                                      on the rental sector was available, an increased surplus for the sales sector
                                                                                      was observed. However, the accuracy of the surplus values is restricted by
                                                                                      limited datasets that cause “omitted variable” bias. As a result, quantitative
                                                                                      cross-country comparisons could not be made. Nonetheless, areas for further
                                                                                      research have been presented that would enable regular and increasingly
                                                                                      accurate evaluations of the EPC scheme. In addition, issues have been identified
                   Co-funded by the Intelligent Energy Europe                         with the current EPC regulations, such as the fact that the scheme does not
                   Programme of the European Union
                                                                                      fully break down the imperfect information market barrier, or account for the
                                                                                      split-incentive dilemma.

4 | EPC Impact
CONTENTS                                                              CONTENTS
                 1. INTRODUCTION 						p 8                                             4. STUDY ON EPC PRICE SURPLUSES 				p 34
                                                                                          4.1   APPLIED METHODOLOGY					34
                 2. FINDINGS ON THE IMPACT OF EPCS 			                          p 10      4.2   DATASET FOR REGRESSIONS					36
                    2.1    EPC PRICE SURPLUSES						p 11                                  		    4.2.1   LIMITATION OF DATA					36
                    2.2    KEY FINDINGS IN NON-EU LABELLING SYSTEMS			          p 12      4.3   ASSESSMENT OF EPC IMPACT					36
                    2.3    SURVEYS REVIEWS ON THE SUCCESS OF THE EPC SCHEME     p 14      		4.3.1       NETHERLANDS CASE					37
                    2.4    SPLIT-INCENTIVE DILEMMA					p 15

                                                                                       5. CONCLUSIONS			          				p 38
                 3. REAL ESTATE AGENTS SURVEY 				p 16
                    3.1    MOTIVATION FOR THE SURVEY					16                            6. RECOMMENDATIONS		       				p 40
                    3.2    SURVEY SAMPLING						17
                    3.3    RESPONDENT PROFILE						17                                  7. REFERENCES				 				p 42
                    3.4    RESPONSE ABOUT LEGAL REQUIREMENTS OF EPCS		          18
                    3.5    RESPONSE ABOUT INFLUENCING FACTORS IN THE CHOICE
                    		OF PROPERTY							19
                    3.6    RESPONSE ABOUT PRESENTATION, RELIABILITY
                    		AND USEFULNESS OF EPCS					21
                    3.7    RESPONSE ABOUT REAL ESTATE MARKET IN RELATION TO EPCS 24
                    3.8    RESPONSE ABOUT OBSTACLES IN RELATION TO EPCS		       27
                    3.9    RESPONSE ABOUT BENEFITS IN RELATION TO EPCS		        29
                    3.10   RESPONSE ABOUT REGULATIONS IN RELATION TO EPCS		     31

6 | EPC Impact                                                                                                                  EPC Impact | 7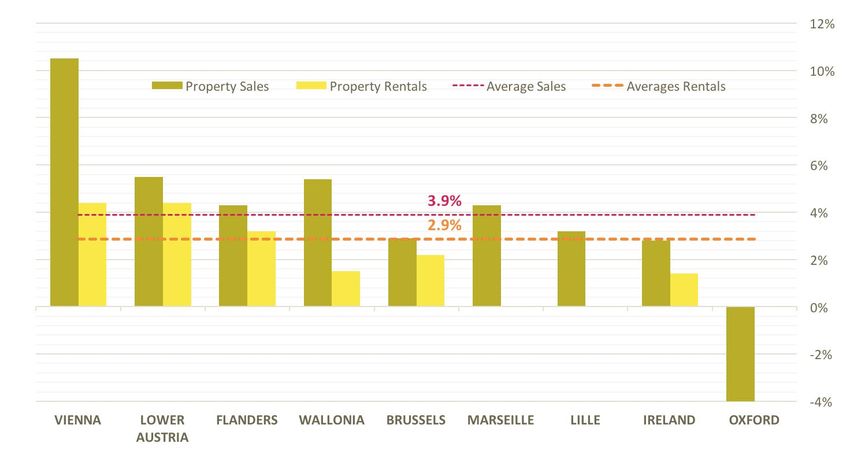
“RESIDENTIAL
BUILDINGS
ACCOUNT FOR
75% OF THE EU
BUILDING STOCK
(BPIE, 2011).”
diverse, largest and most cost-effective in the decision-making in this sector, more do not account for the low turnover in the
mitigation opportunities in buildings” so than in the non-residential sector. As a housing stock.
1 INTRODUCTION
(Levine et al. 2007). This is in part, due result, additional benefits which could
to the fact that the housing sector - arise from an increased awareness in the In Europe, the energy efficiency rating is
unlike other energy intensive sectors - is importance of energy efficiency are likely given in Energy Performance Certificates
dominated by second-hand, inefficient to be further reaching in policies that (EPCs) and used as a proxy for the energy
Buildings account for 40% of energy consumption in the EU, making the building
“DESPITE THE goods, which therefore have a high target the residential sector. However, efficiency of a dwelling. The main target
sector the single largest contributing sector (European Commission 2016). This of this report is to assess whether energy
CURRENTLY number is rising, with energy consumption having increased from approximately
potential for efficiency improvements. a potential negative consequence of
efficiency (through EPCs) is capitalised in
INCREASING TREND IN 400 Mtoe to 450 Mtoe in the last 20 years (BPIE, 2011). As a result, improving the This report will focus exclusively on
energy efficiency capitalisation is the
the housing market of selected European
fact that it could prevent those in energy
ENERGY CONSUMPTION energy efficiency of buildings is seen as a key area in which EU and EEA member energy consumption in the residential poverty from living in energy efficient countries. To achieve this target, two
IN BUILDINGS, THE states can reach their emissions and energy consumption targets. building sector. The primary reason independent investigations have been
dwellings, as energy efficiency becomes
SECTOR HAS BEEN for this focus is the fact that residential increasingly correlated with price. carried out: a survey market analysis
The EU has committed itself to the following targets by 2030 (European
buildings account for 75% of the EU among real estate agents (see section 3)
IDENTIFIED AS HAVING Commission, 2016b):
building stock (BPIE, 2011). As a result, In addition, this report will focus on the and an assessment of regression study
1. 40% reduction in greenhouse gases, relative to 1990 levels
THE HIGHEST COST- residential buildings alone make up 27% existing housing stock, rather than policies on EPC price surpluses (see section 4).
2. Minimum of 27% share of renewable energy consumption
EFFECTIVE POTENTIAL 3. Minimum of 27% energy savings, relative to business-as-usual projections
of total energy consumption (BPIE, 2011). aimed at increasing the efficiency of new In the first case, the real estate agent’s
FOR ENERGY SAVINGS Furthermore, policy regimes that target buildings. This is, again, primarily due to professional opinion has been collected
EEA Member States that are not members of the EU have committed residential buildings have a number the fact that this is the area that offers on what households consider to be the
BY 2020.” of wide-reaching potential benefits in that highest potential for savings due to main factors in selecting properties to
themselves to similar climate and energy targets. For example, Norway adopted
the EU’s 40% emissions reduction target in advance of the Paris Conference in addition to the fulfilment of energy and increased energy efficiency. The IPCC’s buy or rent. In the second, a result of
December 2015 (Norway Mission to the EU, 2015). climate goals, including a “blend of direct Fourth Assessment Report identified each-country price surpluses due to EPCs
and indirect and monetary and non- that the highest potential for emissions for sales and rental transactions has been
Despite the currently increasing trend in energy consumption in buildings, monetary benefits” (Fuerst et al., 2015, savings by 2030 resided in the retrofitting obtained by performing a regression
the sector has been identified as having the highest cost-effective potential p. 147) to home dwellers. Primarily, if of existing buildings and replacement of analysis. This analysis can provide
for energy savings by 2020 (European Commission, 2006). This finding was the negative externality of poor energy energy-intensive equipment (Levine et significant results and recommendations
supported on a global scale, with the review of 80 studies in the IPCC’s Fourth performance were to be fully accounted al., 2007). This high potential is a direct on the level of capitalisation of energy
Assessment Report concluding that 29% of projected emissions by 2020 could for in the market, home-dwellers would result of the previously discussed irregular efficiency in the real estate market.
be reduced cost-effectively in the residential and commercial building sectors, have real incentives to consider energy nature of the housing market, whereby
therefore making it the sector with the highest potential in the IPCC report efficiency in transaction decisions. houses have a relatively long lifetime Also, a section of findings from
(Levine et al., 2007). Such a market transformation can be as compared with assets and goods in background investigations on the impact
equivalently conceptualised as the full other markets. Indeed, it is estimated of EPCs in the real estate property are
Transitioning towards low carbon fuels and managing emissions are two provided (see next chapter 2).
options that could be pursued as ways of meeting the first two EU targets capitalisation of the benefits of energy that between 75-90% of the current
without the need to alter energy consumption. However, emphasis has been efficiency in the market. The key benefit building stock will still be standing in
placed on energy efficiency in the building sector as it “encompasses the most of this transformation taking place in 2050 (European Commission DG Energy,
the residential market is that a larger 2015). Policies focussing primarily on new
proportion of the population is involved buildings are therefore insufficient as they
8 | EPC Impact EPC Impact | 9
Figure 1 – Most common energy-labelling scheme in Europe for Energy Performance Certification of buildings
Source: Illustration from E3G platform (agency of independent experts on climate diplomacy and energy policy)
MOST COMMON
ENERGY-LABELLING
SCHEME IN EUROPE
FOR ENERGY
PERFORMANCE
CERTIFICATION OF
BUILDINGS
2 FINDINGS ON THE Our findings also consider the market
effects of other energy performance
A brief summary of this section:
• literature that specifically investigates
“ENERGY CLASSES
IMPACT OF EPCS labels that have been developed for
commercial and residential buildings.
price surpluses due to EPC ratings in
EU countries (2.1)
These include, for instance, the Green • some key findings of similar studies
ON EPCS INFORM A Our findings start by assuming that most EPC systems across Europe differ Mark Certification (GMC) in Singapore about price surpluses in other non-EU
POTENTIAL PURCHASER from each other, but some having similarities even while using international and ENERGY STAR® in the United labelling systems (2.2)
standards. The main focus considered in these findings is the degree of States, both of which differ from the • research of surveys reviews on the
OR TENANT ABOUT
success in implementation of EPCs in EU Member States. In particular, these EPC system in that a minimum green success of the EPC scheme (2.3)
THE ENERGY QUALITY studies investigate: standard must be met in order for a • arguments about the split-incentive
AND CONSUMPTION IN 1. Level of public understanding and awareness of EPC labels, label to be awarded (see section 2.2 for dilemma among landlords and
BUILDINGS.” 2. Extent to which EPCs have been taken into consideration in transactions more information). tenants related to energy efficiency
and home improvements, improvements (2.4).
3. Effect that EPCs have had on property prices.
2.1 EPC PRICE SURPLUSES
The requirement of issuing EPCs has been introduced by the directive 2002/91/
EC of the European Parliament and Council concerning the energy performance
of buildings. Its primary aim was energy saving, due to the amount of energy Intelligence Service et al., 2013) was one
The price surpluses due to EPC ratings to a one-letter improvement remained
being wasted resulting from using inappropriate technologies, improper of the first to analyse price surpluses
in EU countries will be examined here. constant across the EPC scale and
materials or building design errors. for multiple EU countries in a single
Almost all of the studies that estimate hence, did not estimate the different
EPCs usually assign energy classes to individual buildings, which inform a investigation. Furthermore, this report
price surpluses due to energy efficiency surpluses resulting from improvements
potential purchaser or tenant about the energy quality and consumption. was able to make estimations of rental
ratings use regressions of Rosen’s hedonic between different letters (e.g. from G to
In Austria, France, Norway, Romania, Italy and Spain, the EPC shows the energy surpluses in Austria, Belgium and Ireland
method (Rosen, 1974). The most important F vs from B to A). Whilst this represents
performance of real estate on a scale from A to G, similarly to the system used and therefore able to compare rental and
studies in this field represent the body of a simplification, as most quantitative
for electronic devices and household appliances in Europe. Whereas in Poland work developed in detail in the report
sales surpluses in these countries. In all studies have confirmed the fact that the
and Germany the energy performance is rated on a scale from 0 to over 1000. three countries, the rental surplus was
version for policy makers. However, this relationship between rating and price
found to be smaller than the sales surplus,
version only summarizes the main results surplus is “not expected to be uniform”
highlighted in an assessment study which provides empirical confirmation (Fuerst et al., 2016, p. 29), the method is
produced by the EU Commission DG of the well-documented split incentive valid in giving an average indication of
Energy. problem, which will be further elaborated surpluses in each country. The results
below. The report made the assumption obtained are summarised in Figure 2.
The EU Commission DG Energy report that the increase in the price surplus due
on price surpluses due to EPCs (Bio
10 | EPC Impact EPC Impact | 11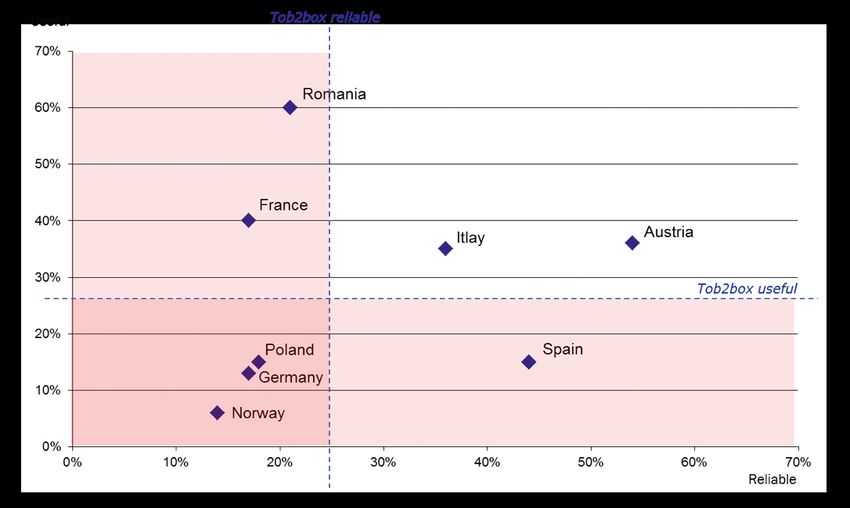
Figure 2 – Property price surpluses due to EPC ratings in some European cities or countries Table 1 – Summary of key findings for studies on the impact of non-EU energy efficiency labels on housing prices
Source: Summary of results from the Bio Intelligence Service Report (Bio Intelligence Service et al., 2013) Source: developed by ZEBRA2020 partners
RESEARCH COUNTRY/ ENERGY EFFICIENCY
KEY FINDINGS
STUDY REGION LABEL
1. 4 levels: GMC (lowest), GMG, GMGP, GMPL (highest)
(Addae-Dapaah 2. 12 hedonic models developed to estimate surpluswes.
Singapore Surplus identified for sales prices with GMC label (relative
and Chieh, 2011)
to non-GMC) but mixed results were found for higher rated
labels (market confusion)
1. EER Scale: 1-6
(Australian Bureau ACT
of Statistics, 2008) (Australia) 2. Surpluses (sales) relative to a 1-rated home: 1.6% (EER2), 3%
(EER3), 5.9% (EER4), 6.3% (EER5), 6.1% (EER6)
1. 1-100 scored
Colorado
(Bloom et al., 2011) 2. Price surplus for homes with an ENERGY STAR® label: $8.66/
(US)
ft2 (relative to homes without one)
2.2 KEY FINDINGS IN NON-EU LABELLING SYSTEMS (Deng and Average price surplus (sales) of GMC homes relative to non-
Singapore
Quigley, 2010) GMC: 15%
The existing literature clearly finds a compare these findings to those of the other studies confirm the positive
positive relationship between EPC similar studies carried out into the effect relationship between the two attributes,
ratings and price surpluses in the housing of non-EU energy rating schemes on greater confidence can be attributed to (Kok and Kahn, California Price surplus for homes with an ENERGY STAR® label: 9%
market. All of the findings presented housing prices. This comparison acts the assertion that it is the label itself that 2012) (US) (relative to homes without one)
above are statistically significant and as a control against other factors that is causing observed market changes. The
have been subjected to robustness may be causing a positive relationship key findings from a selection of these
checks. However, it is instructive to between house price and EPC rating. If studies are presented in Table 1. Sales surplus of labelled homes compared with unlabelled
Zurich homes:
(Salvi et al., 2010)
(Switzerland) • 7% (family homes)
• 3,5% (flats)
(Yoshida and (Tokyo, Sales deficit of labelled (compared with unlabelled)
Sugiura, 2010) Japan) condominiums: 5.6%
Sales price surplus of “green” homes compared with non-
“green” homes: 17.7% (initially)
Beijing But:
(Zheng et al., 2011)
(China) • -11% (resale price)
• -8.5% (rental price)
12 | EPC Impact EPC Impact | 13
The above studies, which cover a               surpluses in relation to higher levels of       significant when explanatory variables           The level of implementation of                The level of trust of the information             “STUDIES IN THIS
range of global energy efficiency              energy efficiency. It has been argued that      that are correlated with energy efficiency       improvement         recommendations           contained       within      EPCs:        The
                                                                                                                                                                                                                                                FIELD HAVE FOUND
labelling schemes, show that statistically     the deficit observed in the first report        are omitted from the regression. The             provided in EPCs: Studies in this field       Netherlands is one of countries that has
significant surpluses are observed in          by Zheng et al. could be the result of a        omitted variable can be difficult to control     have found evidence of home-owners            suffered a lack of trust in EPCs, which is        EVIDENCE OF
most cases. Two outstanding findings           perception of high maintenance costs in         because of this bias, as it often results from   carrying out energy efficiency measures       reflected by the fact that adoption rates         HOME-OWNERS
that do not follow the pattern are found       energy efficient homes (de Ayala et al.,        a lack of data. As a result independent          as a result of the EPC of their dwelling      of the EPC scheme were observed to                CARRYING
in the studies carried out by Zheng et         2016). Yoshida and Sugiura, the authors         tests between this attribute and energy          (Murphy, 2013) (Tigchelaar et al., 2011)      decrease over time after an initially strong      OUT ENERGY
al. (Zheng et al., 2011) and Yoshida and       of the second report, also suggested that       efficiency usually cannot be carried out.        (Kjaerbye, 2009) (NHER, 2009). However,       level of implementation (Brounen and
Sugiura (Yoshida and Sugiura, 2010).           the deficit may be the result of perceived      However, control mechanisms have been            weak evidence exists to suggest that the      Kok, 2011, Murphy 2012, Tigchelaar et al.,
                                                                                                                                                                                                                                                EFFICIENCY
Both studies are often included in the         high maintenance costs of energy efficient      developed for variables that are thought         EPC recipients carry out more energy          2011). This example can be attributed             MEASURES AS A
analysis of other investigations, which        homes as well as uncertainty over the           to be correlated, such as location (Fuerst       efficiency renovations than non-EPC-          to other countries and highlights the             RESULT OF THE
seek to explain the discrepancy between        quality of building material. In addition,      et al., 2016).                                   recipients.                                   importance of strict valuation standards          EPC OF THEIR
these findings and the wider body of           the authors identified omitted variable                                                                                                        and training of personnel.
literature that consistently estimates price   bias as a potential cause, which becomes
                                                                                                                                                                                                                                                DWELLING.”

2.3       SURVEYS REVIEWS ON THE SUCCESS OF THE EPC SCHEME                                                                                      2.4      SPLIT-INCENTIVE DILEMMA

Despite the geographical scope of the          The extent to which the labels have                                                              This dilemma encompasses situations in        Since landlords generally do not pay           2012). As a result of this market barrier,
studies relating specifically to the EPC       been incorporated into decision-                                                                 which investment decisions are hindered       energy bills, it is in their interest to       the market transformation impact of the
scheme being limited, the literature           making processes: Investigations in the
                                                                                                  “INVESTIGATIONS                               due to the fact that the flow of benefits     provide house components as cheaply            EPC and other energy efficiency schemes
discussed so far in this section reflects      housing market have tended to find that                                                          and investments are unequally divided         as possible. On the other hand, tenants        are predicted and recorded to be less
the key observation that energy                EPCs play a minor role in the consumer             IN THE HOUSING
                                                                                                                                                among actors in a given transaction. In the   have the incentive of maximising the           for rental markets than for sales markets
efficiency labelling schemes are being         decision-making processes (Amecke,                 MARKET HAVE                                   case of energy efficiency improvements        energy efficiency of their home so             (Fuerst et al., 2016) (Cajias and Piazolo,
capitalised in transactions in housing         2012) (Backhaus et al., 2011) (Murphy, 2013).      TENDED TO FIND                                in the housing market, the split-incentive    as to minimise energy bills. However,          2013) (Kholodilin et al., 2014).
markets around Europe.                         Key factors behind this include: the lack          THAT EPCS PLAY                                dilemma surrounds the differing interests     tenants generally lack control over home
                                               of implementation of EPCs, complexities
A number of studies have been carried out      within the housing market and poor
                                                                                                  A MINOR ROLE IN                               and incentives of landlords and tenants.      improvements (Bird and Hernández,
that use survey data to assess the success     coordination with other policy measures.           THE CONSUMER
of the EPC scheme. This methodology            In this sense, several issues are detected         DECISION-MAKING
seeks to better understand the way in
which consumers interact with EPC labels
                                               such as the fear of potential house                PROCESSES.”
                                               buyers to ask for an EPC rating when it
in the housing market. Studies have been       is not provided (Lainé, 2011) or evidence
classified into five key areas:                about EPCs that was used to decide
The level of understanding of EPCs:            what changes to make after a house had
Investigations have generally unveiled         been purchased, rather than in the pre-
that the most important information            purchase decision (Gram-Hanssen et al.,
extracted from EPCs is well understood         2007).
(Lainé, 2011). However, many studies           The significance of EPC labels as
have identified issues relating to a lack      compared with other attributes in
of understanding of more complex               the decision-making process: There
information. These issues are mainly due       are other criteria factors that influence the
the meaning behind different ratings, the      decision to buy/rent a house. Location,
method used to calculate these ratings,        outdoor spaces, price, size and condition
and the insufficient information about         of the dwelling are more important
EPCs to understand the financing costs         criteria than EPC rating and are above
and benefits related to energy efficiency      energy efficiency, as they are considered
(Amecke, 2012 and Bio Intelligence Service     unalterable features of a dwelling
et al., 2013).                                 (Amecke, 2012, Murphy, 2013).

14 | EPC Impact                                                                                                                                                                                                                                                          EPC Impact | 15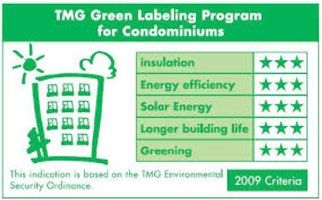
The main issues covered by the survey concerned the following:
                                                                                                           • information about the legal mecanisms of energy performance certification
                                                                                                           • factors considered during the selection, purchase and lease of real estate
                                                                                                           • evaluation of energy performance certificates (EPC) in terms of the procedure of its application, reliability and usefulness in the
                                                                                                             professional activity of real estate agents
                                                                                                           • role of the EPCs on the real estate market while making an estimate of the real estate value and its connection with the
                                                                                                             exposure time of the real estate on the market
                                                                                                           • obstacles in implementing the energy performance certification and improvement of the energy performance of buildings
                                                                                                           • possible actions influencing the improvement of the energy performance of buildings
                                                                                                           • evaluation of the knowledge about the EPBD 2002/91/EC directive.

                                                                                                           3.2      SURVEY SAMPLING

                                                                                                           The survey has been conducted in the territory of 8 EU/EEA member states – Austria, France, Germany, Italy, Norway, Poland,
                                                                                                           Romania and Spain. The survey included 618 interviews in total, respectively,: Austria N= 50; France N= 70; Germany N= 90; Italy
                                                                                                           N= 136 Norway N= 90; Poland N= 71; Romania N= 43; Spain N= 68. Results are considered statically significant, if the probability of
                                                                                                           error is less than 5%.

                      3 REAL ESTATE AGENTS
“SPECIFYING THE
                        SURVEY                                                                             3.3      RESPONDENT PROFILE

                      The aim of the survey was to collect the real estate agent’s professional            The survey’s largest respondent group consisted of individuals with large professional experience in a real estate agency. Whilst
ENERGY PERFORMANCE                                                                                         analysing all the surveyed countries, as much as 64% of the respondents indicated they have at least 10 years of professional
                      opinion on what are the main factors that households consider when selecting
OF BUILDINGS AT       properties to buy or rent. Additionally, the survey asked questions concerning       experience. Additionally, this distribution varied in individual countries. The percentage of the agents having over10 years of
EVERY STAGE OF        the impact of energy performance certification on the values of properties.          experience was significantly higher in Spain (88%), Germany (81%) and Italy (76%). Whereas, in Austria and Poland it was significantly
DESIGN AND USE OF                                                                                          lower. In Poland, agents with 1 – 6 years of professional experience prevailed. (figure 3)

THE BUILDING SHOULD   3.1      MOTIVATION FOR THE SURVEY                                                   Figure 3 – How many years of experience do you have as a real estate agent?
BRING BENEFITS TO                                                                                          Source: Quantitative report on real estate agents survey ZEBRA 2020
ITS OWNERS AND        The system of evaluating the energy performance of buildings, implemented                                            less than 1 year             from 1 to 6 years    from 6 to 10 years         more than 10 years
TENANTS.”             by the EPBD, should motivate designers, developers, real estate managers, real
                      estate users and their agents to regard energy saving as a necessary feature of              Total N=618    3          16                17                                       64
                      the designed and used buildings. It is supposed to limit the costs connected
                      with the maintenance of buildings we reside and work in. With a longer time
                      perspective, such a procedure shall influence lower energy consumption and,
                      thus, limit the emission of greenhouse gases. Increasing the energy security in             Austria N=50    2                  32                                 28                             38
                      countries and regions is supposed to be an important factor in stopping further
                      global warming. Specifying the energy performance of buildings at every
                                                                                                                  France N=70     3        11                 21                                        64
                      stage of design and use of the building should bring benefits to its owners and
                      tenants, as well as societies of individual countries and international societies.
                                                                                                                 Germany N=90         9         10                                                81
                      The target of the real estate agents survey was collecting the opinions on                    Italy N=136   1 7             16                                               76
                      energy certification and its influence on the real estate market and acquiring
                      information about the obstacles in implementing the energy certification.                   Norway N=90              19                  18                                       63
                                                                                                                  Poland N=71         10                           38                              28                       24
                                                                                                                 Romania N=43         9                   28                         16                           47
                                                                                                                   Spain N=68     1 6       4                                                88
                                                                                                            % answers             Significantly higher/ lower score - total vs the country

16 | EPC Impact                                                                                                                                                                                                                    EPC Impact | 17
3.4       RESPONSE ABOUT LEGAL REQUIREMENTS OF EPCS                                                                                       3.5      RESPONSE ABOUT INFLUENCING FACTORS IN THE CHOICE OF PROPERTY

As a dominant form of applying the EPC in the purchase/lease of real estate, practically relevant in all surveyed countries, the legal    Main factors taken into account in the selection, purchase/lease of real estate are, firstly, location (top2box 99% positive response
obligation/obligatory certification (legal requirement for the contract) has been indicated. Such a solution was indicated by 93%         rate), then price (top2box positive responses 98% positive response rate) and finally, the size of the real estate (top2box 96%
of the surveyed participants (figure 4). Poland is a special case, where both the mandatory (39%) and voluntary (55%) certification       positive response rate). A further important consideration (or factor) was the various types of “nuisances” e.g.: a busy road, landing
are present as well as other forms of certification than those listed.                                                                    airplanes, landfill, a high-voltage line, etc. (top2box 90% positive response rate). The cost of energy is in the tenth place among all
                                                                                                                                          factors (top2box 57% positive response rate) (figure 5).
Figure 4 – Please indicate if there is a legal requirement to issue an EPC of the building when buying/renting a property?
Source: Quantitative report on real estate agents survey ZEBRA 2020                                                                       Figure 5 – Please rate, according to your experience as a real estate agent, the importance of each factor for the choice of property
                                                                                                                                          – EU Average
                                                                                                                                          Source: Quantitative report on real estate agents survey ZEBRA 2020

  % answers

Every building handed over for use, as well as every building subject to disposal or lease, should have an established energy              % answers
performance in the form of a certificate, specifying the energy value expressed in kWh/m2/year necessary to fulfil the various
                                                                                                                                          Note: top2box – rather important and definitely important indications
requirements connected with the building use. Only Poland has indicated that both the obligatory and voluntary certification are
relevant (it is not a necessary condition for property sale/lease contract conclusion). The problem with indicating the relevant form
of certification may result from the fact that in the case of the property sale market – the obligatory certification remains relevant,   In terms of the order of the factors in different countries, this list is relatively similar (figure 6). In Germany, Norway and Poland, the
whereas, in the case of the rental market – the voluntary certification is relevant. In Germany, Poland and Romania, another form         location was, indeed, more frequently indicated as the most important factor in selecting real estate. Whereas, in the case of Italy
of a relevant certification has been indicated. Participants who have responded to this, also indicated certain exceptions from the       and Spain the price constitutes the main criterion of property selection. The surveyed Austrian participants indicated the running
legal obligation.                                                                                                                         costs as an important factor in the real estate selection (top2box 92% response rate). Polish and Norwegian respondents focused
                                                                                                                                          on the technical condition of the building (88% response rate respectively, top2box).

18 | EPC Impact                                                                                                                                                                                                                                                       EPC Impact | 19
Figure 6 – Please rate, according to your experience as a real estate agent, the importance of each factor for the choice of property 3.6 RESPONSE ABOUT PRESENTATION, RELIABILITY AND USEFULNESS “6% OF
– EU Average vs. each country (top2box responses only) OF EPCS
RESPONDENTS
Source: Quantitative report on real estate agents survey ZEBRA 2020
Certificates are required for concluding contracts for the sale and lease of real estate DECLARE THAT
as established by directive 2002/91/EC (Article 7, point 1). However, when respondents NO CERTIFICATE
were asked about EPC presentation on signing date, 6% of respondents declare that
no certificate was presented at the time of concluding the contract (figure 7).
WAS PRESENTED
AT THE TIME OF
Figure 7 – How often are EPCs presented at the time of signing a sale/rent agreement? CONCLUDING THE
Source: Quantitative report on real estate agents survey ZEBRA 2020
CONTRACT.”
Always Often Sometimes Rarely Never
Total N=618 59 18 9 8 6
Austria N=50 62 36 2
France N=70 90 6 4
Germany N=90 56 24 12 7 1
Italy N=136 79 10 6 32
Norway N=90 51 34 8 61
Poland N=71 8 4 10 38 39
Romania N=43 72 12 14 2
Spain N=68 41 24 21 12 3
% answers Significantly higher/ lower score - total vs the country
According to figure 7, the requirement of presenting certificates when concluding
contracts is indeed more frequently indicated in France (90%), Italy (79%) and Romania
(72%). Whereas, it isless frequently required in Spain (41%) and Poland (8%) where
participants have stated that certificates are always required in contract conclusion. In
the case of Poland , as much as 39% of the respondents have indicated no requirement
of presenting the EPC whilst doing transactions.
In addition, in Poland, the EPC has to be obtained by developers who hand over the
premises to those that will finish the building construction as well as the use. Whereas,
owners of completed buildings and premises who wish to sell or lease the building,
may ignore this requirement. Neither stakeholder needs to submit the EPC, perhaps
because they don’t want to be burdened with any penalties. The buyer may demand
this document but they rarely do so. It is similar in the other European countries
(perhaps less so in Germany). However, no penalties are incurred for not carrying out
this duty.
Reliability of data provided by the EPC is evaluated relatively low (Figure 8).
% answers Significantly higher/ lower score - total vs the country
20 | EPC Impact EPC Impact | 21Figure 8 – How do you assess the reliability of data provided by EPCs in your country? Summing up, certain tendencies that are shaped in particular countries in terms of the evaluation of the EPCs it has been
Source: Quantitative report on real estate agents survey ZEBRA 2020 particularlyobserved, that the EPC (figure 10) is:
According to bot2box in figure 8, there • relatively unreliable and not useful – Norway, Poland, Germany
is a 35% negative response rate. Similarly, • relatively unreliable, but useful - Romania and France
35% of the respondents have evaluated • reliable but relatively not useful – Spain
EPCs on an average level. Only 27% of • reliable and useful – Italy and Austria
Top2box respondents have evaluated EPC
positively. Compared to other countries Figure 10 – Reliability and usefulness of EPCs
that take part in the survey, German Source: Quantitative report on real estate agents survey ZEBRA 2020
respondents evaluate the EPC data
reliability the most negatively (bot2box
54% negative response rate), similarly
followed by Norwegian, the Poles
(bot2box 47% negative response rate)
and the French (bot2box 42% negative
response rate). In terms of the evaluation
of data reliability, Austria generated the
best results; over half of the respondents
(54%) have evaluated the EPC data
reliability positively. The evaluation of the
certificate reliability went relatively well in
% answers Significantly higher/ lower score - total vs the country Spain (44% positive response rate) and in
Italy (36% positive response rate).
The usefulness of the certificates Figure 8 – How do you assess the reliability of data provided by EPCs in your country?
is rather negatively evaluated by Source: Quantitative report on real estate agents survey ZEBRA 2020
respondents (bot2box 47% negative
response rate in figure 9). Only slightly
above a quarter of the surveyed
participants indicate the usefulness of
the EPC in their professional activity.
Norwegians evaluate the certificate
usefulness particularly badly, almost an
80% negative response rate according to Note:
bot2box. This also includes the Germans Bot2box – rather low/not useful and definitely low/not useful indications
(56% negative response rate, bot2box), Top2box – definitely high/useful and rather high/useful indications
the Spanish (55% negative response rate, Tob2box – indication of limit between top2box and bot2box
bot2box) and the Poles(53% negative
response rate, bot2box) not speaking
in favour of the certificate usefulness.
Whereas, the Romanians (61% response
rate, top2box ) and the French (40%
response rate, top2box) best evaluate the
certificate usefulness.
% answers Significantly higher/ lower score - total vs the country
22 | EPC Impact EPC Impact | 233.7 RESPONSE ABOUT REAL ESTATE MARKET IN RELATION TO EPCS Figure 13 – Is the exposure time on the
market of real estate with EPC shorter in
Respondents (45% response rate) do not see any connection between EPCs and the comparison with the exposure time of
improvement of the energy performance of buildings (figure 11). “RESPONDENTS
real estate without EPC?
(45% RESPONSE Source: Quantitative report on real estate
According to figure 11, the lack of this connection has been statistically significant
more often in Germany (69%) and in Spain (62%). Although not all surveyed countries
RATE) DO NOT SEE agents survey ZEBRA 2020
see a correlation between EPCs and the improvement of the energy performance ANY CONNECTION
of buildings. Italy indicated, with more frequency, the existence of the connection BETWEEN EPCS AND
between the EPC and the improvement of the energy performance of buildings. It THE IMPROVEMENT
should be noted that almost three quarters of the surveyed respondents in Romania
are also able to see this connection.
OF THE ENERGY
PERFORMANCE OF
Figure 11 – Do you think there is a link between EPCs and the improvement of the BUILDINGS.”
energy efficiency of buildings?
Source: Quantitative report on real estate agents survey ZEBRA 2020
In addition, three fourths of the respondents think that the exposure time of real estate
The total number of participants declared with higher energy performance classes on the market is not shorter in comparison to
the lack of association between the the remaining classes (figure 14).
high evaluation of the real estate Figure 14 – Is the exposure time of higher Energy Performance Class (A, A gold, etc.)
energy performance and the higher real estate on the market shorter in comparison to others?
price of a given real estate (figure
12). Additionally, in Poland and Spain,
the answers stressed no influence on
higher costs (rent, price). Only 27% of
all respondents see the connection
between a high evaluation of energy
performance of buildings and a high price
of the real estate. Among all respondents,
the Germans made this correlation more
frequently (46% response rate).
% answers Significantly higher/ lower score - total vs the country
Figure 12 – Is there a rent/price surplus of buildings/flats with high energy
performance rating?
Source: Quantitative report on real estate agents survey ZEBRA 2020
Having a certificate does not imply
a shorter exposure time of real % answers Significantly higher/ lower score - total vs the country
estate on the market (figure 13). Due to
a small response to this question (only 48
According to figure 14, the lack of this correlation was more often indicated in Spain
respondents answered), the results are
(87%). Otherwise, the highest connections between the exposure time of real estate
only assessed at EU level.
and the energy performance are observed in Austria (32%), France (21%), Romania
(19%) and Italy (18%).
% answers Significantly higher/ lower score - total vs the country
24 | EPC Impact EPC Impact | 25Among those that previously claimed that the exposure time of real estate with higher 3.8 RESPONSE ABOUT OBSTACLES IN RELATION TO EPCS
energy classes is shorter (14% response rate in figure 14), the respondents most often
indicated that this time period is 2-3 months shorter(45% response rate figure 15). When the respondents were asked about their opinion of the obstacles in implementing energy performance certification, they
“MOST CLIENTS ARE mainly indicated the following, sorted in descending order (figure 17):
Figure 15 – How much shorter is the time exposure of the real estate? NOT INTERESTED • additional costs for the owners (52% response rate)
Source: Quantitative report on real estate agents survey ZEBRA 2020 IN THE PURCHASE/ • lack of/insufficient knowledge of the clients (client awareness) (50% response rate)
• practice of issuing unreliable EPCs (41% response rate)
LEASE OF A REAL
• additional paperwork (unnecessary bureaucracy or procedures) (41% response rate)
ESTATE WITH A • unclear and incomprehensive form of the certificate for the client (38% response rate)
HIGH-ENERGY • only 5% of the respondents do not see any obstacles in implementing EPCs.
CLASS; A, A+, ETC.” Figure 17 – Do you see any problems with the current Energy Certification? (Multiple answers were possible for this question)
Source: Quantitative report on real estate agents survey ZEBRA 2020
% answers
Finally, most clients are not interested in the purchase/lease of a real estate with a
high-energy class;A, A +, etc. (figure 16). Only 30% of respondents have indicated that
clients are more interested in such real estate.
Figure 16 – Are the clients more interested in buying/renting a property with a high
EPC (A, A + etc.) and/or with labels since introduction of compulsory attachment of
EPC into contracts?
Source: Quantitative report on real estate agents survey ZEBRA 2020
Related to the previous results in figure
16, the analysis of particular participant
countries there are significant differences
between the answers. Statistically, Italians
and the French have the best affirmative % answers Significantly higher/ lower score - total vs the country
answers of clients interested in real estate
with a higher energy class, 46% and 70%, Regarding individual country answers in the previous figure 17, additional costs for owners of real estate remain high on the
respectively. Whereas Spaniards (88%), list of problems. Both in Spain and Germany, this obstacle is higher than the other ones in the survey. Although there are also
Norwegians (83%) and Poles (77%) are the countries in which the cited obstacle is not statistically significant, such as Norway (11% response rate). It should be mentioned that
least interested in real estate with high- Norway has indicated (60% response rate) issuing improper certificates as the most significant obstacle. It is also worth noting that
energy performance classes. mainly Germany (63% response rate) perceives implementing the energy performance certification as unnecessary bureaucracy.
An insufficient client awareness is high on the list in all of the participant countries, whereas in France it is definitely the leading
cause (66% response rate).
% answers Significantly higher/ lower score - total vs the country
26 | EPC Impact EPC Impact | 27Related to measures, the most mentioned problems in the implementation of energy efficiency improvement, sorted in 3.9 RESPONSE ABOUT BENEFITS IN RELATION TO EPCS
descending order below (figure 18):
• lack of financial incentives for real estate owners (57% response rate) The most indicated benefits of energy performance certification in real estate, sorted in descending order, are (figure 19):
• insufficient information about benefits (39% response rate) • information about energy costs in a given real estate (39% response rate)
• little social engagement in matters concerning energy transformation (38% response rate) • information about technical condition of the building (32% response rate)
• economic benefits resulting from energy saving are not assigned to the person who tries to save (32% response rate) • information about benefits in having an EPC (29% response rate
Figure 18 – What problems do you see for the implementation of energy efficiency improvements in buildings? (Multiple answers Figure 19 – What benefits do you see in having an EPC? (Multiple answers were possible for this question)
were possible for this question) Source: Quantitative report on real estate agents survey ZEBRA 2020
Source: Quantitative report on real estate agents survey ZEBRA 2020
% answers Significantly higher/ lower score - total vs the country
% answers Significantly higher/ lower score - total vs the country
Regarding individual country answers in figure 18, the list is relatively similar, except for Germans and Italians who presented Statistically, the survey results are similar to the general results in individual participant countries. Only German respondents indicate
a different attitude to this issue. Statistically, Germans indicated the lack of financial incentives as the most significant between with less frequency that certificates are the source of information about energy costs of a given real estate (26% response rate) and
other countries (83% response rate), but pointed to insufficient information about benefits (16% response rate) and little social the most common answer for nearly half of the German respondents is that they don’t see any benefits at all (47% response rate).
engagement in matters concerning energy transformation (18% response rate) as the least significant. Whereas, Italians indicated
insufficient information and little social engagement in matters concerning energy transformation (55% response rate in both While at the same time, Italian respondents more often point to EPCs as the source of information about energy costs of a given
cases). On the contrary, financial incentives were indicated as less significant than other countries (35% response rate). They also real estate (54% response rate). In addition, only Italians significantly pointed to benefits resulting from having an EPC as promoting
don’t consider the economic benefits of energy saving accrued to the person who is trying to save as an obstacle (24% response ecological attitudes (34% response rate).
rate) and inappropriate legal conditions (11% response rate) are considered less significant.
28 | EPC Impact EPC Impact | 29Related to measures, the most indicated answers about benefits of actions that could improve energy efficiency of 3.10 RESPONSE ABOUT REGULATIONS IN RELATION TO EPCS “THERE IS A
buildings, sorted in ascending order, are (figure 20):
• financial incentives for property owners (72% response rate) There is a divided trend in the survey concerning the need for institutional solutions DIVIDED TREND
• economic advantages for the person who is trying to save energy (45% response rate) that could improve the real estate energy standards. Spain, Romania, Italy expect IN THE SURVEY
• detailed information about benefits resulting from an energy saving activity (44% response rate) institutional solutions, whereas Norway, Germany and Austria indicate that more CONCERNING
solutions are not necessary. French and Polish respondents remain undecided in this
Figure 20 – What actions do you think could improve the energy efficiency of buildings? (Multiple answers were possible for this matter (figure 21).
THE NEED FOR
question) INSTITUTIONAL
Source: Quantitative report on real estate agents survey ZEBRA 2020 Figure 21 – Do you think it is necessary to take institutional measures to improve the SOLUTIONS
energy standard of buildings?
Source: Quantitative report on real estate agents survey ZEBRA 2020
THAT COULD
IMPROVE THE REAL
Yes No I do not know ESTATE ENERGY
Total N=618 47 38 15
STANDARDS.”
Austria N=50 34 54 12
France N=70 54 31 14
Germany N=90 19 74 7
Italy N=136 60 21 19
Norway N=90 26 54 20
Poland N=71 51 35 14
Romania N=43 77 7 16
Spain N=68 65 19 16
% answers Significantly higher/ lower score - total vs the country
The degree of involvement referencing the Energy Performance of Buildings
Directive 2002/91/EC or 2010/31/EU at the workplace of respondents is relatively
low with a 34% response rate (figure 22). Regarding individual country results, the most
often indicated involvement pointed to Italy (63% response rate), whereas, the less
% answers Significantly higher/ lower score - total vs the country often indicated is for France (11% response rate) and Norway (6% response rate).
In both the global results as well as individual country results the financial incentives “IN CONCLUSION,
constitute the most expected support that could improve the energy performance of MOST
buildings, and is more often indicated in Germany (87% response rate) and less often
indicated in both Romania (63% response rate) and Norway (60% response rate).
RESPONDENTS
AGREE AND
In conclusion, most respondents agree and perceive benefits, mainly in the light of PERCEIVE
economics.
BENEFITS, MAINLY
IN THE LIGHT OF
ECONOMICS.”
30 | EPC Impact EPC Impact | 31Figure 22 – Have you encountered a reference to the Energy Performance of Buildings Directive 2002/91/EC or 2010/31/EU at your work place? Source: Quantitative report on real estate agents survey ZEBRA 2020 % answers Significantly higher/ lower score - total vs the country According to the respondents that come across the Energy Performance of Buildings Directive 2002/91/EC or 2010/31/EU in their work place, the main objectives sorted in ascending order are (figure 23): • carbon reduction (70% response rate) • improvement of energy efficiency in the EU (67% response rate) • promotion of low energy construction (48% response rate) • EU energy security (19% response rate) Figure 23 – Please indicate the objectives of the Energy Performance of Buildings Directive. (Multiple answers were possible for this question) Source: Quantitative report on real estate agents survey ZEBRA 2020 % answers only respondents who who encountered in your work a reference to the Energy Performance of Buildings Directive 2002/91/EC or 2010/31/EU 32 | EPC Impact EPC Impact | 33
Figure 24 – Summary of process adopted for assessing EPC impact on sales/rental prices in each country property market.
                                                                                                            Source: study of De Graaf, 2016

                                                                                                                                                              RATING &                                 SAMPLE OF
                                                                                                                       EPC POLICY                           MEASUREMENT                               DISTRIBUTION
                                                                                                                                                              SYSTEMS                                OF EPC CLASSES

                       4 STUDY ON EPC PRICE                                                                                                                                                            REGRESSION
                                                                                                                                                                                                         RESULTS

“CROSS-COUNTRY
                         SURPLUSES
ANALYSIS AND           As part of a master thesis at TU Wien (De Graaf, 2016), the aim of this assessment          NO PRICE SURPLUS
                       study is to obtain an estimation of individual country price surpluses due to                                                                   1ST
COMPARISONS MUST BE    energy efficiency (through EPCs) given in sales and rental markets.                                      OR
DONE WITH CAUTION                                                                                                                                              HYPOTHESES
                       As initially commented, the energy rating level given in EPCs is used as indicator             PRICE SURPLUS
DUE TO DIFFERENT EPC   for the energy efficiency of a property. This fact can encourage performing
SYSTEMS, REAL ESTATE   cross-country analysis and comparisons but this must be done with caution                                                                                                         ASSESSING
                       due to different EPC systems, real estate markets and types of property. The
AGENTS AND TYPES OF    quality and size of samples will vary between the analysed countries as well.                                                                                                    EPC IMPACT
PROPERTY.”                                                                                                       RENTAL SURPLUSES ≥
                                                                                                                   SALE SURPLUSES                                                                  ON SALES/RENTAL
                       4.1      APPLIED METHODOLOGY                                                                                                                    2ND                              PRICES
                                                                                                                                OR
                       The same regression method defined in other studies (Rosen, 1974) has been                                                              HYPOTHESES
                       carried out on the selected countries. In order to achieve a good assessment of           RENTAL SURPLUSES <
                       this method for each country, the following steps comprise the main process                 SALE SURPLUSES
                       adopted in figure 24:

                                                                                                            Due to the quantity of the above information, individual country explanations are not included in this report, but are provided in
                                                                                                            the report version for policy makers. Nevertheless, they are also considered for the assessment of regression results.

34 | EPC Impact                                                                                                                                                                                                                 EPC Impact | 35
4.2 DATASET FOR REGRESSIONS remain and a full report of the level of The first observation that can be made and rural locations, making it a potentially “QUALITY AND
energy efficiency capitalisation in all EU from figure 25 is that surpluses in rental “significant source of unobserved
Data on the characteristics of dwellings and EEA member states is not yet possible. prices are lower than surpluses heterogeneity” (Fuerst et al., 2015, p. 147).
ACCURACY OF EPC
in the selected countries (including EPC in sales prices for all countries, in RATING DEPENDS
ratings) was collected from different The collected data will be used as which the rental and sales markets were Moreover, quality is likely to be highly ON THE PERSONNEL
real estate agency websites. Data was foundation for future investigations that correlated with energy efficiency, but
collected for both sales and rental can be performed periodically to assess
analysed. Also, with the comparison of
categorisation is very subjective, making it
REQUIREMENTS,
average values between sales and rentals
transactions in each country. In addition changes in the level of capitalisation a difficult variable to include in regression WHICH ARE
markets, this affirmation is the same.
to EPC ratings and advertised prices, the of energy efficiency, thereby providing “PRICE SURPLUSES models. The dataset quality can be DEFINED
useable floor area was collected for each information that can be used to assess ARE GIVEN AS The closest literature comparison that can affected by the quality of data inputting NATIONALLY.
dwelling and in most cases, the year of the success of policies in the field, such PERCENTAGE be made to these results was outlined for the real estate websites. In particular,
QUALIFIED
construction. as the success of energy performance in detail in the EU commission report multiple cases are observed where fields
certification.
VALUES OF on EPC price surpluses (see chapter 2.1). are omitted in the data inputting for a PROFESSIONALS
The following EU/EEA member states were THE AVERAGE The highest estimated surpluses in this dwelling. In addition, different agencies ARE REQUIRED
chosen for analysis in this assessment: DWELLING report, which are given in figure 2, are use different definitions for certain IN ALL CASES,
Austria, Czech Republic, Denmark, France,
Germany, Luxembourg, the Netherlands, 4.3 ASSESSMENT OF EPC IMPACT PRICE, BEING 10-11% for the sales market and 4.4% for variables, such as the number of rooms HOWEVER,
the rental market. The average values and the liveable area of a dwelling. The
Norway, Slovakia, Spain, Sweden and The EPC impact is given by the obtained ESTIMATIONS SPECIALIST
maintain a difference between 3.9% and extent to which datasets are consistent in
United Kingdom. Details on Belgium regression results based on estimated OF THE ADDED 2.9%, respectively. This result can also be these fields for a given real estate agency TRAINING IS NOT
and Italy can be found in the study of De price surpluses by country due to EPC VALUE OF A explained by the split-incentive dilemma depends on the training level of the ALWAYS NEEDED
Graaf, 2016. ratings given in sales and rental markets. DWELLING DUE TO (see chapter 2.4). agents, as well as the level to which these (CA EPBD, 2016).”
4.2.1 LIMITATION OF DATA ANY ONE-LETTER variables are well defined by the agency.
Taking into account the previous data These results are similarly limited due to When they are not well defined, subjective
Despite the effort to provide similar limitations and the susceptibility for IMPROVEMENT OF “poor data” and “omitted variables”; choices have to be made, such as what
analysis between countries, data cross-country comparisons, the results EPC RATING.” however, they give a rough guide as to constitutes a half-room and whether
limitations have so far prevented a for each of the analysed markets are the order of magnitude that should be outdoor space should be included in
comprehensive report. Data availability in presented together in figure 25, with expected for the surpluses in this report. the liveable area category. Likewise,
this field is continually improving due to surpluses given as percentage values For instance, with the maximum values the quality and accuracy of EPC ratings in both studies was a lack of trust due to
the increasing levels of implementation of the average dwelling price in each of appearing in figure 25, it is possible that depends on the personnel requirements, a negative press reception of the scheme.
of the EU Energy Performance in Buildings the samples. These percentage values the results for the sales markets in Austria which are defined nationally. Qualified However, the new web-based version
Directive (EPBD), which requires EPCs are, therefore, estimations of the added (18%), Slovakia (16%) and Spain (27%) have professionals are required in all cases; of the EPC that was developed for the
to be advertised for rental and sales value of a dwelling due to any one-letter been inflated by “omitted variables”, as however, specialist training is not always implementation of the 2010 EPBD recast
transactions. However, data limitations improvement of EPC rating. well as the results for the Spanish rental needed (CA EPBD, 2016). has led to a sharp increase in certification
market (22%). Furthermore, such high
frequency. Furthermore, lack of trust
surplus values appear to be inconsistent 4.3.1 NETHERLANDS CASE
Figure 25 – Dwelling price surpluses due to EPC ratings in the respective samples of and low implementation are issues that
with survey results (see chapter 3.7 and
each of the analysed countries. The country with the most unexpected have been faced by many countries
figure 12), which have found EPC ratings
Source: study of De Graaf, 2016. The Luxembourgish surplus assumes a 50-point improve- results in this report is the Netherlands, for since the EPBD was first created in 2002
to be “only a minor purchasing criterion”
ment, which is fairly typical for other national systems. which deficits, instead of surpluses, and all other studies carried out on the
(Amecke, 2012, p. 4).
were observed for both the sales EPC scheme have reported statistically
“Omitted variables” - such as location and rental markets. Other studies that significant surpluses due to EPCs. For
and quality - have different effects on the have previously been carried out in the these reasons, “omitted variables” such
final surplus results depending on the Netherlands have reported surpluses due as quality and location are more likely
level of correlation with the variable of to EPC rating. However, these studies also to be the cause of the unexpected
interest. For example, if a variable is rated provide evidence which suggests that the deficits. Further investigation into the
positively and highly correlated with Netherlands struggled to implement the causes would have to expand the scope
energy efficiency, and is not included transposition of the 2002 EPBD (Brounen of the model to include these variables.
in the dataset, then the surplus due to and Kok, 2011) (Murphy, 2013). In particular, the report carried out by
this variable will be partly included in Brounen and Kok includes variables for
the energy efficiency surplus. In this In particular, it has been reported that dwelling quality characteristics, dwelling
report, location and quality are the implementation levels greatly decreased type and neighbourhood properties
most important “omitted variables”. after an initially strong uptake of the EPC (Brounen and Kok, 2011).
Location is particularly significant as the scheme. A key reason for this downward
housing market can vary between urban pattern in implementation that is stated
36 | EPC Impact EPC Impact | 37You can also read


