West Village Student Housing Phase I: Apartment Monitoring and Evaluation - A. German, C. Bell, B. Dakin, and M. Hoeschele Alliance for ...
←
→
Page content transcription
If your browser does not render page correctly, please read the page content below
West Village Student Housing
Phase I: Apartment Monitoring
and Evaluation
A. German, C. Bell, B. Dakin, and M. Hoeschele
Alliance for Residential Building Innovation

June 2014
NOTICE

This report was prepared as an account of work sponsored by an agency of the United States government.
Neither the United States government nor any agency thereof, nor any of their employees, subcontractors, or
affiliated partners makes any warranty, express or implied, or assumes any legal liability or responsibility for the
accuracy, completeness, or usefulness of any information, apparatus, product, or process disclosed, or
represents that its use would not infringe privately owned rights. Reference herein to any specific commercial
product, process, or service by trade name, trademark, manufacturer, or otherwise does not necessarily
constitute or imply its endorsement, recommendation, or favoring by the United States government or any agency
thereof. The views and opinions of authors expressed herein do not necessarily state or reflect those of the
United States government or any agency thereof.

                      Available electronically at http://www.osti.gov/scitech

                   Available for a processing fee to U.S. Department of Energy
                                 and its contractors, in paper, from:
                                    U.S. Department of Energy
                          Office of Scientific and Technical Information
                                             P.O. Box 62
                                    Oak Ridge, TN 37831-0062
                                        phone: 865.576.8401
                                          fax: 865.576.5728
                               email: mailto:reports@adonis.osti.gov

                          Available for sale to the public, in paper, from:
                                  U.S. Department of Commerce
                              National Technical Information Service
                                       5285 Port Royal Road
                                       Springfield, VA 22161
                                       phone: 800.553.6847
                                         fax: 703.605.6900
                                 email: orders@ntis.fedworld.gov
                         online ordering: http://www.ntis.gov/ordering.htm

                 Printed on paper containing at least 50% wastepaper, including 20% postconsumer waste
West Village Student Housing Phase I:
          Apartment Monitoring and Evaluation

                            Prepared for:

             The National Renewable Energy Laboratory

On behalf of the U.S. Department of Energy’s Building America Program

          Office of Energy Efficiency and Renewable Energy

                    15013 Denver West Parkway

                         Golden, CO 80401

             NREL Contract No. DE-AC36-08GO28308

                            Prepared by:
           A. German, C. Bell, B. Dakin, and M. Hoeschele
         Alliance for Residential Building Innovation (ARBI)
                  Davis Energy Group, Team Lead

              NREL Technical Monitor: Michael Gestwick

           Prepared under Subcontract No. KNDJ-0-40340-03

                             June 2014

                                 iii
[This page left blank]

          iv
Contents
List of Figures ............................................................................................................................................ vi
List of Tables .............................................................................................................................................. vi
Acknowledgments .................................................................................................................................... vii
Definitions ................................................................................................................................................. viii
Executive Summary ................................................................................................................................... ix
1 Introduction ........................................................................................................................................... 1
      1.1 Background and Motivation ................................................................................................1
      1.2 Research Questions ..............................................................................................................1
2     Project Description ............................................................................................................................... 3
      2.1 Measure Details ...................................................................................................................5
3     Methodology ......................................................................................................................................... 8
      3.1 General Technical Approach ...............................................................................................8
      3.2 Data Collection ....................................................................................................................8
      3.3 Data Evaluation....................................................................................................................9
          Apartment Energy Usage Disaggregation .........................................................................11
      3.4 Cost Effectiveness..............................................................................................................11
4     Results ................................................................................................................................................. 12
      4.1 Occupant Behavior.............................................................................................................12
      4.2 Apartment Building Energy Use ........................................................................................13
          Apartment Unit Energy Use...............................................................................................13
          Domestic Hot Water and Common Meter Energy .............................................................16
      4.3 Phase I Zero Net Energy Evaluation ..................................................................................18
      4.4 Cost Effectiveness..............................................................................................................20
5 Conclusions and Discussion ............................................................................................................ 22
References ................................................................................................................................................. 25
Appendix: Supplementary Evaluation Graphs....................................................................................... 26

                                                                               v
List of Figures
Figure 1. West Village project site plan .................................................................................................... 3
Figure 2. Photograph of the completed village square surrounded by mixed use and student
   housing buildings ................................................................................................................................. 4
Figure 3. Ramble A style apartment building showing exterior window sunshades, rooftop solar
   PV, and high efficiency heat pumps ................................................................................................... 4
Figure 4. Modeled and actual average monthly consumption values for each apartment type (by
   number of bedrooms) ........................................................................................................................ 14
Figure 5. Histogram showing individual apartment energy consumption variation.......................... 15
Figure 6. Average disaggregated energy use over 12 months (March 2012 to February 2013) for the
   four-bedroom apartments .................................................................................................................. 16
Figure 7. Monthly average common meter use compared to modeled (15 buildings) ...................... 17
Figure 8. Actual common meter energy consumption for 14 buildings over 12 months (March 2012
   to February 2013) ................................................................................................................................ 18
Figure 9. Comparison of annual Phase I consumption and production ............................................. 19
Figure 10. Total consumption, production, and net values for all Phase I buildings ........................ 20
Figure 11. Histogram showing variation in energy consumption over 12 months (March 2012 to
   February 2012) for all two-bedroom apartments ............................................................................. 26
Figure 12. Histogram showing variation in energy consumption over 12 months (March 2012 to
   February 2012) for all three-bedroom apartments .......................................................................... 26
Figure 13. Histogram showing variation in energy consumption over 12 months (March 2012 to
   February 2012) for all 4-bedroom apartments ................................................................................. 27
Figure 14. Average disaggregated energy use over 12 months (March 2012 to February 2012) for
   the two-bedroom apartments ............................................................................................................ 27
Figure 15. Average disaggregated energy use over 12 months (March 2012 to February 2012) for
   the three-bedroom apartments ......................................................................................................... 28
Figure 16. Average disaggregated energy use over 12 months (March 2012 to February 2012) for
   the four-bedroom apartments ........................................................................................................... 28

Unless otherwise noted, all figures were created by the ARBI team.

List of Tables
Table 1. Breakdown of Apartment Units for Phase I of the Student Apartment Ramble Buildings ... 5
Table 2. Student Housing Energy Efficiency Measure Package ............................................................ 6
Table 3. Valid Date Ranges for Collected Data. ....................................................................................... 9
Table 4. Evaluation Terms for Life Cycle Costing. ................................................................................ 11
Table 5. Projected and Actual Production, Consumption, and Net Energy Values ........................... 19
Table 6. Life Cycle Cost Evaluation Key Input Metrics ......................................................................... 21
Table 7. Life Cycle Cost Comparison of a Single Ramble A Building Compared to California Title-
   24 Standard ......................................................................................................................................... 21

Unless otherwise noted, all tables were created by the ARBI team.

                                                                           vi
Acknowledgments
Davis Energy Group would like to acknowledge the U.S. Department of Energy Building
America program and their funding and support of development of this technical report as well
as research that informed it. We would like to extend gratitude to the University of California,
Davis and the developer West Village Community Partners for their ongoing cooperation
throughout the design, construction, and monitoring stages of this project and their commitment
to this project. In addition, we would like to acknowledge SunPower, Pacific Gas & Electric
Company, Architectural Energy Corporation, and the Western Cooling Efficiency Center, for
providing the team with data that was indispensable for this evaluation.

                                               vii
Definitions
ACH 50 Air changes per hour at 50 Pascals
ARBI Alliance for Residential Building Innovation
DEG Davis Energy Group
EEM Energy efficiency measure
EER Energy efficiency ratio
HERS Home Energy Rating System
HPWH Heat pump water heater
HSPF Heating seasonal performance factor
HVAC Heating, ventilation, and air conditioning
LCC Life cycle cost
MEL Miscellaneous electric load
PG&E Pacific Gas & Electric
PV Photovoltaic
RASS Residential Appliance Saturation Study
SEER Seasonal energy efficiency ratio
WVCP West Village Community Partnership
VNM Virtual net metering
ZNE Zero net energy
viiiExecutive Summary
West Village, the largest planned zero net energy (ZNE) community in the United States, is a
new neighborhood currently under construction on the University of California at Davis campus.
The multiuse project combines energy efficiency measures (EEMs) and on-site renewable
generation to target a community-level ZNE goal. The focus of this research conducted by the
Alliance for Residential Building Innovation (ARBI) is on the 192 student apartments (16
buildings) that were completed in 2011 as part of the Phase I West Village multiyear build-out.
The EEMs that are incorporated into these apartments, including increased wall and attic
insulation, high performance windows, high efficiency heat pumps for heating and cooling,
central heat pump water heaters (HPWHs), 100% high efficacy lighting, and ENERGY STAR®
major appliances, contribute significantly to source energy reductions with an estimated 37%
savings over the Building America Benchmark (Hendron et al. 2010) in hot-dry climates and
31%–39% Title-24 compliance savings. The implemented EEMs, and specifically the EEM
package, have the potential to lead to market-ready solutions that cost-effectively provide
comfort in multifamily buildings with efficient, safe, and durable operation.
The primary objective of this project is to evaluate the ability of the project to meet the Building
America Project Management Milestone goals and the project’s stated energy goals. This project
presents an important opportunity to validate the cost effectiveness and performance of
multifamily deep EEMs on a community scale. Utility billing data were used to compare
measured versus modeled electricity use and to verify the accuracy of the modeling assumptions.
This work seeks to address the following research questions:
1. How does measured energy use compare to modeled and were the expected energy
savings achieved?
2. Was the the project able to achieve the stated energy goals?
3. How cost effective is this package of EEMs in a multifamly application?
4. What role do occupants have in high performance buildings and how well do tenants
respond to energy education efforts by the developer?
Build-out of the community is ongoing, yet thus far the project has been a success, as
demonstrated by the design and construction of buildings that incorporate cost-effective
measures that reduce heating and cooling energy use significantly. Results have provided
valuable insights and lessons learned into the largest planned ZNE community in the United
States, which will be useful for builders, developers, researchers, and consultants alike.
Actual apartment energy consumption for the 16 Phase 1 buildings exceeds original model
predictions by 18% over a 12-month period (March 2012 to February 2013). Average monthly
apartment energy consumption profiles suggest that non-heating, ventilation and air conditioning
(HVAC) use is likely the primary cause of the discrepancy. Electrical energy disaggregation
indicated that for the predominant four-bedroom apartment type, modeled HVAC energy use
over the 10-month period was overpredicted by 56%, while non-HVAC energy was
underpredicted by 54%. This may be attributed to the “multiple household” effect, whereby
student occupancy may tend to have more duplication of certain electronic devices (computers,
ixgaming stations, TVs, etc.) that would skew consumption away from what might be expected
from more typical multifamily household assumptions.
As heating and cooling loads are driven down significantly with high performance homes,
occupants may be the most influential variable in total home energy consumption, especially in
milder climates. Measured non-HVAC base load at West Village averaged 85% of total
apartment electricity over the 10-month period. As technology drives efficiency further, the
impact of the occupant becomes increasingly important.
Annual energy use of the common area meters (serving the HPWH and building exterior
lighting) was found to be 55% higher than projected. Half of the HPWHs were found to have
ongoing issues resulting in excessive resistance heat operation, and it is theorized that improper
initial commissioning due to lack of experience with the technology is the key issue. It is
recommended that the installing contractor, either mechanical or plumbing with appropriate
training, has sufficient experience with refrigerant systems.
It is clear that more in-depth and regular engagement with the tenants is necessary to ensure buy-
in and participation from tenants on achieving the ZNE goals. Tenant education on basic energy
efficiency strategies, creating a community energy and sustainability vision, and implementing
and enforcing rules on excessive consumption (e.g., use of individual room refrigerators) are
needed. Considering that this report summarizes the first full year of operation, we anticipate that
West Village Community Partners and UC Davis will use the results of this initial evaluation to
improve processes and quality control procedures to optimize community-wide performance.
This may involve the addition of EEMs or photovoltaics where necessary, improved tracking and
maintenance of energy-consuming components, and increased efforts to encourage and
incentivize student participation in reducing energy use.
x1 Introduction
1.1 Background and Motivation
West Village, the largest planned zero net energy (ZNE) community in the United States, is a
new neighborhood currently under construction on the University of California at Davis campus.
It’s a multiuse project incorporating energy efficiency measures (EEMs) and on-site renewable
generation to achieve community-level ZNE goals. It is designed to enable faculty, staff, and
students to live near campus, take advantage of environmentally friendly transportation options,
and participate fully in campus life. Sited on more than 200 acres, when complete the community
will provide housing for almost 2,000 students, 343 homes for faculty and staff, a 10-acre
recreation complex, and the first community college center on a university campus.
West Village began as a public-private partnership to develop much-needed housing for UC
Davis students, faculty, and staff. Along the way, UC Davis and its development partner, West
Village Community Partnership, LLC (WVCP), embraced the aspirational goal of making West
Village a ZNE community. This decision was in part due to California’s Energy Efficiency
Strategic Plan (CPUC 2008) that all residential construction be ZNE by 2020 as well as the
University’s greenhouse gas reduction goals. Grants from the U.S. Department of Energy,
California Energy Commission, and the California Public Utilities Commission supported design
and development of this innovative ZNE community at West Village.
The focus of this research conducted by the Alliance for Residential Building Innovation (ARBI)
is on the 192 student apartments that were completed in 2011 under Phase I of the West Village
multiyear project. The EEMs that are incorporated into these apartments (see Table 2), including
increased wall and attic insulation, high performance windows, high efficiency heat pumps for
heating and cooling, central heat pump water heaters (HPWHs), 100% high efficacy lighting, and
ENERGY STAR® major appliances, contribute significantly to source energy reductions with an
estimated 37% savings (BEopt™ v1.1) over the Building America Benchmark in hot-dry
climates. Title-24 compliance savings were 31%–39% depending on building and orientation.
These EEMs, and specifically the EEM package, have the potential to lead to market-ready
solutions that cost-effectively provide comfort in multifamily buildings with efficient, safe, and
durable operation. These apartment buildings have also been certified Platinum under the
Leadership in Energy and Environmental Design for Homes certification program.
The primary objective of this project is to evaluate the ability of the project to meet the Building
America Project Management Milestone goals and the project’s stated energy goals. This project
presents an important opportunity to validate the cost effectiveness and performance of
multifamily deep EEMs on a large scale, which has never before been done. Utility data are used
to compare measured versus modeled electricity use and to verify the accuracy of the
assumptions employed in the model. Incremental construction costs from the builder are used to
evaluate cost effectiveness.
1.2 Research Questions
The primary research questions are the following:
1. How does measured energy use compare to modeled and were the expected energy
savings achieved?
12. Was the the project able to achieve the stated energy goals?
3. How cost effective is this package of EEMs in a multifamly application?
Secondary research questions include the following:
4. What role do occupants have in high performance buildings and how well do tenants
respond to energy education efforts by the developer?
22 Project Description
UC Davis’ goal for West Village is to minimize the community’s energy use and greenhouse gas
production by reducing building energy use, providing on-site energy generation from a mix of
renewable sources, and encouraging bicycle use and public transportation. Project goals were set
by UC Davis in order to meet future campus and state greenhouse gas reduction and
sustainability goals. Figure 1 shows the overall site plan for West Village with Phase 1 student
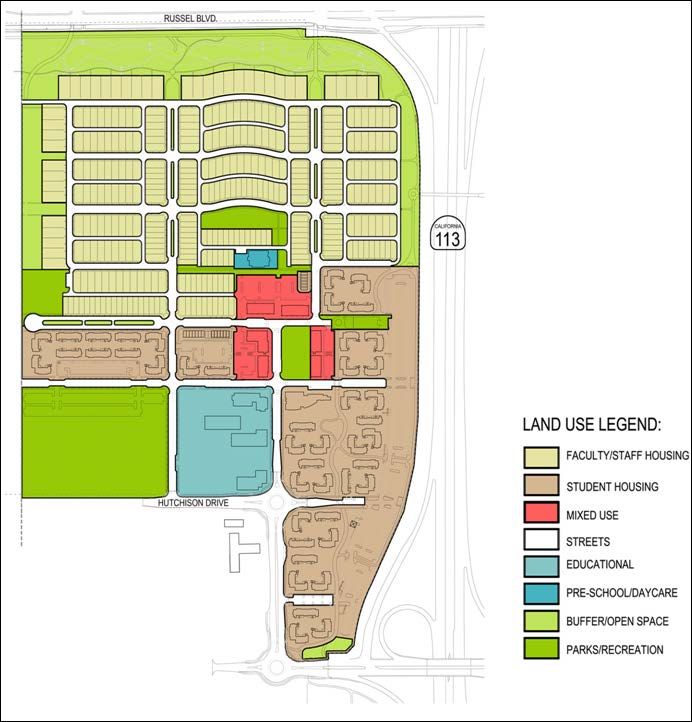
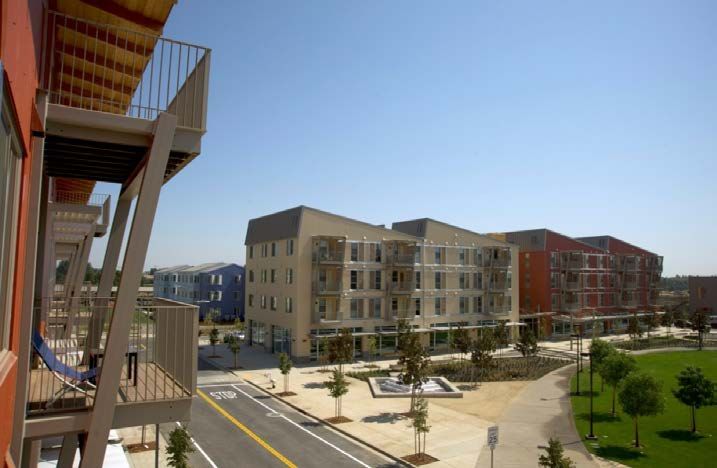
housing outlined by the red line. Figure 2 and Figure 3 show the completed village square.
Nearly 10 years ago, Davis Energy Group (DEG) began coordinating with UC Davis to develop
strategies for a highly efficient residential community to be built on UC Davis land. Results of
previous work are summarized in the CARB’s 2009 and 2010 Building America annual reports
(CARB 2009, 2010), a report prepared for Chevron Energy Solutions (DEG 2010), an American
Council for an Energy Efficient Economy paper (Dakin et al. 2010), and a 2012 ARBI Building
America technical report focused on initial performance of the central HPWH as well as the
overall construction quality assurance and quality control processes (Dakin et al. 2012).
Figure 1. West Village project site plan
3Figure 2. Photograph of the completed village square surrounded by
mixed-use and student housing buildings
(courtesy of University of California, Davis) 1
Figure 3. Ramble A style apartment building showing exterior window sunshades,
rooftop solar photovoltaics (PV), and high efficiency heat pumps
1
West Village UC Davis (2011). Apartment Living: The new Viridian apartments overlooking the Village Square at
UC Davis West Village. (Photo by Greg Urquiaga/UC Davis) [Web Photo]. Retrieved from
http://westvillage.ucdavis.edu/image-gallery/20110914_west_village_7493.jpg/view on October 28th, 2011.
4Construction of the first phase of student apartments began in 2010 and was completed in
September 2011, in time for student arrival for fall quarter occupancy. This first phase consists
of 16 three-story buildings, each with 12 units for a total of 192 units (see Table 1), and two
similar building styles, Ramble A and Ramble B. In January 2011, the developer started taking
reservations for leases on the student apartment buildings. By April, 80% of the units had leases
reserved and by September when occupancy opened up nearly 100% of units were leased. Phase
II consists of an additional 16 buildings of similar design that were completed for occupancy in
September 2012. The final student housing phase, Phase III, was recently completed in time for
fall 2013 occupancy. The scope of this report covers the performance of the 16 Phase I
apartments only.
Table 1. Breakdown of Apartment Units for Phase I of the Student Apartment Ramble Buildings
Conditioned
Number
Floor Total Number
Bedroom of
Area/Building of Units
Buildings
(ft2)
(6) 4-bedroom
Ramble A 16,011 13 156
(6) 3-bedroom
(6) 4-bedroom
Ramble B 14,202 3 36
(6) 2-bedroom
Total – – 16 192
2.1 Measure Details
Table 2 summarizes the EEMs incorporated in this project and their associated incremental costs.
DEG and WVCP coordinated to develop incremental cost projections in 2009. These costs along
with the projected energy savings were used to conduct economic evaluations and develop and
optimize the EEM packages. The cost data provided were based on contractor bids and closely
reflect actual costs.
Incremental costs for the EEMs for a Ramble A building (not including PV) were estimated at
about $46,000 more than a building built to the regional builder standard (California’s Title-24
energy efficiency standards, from here on referred to as Title-24) (CEC 2008). After factoring in
Pacific Gas & Electric (PG&E) utility incentives for energy efficiency the incremental cost drops
to just under $41,000. This equates to a net incremental cost of $3,380 per apartment or about
$2.50/ft2, not including PV systems.
5Table 2. Student Housing EEM Package
Incremental Cost
Builder Standard (Title-24)
Measure West Village Specification Over Title-
Specification
24/Building
Basic Building Characteristics
Building Type/Stories Multi Family, 3 stories
# of Buildings and Units 16 buildings, 192 units
Envelope
Exterior Wall Construction and 2 × 6 16 in. o.c. R-19 Batt, 2 × 6 16 in. o.c. R-21 batt w/1/2 in. R-3 exterior
$5,418
Insulation Grade 3 sheathing, grade 1
Foundation Type and Insulation Slab – Uninsulated
Asphalt shingles Cool Roof Rating Council-certified roofing
Roofing Material and Color Reflectivity = 0.20, product $0
Emissivity = 0.85 reflectivity = 0.25, emissivity = 0.85
Ceiling Insulation R-38 r-49 blown cellulose $791
Radiant Barrier Yes
House Infiltration – Blower Door
No, 7.0 ACH50 Yes, 5.0 ACH50 $0
Test
Thermal Mass None ½-in. Gypcrete on floors 2 and 3 $2,031
Quality insulation installation +
Envelope HERS Verifications None $4,2002
blower door test
Glass Properties: U-Value/SHGC
All Windows Dual vinyl – 0.40/0.40 Gilwin Dual Vinyl – 0.32/0.23 $2,949
Heating, Ventilation, and Air Conditioning (HVAC) Equipment
Heating Type and Efficiency Heat pump/7.7 HSPF Heat pump/8.5 HSPF
AC Type and Efficiency Heat pump/SEER 13/EER 10 Heat pump/SEER 15/EER 12.5
$9,763
Ducted, R-6 in conditioned space on floors 1
Distribution Type and Details Ductwork, R-6 in attic
and 2, attic on floor 3
Verify Duct Leakage Tested,Incremental Cost
Builder Standard (Title-24)
Measure West Village Specification Over Title-
Specification
24/Building
Tight ducts3 Methodology
The scope of this technical report focuses on the evaluation of total apartment energy use, total
Phase I community energy use, and the ability to meet the project’s stated energy goals.
3.1 General Technical Approach
ARBI worked with WVCP, SunPower and PG&E to obtain monthly utility data and generation
data from the PV monitoring systems for each of the apartments. Measured energy consumption
and PV generation are compared to energy estimates from modeling. Additionally, DEG is
reporting on lessons learned from WVCP’s perspective and future improvements to encourage
engagement and further reduce energy use from West Village occupants.
3.2 Data Collection
To evaluate energy use and generation, DEG worked with WVCP and SunPower to obtain and
evaluate monthly utility data and PV generation data from each of the apartments and common
area meters. Measured energy consumption and PV generation were compared to energy
estimates from modeling.
Energy data was collected from two sources: PG&E utility meter data 4 and SunPower’s
monitoring website. 5 SunPower monitors both total PV system production and total building
energy consumption on a 5-minute interval basis. Originally, the analytical approach was to
compare the consumption and production values, from SunPower’s monitoring website, on an
hourly basis to assess Phase I performance. Unfortunately, due to errors in the SunPower
equipment, the reported consumption values from SunPower were inaccurate and therefore had
to be eliminated from the datasets. The errors in the SunPower consumption data were
discovered when comparing the monthly PG&E net consumption values to the difference of the
SunPower consumption and generation values.
In place of the SunPower consumption data, a combination of SunPower production and PG&E
net energy use was used to evaluate energy production, energy consumption and net energy on a
monthly basis for each individual meter (192 apartments and 16 common area meters). PG&E
utility data were provided as monthly net energy values. Daily SunPower production data was
aggregated into monthly values corresponding to the PG&E billing periods for direct
comparison. Energy consumption was then calculated as the difference between these two values
according to the following equation.
Net Energy = Energy Consumption - Energy Production (1)
In this relationship, net energy is positive if the apartment unit or common meter consumed more
than it produced and negative if it produced more than it consumed.
4
The uncertainty of the net energy measurement is minimal provided the high accuracy of revenue-grade electricity
meters. The meters used at West Village are General Electric’s kV2c meter with a reported accuracy of ±0.2% for
energy and demand.
5
SunPower uses Continental Control System’s Wattnode WNC-3Y-208-MB for PV energy production
measurements with a reported accuracy of ±0.5% for energy.
8The majority of data presented in this report represent the 10-month period between March 2012
and December 2012, over which the two data sources coincide (see Table 3). Unfortunately, the
useful data ranges of available data for the two data streams did not seamlessly align. The PV
systems were installed, permitted, and operational by November 2011, at which point PG&E
switched over to a net energy meter. However, the SunPower monitoring meters came online
sometime between February and June 2012. The majority of the meters were operational and
accurately reporting PV production by March 1, 2012. For those SunPower meters that were not
operational by this date, 6 the PV systems themselves were assumed to be operational. This
assumption appeared to be valid after reviewing the net meter data for those units. For the
systems without operational production meters, the generation data were extrapolated back to
March 1, 2012, using production from PV systems with similar capacity and orientation and
which had later PV production that aligned well. Once a SunPower meter was determined to be
operating properly, any subsequent days with zero or missing production data were assumed to
be instances where the PV system was actually nonoperational. 7
Table 3. Valid Date Ranges for Collected Data
PG&E – Net SunPower – Production
Start Date November 2011 March 2012
End Date December 2012 January 2013
Annual consumption and production were estimated by further extrapolating PV production back
through January 2012. Annual PV production was estimated by using the 11-month PV
production data, as listed in Table 3, and the monthly fractions of annual production provided by
NREL’s PVWatts calculator, 8 which projects monthly system performance based on nominal
size, location, orientation, etc. (February 2012 production was estimated to be 5% of annual
production based on PVWatts). January 2013 production was used as a proxy for January 2012
production. Annual consumption was subsequently calculated for the January through December
2012 period using actual PG&E net data and the estimated annual production according to
equation 1.
3.3 Data Evaluation
Data evaluation was conducted to compare energy consumption, energy production, and net
energy for the following groups:
• Individual apartments
• Building common meter (central HPWH and building exterior lighting)
• By apartment type (two-, three-, and four-bedroom)
6
74 SunPower monitoring meters were not operational as of March 1, 2012. By May 1, 2012 all but five meters
were operational.
7
One exception to this assumption is when the reporting connection to the PV system is lost but the PV system is
still generating; in this case, once the connection is regained, the PV system reports the aggregate generation across
all of the days when the connection was lost. In these instances, the total generation value is accurate but needs to be
dispensed across the previously lost days.
8
http://www.nrel.gov/rredc/pvwatts/
9• By building type (Ramble A and Ramble B)
• Phase I student housing community in its entirety.
Comparisons were also made to original eQUEST modeling estimates for each apartment type.
Due to the limitations of BEopt with multifamily buildings, the BEopt software 9 was not
appropriate to use for this evaluation. However, assumptions used in the eQUEST model largely
followed the Building America Research Benchmark Definition (Hendron 2008) with the
following differences.
• Cooling thermostat set point of 78°F
• Heating thermostat set point of 70°F
• A multiplier of 0.58 (42% reduction) 10 applied to miscellaneous electric load (MEL)
usage to better align annual consumption with multifamily MEL usage presented in the
2009 Residential Appliance Saturation Study (RASS) (KEMA 2009)
• Altered vacation schedules as follows:
o Winter break – 2-week holiday break in January
Assumes no occupancy
20% lighting levels
67% MELs
Weighted average heating thermostat setback temperature of 65°F
o Spring break – 1 week in early April
Assumes 50% occupancy
50% lighting levels
78% MELs
Weighted average thermostat setback of 82°F cooling and 65oF Heating
o Summer break – 2 months in summer (July/August)
Assumes 50% occupancy
50% lighting levels
78% MELs
Weighted average cooling thermostat setback temperature of 82°F.
The eQUEST energy model was re-evaluated using and Actual Meteorological Year (AMY)
weather file from the Sacramento Metropolitan Airport (KSMF) National Oceanic and
9
BEopt v1.1 was used to evaluate a single four-bedroom apartment unit to provide estimated Benchmark savings of
37% as stated previously.
10
During the original design Building America used state specific multipliers, which for California was 0.77. The
additional reduction corresponds to a 25% decrease beyond the 23% attributed by the state multiplier.
10Atmospheric Administration weather station. These results were used for comparison to actual
energy consumption.
Apartment Energy Usage Disaggregation
Initially, DEG planned on disaggregating heating and cooling energy use from the base loads
using SunPower hourly energy consumption. Since these data were unavailable, ARBI was left
with only monthly energy consumption to use as a basis for disaggregation.
Monthly electricity usage for each apartment was disaggregated into two main categories: base
load and space conditioning. The Ramble student apartments are all-electric and use heat pumps
for both space heating and cooling; therefore, the process was simplified to evaluating a single
fuel only. The HPWHs are centrally metered and not considered in this disaggregation. The base
loads for a given residence were estimated from the “shoulder” seasons, which are times during
spring and fall that have little or no space conditioning. These seasons are necessary to
disaggregate the base load end uses from the temperature or seasonally dependent HVAC end
uses. Average energy use during the spring shoulder season (March–May) was used as the
monthly base load for each unit. Monthly multipliers for lighting energy from the Building
America House Simulation Protocols (Hendron et al. 2010) were applied to this base load to
estimate the seasonality of the use of interior lights. The difference between the monthly adjusted
base load and the average total apartment energy use was then taken as heat pump energy
consumption. The cooling season was assumed to be April through September with the
remaining months in the heating season. Averages across the Phase I population were taken to
estimate average disaggregated energy use for each of the three unit types (two-bedroom, three-
bedroom, four-bedroom apartment) and are presented in the results.
3.4 Cost Effectiveness
An economic analysis of the EEM package was completed to evaluate and compare the life cycle
costs (LCCs) for the Title-24 builder standard base case and the proposed ZNE package using
various financing scenarios. The evaluation terms are presented in Table 4. First year utility costs
were estimated using current year (2013) PG&E’s rates for the Davis region. Replacement costs
were assigned for lighting, the heat pump, and the HPWH. Any scenario was considered to be
cost effectiveness given the evaluation terms if its LCC was less than that of the base case. PV
cost effectiveness was not evaluated in this report.
Table 4. Evaluation Terms for Life Cycle Costing
Real Fuel Financing
Evaluation
Discount Escalation Interest
Period
Rate 11 Rate Rate
20 Years 3% 12 3% 13 5%
11
A real discount rate is the discount rate which factors in the effects of inflation.
12
3% is taken from the DOE 2010 real discount rate (U.S. Department of Commerce 2010).
13
Fuel escalation rates are very uncertain, 3% is an estimate only.
114 Results
4.1 Occupant Behavior
General feedback from WVCP after this first year of occupancy is positive. Student housing
retention from year 1 to year 2 has been relatively high at around 40%. While WVCP has
continued to market the energy and sustainability components and occupants generally appear
excited about these features, there is no evidence that they factor into the renters’ decision
process. This appearance of excitement does not necessarily translate into engaged occupants,
especially since they do not pay for their energy use and do not have access to information about
how much energy they use. Residents do have the ability to access an online SunPower account
that provides hourly electricity consumption and PV production, but the SunPower consumption
data are not valid and is of little value to occupants. SunPower and WVCP held three training
sessions throughout the past year on how to access and interpret the data available from the
website. Around 75–100 residents attended these sessions. Instructions for creating an account
were left in every apartment at the beginning of each lease. As of December 2012, only 27
residents have established accounts (this includes students from both Phase I and Phase II).
WVCP continues development of a methodology for holding residents responsible for exceeding
monthly utility usage targets, since excess use has direct cost implications for WVCP. Energy
modeling conducted by DEG was revised to evaluate the expected monthly apartment electricity
consumption by apartment type (number of bedrooms) using the worst orientation and after
removing any vacation schedules. Originally, WVCP’s plan was to monitor and notify residents
after any month they had surpassed the consumption allotments. After the second notification, a
fee would be assessed to the apartment occupants. Due to difficulty in processing monthly
apartment consumption data, they have not yet begun sending these notifications. Each
apartment unit is metered individually, resulting in 13 bills per building (12 apartments plus the
common meter). This situation creates the laborious task for WVCP of reviewing and analyzing
each utility bill singularly. Additionally, current utility regulations limit the ability of property
managers to charge fees to tenants for utilities. In California, the only utility they are allowed to
charge for is cold water consumption. However, the amount they can charge for cold water use is
potentially very minimal and it costs WVCP to read each cold water meter. On other properties
where they have implemented a similar methodology and charged for cold water usage, the cost
to read and assess the charges was greater than the income from the charges. Currently at West
Village there is a cold water meter at each apartment, but they are not reading any of them.
While this strategy involves penalizing occupants for excess use, WVCP is alternatively
considering adoption of a program that incentivizes residents for achieving low energy use below
the predefined threshold. Further evaluation of which strategies will be most successful, from a
cost-effective, motivational, and legal standpoint, is ongoing.
The apartments were initially designed to include a central energy consumption display and
smart power strips in each bedroom that could be programmed and controlled remotely. The
devices, developed by GreenWave, 14 were to be installed in each of the apartments to provide a
means of reducing plug load energy use. Due to conflicts with the wireless communication
between this device and the installed Internet infrastructure, these products were removed from
14
http://www.greenwavereality.com/solutions/
12the apartments before they were fully functional early in 2011 and will likely not be reinstalled.
This feature was an advertised component to students for the 2011–2012 leasing year and
residents were excited about it since it may have resonated with how they typically access and
control information in a digital manner. While WVCP is not actively researching other products,
WVCP is still interested in incorporating such a service in current or future phases of the project.
Since build-out of the West Village community continues, the WVCP team has been focused on
leasing activities and ensuring all buildings and systems are operational, and has not had the
opportunity to focus as much as it would like on tenant engagement. However, the current
WVCP team is enthusiastic about expanding educational activities and increasing resident
engagement in order to explain the occupant’s role in a high performance building and better
translate the community vision.
Several proposed ideas include a monthly educational series and community-level competitions
for energy use reductions. In late 2012, there was a pilot competition underway in which WVCP
and Architectural Energy Corporation are monitoring electricity by major end-use in 24
apartments scattered throughout the Phase I and II community (Risko 2012) . Twelve of the units
were part of a control and the other 12 were given feedback on their energy use, in the hopes of
educating residents and encouraging behavioral changes that will reduce their energy use. These
residents were provided with a list of tips and sent regular updates on their current usage, how
they were performing in relation to others in the competition, and personalized advice for how to
quickly bring their consumption down. WVCP reports that participants appeared to be very
receptive to feedback. Architectural Energy Corporation is expanding this monitoring effort to
120 additional apartments that will continue through the end of 2014. Another behavioral
evaluation underway is with the UC Davis Western Cooling Efficiency Center and Toyota. They
recruited 50 individual occupants in 50 separate apartments to participate and have provided all
of them with three specific energy-saving behaviors including hang drying clothes, turn off
computers at night, and reduce showering time. Half of these participants are provided with an
in-house “button,” which they are instructed to push each time they perform one of these energy-
saving acts. The device provides verbal positive feedback to the participants and records the
activity. This evaluation continued for 2 months.
4.2 Apartment Building Energy Use
The Phase I Ramble buildings consist of 12 apartments each, composed of two-, three-, and four-
bedroom units. Aside from the apartment units, each building has a single common meter on
which the central HPWH and exterior lighting are connected.
Apartment Unit Energy Use
Average apartment consumption (no domestic hot water use) by unit type (number of bedrooms)
is compared to eQUEST modeling estimates (using Annual Meteorological Year weather data) in
Figure 4. Average actual consumption over a 12-month period exceeded projected use by 23%
for both the three-and four-bedroom units, while the two-bedroom units indicated 4% lower than
projected usage.
The monitored monthly use profiles follow a similar trend seasonally with the exception of the
two-bedroom apartments that demonstrate a pronounced dip in energy use from May through
September 2012, which would seem to indicate lower average summer occupancy. With two
13occupants there is a greater chance that both occupants will be gone over the summer compared
to apartments with three or four occupants. On average, the three-bedroom and four-bedroom
apartments appear to be fully or partially occupied during the summer. The load reductions that
were predicted in the model based on expected vacancy during the summer months are not
observed in the data.
900
800
700
600
Consumption [kWh]
500 2-Bed - Actual
2-Bed - Model
400
3-Bed - Actual
300 3-Bed - Model
4-Bed - Actual
200
4-Bed - Model
100
0
Month/Year
Figure 4. Modeled and actual average monthly consumption values for each apartment type
(by number of bedrooms)
Figure 5 presents a histogram comparing the ratio of “actual-to-modeled” 10-month energy
consumption for each of the 192 apartments (modeled use shown as black bar at 100%). There is
a wide variation in annual consumption with roughly a 4:1 ratio between high and low usage
apartments. Roughly half of the apartment units have consumption values within 25% of
modeled predictions and about 85% of the three- and four-bedroom apartments consume more
energy than what was predicted. Only 39% of the two-bedroom apartments consume more
energy than predicted. Figure 11 through Figure 13, in the Appendix, are additional graphs that
show this comparison by apartment type.
1412
10
8
Frequency
6
2-Bed
3-Bed
4 4-Bed
2
0
100%
105%
110%
115%
120%
125%
130%
135%
140%
145%
150%
155%
160%
165%
170%
175%
180%
185%
190%
195%
200%
40%
45%
50%
55%
60%
65%
70%
75%
80%
85%
90%
95%
Percent of Modeled
Figure 5. Histogram showing individual apartment energy consumption variation
Heating and cooling energy use was disaggregated from all other energy (lighting, appliances,
and plug loads). This is shown in Figure 6 for the average four-bedroom apartment (see the
Appendix for the results for all apartment types). The 12-month heating and cooling energy use
is 54% lower than projected values, but the base load energy use is 54% higher than projected
values (green dotted lines) and total energy use for the average four-bedroom apartment is 23%
higher than projected values. Space conditioning may be lower due to some combination of
occupants using less aggressive thermostat set points than assumed (78°F in cooling and 70°F in
heating), occupants relying on the ceiling fans during the summer, and the apartments
performing better than expected thermally. One hypothesis for the high base load consumption is
the “multiple household” effect, whereby student occupancy tends to have more duplication of
certain electronic devices (computers, gaming stations, TVs, etc.) that would skew consumption
away from what might be expected from the more typical multifamily household usage
represented in the California RASS data. Entertainment and computing devices may likely be
located in each bedroom instead of shared in the living area. While lighting may also be a
contributing factor, it is theorized that it is less so than plug loads because of vacancy sensors
installed throughout the apartments.
In order to compare actual non-HVAC energy use with current Building America assumptions,
the original model was revised to use the MEL assumptions in the current House Simulation
Protocols (Hendron et al. 2010). In addition to ARBI’s 25% reduction to better align total MEL
energy use with California RASS data, the California state multiplier of 0.77 was also removed,
since this has been eliminated in the most current version of the House Simulation Protocols to
15keep assumptions consistent nationwide. 15 The four-bedroom apartments were selected for this
comparison because they exhibited the most pronounced difference in base load consumption,
and based off the conclusions of the “multiple household” effect, they would most likely have
the greatest duplication of MELs. With this change, actual base load energy consumption is
within 24% of modeled values, as shown in Figure 6 (gray dotted line). Although not shown in
the graphic, if the vacation assumptions are also removed from the modeling estimates, actual
base load energy consumption becomes only 17% greater than this revised modeling estimate.
800
700
Ltg+App+MEL - Actual
600
Energy Usage [kWh]
Ltg+App+MEL - Model
500 (RASS)
Ltg+App+MEL - Model
400 (Align with Current HSP)
Heating - Actual
300
Heating - Model
200
Cooling - Actual
100
Cooling - Model
0
1 2 3 4 5 6 7 8 9 10 11 12
Month
Figure 6. Average disaggregated energy use over 12 months
(March 2012 to February 2013) for the four-bedroom apartments 16
Domestic Hot Water and Common Meter Energy
Figure 7 compares modeling estimates for common meter energy consumption with actual
consumption. Values for 14 common meters are averaged in the solid red line. 17 Actual
consumption is much higher than original predictions. Seasonal variations in the water heating
load are also more pronounced than estimated.
The water heaters are set up to operate primarily in heat pump mode and use minimal electric
resistance heating for backup during times of high load or low outdoor air temperatures. There
15
Note that this was a post-process alteration and therefore the change in MEL load did not affect space
conditioning energy use.
16
Disaggregation results are estimates only and are not based on submetering. Preliminary results from a parallel
monitoring project that includes end-use submetering indicate that total HVAC may be higher than is estimated here
and is primarily a result of system fans being operated continuously. Fan energy use not associated with heating and
cooling operation will show up as base load energy in this disaggregation process, not heating and cooling energy.
17
One building meter is not shown here because it supports a large site lighting load that cannot be separated from
the common meter energy use. Another had unreliable or missing data for a portion of the year.
16have been ongoing issues with heat pump operation, resulting in excessive resistance heat
operation and consequently high electricity use. It is hypothesized that this is the primary result
of the high energy consumption; however, it is possible that there are higher than estimated
recovery loads. Further investigation is needed to better qualify the high energy use.
ARBI has installed detailed monitoring on one of the HPWH systems (ARBI 2013), which has
provided performance data and helped identify potential operating problems. Monitoring has
shown that when commissioned correctly system efficiencies track relatively well with
manufacturer engineering performance data. Without proper feedback it has proved difficult to
identify operational problems, which has led to systems running in electric resistance mode for
long periods before the issue is recognized.
The Phase I heat pumps were installed by plumbers with no previous experience with HPWHs.
After ARBI completed the installation of monitoring equipment in September 2011, it was
quickly identified that the systems were not properly commissioned or operating correctly and
were operating exclusively in electric resistance mode. Over the first year of operation, there
have been several instances of heat pump operational issues, and several of the systems appear to
be having more problems than others, resulting in high energy use. The water heaters installed in
later phases have been installed and commissioned by mechanical contractors who may be more
suited to install such systems given their experience with heat pumps. These systems do not
appear to have the operational problems evident in Phase I and the installation/commissioning
issues have not been present now that the installers are more familiar with the heat pumps.
4,500
4,000
3,500
Consumption [kWh]
3,000
2,500
2,000 Avg. Actual Common Meter
1,500 Model - Common Meter
1,000
500
0
Month/Year
Figure 7. Monthly average common meter use compared to modeled (15 buildings)
17Figure 8 shows the variation in common meter energy consumption across the 14 buildings.
Only four of the buildings are operating within a reasonable range from the expected value
(within 25%), with 10 buildings 34%–216% higher than modeling estimates predicted.
80
Ramble A Ramble B
70 Model - Ramble A Model - Ramble B
60
Consumption [MWh]
50
40
30
20
10
0
Common Meter
Figure 8. Actual common meter energy consumption for 14 buildings over 12 months
(March 2012 to February 2013)
4.3 Phase I Zero Net Energy Evaluation
The first year’s performance in regards to achieving project ZNE goals for the Phase I
community was completed using monthly utility net meter and SunPower PV production data.
This is a preliminary evaluation because the ZNE goals have been set for the entire community,
which is still being built out. Because of the operational and installation issues with the HPWHs
resulting in high energy use, energy usage for the common meters was separated out from the
apartment meters.
Table 5 and Figure 9 show overall PV production is 4% greater than projected, suggesting good
alignment with the SunPower model. 18 On the consumption side, apartment usage is 18% higher
than projected, while common area usage is 55% higher than the original estimates. Overall,
combined consumption is 28% higher than projected.
18
In comparing monthly measured PV generation to theoretical generation estimated by NREL PVWatts, the two
values correlated well for most of the months. However, in the period of July through October there is a fairly strong
divergence as the actual generation data falls much more rapidly than the projected data. It is hypothesized that this
is due to dust accumulation and hotter PV operating temperatures, which would be removed after the first significant
rain of the season. Increased production might be realized if regular panel array cleaning is conducted during the
summer. SunPower includes an assumption for reduced performance due to dirt accumulation in its annual
projections.
18Table 5. Projected and Actual Production, Consumption, and Net Energy Values
Production Consumption Net Energy
(MWh) (MWh) (MWh)
Projected Actual % Diff Projected Actual % Diff Actual
Apartments 1,024 1,110 8% 1,163 1,377 18% 267.3
Common
471 451 -4% 390 602 55% 151.1
Meter
Total 1,495 1,561 4% 1,552 1,979 28% 418.4
2,500
2,000
Energy [MWh]
1,500
Common Areas
1,000 Apartments
500
0
Projected Projected Actual Actual
Production Consumption Production Consumption
Figure 9. Comparison of annual Phase I consumption and production
Figure 10 presents monthly net, production, and consumption values over the entire Phase I
community for the 12-month evaluation period. The net values are negative when production
surpasses consumption and positive when consumption is greater than production. The
community is a net producer for 3 months out of the year (May through July) with three months
in the shoulder season (April, August, and September) when consumption roughly equals
production. The magnitude of the summer net production is not large enough to offset the winter
effect when consumption rises and PV production falls.
19225
200
175
150
125
Energy [MWh]
100
75 Cons.
50 Prod.
25 Net
0
-25
-50
Month/Year
Figure 10. Total consumption, production, and net values for all Phase I buildings
4.4 Cost Effectiveness
An economic analysis of the package of EEMs was completed to evaluate cost effectiveness.
There are no split incentives in this project since the developer investing the dollars in energy
efficiency is also the utility bill owner. However, projects where tenants pay utility bills are
presented with a unique set of challenges in justifying the investment to the developer.
Based on the results of energy data disaggregation, actual HVAC energy consumption appears to
be lower than original estimates. It is also expected that once the operational issues are resolved
on the HPWHs that system performance should be consistent with expectations. Actual domestic
hot water recovery loads may be higher than estimated; however, higher draws would impact
both the base case and improved cases. Provided that the majority of EEMs affect space
conditioning and domestic hot water energy use, it was concluded that original model results can
be used with some confidence to conduct a cost effectiveness evaluation. While high efficacy
lighting and ENERGY STAR appliances were components of the EEM package, there are not
sufficient data to separate these end uses from the total base load. The presence of vacancy
sensors in each major space in the apartments reduces the impact of occupant behavior on total
lighting hours and increases likelihood that lighting savings will be realized. The assumption
upon which this cost evaluation is contingent is that the high base load seen in the above graphs
is primarily due to increased plug loads.
Table 6 demonstrates the key inputs to the LCC evaluation that was conducted over a 20-year
period. First-time costs and savings were calculated for a single Ramble A 12-unit building.
20You can also read