An inter-model assessment of the role of direct air capture in deep mitigation pathways
←
→
Page content transcription
If your browser does not render page correctly, please read the page content below
ARTICLE
                  https://doi.org/10.1038/s41467-019-10842-5                 OPEN

                  An inter-model assessment of the role of direct air
                  capture in deep mitigation pathways
                  Giulia Realmonte1, Laurent Drouet 1, Ajay Gambhir2, James Glynn                                     3,   Adam Hawkes2,
                  Alexandre C. Köberle2 & Massimo Tavoni 1,4
1234567890():,;

                  The feasibility of large-scale biological CO2 removal to achieve stringent climate targets
                  remains unclear. Direct Air Carbon Capture and Storage (DACCS) offers an alternative
                  negative emissions technology (NET) option. Here we conduct the first inter-model com-
                  parison on the role of DACCS in 1.5 and 2 °C scenarios, under a variety of techno-economic
                  assumptions. Deploying DACCS significantly reduces mitigation costs, and it complements
                  rather than substitutes other NETs. The key factor limiting DACCS deployment is the rate at
                  which it can be scaled up. Our scenarios’ average DACCS scale-up rates of 1.5 GtCO2/yr
                  would require considerable sorbent production and up to 300 EJ/yr of energy input by 2100.
                  The risk of assuming that DACCS can be deployed at scale, and finding it to be subsequently
                  unavailable, leads to a global temperature overshoot of up to 0.8 °C. DACCS should therefore
                  be developed and deployed alongside, rather than instead of, other mitigation options.

                  1 RFF-CMCC    European Institute on Economics and the Environment (EIEE), Centro Euro-Mediterraneo sui Cambiamenti Climatici, Milan 20144, Italy.
                  2 Imperial College London, Grantham Institute, London SW7 2AZ, UK. 3 MaREI Centre, Environmental Research Institute, University College Cork, Cork T23
                  XE10, Ireland. 4 Department of Management, Economics and Industrial Engineering, Politecnico di Milano, Milan 20156, Italy. Correspondence and requests
                  for materials should be addressed to G.R. (email: giulia.realmonte1@gmail.com)

                  NATURE COMMUNICATIONS | (2019)10:3277 | https://doi.org/10.1038/s41467-019-10842-5 | www.nature.com/naturecommunications                             1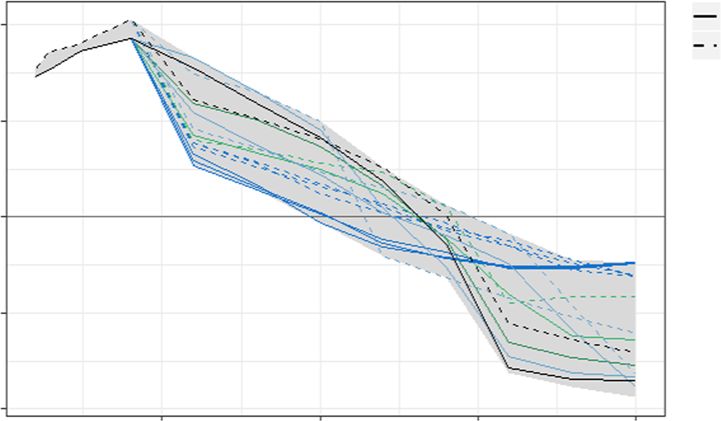
ARTICLE                                                                 NATURE COMMUNICATIONS | https://doi.org/10.1038/s41467-019-10842-5

T
        he Paris Agreement has set ambitious objectives to keep                 This paper investigates the role of DACCS as part of a diver-
        global warming well below 2 °C, and the scientific debate             sified portfolio of mitigation strategies, so as to inform policy-
        has recently focused on the pursuit of 1.5 °C targets1. Given        makers about its potential in low stabilization scenarios. We
the current level of CO2 emissions approaching 40 GtCO2/year2                incorporate detailed technical and economic characteristics of a
and the delay of global mitigation efforts, large-scale removal of           range of DACCS technologies into two IAMs, using the latest
CO2 from the atmosphere will likely be needed. Studies on                    available estimates from the literature17. Considering the large
Negative Emission Technologies (NETs), also referred to as                   degree of uncertainty around this new technology, besides para-
Carbon Dioxide Removal (CDR), have been conducted for almost                 metric sensitivity analysis, we implement a model comparison
two decades, but the topic has received more attention since the             adopting two complementary IAMs: a bottom-up technology rich
IPCC’s Fifth Assessment Report (AR5) published in 20133.                     model (TIAM-Grantham) and a hybrid, economy-climate model
   Bioenergy with Carbon Capture and Storage (BECCS) and                     (WITCH). We also explore the requirements in terms of resource
afforestation are considered the most likely options to realise              use and the consequences of DACCS failure on global
negative emissions, and have been largely investigated in many               temperature.
Integrated Assessment Modeling (IAM) studies. However, con-                     Results suggest that DACCS allows an easing of near term
cerns about the sustainability of biological strategies and com-             mitigation, and can significantly reduce climate policy costs.
petition with food, water use, and ecosystems4,5 have led to a               DACCS complements, rather than substitutes other negative
focus on alternatives to sequester carbon from the atmosphere.               emission technologies. The key factor governing the role of
Direct Air Carbon Capture and Storage (DACCS) is a com-                      DACCS compared to other mitigation and negative emissions
plementary technology; it can capture the CO2 produced by                    strategies is the rate at which DACCS capacity can be ramped up.
distributed sources, is modular and does not have major water                Such a massive deployment requires a major refocusing of the
and land interactions5–7, while competing for geological storage             manufacturing and chemical industries for sorbent production,
with other carbon sequestration options. To date, only a few                 and a large need for electricity and heat. Assuming that DACCS
modeling exercises have included CDR measures other than                     can be deployed at scale, and finding it to be subsequently una-
afforestation and BECCS, and never in an inter-model compar-                 vailable, leads to a global temperature overshoot of up to 0.8 °C.
ison8–10.                                                                    Our results therefore show the considerable potential of DACCS
   DACCS captures CO2 from ambient air and subsequently                      but also highlight a large number of challenges which commend
stores it. Despite being at an early stage of development, it is             caution and further scrutiny.
gaining increasing attention, with multiple companies developing
designs at a commercial scale11–13. Compared to other seques-
tration options, capturing CO2 directly from the air presents a              Results
number of advantages. Like other NETs, it can address dis-                   Modeling DACCS within integrated assessment models.
tributed emissions, such as those from transport, aviation and               Compared to previous studies including DACCS in IAMs8–10,16,
intensive industrial sectors, together accounting for almost 50% of          we distinguish among different technology options, namely
total emissions14. Designs for DACCS plants are diverse, some of             DAC1 and DAC2 as described above. We include the use of waste
them being modular, which extends a prospect of more rapid                   heat to operate the amine-based plants, recovering it from
scaling15. Most demand little land, although some might still                energy-intensive industries and renewable power plants. In order
require significant although reduced water inputs5,16. Their main             to define energy inputs and cost assumptions, we combine data
drawback is the low concentration of carbon dioxide in ambient               from the available literature with estimates from the companies
air, meaning that a large amount of energy input is required.                operating the first demonstration plants. Given the large uncer-
   Two groups of technologies can be identified as most pro-                  tainty, we specify scenarios which have high and low levels of the
mising, from a technical and economic perspective. The first                  key techno–economic parameters (see Table 1–3). Technology
(hereafter named as DAC1) is based on using water solutions                  representation is further discussed in Methods.
containing hydroxide sorbents with a strong affinity for CO2,                    We use two different IAMs, TIAM-Grantham, and WITCH.
such as sodium hydroxide, calcium hydroxide and potassium                    TIAM-Grantham is a bottom-up energy system model, with a
hydroxide6,17–20. The second (DAC2) uses amine materials                     detailed representation of technologies across sectors. WITCH
bonded to a porous solid support12,21–23. A wider range of solid             combines a bottom-up energy sector description with a top-down
sorbents are being investigated (e.g. ionic membranes24, zeo-                macro-economic approach. Detailed information about both
lites25, solid oxides26), but were not included in our analysis as           models can be found in Supplementary Notes 1–3.
they are still at the research stage. Hydroxide solutions require               According to the different model features, in TIAM-Grantham
high-temperature heat to be regenerated (T > 800 °C), which can              we have implemented both DACCS technologies, and explicit
be provided by burning natural gas, while amine adsorbents                   characterization of the recovery of waste heat, while in WITCH
require only approximately 85–120 °C, meaning that waste heat                we have only included DAC1, fuelled by natural gas. We
can be used. While DAC1 is based on large scale plants, capturing            harmonize a range of input assumptions, which are later shown
1 MtCO2/year, DAC2 has a modular design, that might be sui-                  to be critical in determining model outcomes, regarding
table for mass production and potentially rapid cost reduction               technology take-up levels and rates. In addition, DACCS costs,
(see Methods). DAC1 technology is more mature. It employs                    input and output flows and carbon budgets have been aligned
equipment already developed and adopted in other sectors (e.g.               between models. Cost reductions have been applied to model
pulp and paper industry): the major expenditure is related to                technical learning, with an exogenous learning rate in TIAM-
capital investment for building plant facilities, with limited               Grantham and an endogenous one in WITCH. In both models,
potential for future cost reduction. Conversely, for DAC2 the                expansion constraints have been implemented as a 20% annual
potential for design and cost improvement is arguably higher, but            growth rate cap, according to historical benchmarks for
issues regarding sorbent degradation may lead to high operational            technology development28). We impose the global maximum
expenditure. Currently there is huge uncertainty on DACCS                    capacity at 30 GtCO2/year, in line with past NETs potential
economics, with estimates in the literature ranging from 100 to              assessments8–10,29,30. BECCS and afforestation are included in
1000 $/tCO27, according to the different designs proposed and the            both models (see Supplementary Note 4 and Supplementary
purity level of the captured CO2/year27.                                     Table 1).

2                NATURE COMMUNICATIONS | (2019)10:3277 | https://doi.org/10.1038/s41467-019-10842-5 | www.nature.com/naturecommunications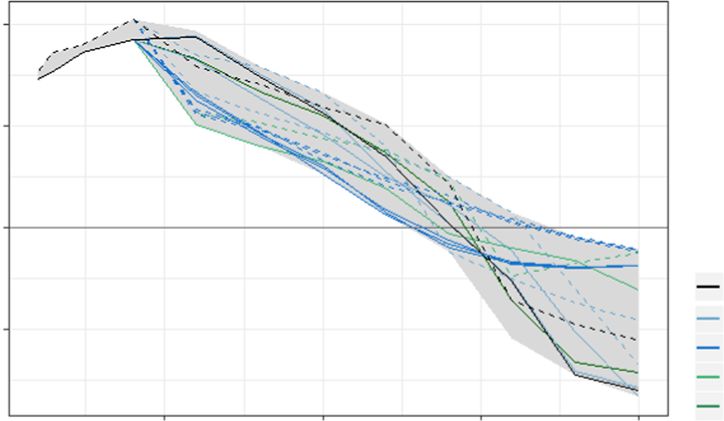
NATURE COMMUNICATIONS | https://doi.org/10.1038/s41467-019-10842-5                                                                                                                ARTICLE

 Table 1 Scenario overview

 Scenario           Description                                                                                                               Cost      Energy      Max cap           Growth rate
 Central case
  NoNET             No BECCS and no DACCS, only afforestation allowed (+traditional CCS)
  NoDAC             No DACCS available, only BECCS and afforestation as NETs (+traditional CCS)
  DAC               Full NET portfolio: DACCS, BECCS and afforestation (+traditional CCS)                                                     High      High        30 Gt/year        20%
 Sensitivity
  LowCost           Lower end for cost estimates, both for DAC1 and DAC2                                                                      Low       High        30 Gt/year        20%
  LowEnergy         Lower end for energy requirements, both for DAC1 and DAC2                                                                 High      Low         30 Gt/year        20%
  gr15%             Lower annual growth rate for DACCS                                                                                        High      High        30 Gt/year        15%
  gr30%             Higher annual growth rate for DACCS                                                                                       High      High        30 Gt/year        30%
  Gt - gr20%        Maximum capacity for DACCS plants limited to 3 GtCO2 /year, 20% annual growth                                             High      High        3 Gt/year         20%
  Gt - gr15%        Maximum capacity for DACCS plants limited to 3 GtCO2 /year, 15% annual growth                                             High      High        3 Gt/year         15%
  Gt - gr30%        Maximum capacity for DACCS plants limited to 3 GtCO2 /year, 30% annual growth                                             High      High        3 Gt/year         30%
  LowDisc           Low discount rate applied, close to 0% (see Supplementary Note 2)                                                         High      High        30 Gt/year        20%
  LowStorage        Limited storage availability, according to model characteristics (see Supplementary Note 3)                               High      High        30 Gt/year        20%
 This table shows the scenario names and key characteristics. Note that all sensitivities apply to the DAC scenario, i.e. the scenario where all three of afforestation, BECCS and DACCS are available

                                                                                                      Although similar levels of CO2 removal are present in some existing
 Table 2 Energy and cost assumptions, high and low scenario                                           IAM scenarios3, these are as large as current net emissions (Fig. 1).
                                                                                                         In terms of policy cost, DACCS reduces the marginal
 Technology                  Electricity [GJ/             Heat [GJ/            Cost                   abatement costs to achieve the climate target by between 60 to
                             tCO2 ]                       tCO2 ]               [$/tCO2 ]              more than 90%. The 2030 global carbon prices with DACCS are
 DAC1               High     1.86                         8.16                 30019                  below 100 and 200 $/tCO2 for 2 and 1.5 °C respectively (Fig. 1b).
                    Low      1.317                        5.317                18017                  It should be noted that reaching a 1.5 °C target without relying on
                    Floor                                                      10017                  NETs is infeasible for both models, highlighting the key role
 DAC2               High     1.122                        7.222                3506                   NETs can play in increasing the feasibility of ambitious climate
                    Low      0.668                        4.468                20038                  targets. While questions arise about the inter-generational equity
                    Floor                                                      5070                   of these pathways, as DACCS allows a reduction in near term
 This table shows the energy and cost assumptions for DACCS. Costs refer only to capital, labour
                                                                                                      mitigation effort in some energy-intensive sectors that are
 and maintenance expenditure, while energy costs are determined endogenously by the models.           difficult to decarbonize, such as transport and industry. Higher
                                                                                                      emissions are allowed from these sectors when a full portfolio of
                                                                                                      NET options is available (see Supplementary Fig. 1), and oil still
                                                                                                      accounts for a large share of the primary energy Supplementary
 Table 3 Carbon budgets imposed, 66% probability                                                      up to 2050 (see Supplementary Fig. 2 and Supplementary Note 5).
                                                                                                         DACCS appears to be a long-term mitigation measure, as it is
                                                                                                      largely deployed in the latter part of the century. Other NETs
 Climate target                                 Carbon budget 2016–210066
                                                                                                      such as BECCS and afforestation are more evenly deployed over
 2 °C                                           810 GtCO2                                             time, because they are more cost competitive (Fig. 2). Moreover,
 0.5 °C                                         220 GtCO2
                                                                                                      BECCS is able to produce carbon negative energy when it is
 This table shows the carbon budgets, defined as the cumulative CO2 emissions from 2016 to             deployed with new bioenergy capacity (as opposed to adding CCS
 2100, for the climate targets. These are associated with a 66% probability to keep the
 temperature below 2 and 1.5 °C, respectively.
                                                                                                      to existing bioenergy capacity, which rather constitutes an energy
                                                                                                      penalty). By contrast, DACCS is treated by the models as a
                                                                                                      backstop to the exponential increase in the marginal abatement
   We focus on scenarios consistent with 2 and 1.5 °C                                                 cost. It therefore substitutes for emission reductions more than
temperature increase limits. For each temperature scenario, we                                        other NET strategies, but does not provide a primary or
run three variant cases: one with only afforestation (NoNET                                           secondary energy source for end-use services and requires
scenario); one with afforestation and BECCS as per most                                               additional primary energy supply.
published IAM-based studies (NoDAC); and a third one                                                     In terms of the relation between different NETs, the total
including DACCS in the mitigation portfolio (DAC). We perform                                         amount of CDR increases in line with the number of options that
sensitivity analysis on energy inputs, costs, growth constraints,                                     are available. There is some substitution: BECCS is reduced by
discount rates and storage availability to test the robustness of                                     20–37% in DAC scenarios. Overall, though, both strategies are
model results. Table 1a summarizes all the scenarios.                                                 developed in tandem so as to avoid excessive specialization and
                                                                                                      consequently reduce risks and costs. Among the different DACCS
                                                                                                      options considered in TIAM-Grantham, the one based on solid
Central case scenarios. DACCS has a significant influence on the                                        amine sorbents (DAC2) appears the preferred one, especially with
mitigation pathway shape and the timing of peak emissions.                                            stringent mitigation. This can be related to residual emissions
Enabling DACCS as a technology option results in larger net                                           associated with burning natural gas for DAC1 heat provision
emissions until around 2070, compensated by larger negative                                           (Supplementary Fig. 3a).
emissions thereafter in both models. In 2030 for a 1.5 °C scenario,                                      Figure 3 shows the implications for the electricity sector.
DACCS allows emissions to increase by between 10 and 25–30                                            DACCS long-term deployment reduces the need for a drastic
GtCO2. These emissions are similar to those of 2 °C scenarios                                         decarbonization of the power sector. This is evident mainly from
without DACCS. Conversely, at the end of the century in 1.5 °C                                        TIAM-Grantham results: in 2030 the electricity mix in DAC
scenarios net negative emissions increase from 10 to 30 GtCO2/year.                                   scenarios is not considerably different from Business-As-Usual,

NATURE COMMUNICATIONS | (2019)10:3277 | https://doi.org/10.1038/s41467-019-10842-5 | www.nature.com/naturecommunications                                                                                 3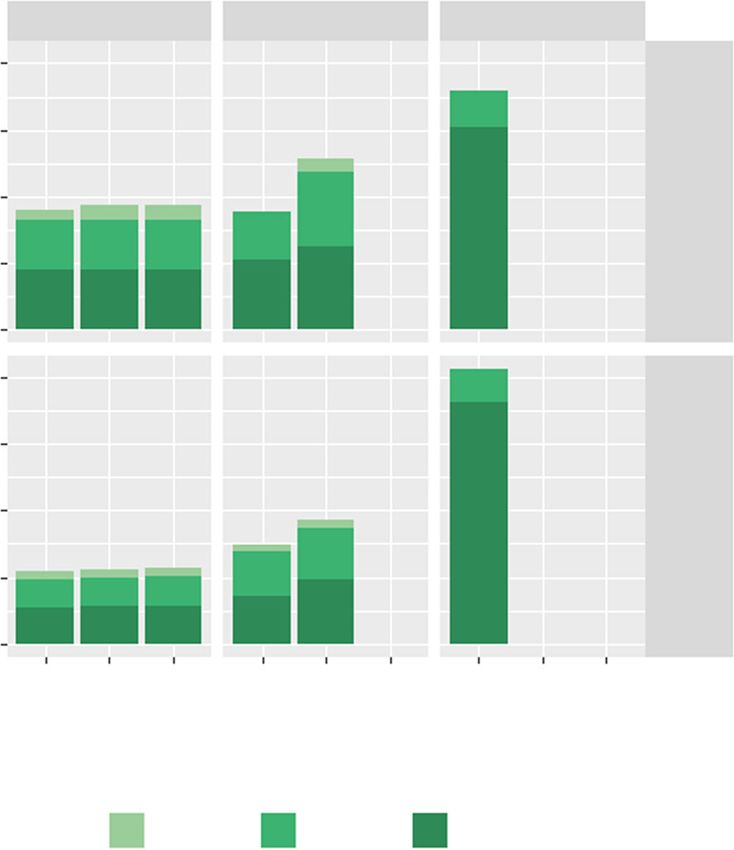
ARTICLE NATURE COMMUNICATIONS | https://doi.org/10.1038/s41467-019-10842-5
a Net emissions
1.5 °C 2 °C
40
Gt/yr 20
0
–20
2025 2050 2075 2100 2025 2050 2075 2100
Year
1.5 °C - DAC 1.5 °C - NoDAC TIAM WITCH
Scenario
2 °C - DAC 2 °C - NoDAC 2 °C - NoNET
b
Scenario 2 °C 1.5 °C
TIAM WITCH TIAM WITCH
DAC 23 80 50 151
No DAC 117 194 2119 446
No NET 3711 272 Infeasible
Fig. 1 CO2 emission pathways and carbon price in 2030 in central case scenarios. CO2 emissions (a) are from fossil fuel burning only, while the carbon
price (b) is expressed in USD per ton of CO2
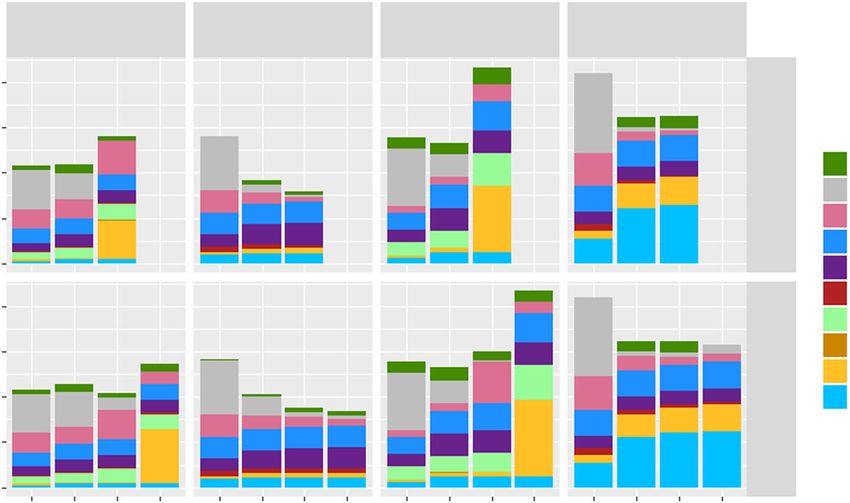
Cumulative sequestration - 2 °C Cumulative sequestration - 1.5 °C
Afforestation BECCS DACCS Afforestation BECCS DACCS
800
750
600
500
400 TIAM TIAM
250
200
Cum Gt
Cum Gt
0 0
800
750
600
500
400 WITCH WITCH
250
200
0 0
DAC
NoDAC
NoNET
DAC
NoDAC
NoNET
DAC
NoDAC
NoNET
DAC
NoDAC
NoNET
DAC
NoDAC
NoNET
DAC
NoDAC
NoNET
Scenario Scenario
2020–2040 2040–2070 2070–2100 2020–2040 2040–2070 2070–2100
Fig. 2 Cumulative sequestration of negative emissions technologies throughout the century in central case scenarios, with different temperature targets.
The short (2020–2040), mid (2040–2070), and long-term role (2070–2100) of each strategy has been highlighted
i.e. with no carbon constraint. Reaching a 1.5 °C target relying Sensitivity on techno–economic parameters. Energy require-
only on BECCS and afforestation (NoDAC) requires 50% of ments and investment costs for DACCS are currently uncertain.
electricity generation to come from intermittent renewable However, sensitivity analysis with the two IAMs shows that the
sources by 2030, and a higher electrification across sectors, influence of these parameters is limited in determining the overall
increasing the overall electricity demand (up to 70% more than in DACCS deployment (Fig. 4a). Only in TIAM-Grantham, with a
DAC scenarios). Moreover, DACCS enables delaying the phase- 2 °C warming, lower energy consumption leads to 125 GtCO2
out of fossil-based electricity generation until after 2050. more captured along the century. With a more stringent target
4 NATURE COMMUNICATIONS | (2019)10:3277 | https://doi.org/10.1038/s41467-019-10842-5 | www.nature.com/naturecommunications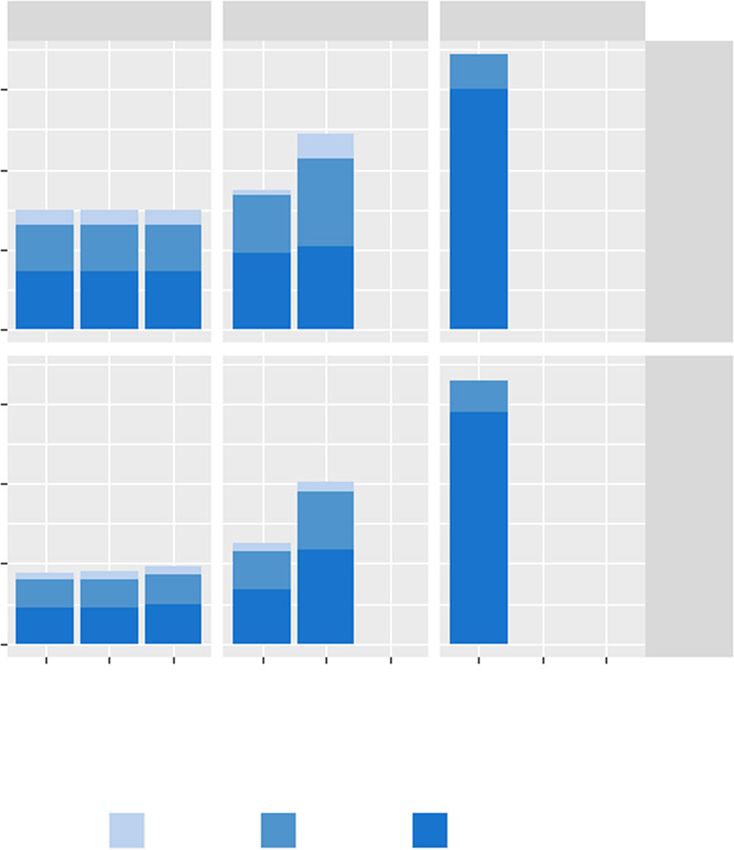
NATURE COMMUNICATIONS | https://doi.org/10.1038/s41467-019-10842-5 ARTICLE
Electricity production
2030 2030 2050 2050
TIAM WITCH TIAM WITCH
200
150
1.5 °C Biomass
100
Coal
50 Gas
Hydro
0
EJ/yr
Nuclear
Oil
200
Other RNW
150 Other sources
Solar
100 2 °C
Wind
50
0
BAU
DAC
NoDAC
NoNET
BAU
DAC
NoDAC
NoNET
BAU
DAC
NoDAC
NoNET
BAU
DAC
NoDAC
NoNET
Scenario
Fig. 3 Electricity mix in 2030 and 2050 in central case scenarios, compared to the Business-As-Usual (BAU). BAU assumes no mitigation policy to be
implemented from 2020 on: economic and population growth are calibrated according to Shared Socio-Economic Pathways 2 in both models
Variation in cumulative DACCS
TIAM WITCH
Net emissions - 1.5 °C
40 TIAM
WITCH
1000
Cum GtCO2
20
1.5 °C
GtCO2/yr
0
500
–20
0 –40
2025 2050 2075 2100
Year
Net emissions - 2 °C
900
40
Cum GtCO2
600 20
2 °C
GtCO2/yr
0
300 Scenario
DAC (central)
–20 Annual growth rate
Limited mix cap
0 Low disc rate
Low storage
DAC
gr15%
gr30%
3Gt gr15%
3Gt gr20%
3Gt gr30%
LowCost
LowEnergy
LowDisc
LowStorage
DAC
gr15%
gr30%
3Gt gr15%
3Gt gr20%
3Gt gr30%
LowCost
LowEnergy
LowDisc
LowStorage
2025 2050 2075 2100
Year
Scenario
Fig. 4 Sensitivity on key parameters: in a light green bars show the change in cumulative sequestration by DACCS with respect to the base case (i.e. DAC
scenario, represented by the first bar) across all sensitivities; b shows the emission pathway. Sensitivities have been grouped into four categories to
highlight the most influential factors: those related to annual growth rates, maximum capacity, discount rates and storage availability. Energy and cost
sensitivities are not included due to the limited impact of these parameters
NATURE COMMUNICATIONS | (2019)10:3277 | https://doi.org/10.1038/s41467-019-10842-5 | www.nature.com/naturecommunications 5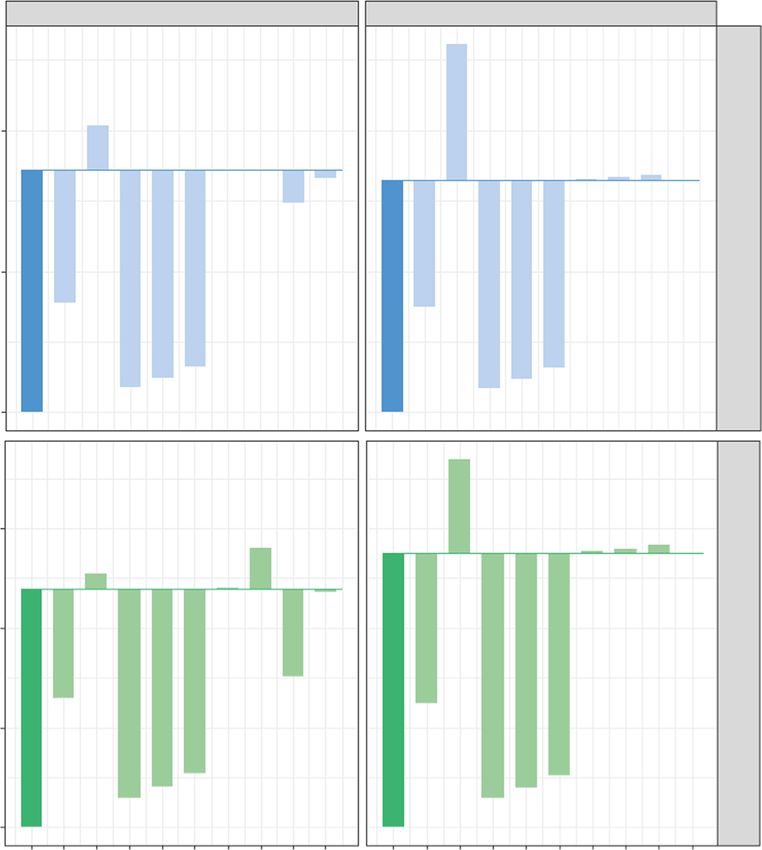
ARTICLE                                                                                 NATURE COMMUNICATIONS | https://doi.org/10.1038/s41467-019-10842-5

                                               Historical technology diffusion
                                        1.00      Technology
                                                       K = 376,690 MW
                                                                                                                     Logistic fit (Wilson, 2012)
                                                       K = 1,146,150 MW
                                                       K = 404,414 MW
                                                                                                                         NG power (1903–2000 fit)
                                        0.75                                                                             Coal power (1908–2000 fit)
                                                       K = 3562 MW
                                                                                                                         Nuclear power (1956–2000 fit)
                                                       K = 30 Gt/yr
                                                       K = 30 Gt/yr
                                                                                                                         Danish wind (1977–2008 fit)

                          Index (K=1)
                                                       K = 30 Gt/yr                                                  Model results
                                        0.50           K = 444,014 MW                                                   DACCS - 20%
                                                       K = 541,893 MW                                                   DACCS - 15%
                                                                                                                        DACCS - 30%

                                                                                                                     Capacity data (BP, 2018)
                                        0.25                                                                            Solar (1996–2017)
                                                                                                                         Wind (1996–2017)

                                        0.00
                                                 0.0                      2.5    5.0            7.5           10.0
                                                                                 Time

Fig. 5 Comparison of DACCS up-scaling with historical technology diffusion. Past technology diffusion pathways are based on data from Wilson33 and
recent statistics for solar PV and wind35. As these technologies have been diffusing in different years and with different scales (i.e. the extent K reached by
the logistic profile), we have normalized the data indexing the capacity extent K to 1, and we have harmonized the starting year (t = 0), considering a unit
time scale equal to one decade

(1.5 °C) this technology is deployed at the highest rate allowed, so                        about twice the maximum rate of BECCS in similar mitigation
that the only effect is on the share of the different DACCS                                 scenarios15. Historical data can been used for benchmarking growth
technologies (see Supplementary Fig. 3b).                                                   rates, so to help understand the feasibility of the foreseen diffusion
   Conversely, expansion constraints are the key parameters                                 pathways for DACCS. Typical historical rates are between 15 and
determining DACCS deployment, especially for a 1.5 °C target                                20% per year28, with the high end referring to modular technolo-
(Fig. 4a). This is in line with the existing literature8,9 but creates a                    gies, rather than large scale complex facilities (see Supplementary
high degree of arbitrariness as there are no obvious land or                                Table 2). Indeed, DACCS technology allows smaller scale and
natural resource constraints, though unclear whether the very                               relatively finer granularity compared to BECCS plants. The recent
rapid scale-up indicated here is feasible in reality (this aspect will                      diffusion of solar PV at about 30%31 and forecasts for wind,
be investigated in more in detail in the next section). Changing                            expected to grow at 11% per year until 205032 are aligned with the
the annual growth rate limit to 15 and 30% results in ±450 GtCO2                            rapid scale-up of DACCS seen in our results.
cumulative capture across the century. The impact on net                                       Historical diffusion pathways have been modeled through
emissions is more marked when limiting DACCS capacity to 3                                  logistic curves33,34. These allow the analysis of the entire life-cycle
GtCO2/year. There is a strong reduction of residual emissions                               of technologies in terms of up-scaling, formative phase and
in the mid-term (Fig. 4b) and also repercussions on the                                     saturation, thereby not focusing only on a limited time span of
energy sector (Supplementary Fig. 4a). DACCS cumulative                                     rapid growth. We compare DACCS growth profiles from our
sequestration is reduced by between 550 and 770 GtCO2, while                                models with historical cases, including the logistic fit obtained by
BECCS captures ~20–50% more CO2 (Supplementary Fig. 4b).                                    Wilson33,34 for different energy technologies and the recent
   Regarding inter-generational preferences, a lower time dis-                              diffusion of solar PV and wind capacity35 (Fig. 5). Even if DACCS
count rate leads to earlier decarbonization in both models. This                            deployment may appear incredibly rapid, from 1 to 30 GtCO2/
limits the need for large-scale carbon dioxide removal in later                             year of removal in only 20 years, other technologies experienced
decades (Supplementary Fig. 5a). In TIAM-Grantham DACCS                                     similar patterns in the past.
deployment is deeply affected, with cumulative sequestration                                   This ambitious up-scaling pathway requires appropriate
decreasing by between 115 and 260 GtCO2, in the 1.5 and 2 °C                                regulatory interventions and public acceptance: in practice, these
targets respectively. However, in WITCH it remains almost                                   could prove complex and challenging, in light of the experience of
unchanged, while BECCS capacity is reduced (see Supplementary                               CCS has demonstrated limited societal support36. Currently,
Fig. 5b). In both models, the impact is less marked for a 1.5 °C                            literature studies on NETs have focused extensively on the supply
target. In this case, all the options to remove CO2 are deployed at                         side of technology development, not addressing other key issues
their maximum potential as there is less flexibility with regard to                          related to incentives for early deployment, niche markets and the
abatement timing.                                                                           regulatory framework15. Indeed, policy instruments and financial
   With reduced CO2 storage availability, priority is given to                              incentives supporting negative emission technologies are almost
DACCS with respect to other sequestration options, as its role                              absent at a global scale, though essential to make NET
cannot be substituted to tackle decentralized emissions. This                               deployment attractive, generating revenues linked to the carbon
results in less BECCS and CCS in both electricity and industrial                            dioxide captured by these plants for instance37.
sectors (Supplementary Fig. 6). As a consequence, electricity
production relies more on renewables, and the resulting carbon
                                                                                            Energy land water and material use. An other key parameter in
price is approximately doubled (Supplementary Fig. 7).
                                                                                            our models is the maximum DACCS capacity in terms of GtCO2
   Further information about sensitivity analysis can be found in
                                                                                            captured. This is directly related to the number of plants that can
Supplementary Note 6.
                                                                                            be built, the energy input to operate them and the environmental
                                                                                            impact in terms of land, water and material use. We investigate
Historical comparison for scale-up rates. Results discussed so far                          the implications of our scenarios on these aspects (results are
show that the main issue is not related to costs but to the rate at                         shown in Supplementary Table 3).
which DACCS can be ramped up. Indeed, model runs show                                          If large-scale plants are going to be built6 (i.e. DAC1
DACCS maximum scale-up rate being an average 1.5 GtCO2/year,                                technology), capturing 30 GtCO2/year means installing 30,000

6                   NATURE COMMUNICATIONS | (2019)10:3277 | https://doi.org/10.1038/s41467-019-10842-5 | www.nature.com/naturecommunications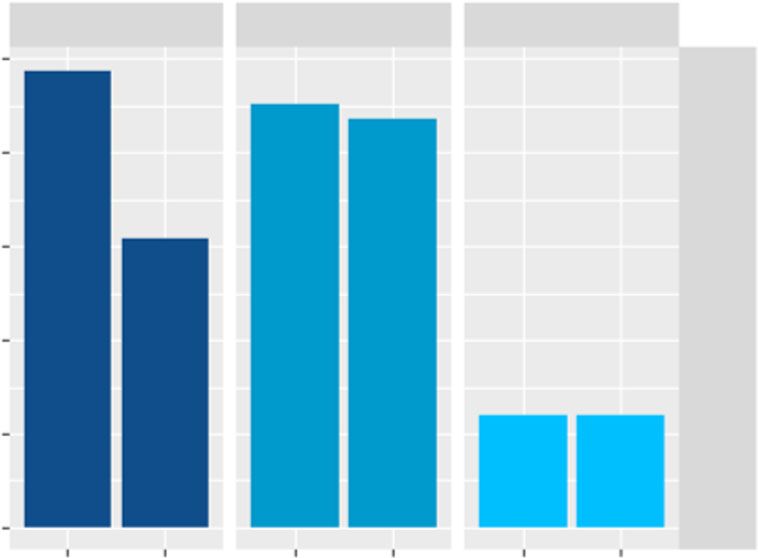
NATURE COMMUNICATIONS | https://doi.org/10.1038/s41467-019-10842-5 ARTICLE
a Heat input Electricity input
(DAC1) electricity
400
(DAC2) electricity
(DAC1) gas
75 Biomass
(DAC2) Wst heat
300 Coal
Bio
Gas
Coal
50
EJ/yr
EJ/yr
Hydro
200 Elec
Nuclear
Gas
Oil
Geot 25
100 Other RNW
Heat
Other sources
Oil
Solar
0 0
Wind
DAC input (TIAM) - 1.5 °C
DAC input (TIAM) - 2 °C
DAC input (WITCH)
Elc.prod in 2016
DAC input (TIAM) - 1.5 °C
DAC input (TIAM) - 2 °C
DAC input (WITCH)
TFC in 2016
b Land use Water use
Afforestation (2050) BECCS (2050) DACCS (30 Gt/yr) Afforestation (2050) BECCS (2050) DACCS (30 Gt/yr)
6000 2500
2000
4000
1500
Gt H2O
km2
2050 2050
1000
2000
500
0 0
TIAM
WITCH
TIAM
WITCH
TIAM
WITCH
TIAM
WITCH
TIAM
WITCH
TIAM
WITCH
Fig. 6 Impact of DACCS in terms of energy input, land and water use. a shows the energy input required to operate DACCS plants capturing about 30
GtCO2/year. Note that from TIAM-Grantham we have a differentiation among the two DACCS technologies, with different heat sources, while in WITCH
we only have gas-fired DAC1 plants. Heat and electricity inputs are compared with the 2016 Total Final Consumption and electricity production
respectively, as reported by the International Energy Agency43. b shows the amount of land and water used by DACCS plants to capture 30 GtCO2/year
compared to BECCS and afforestation5, when these are deployed at the levels foreseen by the models in 2050
facilities. This is comparable with the cumulatively produced partially limiting the decentralization advantage of this technol-
number of jet aircraft (21,000 in 1958–200733) or natural gas ogy. Nevertheless, this represents only one technological option to
plants (15,000 in 1903–200033) built in the past. By contrast, realize direct air capture: different sources of heat can be used
considering Climeworks’s design38 (i.e. DAC2), around 30 million according to site-specific availability, enabling a sufficient level of
units could be required in operational stock by the end of the flexibility.
century. This is aligned to the world annual market for cars and Moving to material use, we investigate the availability and the
commercial vehicles (73 million unit in 201739). production process of the proposed chemical sorbents at large
Past studies have investigated environmental implications of scale. Hydroxide solutions are currently obtained as a side-
different CDR options4,5,40–42. Conversely to BECCS, there are product of chlorine (Cl2) synthesis, which is the main market
fewer external constraints that may limit the deployment of product. High DACCS deployment would reverse these roles,
DACCS a priori, as land and water use is significantly reduced with sodium or potassium hydroxide becoming the most valuable
compared to biological NETs (see Fig. 6b). Nevertheless, DACCS output, thus disrupting the current market. Considering the
will have a significant impact on global energy provision.In 2100 sorbent replacement rate in DAC1 plants18, the current scale of
it could require around 50 EJ/year of electricity, that is more than the chlorine market of about 80 Mt/year44 will allow capture of
half of today’s total production43 (and about 10–15% of the global 300–500 MtCO2/year. Moreover, sodium hydroxide is produced
generation projected in 2100 by our models) and 250 EJ/year of through an energy intensive chloralkali process, so that an
heat, representing more than half of today’s final energy additional 2.2–3.8 GJ of electricity is required per ton of CO2
consumption globally43 (Fig. 6a). It should be noted that captured. This is more than twice the electricity required to
providing around 200 EJ/year of waste heat may have implica- operate DACCS plants. For amine adsorbents, it is more difficult
tions on the locations of DACCS plants: in order to avoid to investigate their impact as few technical details are available in
additional infrastructure and pipelines, these need to be co- the literature. As with amine sorbents employed for traditional
located close to industrial facilities where waste heat is recovered, CCS (MEA, monoethanolamine), synthesis is likely to start from
NATURE COMMUNICATIONS | (2019)10:3277 | https://doi.org/10.1038/s41467-019-10842-5 | www.nature.com/naturecommunications 7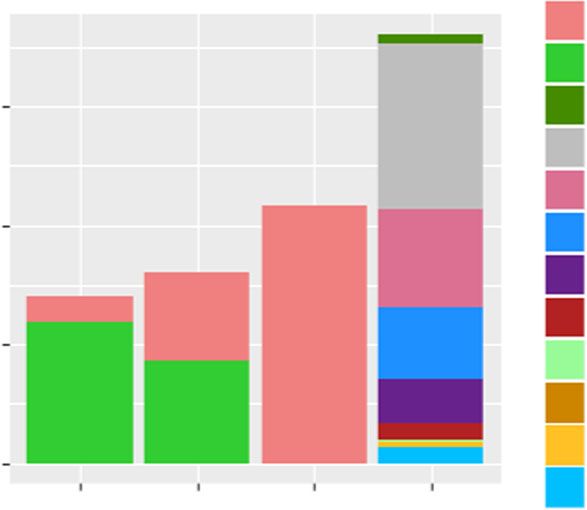
ARTICLE NATURE COMMUNICATIONS | https://doi.org/10.1038/s41467-019-10842-5
a Net emissions b Cumulative emissions 2016–2100
TIAM WITCH 1.5 °C 2 °C
40
1500
1000
TIAM
20
500
Gt/yr
Gt cum
0 0
1500
–20
1000
WITCH
500
2025 2050 2075 2100 2025 2050 2075 2100
0
Year
2% 5% DAC 2% 5% DAC
1.5 °C - 2% 1.5 °C - 3% 1.5 °C - 4% 1.5 °C - 5% 1.5 °C - DAC
Scenario Scenario
2 °C - 2% 2 °C - 3% 2 °C - 4% 2 °C - 5% 2 °C - DAC
Fig. 7 Emission pathway and cumulative emissions in DACCS failure scenarios. The left panels a shows the emission pathways of the original DACCS
scenarios and those with no DACCS and exogenous emission reductions between 2 and 5%. The right panels b show the 2016–2100 cumulative emissions
of CO2. In this case, carbon emissions for WITCH include both fossil burning, industry and land use
ammonia and ethylene oxide. Their markets are about 17745 and used purely as an illustrative range, subject to high uncertainty.
3546 Mt/year, respectively, and they both come from fossil fuel Not having NETs after mid century increases cumulative emis-
feedstock. Based on MEA production process47 with a similar sions between 600 and 1200 GtCO2. Considering a transient
replacement rate to DAC1 plants, 15–26 Gt/year of ammonia and climate response to cumulative emissions (TCRE) to be in the
3–5 Gt/year of ethylene oxide will be required. These are range of 0.8–2.4 °C/TtC54, not having DACCS leads to a tem-
approximate calculations, as the long-term sorbent stability is perature overshoot by the end of the century of 0.15–0.8 °C,
still unknown48, but they provide a starting point to understand according to the range of emission reduction rates investigated.
the challenges behind such a scale-up of DACCS. These That is, targeting 1.5 °C with DACCS and then not having it
comparisons highlight the requirement for more detailed would likely lead to a warming of 2 °C and more.
process-scale operational data and techno–economic assessments It should be noted that this temperature change estimate does
for policy makers to understand the full costs and potential not account for any additional reduction in mitigation effort that
of DACCS. the assumption of future emissions removals could have, based
on moral hazard considerations. These deterrence effects, that
result in NETs substituting for emission reductions rather than
Carbon cycle feedback. An important issue to be considered is
supplementing them, include also rebounds and side-effects (e.g.
the behaviour of natural carbon sinks to negative emissions, that
land-use change, use of captured CO2 in enhanced oil recovery)
may hinder the effectiveness of NETs49–52. Past studies using
and may result in a larger temperature increase by the end of the
Earth System Models51 estimate that removing 491 GtCO2
century55. It is therefore essential that policy makers make
from the atmosphere over a period of 30 years (16 GtCO2/year
informed decisions so as to undertake early mitigation with a full
GtCO2/year) or 10 years (49 GtCO2/year) would result in 51 or
consideration of these risks56, as well as an appropriate reflection
95 GtCO2 outgas emissions from the oceans respectively. From
of the economic costs, which future generations can
our scenarios, DACCS is foreseen to remove between 16 and
reasonably bear.
30 GtCO2/year over the period 2070–2100. This implies that a
significant fraction (from 10 to 19%) of the carbon removed
would be released back to the atmosphere from the oceans,
Discussion
requiring an additional removal of 1.7 to 9.5 GtCO2/year to meet
Our analysis shows that in theory DACCS can be an enabling
the same carbon budget. Indeed, accounting for carbon cycle
factor for the Paris Agreement objectives: it allows their
feedbacks within IAMs has been shown to decrease the attrac-
achievement at lower costs, by more-than-halving carbon prices
tiveness of CDR8.
in 2030. This follows from the reduction of near-term mitigation
in exchange for higher long-term atmospheric CO2 removal by
What if DACCS fails to deploy at scale?. Given the still- DACCS technologies, which includes a delayed phase out of fossil
significant uncertainties about NETs feasibility, we seek to fuels from the power sector until after 2050.
understand the impact of relying on NETs to reach mitigation The analysis also highlights the clear risks of planning a long-
targets, only to find out later that they do not perform as term mitigation strategy on the assumption that DACCS will be
anticipated. The emission pathways shown in Fig. 7a follow DAC available and can scale up at speed. First, we find that the speed of
scenarios up to 2050. After that date we assume that no DACCS DACCS scale-up is the greatest sensitivity in its ability to remove
(and no BECCS/afforestation) is going to be installed, and we CO2 and ease the mitigation burden on the energy system. A
simply apply a set of exogenous emission reduction rates varying failure to achieve this scale-up risks locking the energy system
between 2 and 5% per year. These are aligned with historic into fossil fuels and making the long-term temperature goal much
emission reduction rates achieved in some countries for con- more costly and less feasible. Second, whilst the analysis posits
secutive years53, and are meant to simulate the ambitious efforts that the indicated DACCS scale-up may not be unprecedented
in the absence of carbon removal strategies. Nevertheless, these when compared to some other technologies (notably jet aircraft),
decarbonization rates could conceivably be exceeded, so they are it highlights several potential barriers to deployment. These
8 NATURE COMMUNICATIONS | (2019)10:3277 | https://doi.org/10.1038/s41467-019-10842-5 | www.nature.com/naturecommunications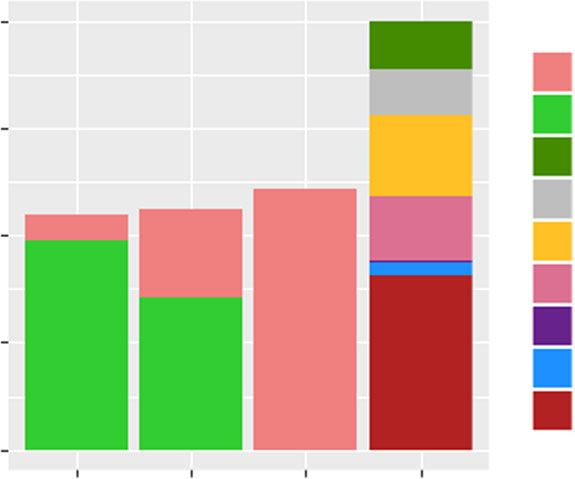
NATURE COMMUNICATIONS | https://doi.org/10.1038/s41467-019-10842-5                                                                                        ARTICLE

include the chemical pollutant implications of sorbent manu-                             these two processes in terms of cost and energy inputs: while in TIAM-Grantham
facture at vast scales, as well as a requirement to use around a                         we implement both DAC1 and DAC2, given the technological details allowed by
                                                                                         this model, in WITCH we only include the former.
quarter of global energy demand to provide power and heat for                                DAC1 technology refers to the first plant design proposed by the American
DACCS technologies by the end of the century. Therefore, it is                           Physical Society (APS) in 20116 and further developed through the work of Keith
important to include DACCS within a diversified mitigation                                and Holmes17,20, together with the company Climate Engineering. It is based on a
portfolio in low carbon scenarios, together with other CDR                               two-loop hydroxide-carbonate system (NaOH-CaOH or KOH-CaOH), with a
strategies, demand-side and lifestyle measures36,57. We recom-                           plant reference size of 1 Mt/year of captured CO2. This design involves large energy
                                                                                         needs, mainly high-temperature heat for sorbent regeneration that can be provided
mend that further analysis undertake a full life-cycle assessment                        by burning natural gas: electricity requirements range between 1.317 and 1.86 GJ/
of DACCS, in order to understand how its deployment drives                               tCO2, and heat input between 5.317 and 8.16 GJ/tCO2. An additional CCS unit is
energy demand for sorbent manufacture, as well as energy and                             needed to capture the CO2 emitted when burning natural gas, with a capture
material demand such as cement and steel for DACCS equip-                                efficiency equal to 95%, similar to natural gas combined cycle (NGCC) plants with
                                                                                         oxyfuel CCS already implemented in both models.
ment. Finally, the scale-up of DACCS indicated would only be                                 The second option, DAC2, is based on amine-functionalized adsorbents67,
possible with an appropriately comprehensive CO2 transport and                           currently under development by Climeworks in Switzerland and Global
sequestration infrastructure, as well as a strong regulatory and                         Thermostat in the US. Few technical details are available, due to commercial
planning framework and public acceptability. Given the challenge                         confidentiality. Solid sorbents have lower energy consumption, given the lower
                                                                                         regeneration temperature (electricity: 0.668–1.122 GJ/tCO2, heat: 4.468–7.222 GJ/
of addressing these barriers, it is instructive to highlight that                        tCO2). Significant cost reductions are expected in the future, both because of its
failure for DACCS to materialise, when previously planned for,                           modular design and the low level of technological maturity. As the low-
could lead to up to 0.8 °C of warming overshoot.                                         temperature heat may be provided through heat recovery, the energy input has
   Given the limits of IAMs in accounting for such risks, our                            been modeled as a waste heat stream coming from industrial processes and low-
                                                                                         carbon power plants. This allows a reduction of the overall cost of capture, as
preliminary considerations should be supplemented with further                           energy needs appear to be one of the main cost components for DACCS plants.
analysis and an appropriate theoretical framework58–60                                   The main drawbacks for DAC2 are degradation and stability issues related to the
accounting for interactions between technologies, society and                            amine materials, leading to higher operational expenditure due to sorbent
political power, so to highlight optimal mitigation strategies in                        replacement.
light of the uncertainty of future DACCS deployment and                                      We use scientific papers to determine the higher cost bounds, and estimates
                                                                                         from private companies running the first demonstration plants to define the low
governance.                                                                              cost scenario and the floor value, as summarised in Supplementary Table 4. The
   The potential economic benefit from DACCS, whilst con-                                 operating expenditure reported does not include energy costs, as these are
siderable, must be weighed up against a fuller analysis of its                           determined endogenously by the models.
technical viability and scale-up potential, in light of all of the                           For DAC1, Mazzotti’s optimization on the APS design19 provides the high cost
                                                                                         scenario, with an overall cost around 300 $/tCO2 (excluding energy), while the
challenges highlighted above. Given the urgency and importance                           latest paper by Keith and Holmes issued in June 201817 gives both the low cost
of achieving the Paris Agreement goals, we recommend to policy                           estimates (180 $/tCO2) and the target for future cost reduction, around 105 $/tCO2.
makers that they support an acceleration in development and                              Both these references provide a detailed cost breakdown, enabling specification of
deployment of DACCS, but without easing near-term mitigation                             CAPEX and OPEX, as well as individual cost components. Combined with low-
                                                                                         cost renewable energy, for example in North Africa, this cost can be even lower69.
efforts60, so as to manage the risk of DACCS underperformance                            The high floor cost reflects DAC1 limited potential for future cost reductions, as
or failure.                                                                              this technology is based on processes and equipment already well-known and
                                                                                         developed in other sectors.
                                                                                             Capture plants based on amine-modified adsorbents (DAC2) are characterized
Methods                                                                                  by higher operational costs due to frequent sorbent replacement because of
Study design. This study is based on modeling long-term mitigation scenarios             degradation. As no exhaustive cost assessments for this technology are publicly
using two IAMs: TIAM-Grantham61,62 and WITCH63,64. We model climate targets              available, we start from the APS6 estimate for the overall capture cost (350 $/tCO2
by imposing a carbon budget over the period 2016–2100 equal to 810 and 220               without energy), but switch the fraction allocated to OPEX and CAPEX (74 and
GtCO2, consistent with 2 °C and 1.5° warming respectively65,66. In addition to the       26%, respectively), to reflect the specifics of this technology option. We use the
sequestration options already implemented in the models (CCS in electricity and          same percentage allocation of overall costs between CAPEX and OPEX for the low
industrial sectors, afforestation and BECCS), we include also a technology to            and the floor cost estimates. The low cost scenario is defined according to
capture CO2 directly from the air and store it under the ground, namely DACCS.           Climeworks’ estimate38 (200 $/tCO2), while the floor cost of 50 $/tCO2 is that
We differentiate costs and energy inputs according to the literature, including cost     claimed by Global Thermostat70.
reduction over time due to technical learning, and we implement growth con-                  Floor cost identifies the long-term target that could be achieved in the future,
straints to model a feasible deployment rate within the models.                          and is used to set a lower bound for cost reduction. In both IAMs cost reduction is
    In addition, an expert elicitation was conducted to better understand the            implemented to model technical learning over time, with an exogenous rate in
potential of this new technology from the perspective of specialists currently           TIAM-Grantham (6% per year, aligned with historical cases in energy and
researching in this field, given the fragmentary and limited literature available on      chemical sectors71) and an endogenous learning curve in WITCH (learning rate
this topic.                                                                              equal to 0.06, the same used for natural gas plants with CCS).
    The inter-model study design ensures that our results are robust across model            Information on techno–economic parameters are summarized in
uncertainties, as the IAMs adopted have complementary characteristics, combining         Supplementary Table 4 and Supplementary Fig. 8.
a detailed bottom-up energy system model (TIAM-Grantham) and a hybrid model
(WITCH) with a top-down representation of macro-economic variables. To test
robustness against parametric uncertainty, we perform a sensitivity analysis on cost
and energy parameters, annual growth rates and maximum capacity levels, as well          Waste heat recovery in TIAM-Grantham. As explained earlier, waste heat can be
as investigating the impacts of limited CO2 storage capacity and a lower time            employed to operate amine-based plants and it is already implemented in Cli-
discount rate. A detailed description of the IAMs adopted can be found in                meworks’ and Global Thermostat’s pilots. We include this aspect in TIAM-
Supplementary Note 1, together with further information about time discount rates        Grantham, given its detailed technological representation of the energy system. We
(Supplementary Note 2), storage availability (Supplementary Note 3) and CCS/             define a new commodity to model the waste heat recovered both from energy-
BECCS cost assumptions (Supplementary Note 4).                                           intensive industrial processes (e.g. pulp and paper, iron and steel production) and
    In addition, it should be noted that WITCH includes carbon emissions from            from the power sector. As the waste heat potential will be limited, two distinct
fossil fuel and industry (FFI) and from the land use sector, while TIAM-Grantham         processes to represent amine-based DACCS have been defined, namely DAC2 and
only considers FFI emissions. In both 1.5 and 2 °C scenarios, net cumulative land-       DAC21 (see Supplementary Fig. 8): heat is supplied through waste heat to the
use emissions over the century in WITCH are close to zero.                               former, and through heat made on purpose to the latter. They are characterized by
                                                                                         same economic and technical parameters, so that the model is free to install as
                                                                                         much capacity of amine-based plants deploying DAC21, with no constraints
Modeling DACCS technologies. Looking at the state of the art for capturing CO2           deriving from the availability of the waste heat commodity. From our results
directly from the air, research has focused on the application of aqueous hydroxide      DAC21 is almost never installed, as it is not economic to produce heat solely to fuel
solutions (DAC1) and amine-modified solid sorbents (DAC2). These two tech-                DACCS plants
nologies are employed in the first DACCS plants built around the world, and                   To determine the recovery potential of industrial waste heat, we use analysis by
therefore closer to being commercially available; other innovative solid sorbents        Ecofys72, which examines a number of heat-intensive industrial sectors, such as
have not been included as they are still at an earlier research stage. We characterize   refineries, iron and steel, ceramics, glass, chemicals, food, drink and pulp and paper

NATURE COMMUNICATIONS | (2019)10:3277 | https://doi.org/10.1038/s41467-019-10842-5 | www.nature.com/naturecommunications                                                    9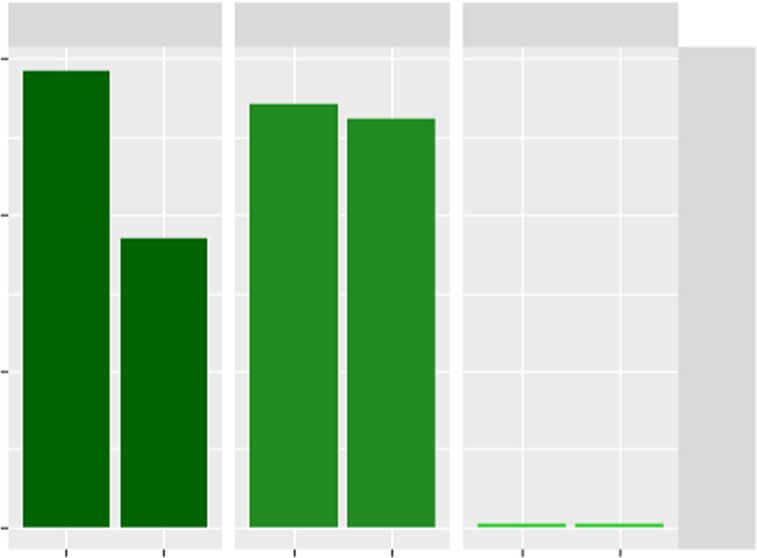
ARTICLE                                                                             NATURE COMMUNICATIONS | https://doi.org/10.1038/s41467-019-10842-5

industry. Referring to this data, we identify the sectors where the new commodity        type of feedstock used as input fuel: the lower end corresponds to purpose-grown
may be applicable and we define the production of waste heat as a fraction of the         crops, while more land is required for agricultural residues due to their lower
energy input, with this recovery factor RF changing according to the industry, as        energy yield. Similar values can be applied also to afforestation, as they are both
shown in Supplementary Table 5. As in our recovery process the sink is represented       biological sequestration strategies. For DACCS, it is difficult to quantify the
by the amine regeneration step, taking place at temperatures below 120 °C. Only          amount of land needed, given that there are currently so few pilot plants and each
industrial heat flows with temperature equal to or higher than 140 °C examined in         of the proposed designs require different plant components. Generally, the amount
the report have been taken into account. We put a cap on the capacity of industrial      of land needed is limited to the one for building plant facilities, due to the low risk
processes connected with waste heat, to avoid the model over-installing them only        of build-up of CO2 deficient air around the capture plant21. Amine-based plants
to provide the heat needed by DACCS plants. The constraint is based on the               would require around 0.05–0.1 m2/tCO2/year12,13, while those using hydroxide
capacity installed in a baseline scenario without DACCS, with a 2 °C mitigation          solutions around 1.5 m2/tCO2/year6. The land footprint could increase
target.                                                                                  considerably if solar PV panels or wind turbines were used to provide energy
    Waste heat was also allowed to be sourced from some low-carbon power plants,         required, though unproductive land supplying minimal ecosystem services could in
namely nuclear and concentrated solar power. In the first case, waste heat can be         principle be allocated as sites.
recovered from the steam cycle in addition to the primary electricity output, while          Estimates for water requirements to remove one tonne of carbon by DACCS are
in the latter case, heat is produced as in Combined Heat and Power (CHP) units,          about one order of magnitude or more lower than for BECCS plants, as BECCS
slightly reducing the primary electricity outflow.                                        demands water both for growing crops and feedstock and for operating the CCS
    For nuclear plants, electricity generation efficiency is about 33%, meaning that      module. Again, similar values can be applied to afforestation5. Water loss may
about two-thirds of the energy in the fuel is lost and dissipated to the environment     represent a concern for some DACCS systems: aqueous systems are prone to
as heat. The temperature of the dissipated heat is sufficiently high to be supplied to    evaporation, leading to a consumption of about 5 to 13 tonne of water per each
amine-based DACCS plants, therefore in TIAM-Grantham all existing nuclear                tonne of carbon dioxide captured during normal operation, depending on
processes have been specified to include waste heat as an auxiliary output                humidity and air temperature14,76. Developers of amine-based plants do not
commodity (in addition to electricity). The overall efficiency of cogenerative plants     mention water use as a source of concern, but other solid sorbents tested for
is usually about 80%, including an electrical efficiency ηel = 35% and a thermal          DACCS application24 may require up to 20 tonnes of H2O, so that this has been
efficiency around 45%73. Therefore, for each PJ unit of electricity in output, 1.3 PJ     taken as the high end for our assessment.
of waste heat may be obtained (RFnucl).                                                      Considering the material use, the production of hydroxide sorbents is not
                                                                                         straightforward, as a large amount of energy is required to synthesize sodium
                                    Qwst ηth 0:45
                         RFnucl ¼       ¼    ¼     ¼ 1:3                          ð1Þ    hydroxide (NaOH) and potassium hydroxide (KOH) (13.3 GJ/tNaOH and 7 GJ/
                                    Wel   ηel 0:35                                       tKOH77 respectively). Moreover, currently these chemicals are obtained as a side
    Conversely, a new process has been defined to differentiate Concentrated Solar        product from chlorine (Cl2) production process, through electrolysis of sodium
Power (CSP) plants where heat can be recovered (CHP mode) from those only                chloride and potassium chloride solutions respectively. In the future their
producing electricity. This technology will use a steam power plant with back-           respective roles may be reversed, with hydroxides being the most valuable outputs
pressure configuration, that means the electricity output is reduced, increasing the      should DACCS reach such significant deployment.
temperature at the steam turbine outlet to be sufficiently high to allow heat                 According to the APS report6, there is a loss of NaOH solution during each
recovery at the condenser. Therefore, CHP solar plants (CSP–CHP) will have lower         capture cycle, as it remains partly entrained in the CO2-depleted air leaving the
electrical efficiencies, going from ηel,CSP = 20% to ηel,CSP–CHP = 15%74. As costs are    absorber. Considering the detailed mass balance provided by Baciocchi18, the
allocated to a reduced electricity output, this technology will be treated as more       make-up rate of sorbents is between 0.17 and 0.29 tonne per each tonne of CO2
costly in the model with respect to traditional CSP plants. The recovery factor          captured, according to the different plant designs proposed. Note that this
RFCSP is computed considering a recovery efficiency for the heat output at the            reference has been taken as a worst-case scenario for such technology. Currently
condenser ηt equal to 80%74.                                                             the market for Cl2 is about 76.8 Mt/year44, which would allow about 300–500
                                                                                         MtCO2 being captured using DAC1 plants. Therefore, the decision to limit DACCS
                             Qwst          1                                             maximum capacity to 3 and 30 GtCO2/year means scaling the current hydroxide
                   RFCSP ¼        ¼ð              1Þ  ηt ¼ 4:53                 ð2Þ
                             Wel     ηel;CSPCHP                                         market by a factor of 10 and 100 respectively. As a comparison, the current market
                                                                                         for KOH and NaOH are about 0.8 and 80 Mt/year, respectively. Finally, it must be
                                                                                         noted that chlorine gas would be the main byproduct of hydroxide production
Comparison with historical technology diffusion. We compare DACCS                        raising concerns about its handling, since it is a highly poisonous gas and a
deployment pathways from our results with other historical technology diffusion in       potential ingredient in chemical warfare.
order to understand its feasibility. We start from the work done by Wilson33,34 to           When moving to amine-based adsorbents, it becomes much more difficult to
model scaling dynamics across a range of technologies. This describes the common         investigate their production and the need for sorbent replacement during the
s-shaped growth profile with logistic function parameters, starting from historical       capture process as very few technical details are available in the literature.
time series data on refineries, power plants (nuclear, coal, gas, wind), jet aircraft,    Therefore, we analyze the production process of polyethanolamines (mainly
cars and lightbulbs. As these studies demonstrate a consistent relationship between      MEA, monoethanolamine) which are generally employed to capture CO2 from
the extent and the rate of scaling, measured in terms of cumulative total capacity,      power plants, through post-combustion CCS processes. In this case, the
we use the same dataset as a benchmark to validate our projections for DACCS             synthesis starts from ammonia and ethylene oxide, requiring about 3.2 and 0.64
uptake up to 2100. Given that each technology is characterized by a different extent     tonnes respectively per each tonne of MEA produced47. Both of them come from
(i.e. maximum level of capacity reached during saturation phase) and their up-           fossil fuel precursors, mainly oil and natural gas, although ethylene can also be
scaling takes place during different time periods, we normalize the data, indexing       made from biomass. It is an endothermic process, so no heat input is required to
the capacity extent K to a value of 1, and consider a general timescale, with t = 0      sustain the reaction, beside the energy costs for running the production plant
representing the starting year of diffusion (first unit installed), and each unit of      itself, which can be neglected. There is no robust information about the
time corresponding to one decade (t = 1 coincides with 10 years later than the           replacement rate for amine-based adsorbents in DAC2 plants, but it is likely to
starting one).                                                                           be considerable given the degradation of amine materials due to oxidation and
    In addition to this historical data, mainly referring to the 20th century, we have   steam exposure48. As a conservative approach, we consider a similar make-up
included also time series data about the recent rapid growth of low-carbon               rate to hydroxide solutions, resulting in 15 to 26 Gt/year of ammonia (current
technologies, such as solar PV and wind, using British Petroleum statistics up to        market: 177 Mt/year45) and 3 to 5 Gt/year of ethylene oxide (current market: 35
201835.                                                                                  Mt/year46).
                                                                                             All these values are summarized in Supplementary Table 3.
Impact assessment for DACCS technologies. According to the assessment made
by Smith5 on physical and economic impacts of large scale NETs deployment, one           Data availability
of the advantages of DACCS is the reduced footprint with respect to BECCS or             The data that support the findings of this study are available from the authors on request.
afforestation, in terms of water and land use and sustainability implications (values
adopted are summarized in Supplementary Table 6). Considering a sustainable
bioenergy supply for BECCS plants, we have explicitly imposed a limit of 200 EJ/         Received: 4 March 2019 Accepted: 4 June 2019
year in TIAM-Grantham, according to a past assessment75, that results within the
range of models used in RF1.9 scenarios66. In WITCH this limit is not explicit, but
it is never hit. Differently, there are no external constraints that may limit the
deployment of DACCS a priori, such as material scarcity or environmental foot-
print, while a major issue is likely to come from the provision of chemical sorbents.
Moreover, DACCS offers an additional location flexibility so that the capture
facility can be placed closer to geological sequestration sites, avoiding long
                                                                                         References
pipelines.                                                                               1.   Intergovernmental Panel on Climate Change (IPCC). Global warming of 1.5 °
    According to Smith et al.5, the land footprint related to BECCS power plants is           C. An IPCC Special Report on the impacts of global warming of 1.5 °C above
between 270 and 1636 m2 to capture 1 tonne of CO2 per year, depending on the                  pre-industrial levels and related global greenhouse gas emission pathways, in the

10                    NATURE COMMUNICATIONS | (2019)10:3277 | https://doi.org/10.1038/s41467-019-10842-5 | www.nature.com/naturecommunications
You can also read