Carbon Descent Plan - Tunbridge Wells Borough Council
←
→
Page content transcription
If your browser does not render page correctly, please read the page content below
Carbon Descent Plan
- Tunbridge Wells
  Borough Council

Prepared by :         Steven Marks – Carbon Strategy Lead
Reviewed by :   Andy Morgan – Head of Energy Management

21 January 21
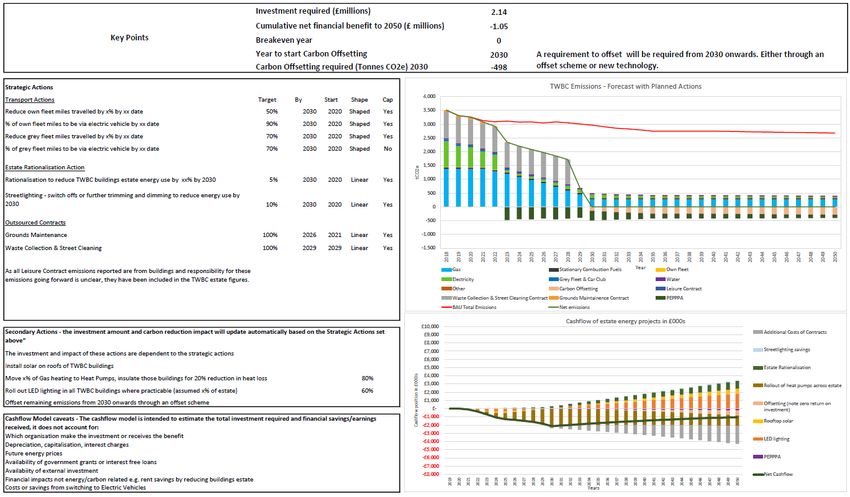
Table of Contents
Background                                                4
Executive Summary                                         5
    Key findings                                           6
Scoping                                                   8
Data Collection and Footprint                             9
    Data Collection                                        9
    Emissions Factors                                      9
    Carbon Footprint                                       9
    Key findings:                                         11
Forecast                                                  13
Carbon Budget and Pathway                                 14
    Carbon Budgets                                        14
    Evaluating TWBC’s Carbon Budget                       14
    Leading The Way                                       16
    Business As Usual Scenario                            18
    Conclusion                                            19
Options Appraisal                                         19
    Success Factors and Carbon Reduction Options (CROs)   21
    Key points                                            22
    Other Initiatives Proposed by Councillors             22
Zero Carbon Electricity Supply Options                    24
    REGOs (Renewable Electricity Guarantee of Origin)     24
    Traceability                                          24
    Additionality                                         24
    PPAs                                                  25
    Products Available                                    25
Zero Carbon Modelling, Outputs & Strategy                         27
    Scenario Analysis                                             28
    Scenario Cashflow                                             30
    Carbon Offsetting                                             31
    Agreed Actions and Assumptions                                33
    Treatment of Outsourced Services                              33
Conclusion                                                        35
    Evolution of Strategy and Model                               35
    Key points                                                    36
Next Steps                                                        36
LASER Background                                                  38
Key People                                                        39
Legal Information                                                 40
Appendix 1 – Organisational Scoping Chart                         41
Appendix 2 – Operational Scoping Table                            42
Appendix 3 – Carbon Footprint Data                                44
Appendix 4 - Emissions from TWBC Buildings                        46
Appendix 5 – Forecast of Emissions to 2050 under a BAU Scenario   48
Appendix 6 – Year on year carbon budgets for TWBC to 2050         49
Appendix 7 – Zero Carbon Electricity Supply Options               50
    Option 1 – Green Tariff                                       50
    Option 2 – Green Basket                                       51
    Option 3 – PPA or PEPPPA                                      52
Appendix 8 – Model Outputs from Scenarios                         53
    Central Scenario                                              53
    Central Scenario - 0% Estate Rationalisation                  54
    Increased LED & ASHPs                                         55
    Increased LED, ASHPs & PEPPPA                                 56
    Central Scenario - 40% Estate Rationalisation                 57
    With Solar Park (owned or 3rd party)                          58
Background

As of October 2020, around 75% of councils across the UK had declared a climate
emergency*, with the majority of these setting target dates to be carbon neutral either
for their own operations or across their area as a whole. Numerous other public bodies
have also made declarations or are putting plans in place to begin this transition. The
ambition of declarations vary significantly and will also vary in scope as public bodies
begin to define exactly what they are committing to include in terms of operations and
emissions sources. Of those councils who have declared a climate emergency,
approximately three quarters have stated a target, with dates ranging between 2025
and 2050, but the majority being 2030 in line with Tunbridge Wells Borough Council.

The progress with planning and implementation is mixed. Some organisations are
clearly taking large scale action towards developing new renewables, others have
committed significant resource to planning yet many others have a clear target but
little detail at this stage on how it will be achieved.

Regardless of current progress, these bodies have a mandate to take positive action
to address the issue of climate change and will need to formulate detailed plans and
take steps towards meeting these targets imminently. If action isn’t taken now, the
bodies could face substantial political pressure in the short term and face not meeting
their self-imposed targets in the longer term. Not only that, but according to Energy
Live News, Environmental law firm ClientEarth has threatened 100 councils with legal
action if they do not provide adequate evidence of planning to meet for their carbon
reduction targets.†

In 2015, the EU and 196 nations signed on to the first truly global commitment to
aggress climate change, namely the Paris Agreement. The aim of this was to limit
global warming well below 2°C and in pursuit of 1.5°C. On the 3rd December 2020m
the UK government unveiled its target to reduce emissions by 68% by 2030, compared
to 1990 levels and net zero by 2050. This will be termed the UK’s NDC (National
Determined Contribution) to the Paris Agreement and meets the recommendation
made by the CCC (Climate Change Committee).

*Declare a Climate Emergency | Go Zero Carbon by 2030
†https://www.energylivenews.com/2019/09/03/environmental-lawyers-threaten-councils-with-legal-
action-over-climate-inaction/
TWBC’s climate emergency declaration made on 17th July 2019 sets out a
commitment for the council’s operations and services to be carbon neutral by 2030.
LASER’s expertise in conjunction with OJEU compliant frameworks means that we
are well equipped to assist TWBC on their journey to net zero. LASER can not only
assist in the carbon footprint and planning stages but are also able to offer compliant
procurement routes to support TWBC through the implementation of emissions
reduction projects and initiatives.

Executive Summary

This document collates the activity and findings of the Carbon Footprint Audit and
Action Plan exercise LASER have carried out for TWBC. The key elements, findings
and conclusions are summarised below:

 -   A scope was defined in order to frame the target, this was based on operational
     control principles from the GHG Protocol.

 -   Carbon footprint was calculated, based on 2018/19 data, and shown to be
     dominated by outsourced services such as waste and leisure.

 -   Business As Usual forecast shows that emissions will continue to drop without
     further activity by TWBC because of reducing electricity grid emissions, however
     this will plateau at around 78% of current emissions.

 -   In order to align with science based targets and contributing their fair share of
     Paris Agreement reductions requires TWBC to cut emissions rapidly, by 49% by
     2025. At current emission levels, TWBC would use their entire carbon budget to
     2100 by 2027.

 -   Exercises and modelling were carried out to assess 6 separate scenarios,
     assessing carbon and high level financial implications. TWBC will need to
     consider their options and select their chosen strategy. Options with biggest
     impact include reducing the property portfolio, requiring waste and leisure
     providers to operate at zero carbon and committing to enhanced levels of energy
     savings in buildings combined with investment in large scale renewables or green
     electricity procurement.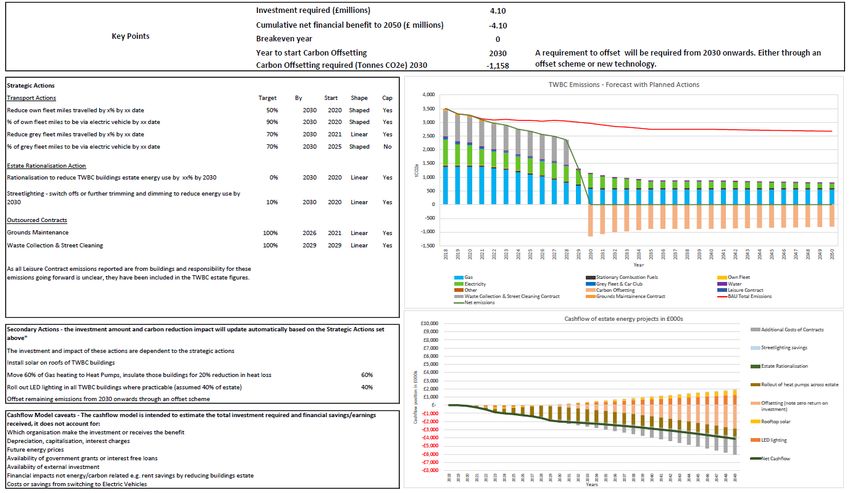
Key findings
   •    Substantial early action is needed to align with Paris Agreement pathway and
        an effective, well thought out procurement strategy would contribute to this.

   •    Direction on the TWBC estate and leisure buildings is extremely important.
        Without this officers are unable to plan projects as they are uncertain which
        buildings will be retained and unable to plan a renewable energy purchasing
        strategy as future energy volumes could potentially fluctuate significantly.

   •    The majority of the possible scenarios outlined in the modelling rely on some
        carbon offsetting to achieve net zero by 2030. There are risks inherent in this
        and it is important to highlight that there would be no financial return or saving
        from offsetting.

   •    Investment in large scale renewables is possible in some format as there are a
        variety of ways in which to structure arrangements.

Next steps are as follows:
   1.   Determine Estate Future
   2.   Develop detailed action plans
   3.   Immediate action in retained buildings
   4.   Procure green energy for estate
   5.   Address less significant emissions sources
   6.   Update carbon footprint to latest year

LASER would be happy to assist in either more detailed action planning or modelling
of particular options and helping deliver activities via our public sector frameworks.

Important points to note on interpreting this document
   •    Analysis of financial impacts is based on energy costs only, for example the
        savings from reducing the size of the estate only accounts for reductions in
        energy consumption and costs and do not take into account revenue from
        selling or leasing properties.

   •    Financing options are available, for example finance in renewable assets could
        be structured in a number of different ways such as loans or PPAs where rates
are paid back through consumption. They can also be structured differently
    internally as well to facilitate budgeting.

•   This is an evolving strategy that will be refined but allows TWBC to understand
    their current positions, the challenge and options to meet the challenge.

•   There are not defined regulations or conventions at this time around reporting
    emissions from green energy, so decisions will need to be made based on the
    council’s preference or interpretation of what it is felt the public would favour.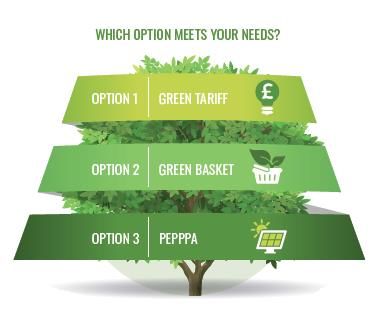
Scoping

LASER conducted an initial kick off meeting with the relevant representatives from
TWBC in February last year. This was a productive meeting with good input and
collaboration from all parties. At this meeting it was decided that the council would
adopt an operational approach when conducting the organisational and operational
scoping exercise, as laid out in the GHG Protocol. This consolidation approach was
selected as it was felt to best tie in with the council’s setup, operation and objectives.

The organisational scoping exercise is conducted prior to the operational scoping and
looks at the organisational structure to determine which entities fall within the scope.
Tunbridge Wells Property Holding Company and interest in the Mid Kent Authority
were identified as areas to be assessed. It was determined that the property holding
company and the areas of the Mid Kent Authority that the council control would be
included as depicted in the chart in Appendix 1.

However, at the operational scoping stage it was determined that TWBC controlled
very little of the energy use from the property holdings company and the energy use
associated with the contribution to the Mid Kent Authority could be gathered within the
council’s main energy data. As part of the operational scoping, a number of areas were
discussed and decisions made as outlined in the table in Appendix 2. The most notable
of these were the decisions to include the leisure operations, grounds maintenance
contract and waste collection and street cleaning services within the scope. Although
these are not operated by the council directly it was felt that they were important due
to their significance and the influence that the council exercises over these operations.

It was decided to use FY 18/19 as the base year as data would be available
immediately, although it was noted that the baseline is not as vital when looking to
achieve net zero due to the emphasis being on the absolute target. The work detailed
throughout this report will give TWBC context for the challenge facing them and allow
visibility of the significance of the contribution of each emissions source over time. The
footprint calculation differs very slightly throughout this report depending on the stage
at which the calculation was undertaken, with data for very minor emissions sources
added after the initial footprint calculation. The total baseline emissions for TWBC
however remain at around 3,500 tCO₂e.

Data Collection and Footprint

Data Collection
LASER worked with TWBC to collate energy, fuel, water, waste and waste data as
well as data regarding other emissions sources. LASER would like to take this
opportunity to thank TWBC personnel for their assistance and cooperation in this
exercise which certainly facilitated the process significantly. However, this remained a
lengthy procedure as substantial quantities of data were gathered from numerous
different sources in many different formats and the interruptions caused by the
pandemic hindered these efforts as well.

Emissions Factors
Once the data gathering had been completed, LASER utilised emissions factors
gathered from various government sources and calculated factors where specific
government factors were not available. LASER have put significant time and resource
into the compilation and generation of these figures, for both the footprint and the
forecast, to ensure that as accurate a calculation of emissions as possible has been
made for TWBC.

Carbon Footprint
The council’s carbon footprint was calculated and broken down in a variety of ways
which allows for insight into the emissions the significance of the different emissions
sources. In essence a carbon footprint is divided into three different categories of
emissions:
   -   Scope 1 – Direct GHG (Greenhouse Gas) Emissions, where the emission
       occurs directly from sources controlled or operated by the council, for example
       the gases emitted from a boiler flue as a result of burning natural gas for heating.
   -   Scope 2 – Electricity indirect GHG Emissions, where the consumption of a utility
       on site has a direct bearing on the emissions offsite. This predominantly relates
       to electrical consumption but can also include district heating and cooling.
   -   Scope 3 – Other indirect GHG Emissions, where emissions are a consequence
       of the activities of the council, but occur from sources not owned or controlled
       by them.
Scope 3 is a very wide category and includes all emissions sources not included in
the other two scopes. As part of the scoping exercise a decision has to be made as to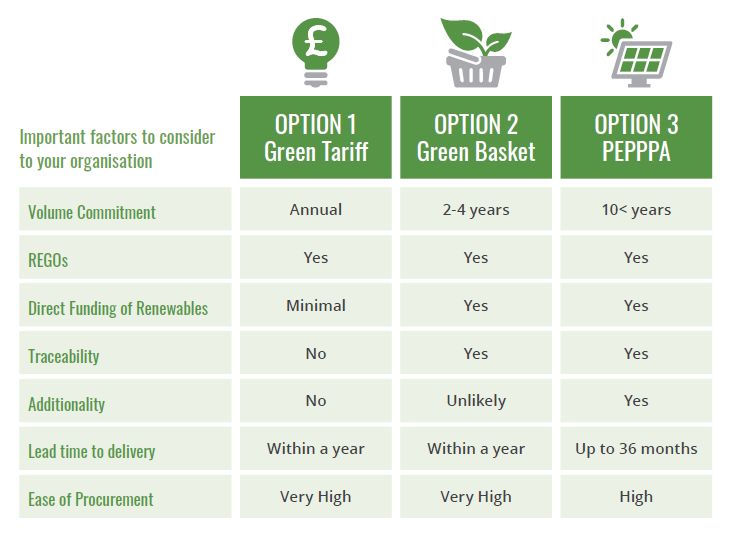
which Scope 3 emissions sources to include within scope, if any. TWBC decided to
include emissions associated with disposal of waste generated by their own estate,
water consumption, grey fleet (employees using their own vehicles on council
business) and the three outsourced contracts mentioned above (waste collection and
street cleaning, grounds maintenance and leisure).
Chart 4.1 below shows that Scope 3 emissions dominate the carbon footprint,
comprising 60% of total emissions.

                           Chart 4.1 – TWBC emissions by scope

                        Charts 4.2 & 4.3 – TWBC emissions by sector
In addition to the high level representations above, the footprint was also broken down
at more granular level to allow for greater insight.
Chart 4.4 – TWBC emissions by emissions source
Key findings:
• The majority of emissions are Scope 3, making up 60% of the total with the
other scopes comprising approximately 20% each, the lion's share being
natural gas (Scope 1) and electricity (Scope 2).
• Of these Scope 3 emissions, the chief contributor is the outsourced services,
accounting for 57% of the 60% total.
• The vast majority of transport emissions shown in Chart 4.3 are associated with
the collection of waste by Urbaser.
• The waste collection and leisure contract make up over half of total emissions,
each accounting for just over a quarter.
• Other emissions, as shown in Chart 4.4 above, contribute only 7% to the total
footprint. This is made up mainly of the grounds maintenance contract, grey
fleet, oil use and, to a lesser extent, owned vehicles.• The top 10 buildings account for over 60% of total emissions (this includes
sports centres which are included under the leisure contract). A breakdown of
these buildings is shown in Chart 4.5 below.
• The top 2 sites (TWSC and Town Hall) account for approximately 50% of total
building emissions.
• The top 5 buildings (TWSC, Town Hall, Weald LC, Crematorium and Assembly
Hall) account for over 75% of total building emissions.
Chart 4.5 – TWBC emissions by emissions source
N.B. The percentages in this chart relate to % of the total emissions of the Top 10 buildings.
Further breakdown of emissions associated with all buildings is detailed in Appendix
4 of this report.Forecast
LASER used the carbon footprint data and the emissions factors touched on above to
generate a forecast of TWBCs emissions to 2050. This is designed to act as a
representation of emissions levels if TWBC took no action to reduce them.
The chart below shows that total emissions at the baseline equate to 3,500 tCO₂e.
The foremost categories below are TWBC gas (blue), TWBC electricity (dark grey),
waste collection diesel (orange), leisure gas (peach) and leisure electricity (light grey).
Further detail and breakdown of the forecast data can be seen in Appendix 5.
Chart 5.1 – TWBC emissions to 2050 under a “BAU” Scenario
It can be seen that emissions reduce reasonably rapidly over the initial few years,
primarily due to reduced emissions associated with electricity consumption as
renewable generation is forecast to make up a larger proportion of the total. This is
also influenced by a slight reduction in emissions associated with fuel consumption as
biofuel content continues to increase in the short term.
In the medium and longer term emissions associated with this level of use would
reduce to just under 3,000 tCO₂e in 2030 and 2,675 tCO₂e in 2050.
Reductions are largely due to forecasts around electricity generation becoming
cleaner and it can be seen that emissions associated with gas remain largely static
throughout and make up an increasing proportion of the total. These figures are based
on government forecasts so, while they are long term forecasts and liable to change,
they are as realistic estimates as possible at this point in time.Carbon Budget and Pathway As part of an ongoing project for TWBC, LASER were commissioned to provide a science based carbon budget in line with the Paris Agreement. Aligning efforts with international agreements and recognised scientific research will give TWBC’s planning and actions more credibility both socially and politically. Carbon Budgets A carbon budget is a total amount of CO₂ that can be emitted by a party in a particular timeframe. In the United Nations Paris Agreement, nations signed up to science based targets with the aim of limiting global temperature rises to “well below 2°C and pursuing 1.5°C”. The total global carbon budget has been distributed ‘fairly’ between nations dependent on their stage of economic development and the national budget has then been further divided to give sub-national budgets per region. There are a number of advantages to generating a carbon budget using the science based approach. Carbon budgets are extremely valuable as the critical factor in whether we are predicted to restrict rising global temperatures is the total volume of emissions. The science based budgets require a rapid reduction in emissions in the short term and allow a more moderate rate of reduction in the medium term. This encourages early action by organisations to avoid falling behind targets. Therefore, meeting these budgets will result in an earlier reduction in emissions and generate a greater total reduction than a linear approach. There will then be benefits associated with this, for residents in terms of air quality and other local environmental issues, but also on a wider scale as well. It should be noted that this budget does not account for LULUCF (Land Use, Land Use Change and Forestry) or for aviation and shipping. Evaluating TWBC’s Carbon Budget The Tyndall Centre, an academic partnership aimed at bringing together climate change experts across a range of disciplines and informing policy makers, have determined sub-national carbon budgets through detailed research and analysis. As outlined above, The Tyndall Centre’s budgets are based on the principles of a global temperature target “well below 2°C and pursuing 1.5°C” and equity principles in the United Nations Paris Agreement. LASER have determined an apportionment of the carbon budget for the Tunbridge Wells region to TWBC in line with the established
methodology. The apportionment of both the region’s share as part of the national
budget and the council’s share as part of the region, have been determined using a
grandfathering approach. This is based upon the average proportion of emissions from
each party in recent years.
The Tyndall Centre data and budgets are designed around CO₂ only energy use data
and are not aimed at non-CO₂ emissions (such as methane and nitrous oxide) due to
the differing atmospheric lifetimes and warming effects of the different gases, meaning
that a single budget is not appropriate. However, they assume that significant action
is taken to abate non-CO₂ emissions as well and consequently LASER have applied
the same ambitious pathway and budget for these on a CO₂ equivalent basis.
LASER’s analysis on behalf on TWBC has determined the following:
    •       To be in line with the Paris Agreement, TWBC have a total carbon budget of
            23,561 tCO₂e from 2020 to 2100 or 30,315 tCO₂e from 2018 to 2100.

    •       The budget for the 5 years from 2018 to 2022 (inclusive) is 14,564 tCO₂e.
    •       At current emission levels, Tunbridge Wells BC would use the entire budget to
            2100 within 7 years from 2020.

In order to stay within the calculated carbon budget TWBC will need to deliver a rapid
and very significant drop in emissions. A recommended carbon budget pathway is
shown below with 5-year carbon budgets from 2018 to 2048. A full breakdown of year-
on-year carbon budgets is contained in Appendix 6 of this report.

                               TWBC Recommended Carbon Budget
           16
                  14.6
           14

           12

           10
  ktCO₂e

                                7.9
           8

           6
                                              4.0
           4
                                                            1.8
           2                                                              0.8                       0.8
                                                                                           0.4
           0
                2018-2022    2023-2027     2028-2032    2033-2037     2038-2042     2043-2047    2048-2100

                            Chart 6.1 – TWBC Recommended Carbon Budgets from 2018 - 2100
Carbon Budget Recommended
Period Carbon Budget
(ktCO₂e)
2018-2022 14.6
2023-2027 7.9
2028-2032 4.0
2033-2037 1.8
2038-2042 0.8
2043-2047 0.4
2048-2100 0.8
Total Budget 30.315
Table 6.1 – TWBC Recommended Carbon Budgets from 2018 - 2100
Leading The Way
LASER’s methodology means that TWBC will be leading the way by targeting a “fair”
contribution to the region and the UK’s carbon budgets in line with the Paris
Agreement. If all parties within the district follow the council’s lead, then the Tunbridge
Wells district will be in line with the science based targets set out in the Paris
Agreement.
The pathway set out below effectively provides a year by year carbon budget that, if
met, will ensure TWBC adhere to the 5-year budgets set out above and make their
contribution to the UK’s efforts to limit damaging climate change. LASER’s figures
predict the Tyndall Centre data with an accuracy of approximately 99.7% with any
error due to the degree of accuracy of figures publicly available.
The charts below illustrate the pathway over different time periods:
TWBC Recommended Pathway (2018 - 2100)
4,000
3,500
3,000
2,500
tCO₂e
2,000
1,500
1,000
500
0
2022
2048
2090
2018
2020
2024
2026
2028
2030
2032
2034
2036
2038
2040
2042
2044
2046
2050
2052
2054
2056
2058
2060
2062
2064
2066
2068
2070
2072
2074
2076
2078
2080
2082
2084
2086
2088
2092
2094
2096
2098
2100
Chart 6.2 – TWBC Recommended Pathway from 2018 – 2100Charts 6.3 and 6.4 contrast the recommended pathway with the current BAU
(Business As Usual) scenario represented by the red line. This scenario assumes that
all consumption and use remains constant and so the slight reductions seen are due
to the prediction that some fuels will become less carbon intensive over time.
Recommended Pathway v BAU (2018 - 2050)
4,000
3,500
3,000
2,500
tCO₂e
49%
2,000
74%
1,500
94%
1,000 % figures show
pathway
500 reduction vs
BAU
0
2018
2020
2022
2024
2026
2028
2030
2032
2034
2036
2038
2040
2042
2044
2046
2048
2050
Chart 6.3 – TWBC Recommended Pathway v BAU from 2018 - 2050
Recommended Pathway v BAU (2018 - 2030)
4,000
3,500
3,000
25%
2,500
49%
tCO₂e
2,000
74%
1,500
% figures show
1,000 pathway
reduction vs
500 BAU
0
2018 2019 2020 2021 2022 2023 2024 2025 2026 2027 2028 2029 2030
Chart 6.4 – TWBC Recommended Pathway v BAU from 2018 - 2030
The charts above really highlight the scale of action that is required in order to meet
the science based targets. Action of this degree will not only be required a local level
but also on national and global level as well. The timescale in which these changesare required is also underscored by these charts. For example, a reduction of 25%
against BAU emissions is required by 2022 and 49% by 2025.
Business As Usual Scenario
When the BAU scenario is compared to the budget, the reality becomes even more
stark.
Year BAU Emissions Cumulative BAU % Budget
(tCO₂e) Emissions Remaining
(tCO₂e)
2018 3,475.1 3,475.1 88.5%
2019 3,278.0 6,753.1 77.7%
2020 3,229.0 9,982.1 67.1%
2021 3,098.2 13,080.3 56.9%
2022 3,055.8 16,136.1 46.8%
2023 3,081.0 19,217.1 36.6%
2024 3,041.4 22,258.5 26.6%
2025 3,046.8 25,305.4 16.5%
2026 3,012.4 28,317.8 6.6%
2027 3,046.4 31,364.2 -3.5%
Table 6.2 – BAU Emissions Against Carbon Budget
Table 6.2 above shows how the apportioned carbon budget diminishes and as stated
earlier in this document, at current emission levels, TWBC would use their entire
budget to 2100 within 7 years from 2020. This is also illustrated graphically in Chart
6.5 below.
% of TWBC Carbon Budget Remaining
100%
90%
at current emissions levels
80%
70% following recommended pathway
60%
50%
40%
30%
20%
10%
0%
Chart 6.5 – BAU Emissions Against Carbon BudgetConclusion
It is apparent that in order to align with the science based targets that the UK signed
up to as part of the Paris Agreement, the council need to take significant and
immediate action. Action at this unprecedented scale will be required globally and
TWBC can be at the forefront of this action in the public sector.
Options Appraisal
Having established the council’s current position and quantified the scale of the task
and reductions required, the next step was to devise a strategy covering TWBC’s
estate, outsourced services and other emissions sources. LASER’s modelling would
help to inform the development of this high level strategy and then demonstrate that it
could credibly achieve the scale of emissions reductions required to achieve TWBC’s
net zero target.
In order to update and gain input from members and senior officers an initial options
appraisal workshop was run with officers and then a subsequent presentation was
given to members at the CEAP working group. The aim of this was to ensure that
LASER had a good understanding of which issues, subjects and concerns were of the
importance to the council and which were of less importance.
To achieve this, feedback was gathered from members and officers pertaining to the
relative importance of different success factors (listed below). Comment on each of
these and findings from the feedback are provided below. Following this, a list of
technologies/initiatives was then rated against each of the different factors and these
ratings were then weighted according to the feedback. This exercise allowed LASER
to better understand TWBC’s situation and stance and which approaches, purchasing
strategies and technologies would provide the best fit.
Success Factors
• Scale of investment was seen by officers as the most important/limiting factor.
Members acknowledged its significance and the limited resources and also noted the
importance of potential partner/grant funding.
• Speed/ease of implementation was ranked more highly by Officers; members noted
it was more important to select the right options to achieve 2030 target.
• Financial returns saw a wide variation in response with different stances from
members being apparent, some accepting low/no financial returns with other rating itas very important. As an average it is of moderate importance in line with the response
from the Officers’ workshop.
• Scale of emissions reductions was unanimously ranked as the most important factor
by Members, showing a strong commitment to the target. For Officers this figured lower
down the ranking, possibly as a result of them envisaging the target being achieved by
a wide portfolio of smaller scale measures.
• Political acceptability was generally ranked quite low which reflects the opinion that
the public will accept that sacrifices will need to be made in some areas to achieve this
target and that all parties are aligned in their commitment to the target.
• Project certainty was rated as far more important by Members that by Officers,
possibly reflecting the different stages of involvement in project planning, with
Members requiring firm information for final decision making but Officers prepared to
accept higher level estimates to contribute towards action planning.
• Impact on operations was seen as of less importance. Although it was acknowledged
that this issue will need to be managed, it is widely accepted that there may need to
be some impact on operations to achieve goals.
The scores for each of the success factors given by officers and each of the political
parties are shown in the table below. The average scores have then been ranked to
give an overall rating.
Factor Cons Lab Lib TWA Overall
Scale of emissions reductions 1 1 1 1 1
Project certainty 4 2 2 4 2
Scale of investment 2 5 3 3 3
Financial returns 7 4 4 2 4
Speed/ease of implementation 6 3 7 5 5
Impact on operations 3 6 6 6 5
Political acceptability 5 7 5 7 7
Table 7.1 – Ranking of success factors
The rankings from the table above have been reversed to weight each of the factors
once the individual Carbon Reduction Options (CRO) have been assessed against
each of these categories, so level 1 is the most heavily favoured.
These ratings show members’ cross-party commitment to the project and achieving
the net zero target, but still acknowledging the financial restraints resulting from the
current situation. The low ranking of political acceptability also mirrors this conclusion
and also indicates that members feel the public will also be accepting that sacrifices
will need to be made in some areas to achieve this target.Success Factors and Carbon Reduction Options (CROs)
The Success Factor ranking above was then applied to a list of potential CROs in
order to prioritise them. It should be noted that these findings rank each initiative based
on how suited it is to the council and their objectives. The initiatives were then divided
between CROs which would reduce consumption and replacement energy sources
which would reduce the amount of emissions associated with consumption. This
allowed for prioritisation on both fronts.
At this point, it should be noted that those initiatives that figure lower down the list
(shown in orange or red in Table 7.2 below) are not valueless but are not as well
aligned to the council’s objectives as those higher up the list (shown in darker green).
For example, a move to EVs is a very effective carbon reduction initiative in some
circumstance however TWBC’s own fleet make up c1% of their footprint and the scale
of reductions are of high importance to TWBC and hence moving to EVs ranked low
even though it is an action worth taking.
Another example are heat pumps. This is a developing technology and as such score
fairly poorly on project certainty, however with improved efficiencies (COPs in excess
of 5) now emerging and gas heating presenting a significant issue to address they are
likely to figure in efforts at some point. Although this may be further down the line once
other CROs are underway and potentially there has been further indication from
government on supporting heat decarbonisation measures at a national level.
CROs for immediate CROs for future Preferred Less Favoured
consideration/action consideration/action replacement of replacement of
energy sources energy sources
Reduce Own Fleet Owned Solar Farm
Estate Rationalisation PPAs
Mileage (in borough)
Improve Building Owned Wind Farm
LED Lighting Roll Out Offsetting
Fabric (in borough)
Reduce Grey Fleet Owned Solar Farm
Install Heat Pumps
Mileage (out of borough)
LED Streetlighting and Move to EVs (Own Owned Wind Farm
Controls Fleet) (out of borough)
District Heating
Rooftop Solar
Network
Move to EVs
(Grey Fleet)
Table 7.2 – Ranking and grouping of Carbon Reduction OptionsNaturally, many of the other CROs are highly dependent upon any potential estate
rationalisation, so it is hugely important that a clear direction on this is ascertained as
soon as possible to allow for additional planning.
Key points
• Investment in owned large scale renewable generation, either in or out of
borough, is unlikely due to importance of scale of investment and low rating of
political acceptability. TWBC could explore financing options such as PPAs
which could make owned asset or third party asset arrangements more
attractive. See the next section for more information.
• However, investment in in-borough assets was marginally more appealing to
members than investment in out-of-borough assets.
• Given the above but the need for zero carbon electricity supplies, PPAs seem
to be an attractive option for TWBC. PPAs received a high rating of Political
Acceptability.
• LED and rooftop solar seem likely to figure in early actions.
• Estate rationalisation remains politically unclear with an average rating of 3.5
for Political Acceptability (neutral). A clear direction on which buildings are to
be retained and which are not will be needed to allow for project and strategy
planning. If estate rationalisation is limited then greater activity will be needed
in other areas as shown in the modelling.
• Efficiency improvements are likely to figure once estate issues are clarified.
As well as LED, insulation and heat pumps would seem likely to figure
heavily. Heating strategy will need to be a focus but may be developed more
clearly as government policy evolves.
• 3rd party contracts have been a point of discussion. Grounds Maintenance
and Leisure could be reviewed in the nearer term but Waste Collection and
Street Cleaning is a longer term contract and these considerations will be
factored into the strategy.
Other Initiatives Proposed by Councillors
• Community energy generation – Small scale energy generation will be
covered by rooftop solar and potentially district heating. LASER would
suggest that community energy generation will figure more prominently in thearea wide strategy unless it would directly impact the council’s estate or
operations.
• Well-connected green infrastructure – LASER agree this is important but
would need to understand how TWBC’s green infrastructure and
sequestration plan impacts upon carbon emissions in order to factor in the
impact.
As touched on above, one of the key areas to consider is green electricity
procurement. The section below gives background and explanation and describes the
different options available and common terminology.Zero Carbon Electricity Supply Options There are various zero or low carbon electricity procurement products available and emerging onto the market. Selecting the products and the procurement strategy that provides the best fit for the council’s situation and objectives is an important challenge. Some of the key issues are as follows: REGOs (Renewable Electricity Guarantee of Origin) REGO certificates are the most widely recognised certification of environmental credentials for energy generation across Europe. They are well administered and the provision of a REGO with each MWh of electricity should guarantee that the energy was generated from “renewable” sources. The largest problem with REGOs from a zero carbon perspective is that their definition of “renewable” is not confined to zero carbon technologies but can also include technologies such as gas-fired CHP generation. Another issue is that as a consumer you cannot necessarily trace the generation back to a specific asset so do not know whether it is zero carbon or not. REGO backed supply can be reported as zero emissions but the validity of this is open to debate. Therefore REGO backed supplies are definitely “greener” than grid average electricity supplies but generation cannot be traced to a specific asset and they are not categorically zero carbon. Traceability As touched on above it is considered important in environmental fields to be able to trace generation to particular assets to provide assurance of renewable origin and add credibility. Additionality Additionality is a term that has arisen in recent years and has come to define a very important factor when considering investment in renewable assets or supply contracts. This is namely that the investment has a genuine impact that would not have been realised otherwise. In this case additionality can be seen as the investment resulting in the construction of a new generation asset such as a solar array or wind farm rather than the consumer receiving energy from an existing renewable asset that would be generating regardless of the consumer’s investment.
PPAs
PPAs are essentially contractual agreements between offtakers (consumers) and
suppliers or generators where an agreement is made to buy and sell an amount of
energy generated from a renewable asset for a set term, usually between 10 and 20
years. These agreements allow generators to invest in assets with certainty and
guarantees long term green energy supply to the consumer.
Due to the nature of PPAs they tend to be long-term, large volume contracts which
can preclude some consumers from entering the market. In order to provide a solution,
LASER has created a model where multiple public sector bodies are aggregated in
order to increase buying power and are calling this the Public Energy Partnership
Power Purchase Agreement (PEPPPA).

Products Available
There are a number of routes that you could go down to procure varying degrees of
renewable electricity. The choice will be based on what you deem as a suitably
green/renewable approach and recognising the potential obligations/flexibility of each
option.
By way of an example of the range of products available, LASER’s offerings in this
area are outlined below. LASER recognises the challenges our customers face in
reducing their electricity consumption whilst managing a public sector estate and the
uncertainty that comes with that. As such, LASER have create three tailored options
to procure green electricity:
Table 8.1 below illustrates and highlights some of the key factors associated with each
option to help with comparison of the different routes.

                Table 8.1 – Summary of LASER’s Carbon Net Zero Electricity Options

Further detail on each of these 3 options is contained in Appendix 7 of this report.
LASER’s support is not confined to these 3 options and LASER are in a position to
assist with investigating investment in renewable assets through other models, for
example directly or through other PPA structures.
It is important to note that some certainty around long term energy requirements is
vital when planning in this area.
Zero Carbon Modelling, Outputs & Strategy
Following on from the creation of the forecast of emissions in a business as usual
scenario and taking into account the feedback from the options appraisal workshop,
LASER worked with TWBC to identify a number of potential different scenarios which
TWBC would like to assess.
In order to achieve this, the BAU forecast has been used as a baseline and the impact
of individual initiatives have been built into this to assess the net impact on emissions
of a range of options in a particular scenario.
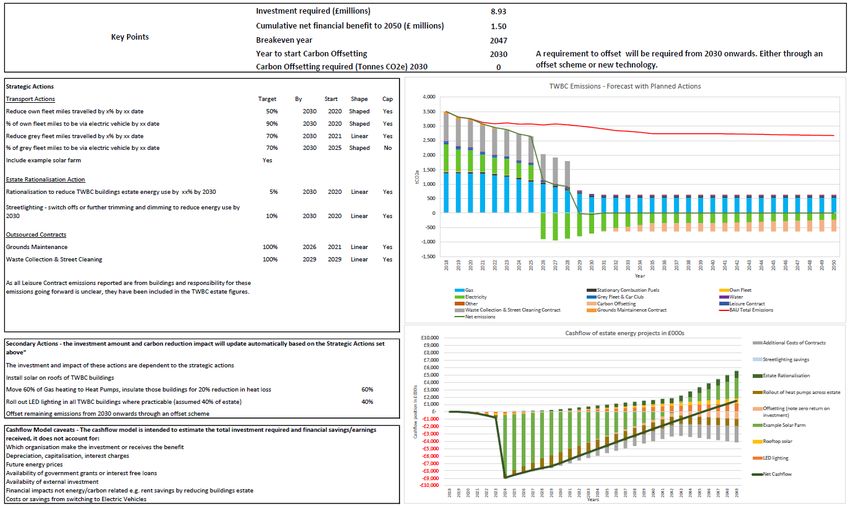
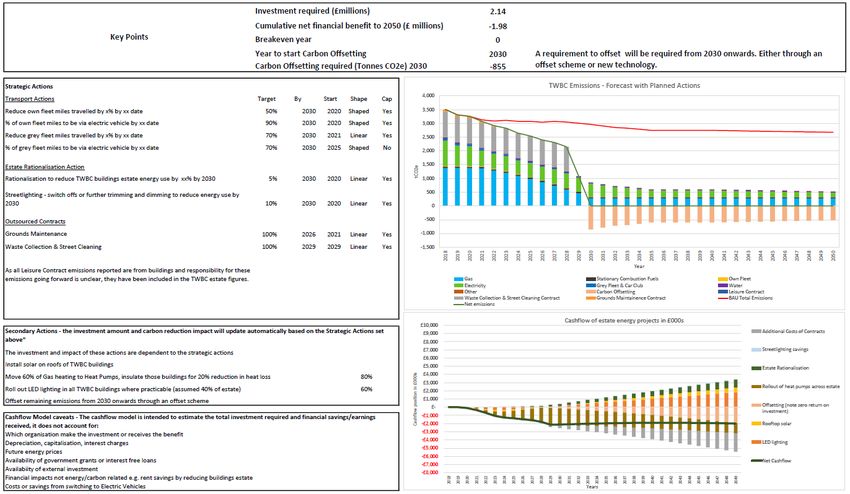
LASER created a central scenario demonstrating the impact of a set of agreed actions
and assumptions (such as an assumed estate rationalisation level of 5% by 2030)
against the BAU baseline.
The most powerful output from this work are the charts of net emissions and net
cashflow which clearly demonstrate the cumulative impact of the selected option on
the council’s emissions. Chart 9.1 below shows how the different emissions sources
fluctuate over the period and how the net emissions compare to the BAU baseline
shown in red.
Chart 9.1 – TWBC emissions under central scenarioChart 9.2 shows the cashflow of the projects with those generating a positive cashflow
shown above the x-axis and those negative ones below. The net position is shown by
the dark green line.
Chart 9.2 – TWBC emissions under central scenario
In this scenario significant quantities of gas and grid electricity consumption remain at
2030 (the target date) and so there is a heavy reliance on offsetting to achieve the net
zero target set by the council. This is also reflected in the cashflow with offsetting
becoming an increasing cost over time for TWBC to remain net zero emitters. Carbon
offsetting is discussed in more detail later in this section.
Scenario Analysis
Once the central scenario had been agreed, in conjunction with TWBC, 5 additional
scenarios were also created demonstrating the effect of particular variations to give
TWBC further insight into impacts and help inform decision making.
This resulted in the list of 6 scenarios as follows:
1. Central Scenario
2. With no estate rationalisation
3. Increased coverage of LED & ASHPs
4. Increased coverage of LED & ASHPs and electricity procurement through PPA
5. With 40% estate rationalisation
6. With investment in Solar Park (owned or 3rd party – investment structure tba)
Detailed outputs from each of these scenarios are contained in Appendix 8.Comparisons have been made across all scenarios and the total net emissions under
each scenario have been plotted against each other on the chart below. These charts
also show the recommended Paris Agreement Pathway as a comparison.
Chart 9.3 – TWBC emissions under various scenarios to 2050
Chart 9.4 – TWBC emissions under various scenarios to 2029Chart 9.3 shows all scenarios reaching net zero by 2030 as the assumption has been
made that TWBC would offset all remaining emissions to reach the target set. Chart
9.4 demonstrates that there is a heavy reliance on offsetting in many scenarios which
is not advantageous from an environmental perspective or from a risk perspective.
Again, this issue will be expanded upon in the section below.
It can be seen that only the scenario with investment in a solar park reaches net zero
without offsetting. However, in general terms this is to be expected as the solar park
creates a positive carbon impact, counteracting those emissions that the council have
not yet abated.
It is also worth noting that the scenarios including PEPPPA and the solar park
generate more significant early impact from the electricity procurement strategy and
so are more closely aligned with the Paris Agreement Pathway than other scenarios.
Scenario Cashflow
The chart below shows the net cashflow of the various scenarios and it should be
noted that this accounts purely for energy costs. For example, the estate
rationalisation calculation accounts for the savings from reduced energy consumption
from any buildings or sites that are disposed of but does not account for revenue from
sale or leasing of properties.
Chart 9.5 – TWBC net cashflow under various scenariosThe most financially attractive scenario above is the 40% estate rationalisation scenario due to the ongoing savings in energy costs and the council would break even by 2029. However there are evident considerations in terms of service delivery from a reduced estate. The only other that breaks even before 2050 is the solar park scenario where the returns are more considerable than in other scenarios and the large investment offers positive returns in the long-term. The general downward curve from 2030 onwards is due to the slowly rising forecast cost of offsetting. The scenario with PEPPPA shows some positive trend but this diminishes over time and the remaining three scenarios all show a downward trend. The estimated £8m investment in the solar park scenario constitutes a large investment however there will be a range of financing options available and the investment shouldn’t necessarily be seen as prohibitive. For instance, capital could be secured as a loan, or a PPA could possibly be structured to return the investment to a lender over a prolonged period. There is also potential for internal arrangements to be made, for example building in a recovery into electricity rates across the portfolio to recoup investment from energy budgets. However it remains the case that the Green Basket and PEPPPA provide the easiest access to green electricity with traceability to renewable assets. It should be noted that these scenarios are not the only options and it is likely that a strategy will evolve that may incorporate elements from different scenarios. It is anticipated that this modelling will evolve over time but this report and analysis should help inform decision making and strategy. Carbon Offsetting There is a reliance on carbon offsetting to achieve targets in some scenarios. This is a drawback from an environmental perspective as conventionally only emissions that can’t be abated by other means should be offset. It also contains inherent risks as it leaves the council exposed to the market. Additionally, offsetting is seen by some as ‘greenwashing’ so needs careful management to ensure emissions saving are real. The carbon offsetting costs (£/tCO₂e) used in this analysis are based on government forecast figures in a mid-range scenario. Although these are the best possible representation at this time, carbon offsetting is an evolving market and as such more difficult to predict. Therefore there is a risk that the cost of carbon offsetting could be substantially higher by 2030 especially as demand is likely to drastically increase at that point and over the intervening period. As touched on, the increasing cost of offsetting creates the downward curve seen in the series from 2030 onwards in Chart 9.5 above. It is also very important to highlight
that there is no financial return from investment in carbon offsetting and so this creates
the negative trend. Costs of offsetting have been separated and are shown below.

                  Chart 9.6 – Cumulative costs of offsetting under various scenarios

                  Chart 9.7 – Cumulative costs of offsetting under various scenarios
Offsetting has a chequered history including well documented cases where offsetting
schemes claimed to invest in projects across the globe but in some cases were later
found to offer little overall benefit and others fraudulent. It is recommended that
offsetting is seen as the last resort after reducing direct emissions as far as possible.
There is however merit in the type of actions that offsetting schemes often make (or
claim) for example tree planting or land use changes. It may be that this marketplace
develops in the next few years and offers potential to work alongside other local
Councils for example jointly with the Kent Wildlife Trust to assess local opportunities
to invest in activity which extracts CO2 from the atmosphere.
Agreed Actions and Assumptions
Assumptions have been made in the modelling pertaining to transport and
streetlighting reductions which are consistent throughout although these do not have
a sizeable impact on emissions due to the relative significance of these emissions
sources. These assumptions are as follows:
• Reduce own fleet miles travelled by 50% by 2030
• 90% of own fleet miles to be via electric vehicle by 2030
• Reduce grey fleet miles travelled by 70% by 2030
• 70% of grey fleet miles to be via electric vehicle by 2030
• Continued conversion of streetlighting to LED, switch offs, further trimming and
dimming to reduce energy use by 10% by 2030.
• Conversion of ice rink generator fuel use to electricity in 2025.
In addition to these assumptions were made around outsourced services which are
detailed below.
Treatment of Outsourced Services
In all of these scenarios, a common approach was taken to the treatment of the
outsourced contracts. It was decided that, as the waste collection and street cleaning
contract is a long-term contract which the council are already committed to, TWBC
would look to achieve a step change in emissions from current levels to zero carbon
at the contract renewal. This would be reflected in emissions from 2029 onwards. This
was believed to be a realistic approach as for long-term contracts of this nature,
contractors are likely to purchase equipment and vehicles specifically to service the
contract, making the current contract difficult to negotiate but meaning that the zero
carbon requirements can reasonably be integrated through the tender process. By this
point in time contractors will also be more accustomed to the requirement to provide
services with zero net emissions.Differing approaches were adopted for the Grounds Maintenance and Leisure Services contracts. As the council own the leisure centres, the emissions from these buildings have been handled within the council’s own estate as TWBC may decide to assume responsibility for the buildings when the leisure contract renews in 2021. The mechanics of these arrangements are still to be decided. The emissions for the Grounds Maintenance contract were assumed to abate in a linear fashion from current levels to net zero over the course of the next contract. This would again be built into the tender specifications at contract renewal in 2021.
Conclusion

In order to get close to the Paris Agreement pathway it is evident that substantial early
action will need to be taken to reduce emissions.
Direction on estate rationalisation is extremely important, without this officers are
unable to plan projects as they do not wish to invest in buildings where there is a risk
that they will not be retained. Officers are also unable to plan an energy purchasing
strategy as required energy volumes may potentially fluctuate significantly and long
term volume commitments are required for most zero carbon electricity purchasing
options.
Further work will need to be undertaken regarding the outsourced contracts, both
internally and with contractors. Both the method by which these emissions will be
abated and the costs associated with this are unclear at the moment. Companies like
Urbaser are already looking into these issues and it seems likely that very low or zero
carbon services will be available in some areas by contract renewal.
The leisure service remains extremely difficult to plan for with the definitive future of
the buildings and service unclear. As with estate rationalisation it is important that a
clear direction is decided upon to allow for carbon forecasts to be updated and action
to commence.

Evolution of Strategy and Model
At this stage the modelling gives a view of potential and possibilities and shows that
there are different ways to achieve the target set by the council. It does not attempt to
assess project options at individual building level.
The chosen strategy and model are expected to evolve and change as investigations
into favoured options are taken forward and further information becomes available.
The model can continue to be a useful tool in monitoring progress as well as for
planning and decision making.
It is likely that opportunities for further emissions reductions will come to light in the
medium term that are not included in the model. This may be through new
technologies, reductions in costs of current technologies or government policies.
Key points
   •   TWBC can achieve net zero carbon by their target date and the model sets out
       differing strategies to achieve this.
   •   Substantial early action is needed to align with Paris Agreement pathway.
   •   Short term impact due to the pandemic has not yet been quantified.
   •   The majority of TWBC’s carbon footprint is attributable to outsourced services.
   •   Clear long term policy on estate and services is needed to allow planning of
       energy efficiency actions.
   •   Clear medium and long term policy on estate and services is needed to allow
       commitment to most zero carbon electricity supply options.
   •   Investment in large scale renewables can be structured in a variety of ways and
       may not require vast up front capital investment.
   •   In most scenarios above, the council relies heavily on offsetting emissions to
       achieve targets. This comes with significant risks and importantly no financial
       returns on any investment.
   •   The offsetting market is expected to change and develop hugely over the next
       decade.
   •   Modelling is designed to help inform decision making and is based on current
       factors and state of the market technologies. Technologies and economics may
       change significantly over time and government funding and policy will also
       influence these issues. Regular review of the model as the technology, service
       and property landscape changes, will place TWBC in the best position to meet
       their net zero targets.

Next Steps

   1. Determine estate future
As mentioned, establishing a firm direction for the estate and leisure service in
particular is vital to allow for planning to reduce emissions and it is recommended that
this is made a priority.

   2. Develop Detailed Action Plan
It is recommended that the council develop a detailed action plan which would cover
policies, responsibilities, working parties, site surveys, and consultations with
suppliers of outsourced services amongst other things. This plan should tie in all of the steps below and provide clear action points in each area. LASER can assist in this area as well and would be happy to discuss this further. In order to create a meaningful action plan it is crucial that Step 1 is carried out as soon as possible. 3. Immediate action in retained buildings For now, focus can be brought on those buildings (and car parks) where there is a strong likelihood that they will be retained, as well as on streetlighting. This investigation should focus on established technologies like LED lighting, rooftop solar and building fabric but should also look to assess low carbon heating solutions such as heat pumps and the applicability of other technologies and initiatives. LASER are happy to assist with this and have frameworks in place to provide support. 4. Address less significant emissions sources In addition to this the council can pursue established initiatives in other areas such as moving to electric fleet, encouraging electric vehicles within their grey fleet and car club and reducing mileage in all areas. Also reducing water use and waste generation should be considered and solutions for the ice rink should to be analysed, but these are relatively minor contributors to the overall footprint. 5. Update carbon footprint Concurrent with these investigations 2019-20, and shortly 2020-21 data, can be built into the model to demonstrate the changes to the carbon footprint to date and pertinently, the impact of COVID-19 on the council’s emissions. 6. Procure green energy for estate Although commitment is dependent on Step 1 above, TWBC can establish a proposed procurement strategy for electricity and implement this once a clear direction is obtained. LASER product offerings allow a natural progression from the Green Tariff, onto the Green Basket and finally onto a PPA. With each step there will be a greater requirement for commitment but enhanced green credentials for the supplies due to increased traceability and additionality. The Green Basket can be seen as an intermediary step or interim option before committing to a longer term PPA.
LASER Background

LASER Energy Buying Group was formed in 1989 by Kent County Council (KCC) with
the aim of assisting Local Authorities and other public bodies to benefit from lower
energy prices through deregulated gas and electricity markets and to offer
management services that focus on reducing energy spend, saving time and hassle
for our customers.

LASER Energy has grown to become one of the leading energy procurement and
energy management service providers in the UK. Today our mission is to deliver
unique end-to-end solutions to our customers helping reduce energy costs, manage
market risk and provide OJEU compliance in an increasingly volatile market.

LASER’s success and reputation has helped it to grow organically to its current
position serving 200 public sector customers and buying in excess of £500m of energy
per annum. We work with a large number of public sector bodies including NHS Trusts,
Universities & colleges, Local Authorities and Housing Associations.
Key People
Name                   Description

                       Steve has a strong background in energy and carbon management
                       having previously worked as an Energy Engineer for Schneider
                       Electric and a Carbon & Compliance Manager for ENGIE. Throughout
                       this time Steve conducted energy surveys across a wide range of
                       sectors and has also dealt with numerous environmental schemes
Steve Marks            including CCAs, EUETS, GQCHP, CDP, CRC and ESOS. Steve is a
                       CIBSE Low Carbon Consultant and remains an accredited DEC
Carbon Strategy Lead
                       Assessor and ESOS Lead Assessor.
                       Steve managed LASER’s team of Energy Surveyors and has led
                       LASER’s response to assist the public sector in addressing the
                       climate emergency declarations and carbon net zero targets enacted
                       by many authorities.

                       Helen has over 10 years of experience within the energy industry,
                       having worked in the marine, timber, gas and electricity sectors.
                       Helen procured fuel for the fleet at P&O Ferries and researched
                       alternative fuel types and technologies to help reduce carbon
Helen Cartledge
                       emissions.
Zero Carbon Advisor
                       Helen has also worked for a national timber company and in energy
                       procurement and undertaken a carbon reduction project for a local
                       charity, identifying financially advantageous sustainable power
                       alternatives.

                       Andy has over 25 years’ experience in energy efficiency and
                       procurement since graduating as an Energy Engineer. He has
                       previously worked for Matthew Hall, procuring energy and operating
                       EPCs for large clients, and the City of London Corporation, taking
Andy Morgan            responsibility for saving and procuring energy for the City portfolio.
                       Now Andy manages LASER’s Bureau Services, LED Lighting
Head of Energy
                       Services and other energy management and water services.
Management
                       As a CMVP, Andy is expert in handling and analysing data and also
                       specialises in energy efficiency, renewable energy, energy supply
                       markets, energy industry infrastructure and Government energy policy
                       and schemes.
You can also read