Impacts and Implications of COVID-19 for the Energy Industry - Placeholder image
←
→
Page content transcription
If your browser does not render page correctly, please read the page content below

Impacts and Implications of
COVID-19 for the Energy Industry
ASSESSMENT THROUGH JUNE 2020

PREPARED BY
Frank Graves    Robert Mudge       Placeholder
Tess Counts
Josh Figueroa
                Lily Mwalenga
                Shivangi Pant
                                      image

JULY 9, 2020
Purpose and Caveats

This report provides an update to our initial compilation and assessment of the impacts of COVID-19 on electric and
natural gas utilities in early April. Like our prior report, it reflects a review of many sources of information, with public
health, economic, and industry data changing considerably day by day. The goal is to make a broad overview of energy
industry implications available in one document, rather than to offer a detailed forecast or opinion. Data sources are
considered reliable but have not been independently validated by Brattle. Doubtless, some important sources of
information have been overlooked.
                                                                                Placeholder
The pandemic continues to have devastating effects on healthcare, education, business activity, and employment.
                                                                                     image
However, social distancing regimes in most states are being relaxed. Thus, it is possible we have seen as much energy
demand reduction as will occur as a direct effect of social distancing.
Lingering and more difficult questions about the indirect effects of COVID-19 involve how quickly we can get back to
more normal commerce, how much irreversible destruction of businesses will have occurred, and how demand
patterns (consumption habits) may change over the long term. Utilities are being asked to bear some of this risk, but
deferred cost recovery mechanisms may themselves be strained if the pandemic lasts too long.

This assessment reflects the perspectives and opinions of the authors and does not necessarily reflect those of The Brattle Group’s clients or other consultants.

Copyright © 2020 The Brattle Group, Inc.                                                                                                                            brattle.com | 2
Agenda
1. COVID-19 Path and Macroeconomic Projections
2. Energy and Financial Sector Impacts
Oil & Gas demand and prices
Electricity loads, load shapes, and prices
Generation mix impacts Placeholder
Renewable energy developments image
Regulatory reactions
Financial impacts on valuations, interest rates, risk
3. Key Takeaways
Frame of reference: We have treated February 1, 2020, as the beginning of the significant influence of
COVID-19 on the U.S. economy. Energy data has not been weather-normalized, so we use (where
relevant) the average of a few years’ prior history for comparison.
brattle.com | 3
COVID-19 Path and
Macroeconomic Projections
                            Placeholder
                               image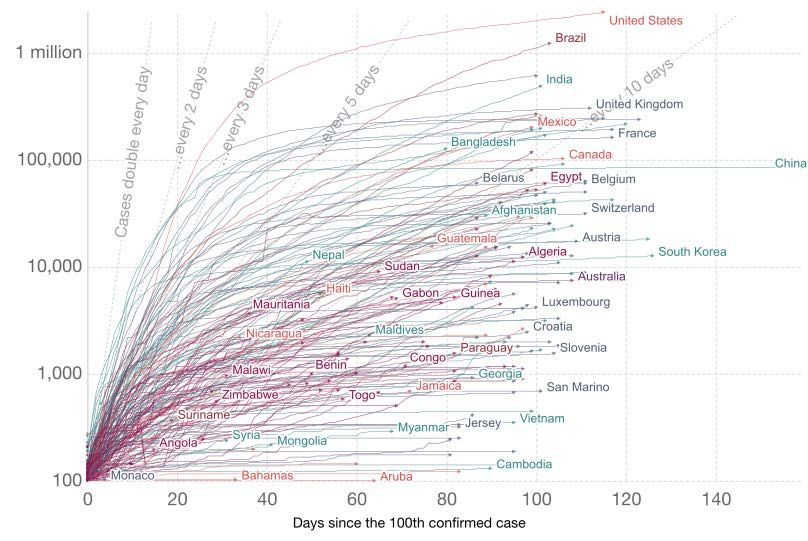
Economy-Wide Drop and Recovery?
Disease Outlook
COVID-19 infections in the U.S. have increased throughout June, averaging 20% more infections over the
month than May.
The end of June and beginning of July have shown the greatest reported daily infections in the history of the pandemic, with
around 55,000 reported infections daily.
Although daily deaths have not grown as rapidly as infections, the U.S. cumulative deaths are steadily increasing, reaching over
128,000 by July 3.
Placeholder
Daily COVID-19 Related Statistics in U.S.
CDC Statistics as of July 31 image
Daily Infections Daily Deaths
brattle.com | 5
Economy-Wide Drop and Recovery?
Disease Outlook – Canada
According to the European Centre for Disease Prevention and Control (ECDC), since the end of April, Canada
has experienced an 87% decline in daily infections, while the U.S. has seen a 52% increase as of June 30.3
Both the U.S. and Canada have experienced a general decline in daily deaths since April, with 58% and 68% declines, respectively.
Based on IHME data, Ontario has below-average death and infection rates per capita, compared to Canada’s overall country
statistics.2
COVID-19 Related Statistics in U.S. & Canada Placeholder
ECDC Projection as of July 53
Daily Infections per Million Residents
image
Daily Deaths per Million Residents
Difference
+52%
between
4/30 - 6/30
-58%
-68%
U.S.
-87%
Canada
brattle.com | 6
Stabilizing or Still Growing?
The U.S. has 25% of worldwide cases but only about
Growth in Number of Confirmed COVID-19
4% of the population.4 Cases since Inception 5
U.S. death rate has been declining since April, and its
*
infections’ doubling time has declined (~10-20 days) – but is
still higher than average on a global scale and locally higher in
some states.
NY accounted for more than 50% of all U.S. deaths, but has
Placeholder *
accounted for less than 10% of daily U.S. deaths in June on
average.
image
Daily COVID-19 Related Deaths 1
U.S.
Rest of U.S.
New York
Source: The Visual Capitalist, data as of June 26, 2020.
brattle.com | 7
Economy-Wide Drop and Recovery?
Macroeconomic Components
Most forecasts for Q2 2020 project a deep reduction U.S. Real GDP Growth Forecasts 6
in GDP, as large as 30-35%, e.g., as forecasted by
Goldman Sachs. But then there is mostly continued
expectation of a quick recovery, with GDP rebounding
and growing back almost as fast in Q3 2020.6
On a year over year basis, Goldman forecasts an overall 4.2% Placeholder
GDP reduction in 2020, followed by 5.8% annual growth in
2021. image
As of July 2, the CBO predicts a year-over-year decline of 5.8%
in real GDP in 2020, followed by a 4% recovery in 2021.7
Similarly, the Fed forecasts a 6.5% reduction for all of 2020,
with a recovery of 5% in 2021.8
The average decline affects certain sectors much harder than
others. A PwC April report suggested that some sectors, such
as transportation & hotels and food services & bars, are
experiencing reductions in revenues of as much as 50%.9
Source: Goldman Sachs Global Investment Research.
brattle.com | 8
Economic Impacts on Individuals
With U.S. total jobless claims roughly 3x begin-of-year levels, there is concern regarding personal and
commercial limits on ability to endure continuing economic hardship.10
Although initial monthly unemployment claims have decreased since April, the CBO forecasts that unemployment will decline from
about 10% to 5% over the coming decade, averaging 6.1% through 2030, which is well above the pre-pandemic levels of 3.7%.7
As of the end of May, over 106 million loan accounts had been granted some sort of deferred payments or relief status, with
student loans being the most skipped payments (79 million accounts).10
Placeholder
U.S. Jobless Claims 11, 12, 13 image
Delayed Payments (Millions) 10
Source: The Wall Street Journal, June 18, 2020.
brattle.com | 9
Energy and Financial Sector
Impacts
                              Placeholder
                                 image
Oil & Refined Products – Spot Prices
Oil prices have recovered since the end of April as Oil Prices 14 OPEC+ agree
$80 extend to
OPEC+ and U.S. production cuts have taken effect -- but Brent production
cuts
prices remain 20-30% below pre-COVID-19 levels at $60
-28%
-66%
around $40/bbl.17 WTI
$40
-74%
-21%
OPEC production levels are lowest since the Gulf War in 1991.15 $20
$/bbl
In June, U.S. oil production hit 10.5 MMbpd, the lowest level in two
years, down from a record high of 13 MMbpd earlier in 2020.16 $0
2/1 3/1
Placeholder
4/1 5/1 6/1 7/1
In June, OPEC+ agreed to extend 9.7 MMbpd production
-$20
image Close of May
contract causes
WTI to go negative
cuts (10% of pre-COVID-19 demand levels) through end -$40
for first time in
of July.18 history
U.S. Oil Storage 16
U.S. oil storage currently stands at 539.2 MMbbl.16
539.2 MMBbl
July 3, 2020
China capitalized on low prices to buy 73 MMbbl (75%
of global daily demand) on 59 tankers currently floating 672 MMBbl
EIA reported net
off its coast, which has helped support prices.19 working storage
capacity
brattle.com | 11
Sources: S&P Market Intelligence, U.S. Energy Information Administration, as of July 8, 2020.Oil Futures
Oil futures have rebounded significantly since May, but markets are still pricing in a slow recovery (with
forward prices below those in Feb 2020 through late 2020s).
WTI and Brent futures for 2020-27 have increased by 11-14% Oil Futures 20
$60
since May 1:20 Brent
$55
Placeholder
Reopening of global economies combined with production caused futures
to rise. $50
WTI
Futures remain 14% below pre-COVID-19 levels. $45
image
$/bbl
$40
Goldman Sachs estimates global oil demand will not recover $35
to pre-COVID-19 levels until 2022:21 $30
Global oil demand will decline by 8% in 2020 and rebound by 6% in 2021. $25
Gasoline and diesel markets to recover fastest (by 2021) but jet fuel $20
demand won’t recover until 2023.
$15
2020 2021 2022 2023 2024 2025 2026 2027 2028 2029 2030
Lower oil prices continue to have major impacts on the oil
Brent WTI
industry: February 1
Chesapeake Energy filed for bankruptcy on June 28.22 May 1
Shell and Chevron took $22B and $10B write-downs, respectively, due to July 1
lower energy prices.23
Source: S&P Market Intelligence, as of July 2, 2020. brattle.com | 12U.S. Gasoline Prices
Vehicle travel has returned to near pre-COVID-19 levels as many regions reopen, and gasoline prices have
followed higher.24
Gasoline margins between wholesale and retain have returned to beginning of the year levels of $0.80/gallon after doubling to
$1.60/gallon at the end of March.14,25
Retail gasoline prices are 18% below 2019 levels despite heading into the typically high demand 4th of July Weekend, according to
EIA data.25
Placeholder
Relative Vehicle Travel 24
image
Retail U.S. Gasoline 14,25
$2.50
-11%
$2.00
Regular
(Retail) -29%
$1.50 RBOB -20%
$/gallon
(Wholesale)
$1.00
-44%
Decline relative
$0.50 to February 1
$0.00
2/1 3/1 4/1 5/1 6/1
Source: Apple Mobility Trends, accessed July 2, 2020. Sources: U.S. EIA and S&P Global Market Intelligence, as of July 2, 2020.
brattle.com | 13Natural Gas – Demand
Natural gas demand has only been modestly Natural Gas Demand – 2020 vs. 2019 26
affected by COVID-19. 40
Power Change in
30
Monthly
20 Average 2020
Bcf/day
Natural gas for power generation increased in June due 10
+1% +12% +4% 0% +4% vs 2019
to warmer temperatures, with average June power
Placeholder
0
demand up 4% compared to last year.
2/12
2/19
2/26
3/11
3/18
3/25
4/15
4/22
4/29
5/13
5/20
5/27
6/10
6/17
6/24
2/5
3/4
4/1
4/8
5/6
6/3
-10
In May and June, industrial demand returned to past
35
25
Industrial image
normal levels, recovering from a 7% year-over-year 15
Bcf/day
decrease in April. -4% +6% -7% -4% 0%
5
-5
2/12
2/19
2/26
3/11
3/18
3/25
4/15
4/22
4/29
5/13
5/20
5/27
6/10
6/17
6/24
2/5
3/4
4/1
4/8
5/6
6/3
Residential & commercial demand declined in the first -15
few months of the pandemic but this was mostly due to 60
Residential & Commercial
normal seasonality; they are now relatively in-line with
40
2019.
Bcf/day
20
-8% -24% +1% +8%
0 -4%
2/12
2/19
2/26
3/11
3/18
3/25
4/15
4/22
4/29
5/13
5/20
5/27
6/10
6/17
6/24
2/5
3/4
4/1
4/8
5/6
6/3
-20 brattle.com | 14Natural Gas – Storage Levels
Lower global natural gas demand has led storage levels to build faster relative to prior years, particularly in
Europe, echoing prior storage concerns in the oil markets.
European natural gas storage is currently at 82% of total capacity, based on country reported data.28
Both Europe and the U.S. storage levels are 3 months ahead of the 5-year average.
EIA estimates an end-of-October storage level of 4,039 Bcf – the highest end-of-season storage level on record.51
Placeholder
China and Japan, the two largest LNG importers, have smaller natural gas storage capacities than Europe and the U.S. (360 Bcf in
China and 590 Bcf in Japan).29,30
United States 27
image
Europe 28
brattle.com | 15
Sources: Gas Infrastructure Europe, U.S. EIA.Natural Gas – LNG
Global LNG prices remain under pressure; U.S. export volumes have fallen significantly in May and June.
LNG Spot Pricing 31
Global LNG prices remain 50-60% below beginning of the year 1.2
due to lower demand and elevated storage volumes.31 1.0
Mediterranean
It is estimated that 20 U.S. LNG Cargoes were cancelled in June, 0.8
Index (January 2 = 1)
NW Europe
Placeholder
Price Index
which caused export volumes to fall ~85% relative to March.32 0.6
East Asia
An additional 45 cargoes in July and 40 cargoes in August are expected 0.4
to be cancelled, equivalent to ~5 Bcf/day or 7.5% of current daily U.S.
demand.32 0.2 image
Goldman Sachs estimates cancellations will add more than 760 Bcf to 0.0
U.S. gas storage.33 1/2 1/16 1/30 2/13 2/27 3/12 3/26 4/9 4/23 5/7 5/21 6/4 6/18
EIA estimates 25% utilization of U.S. LNG export capacity in July and Monthly U.S. LNG Shipping Exports (Jan-June 2020) 31,36
August 2020.51
Cubic Meters of LNG (000 per Month)
Estimated June but for
Lower export volumes are putting downward pressure on Henry Hub cancelled cargoes =
prices. 9,000,000 m3 LNG
Utilization at Sabine Pass, the largest U.S. export terminal,
reached a 16-month low in June.34
Japan’s LNG imports fell to an 11-year low in May, due to
COVID-19’s impact on the economy.35 brattle.com | 16
Note: June averaged through June 24, 2020.Natural Gas – Futures
Lower export volumes coupled with high domestic storage levels caused the August Henry Hub contract to
decline 25% by July since the beginning of May.
Henry Hub Futures 37
Forward curve fell by about $0.20 (-8%) on average since $3.50
the beginning of May due to over supply concerns. $3.00 May 1
Futures curve remains elevated relative to pre-COVID-19 levels.
High U.S. storage levels could lead to further reduction in winter
$2.50
Placeholder July 1
February 1
image
$2.00
$/Dth
prices. $1.50
$1.00
Long-dated forwards are now above pre-COVID-19 $0.50
(February 2020) levels. $0.00
Sep-20
Sep-21
Jan-21
Jan-22
May-20
May-21
Summer/Winter 2021 spread (Aug to Jan) increased by
42% since May 1st to $1.22, driven by lower summer August 2020 January 2021 August 2021 January 2022
prices. February 1 To July 1 -$0.44 (-21%) $0.34 (13%) $0.28 (12%) $0.20 (8%)
May 1 To July 1 -$0.57 (-25%) -$0.21 (-7%) -$0.10 (-4%) -$0.07 (-3%)
August 2020 contract fell by $0.57 (-25%) whereas January 2021
prices only fell by $0.21 (-7%) relative to May 1st.
Source: S&P Market Intelligence, as of July 1, 2020. brattle.com | 17Natural Gas Spot Prices in Demand Regions
Demand-area prices have remained fairly steady for the past 2-3 months, though they are well below prices
in same months last year.
$8.00 $5.00
Boston $4.50
Chicago
$7.00
-55% -51% -42% -36% $4.00
$6.00
$3.50
Placeholder
$5.00
$3.00
$/Dth
$4.00
$/Dth
$2.50
image
$3.00 $2.00
$2.00 $1.50
$1.00 Transco $1.00
-39% -33% -31% -39%
Z6-NY -41% -36% -40% -36% $0.50
$0.00
2/1 3/1 4/1 5/1 6/1 $0.00
2/1 3/1 4/1 5/1 6/1
$14.00
$12.00
$10.00
$8.00
PG&E
$/Dth
$6.00
-13% -17% -11% -16% Average Monthly
$4.00
Price Month vs.
$2.00 4-Year Average
SoCal -32% -39% -29% -32% Price38
$0.00 brattle.com | 18
Source: S&P Global Market Intelligence, as of July 1, 2020. 2/1 3/1 4/1 5/1 6/1Natural Gas Spot Prices in Supply Regions
Permian prices now trading at Henry Hub levels as a result of lower oil and associated gas production in West
Texas.
$7.00
$4.00
Henry Hub
$3.00 -30% -33% -34% -41% $6.00
$2.00 $5.00
Opal
Placeholder
$1.00 $4.00
-34% -31% -23% -35%
$/Dth
$/Dth
$0.00
$3.00
image
2/1 3/1 4/1 5/1 6/1
-$1.00
-73% -83% -4% -29% $2.00
-$2.00
-$3.00
Permian (Waha) $1.00
Alberta -14% +24% +12% +14%
$0.00
-$4.00 2/1 3/1 4/1 5/1 6/1
$3.00
N.E. Marcellus
$2.50 -33% -27% -26% -24%
Henry Hub averaged $2.00
$1.63/Dth in June – the
$/Dth
lowest inflation-adjusted $1.50
price in 31 years.51
$1.00 Average Monthly
-36% -34% -36% -30% Price Month vs.
$0.50
4-Year Average
Dominion South Point Price38
$0.00 brattle.com | 19
Source: S&P Global Market Intelligence, as of July 1, 2020. 2/1 3/1 4/1 5/1 6/1Natural Gas – Weekly Basis Differentials
As Henry Hub prices fall due to storage concerns Basis Differentials to New York City 38
and lower export demand, basis differentials to $1.20
the Northeast are flattening. $1.00
Dominion South Point
$0.80
$0.60
Henry Hub to Dominion South Point 38
$0.40 Placeholder
image
$0.20
$0.00
-$0.20
-$0.40
Henry Hub
-$0.60
-$0.80
$1.00
$0.50
$0.00
Difference
-$0.50 from 4-Year
-$1.00 Average
Spreads Calculated as: Destination - Origin brattle.com | 20
Source: S&P Global Market Intelligence, as of July 1, 2020.Weather
May was slightly colder than normal in the U.S. and Canada, while warmer than average temperatures were
felt in June in populous areas. Deviation between Average Actual and Normal (°F) 39,40
May 2020 Placeholder
image
June 2020
brattle.com | 21
Source: Environment and Climate Change Canada; National Weather Service Climate Prediction Center.Impact on Regional Electric Loads
Compared to the prior 4 years, June 2020 average 7 ISOs’ Electricity Load* in February-June 2020
hourly power loads for seven major ISOs* dropped Relative to Load for Prior 4 Years (2016-2019) 42
3.2% in June, less than half the 7.5% reduction
experienced in May.
The 7.5% load reduction in May could be about as deep as
will occur from social distancing and COVID-19, barring
bankruptcies and other economic fallout.
Placeholder
The load reduction in June was about the same as March image
levels (~-3%), as stay-at-home orders relaxed across the
country.
According to the EIA, residential load increased by
8% during April 2020 compared to April 2019,
while commercial load decreased by 11% and
COVID-19 effect in June is
industrial load by 9% across the U.S.41 roughly half as large as in April
and May, as stay-at-home
orders relax across the U.S.
Note: *CAISO, MISO, ISO-NE, NYISO, PJM, ERCOT and SPP; collectively, these ISOs represented approximately 55% of total U.S. load in February through June 2019.43,44 brattle.com | 22Impact on Regional Electric Loads
Seven U.S. ISOs have reported load reductions of 3-10% between March and June due to COVID-19; IESO is
reporting an average 10% reduction in energy consumption.
Estimates of Load Reduction due to COVID-19 45,46,47,48,49,50,51,52
IESO reports: average 10% reduction in energy consumption and 9% reduction in peak demand due to closures; demand
Placeholder
Ontario
has recovered by 4% - 12% (segment dependent) since June 12, but residential energy consumption down 4%.
PJM reports: total daily energy use down 14% in the first half of May and 6% - 11% from May 16 to June 3; weekday peak
PJM
down 10% between late March and May 26.
CAISO
of 1.2% (up to 2.4% in peak hours). Energy prices down by about $10/MWh in DA and RT markets image
CAISO reports: weekday average load reductions of 3.3% (up to 6.1% in peak hours); weekend average load reductions
ERCOT ERCOT reports: no COVID-19 impacts on daily peak demand in June; weekly energy use down 1%.
MISO reports: load reduction of 5.1% in June (compared to 10.6% in May); change in load shape due to COVID-19 related
MISO
measures.
ISO-NE reports: system demand down 3-5% through early June; air conditioning load from recent warmer weather and limited
ISO-NE
expansion of re-opening policies resulting in higher loads than would be expected absent COVID-19 response.
NYISO reports: decline of overall energy use by 2-9% in June (varies by week); reduction in electric demand from commercial
NYISO
customers leading driver of overall reduced electricity consumption.
SPP SPP reports: a 7-10% reduction in load from the week of April 26 to mid-May.
EIA predicts 4.2% less electricity consumption in 2020 relative to 2019.
-7.0% decline for commercial sales
U.S. Overall -5.6% decline for industrial sales
-no decline for residential sales
EIA also forecasts 12.2% decrease in energy-related CO2 emissions in 2020 (relative to 2.8% in 2019).
brattle.com | 23Impact on Regional Electric Loads
Generally, U.S. ISOs have shown declining % load losses likely due to COVID-19 in June compared to prior
months; ERCOT continues to show an absolute increase in load due to overall market growth.
Weekly Average Hourly Load: March-June42
NYISO
ISO-NE PJM
Placeholder
-9%
-10%
-10%
-9%
-10%
-11%
-4%
-1% -7% image
-8% -8% -4%
MISO
CAISO ERCOT
-5% -10% -11% -5% Difference in
-3% -10% -3% -6% SPP 8% average June
4% 1% 0.4%
-8% 2020 load versus
0.0% -3% 1%
4-yr average of
Change in MISO same time
load reflected on
right hand axis
Note: Most demand reductions likely fall in peak hours, which accounts for approximately 50% of hours and the majority of energy brattle.com | 24
consumption, so the impact on peak hours is likely greater than the all-hours estimated decreases above.Impact on Regional Electric Loads
For reference, the methodology used for our U.S. ISO load reductions shows that IESO has experienced more
moderate load declines in the pandemic period compared to the rest of the U.S. ISOs, with June 2020 load
slightly exceeding average 2016-2019 load by 1%.
This may be underestimating the effect of COVID-19, e.g., if weather has caused 2020 loads to be higher than normal in the past
few months or there has been significant load growth over the past few years.
Weekly Average Hourly Load: March-June 53 Placeholder
image
Difference in average June
-4% -3% -1% +1% 2020 load versus 4-year
average of same time
brattle.com | 25
Source: IESO Data Directory.Impact on Regional Electric Load Shapes
The load shapes across ISOs have remained largely unchanged, except for a slight tendency to lose load in
afternoon hours, especially for CAISO, ISO-NE, and NYISO.
Except SPP and ERCOT, all of the ISOs have lower load levels in June 2020 versus June 2016-2019 average.
Daily Average Load Shapes For June 2020 vs. June 2019 (GWh)42
NYISO
Placeholder
PJM
image
ISO-NE
-4%
-1%
-4%
June 2020 vs. June Average (2016-2019)
+0.4%
CAISO -6% ERCOT
MISO -5% +1%
Duck shape more
pronounced than
prior year. SPP
brattle.com | 26Impact on Regional Electric Load Shapes
Qualitatively, IESO shows slightly higher afternoon peak and average load, unlike the general trend in U.S. ISOs.
IESO has experienced higher daily average load in June 2020 versus June 2016-2019 average.
IESO, themselves, report a decrease in peak demand of around 9%, when comparing to similar days pre-COVID-19.54
Daily Average Load Shapes For June (GWh) 53
Placeholder
June 2020 vs. 4 Year Average: +1%
image
IESO Market Demand
Source: IESO Data Directory.
brattle.com | 27Impact on Spot Electricity Pricing
Daily LMPs have fallen in every ISO in almost every month from February through June 2020, compared to
their past 2-year averages.
Not necessarily due to COVID-19, but this will strain viability for some coal and nuclear plants.
Day Ahead Average Monthly LMPs 42,53
Decline in 2020
LMP versus 2-year
-14%
-10%
-11%
-38%
-55%
-51%
-50%
-24%
-21%
-20%
-27%
-34%
-34%
-44%
-28%
-42%
-22%
-40%
-39%
-36% Placeholder
February
March
April
-55% -43% -34% -72%
image
historical average
(2018-2019) -37% -32% -7% -31% -16% -41% -36% -12% May
-32% -18% -10% -23% -14% -31% -30% +14% June
2018-2019
Average
2020
Average
Note: IESO data reflects HOEP data, without the global adjustment. Converted from Canadian dollars using a conversion rate brattle.com | 28
of 0.75, the annual average as of July 3rd.55 ERCOT North data reflects settlement point prices.Power Price Forwards in Last 3 Months
At U.S. ISO hubs, average on-peak forward prices fell On-Peak Power Price Forwards 56
MISO (Indiana Hub)
dramatically and universally by April for front months,
but as of June 15 have increased to within ~$0.50 of As of 2/1
February estimates; for 2021 and beyond, June 15
forwards increased above February levels. As of 4/1
Long-dated forwards for PJM West and MISO are slightly ($2 to
$3/MWh) above pre-COVID-19 levels
As of 6/15
+$0.38
Placeholder
+$1.96 +$1.11
Difference
between 2/1 and
6/15 Forwards
By contrast Ontario power forwards have stayed $3-$7/MWh image (per MWh)
below February levels for most months.
Ontario
PJM West
-$7.21 -$4.48 -$3.27
-$0.55 +$2.12 +$1.33
As of 2/1
As of 2/1
As of 4/1
As of 4/1 As of 6/15
As of 6/15
brattle.com | 29
Note: All prices reported in USD.Generation Impacts
Gas and coal generation in June 2020 are up by over 60% compared to May 2020 corresponding to seasonal warming plus
partial economic recovery; but compared to June 2019, gas is up around 20% and coal is down approximately 10%. *
EIA forecasts that coal’s share of U.S. electricity generation will decrease from 24% to 18% in 2020 compared to 2019 and then
increase to 21% in 2021.52
Generation by Fuel Type (GWh) 57,58,59,60,61,62,63,64 % Change in gas generation (June 2020 vs. June 2019)
Placeholder
PJM MISO ERCOT SPP
Other
Gas May 2020
+12% +112%
image
Coal vs.
Other Fossil Fuels +11% May 2019
Wind +13%
Other Renewables
Solar
Nuclear
Hydro
CAISO IESO NYISO ISO-NE
+100%
+217% +51%
+49%
Note: *Analysis includes PJM, MISO, SPP, CAISO, NYISO, ISO-NE, and IESO. brattle.com | 30Renewable Energy Long Term Development Plans
and Incentives
Slowing? Growing?
There is an increasing number of reported project Worldwide lockdowns and social distancing measures
delays/cancellations, equipment sourcing challenges, supply have triggered a historic decline in emissions,
chain and construction delays, and potential layoffs of increasing public appreciation for improved climate
employees.65,66,67 conditions.75
NYSERDA announced pause in NY 2020 offshore wind solicitation
(1,000-2,500 MW), but with no reductions in long term goals.68
Placeholder
IEA estimates an 8% global reduction in CO2 emissions relative
to 2019, the lowest emissions levels since 2010.76
New Jersey, New York, Pennsylvania, and Michigan had suspended
renewables construction during the pandemic, as part of non-essential
image
This is far above the annual reductions under the 2015 Clean
Power Plan, which aimed to reduce U.S. CO2 emissions 32%
construction stoppage.69,70,71,72 below 2005 levels by 2030.77
Unemployment claims data shows that the clean energy industries has Several states have affirmed continued commitments
lost over 594,300 jobs since the beginning of the pandemic (a 17% drop
in the workforce), and forecasts estimate up to 25% drop if no actions to to long term clean energy policies.
support the indutries.73 New York governor unveiled details of 21 large-scale solar, wind,
and energy storage projects (1,278 MW) across upstate NY in
Financing risk and uncertainty are compounding delays.74 March.78
While interest rates are down, lender credit standards are more The Virginia Clean Economy Act, signed in April, sets goals of
stringent. 5,200 MW of offshore wind by 2034 and 3,100 MW of storage by
Tax equity may be squeezed by lower taxable income among investors. 2035.79
Potential consolidation of small developers.
brattle.com | 31Potential Financial Consequences
Potential financial consequences (before or absent cost recovery mechanisms) for a utility with revenues of
$10 billion per year are shown below. Illustrative Utility Financial Consequences due to COVID-19
Pre-COVID National Average Bottom
In the near-term, COVID-19 revenue reductions will be smaller than Decile
(worst)
load reductions. experience
Placeholder
In the medium-term, residential non-payments and C&I bankruptcy Near-Term Med-Term Med Term
become more likely.
1 Total Load Reduction % -5% -5% -25%
Loss of cash flow and net income up to $500 million on average, or
$1.8 billion in a worst case.
2
3
4
Revenues image
Total Revenue Loss
Expenses, Variable = 33%
%
$ Mil.
$ Mil.
10,000
6,692
-2%
9,800
6,582
-8%
9,200
6,582
-30%
7,000
6,140
Average losses of 23% and 37% for cash flow and net income, respectively. 5 EBITDA $ Mil. 3,308 3,218 2,618 860
6 Interest $ Mil. 613 613 613 613
Worst case losses of 81% and 137% for cash flow and net income, 7 Income Taxes $ Mil. 516 491 323 (169)
respectively. 8 Cash Flow (FFO) $ Mil. 2,179 2,114 1,682 416
9 Depreciation $ Mil. 851 851 851 851
Erosion of credit metrics below those typically associated with 10 Net Income $ Mil. 1,328 1,263 831 (435)
11 Realized ROE % 10.0% 9.5% 6.3% -3.3%
investment grade utilities: 12 Debt $ Mil. 12,255 12,255 12,255 12,255
13 FFO/ Debt % 17.8% 17.3% 13.7% 3.4%
FFO/ Debt below 15%.
14 (EBITDA - Tax)/ Interest x 4.6x 4.5x 3.7x 1.7x
Interest coverage below 4x. 15 Change in Cash Flow % -3% -23% -81%
16 Change in Net Income % -5% -37% -133%
These shortfall amounts should be recoverable in subsequent periods, but
may require special financing and ratemaking, such as securitization. brattle.com | 32State Regulations Protecting Customers
All states have mandatory or voluntary suspensions of utility shutoffs as of late April, with 10 more becoming
mandatory in April compared to March.
Ontario, along with four other Canadian provinces, have mandatory service moratoriums; an additional 5 provinces have voluntary
moratoriums.
Utility Shutoff Regulations in Response to COVID-19 as of May 2080
United States
Placeholder
Canada
image
brattle.com | 33
Source: S&P Global Ratings.Utility Decoupling Mechanisms vs. Unemployment
Many utilities are pinning hopes on deferred revenues and decoupling, but this mechanism may become
stressed under COVID-19, if unemployment grows or persists.
Utility Decoupling Mechanisms vs. Initial Unemployment Claims
Revenue Decoupling Mechanisms 81
Placeholder
Unemployment Claims as Percent of Workforce as of June 20 82
image
Sources: S&P Global Market Intelligence, The Tax Foundation. brattle.com | 34Regulatory Responses to COVID-19
Nineteen U.S. states and three Canadian provinces have implemented deferral payment provisions to support
utilities’ recovery of COVID-19 related costs, allowing utilities to defer them for future recovery.
There are 19 states with pending COVID-19 responses, Decoupling Mechanisms Implemented 80
all with proceedings underway to assess potential cost
recovery solutions.
Placeholder
Regulatory assets to track or defer costs are the most image
U.S.
common cost recovery provision passed by states, so far.
Future proceedings will consider utility's request to recover these
assets. Canada
Five states* have clarified that customers are expected
to fully repay their bill once the moratorium is lifted.83
Customers can set up payment plans to repay the full amount
owed. Note: Alberta has both cost deferral and customer payment plans in place.
brattle.com | 35
Note: *States include New Hampshire, North Carolina, Ohio, Texas, and Colorado.Global Stock Prices
The broad market indices of the countries shown below have experienced deep declines since the COVID-19
pandemic, roughly proportional to the severity of their COVID-19 outbreaks and the timeliness/depth of their
lockdown.
E.g., Asian countries have relatively smaller losses, compared to some in the E.U.
The U.S. is an outlier with stock prices only a few percent below pre-pandemic levels.
National Exchange Stock Indices in 2020
PlaceholderDifferences between
image
1/7 and 6/15
1.1
1.05
1 U.S. (-5%)
0.95
South Korea (-7%)
China (-7%)
0.9 Japan (-9%)
0.85 Germany (-10%)
Sweden (-10%)
0.8 Canada (-11%)
0.75 Australia (-16%)
France (-20%)
0.7
U.K. (-20%)
0.65 Italy (-20%)
0.6 Spain (-24%)
1/7/2020 2/7/2020 3/7/2020 4/7/2020 5/7/2020 6/7/2020
brattle.com | 36
Source: Bloomberg, data as of June 15, 2020.Industry Composition of S&P 500
The S&P 500 is comprised of primarily IT, health care, finance, and consumer companies.
Energy and utilities account for slightly more than 6% of the total index.
Industry Composition of S&P 500
Placeholder
image
The large share of the U.S. index
coming from high tech and IT partly
explains its resilient stock market.
Other countries with more
dependence on energy (especially
oil), raw materials and exports, or
tourism are likely to be harder hit by
COVID-19.
Source: Bloomberg, data as of May 29, 2020.
brattle.com | 37Financial Impacts – Utility Stock Prices
COVID-19 impacts on the economy and uncertainty will affect utility cost of capital, liquidity, hedging,
perhaps capex programs, and IRP expansion timing or choices.
Through the beginning of April, utility stock prices generally followed the overall market trends quite tightly,
but more recently have been lagging behind the S&P 500.
Placeholder
Since the beginning of April, the utility index price has gained only 8%, while the S&P improved 25% by June 30 -- despite utilities
having less reported difficulty hitting earnings targets and offering attractive, nearly fixed dividends.
May suggest some investors question utilities’ ability to recover lost revenues. image
Historical Stock Prices Utility Index vs. S&P 500 Historical Stock Prices
Utility Index vs. S&P 500 Historical Stock Prices
1.4 1.2 +25%
S&P 500
1.2 1.0
1.0
0.8 +8%
0.8 Utility Index
0.6
0.6
0.4
0.4
0.2 0.2
0.0 0.0
Sep-19 Oct-19 Nov-19 Dec-19 Jan-20 Feb-20 Mar-20 Apr-20 May-20 Jun-20 Apr-20 May-20 Jun-20
Source: Bloomberg, data as of June 30, 2020. brattle.com | 38
Note: S&P Utility Index includes electric, gas, and water utilities.Market Volatility
Volatility has steadily declined from its peak of 82.69 in mid-March, but remains elevated at about the same
average as in the Great Financial Crisis of 2008-09.
Investors require higher equity returns during times of heightened uncertainty.
VIX Index Levels in 2020
90 *3/16:
80
70
White
House
releases
3/26:
Stimulus
package 4/30:
Placeholder
6/11: VIX
climbs back up,
image
new social passed Department of given "Second
60 distancing Labor releases Wave"
50 protocol unemployment expectations
data
40 Average: 32.87
30
4/24: President
20
approves new
10 stimulus
package
0
1/2
1/9
2/6
3/5
4/2
4/9
5/7
6/4
1/16
1/23
1/30
2/13
2/20
2/27
3/12
3/19
3/26
4/16
4/23
4/30
5/14
5/21
5/28
6/11
6/18
6/25
Dot Com, 9/11 Hurricane Katrina Financial Crisis Post-Crisis Modern Era COVID-19 COVID-19 COVID-19 COVID-19
2000 - 2002 2003 -2006 2008-2009 2009-2012 2013-2019 Mar-20 Apr-20 May-20 Jun-20
VIX Index Average 25.4 14.9 35.1 22.7 14.9 57.7 41.5 30.9 31.1
Utilities as % of S&P 500 3.8% 3.1% 4.4% 3.5% 3.4% 3.6% 3.3% 3.2% 3.1%
Source: Bloomberg, data as of June 30, 2020. brattle.com | 39
Note: For context, during the Great Recession, VIX reached a peak of 80.86 on November 20, 2008.Electric Utility Betas
Four-month daily betas have increased across U.S. electric, gas, and water utilities from January 31 to May 31,
more than double their January 31 average.
Similar increases in utility betas occurred during the Global Financial Crisis.
These increases in beta would call for 300-400 bps increase in ROE under CAPM.
1.4
Electric Utility 4-Month Daily Betas
January 31 Average: 0.51*Placeholder
Utility 4-Month Daily Beta Averages
image
May 31 Average: 1.03* January May Impact on ROE
1.2
Difference
1.0
31 31 (Assumed 8% MRP)
0.8 Electric 0.51 1.03 0.52 +4.1%
0.6 Gas 0.55 1.11 0.55 +4.4%
0.4 Water 0.59 1.01 0.42 +3.3%
0.2
0.0 It is possible these changes are transitory, but
there are structural reasons to expect them to
FirstEnergy Corp.
Avista Corp.
IDACORP Inc.
El Paso Electric
Evergy Inc.
Eversource Energy
ALLETE
DTE Energy
Duke Energy
Pinnacle West Capital
Otter Tail Corp.
Amer. Elec. Power
Ameren Corp.
PNM Resources
Edison Int'l
Alliant Energy
Sempra Energy
Black Hills
OGE Energy
AVANGRID Inc.
CenterPoint Energy
WEC Energy Group
Unitil Corp.
Public Serv. Enterprise
CMS Energy Corp.
Xcel Energy Inc.
NorthWestern Corp.
Portland General
Entergy Corp.
Exelon Corp.
MGE Energy
PPL Corp.
Southern Co.
NextEra Energy
Dominion Energy
Hawaiian Elec.
Consol. Edison
persist, esp. utility funded moratoriums on
shutting off delinquent accounts, and increased
utility exposure to macro recovery of the
commercial sectors of the economy.
Source: Bloomberg, data as of May 31, 2020. brattle.com | 40
Note: *PG&E is not included in sample average due to bankruptcy restructuring.Treasury Yields
U.S. treasury yields are at historic lows, with most of the drop in the term structure happening in March, then
only moving up a few basis points.
10-year yields in June reached a high of 0.91%, averaging 0.73% and remaining under 1% throughout the month.
Market Yields for Treasury Bonds 84
Placeholder
January through June 2020
image
Yield
brattle.com | 41
Source: U.S. Department of the Treasury, data as of June 30, 2020.U.S. Required Returns
Expected U.S. Market Returns (S&P 500)
The current implied return expected for
the market as a whole is about at 2019
levels. DDM-implied
Market Return
But the composition is very different than Placeholder Market Risk
in the past, with a higher MRP and a lower
risk-free rate. image Premium
Implied returns rose steadily from the beginning Risk-Free
of 2020 through March, but declined in April and Rate
May.
Ten-year government bond rates are about 140
bps lower than the 2019 average, while the 8.1%
MRP is about 100 bps higher, which results in a Source: Bloomberg, data as of June 18, 2020.
Notes: Market return estimated by Bloomberg with a forward-looking Dividend Discount Model.
market return that is comparable to the 2019 Risk-free rate is based on 10-year U.S. Treasury yield. Return based at approximately 70% equity capital structure.
average of 9.2%.
brattle.com | 42Canadian Returns
Summary Statistics 85,86,87
Canadian stocks have experienced some of the highest volatility in its market, and is down Canada
around 11% since the beginning of 2020. Death Rates per 100K People
23
(as of June 18, 2020)
Canada’s social distancing policy varies across the country, but began generally around March 12 with gathering Lock Down Date
3/12
restrictions but limited Provincial lockdowns.86 (Dates may vary based on geography)
YoY Decline in GDP
Canada’s index is comprised of primarily materials and industrials companies, but the index has significantly more (as of April 2020)
-6.2%
energy & utility companies than the U.S., with more than 20% of the overall index made up of energy & utility.
This may make it more sensitive (indirectly) to COVID-19 than its low infection levels would suggest. Placeholder
Total Decline in Stock Price
(January 7 - June 15)
YoY Change in Govt Bond Yield
-10.5%
-0.9%
image
(since June 14, 2019)
Expected Canadian Market Returns S&P/TSX Composite Index YoY Change in MRP
1.3%
(since June 14, 2019)
DDM-implied
Market Return
Market Risk
Premium
Risk-Free
Rate
Source: Bloomberg, data as of June 18, 2020.
Note: Market return estimated by Bloomberg with a forward-looking Dividend Discount Model. Risk-free rate is based 229 Members brattle.com | 43
on 10-year Bank of Canada Treasury yield.Credit Rating Agency Actions
On April 2, S&P Global Ratings downgraded the outlook for North American investor-owned utilities from
“stable” to “negative” due to COVID-19 risk.88
Since the beginning of March, S&P has downgraded only 3 electric utilities — for inadequate coverage ratios compounded by the
uncertainty and liquidity risks from the pandemic.89
S&P Credit Downgrades in March – June 2020
Placeholder
image
Company Date Downgrade
PNM Resources, Inc. 4/6/2020 Action: Downgrade from "BBB+" to "BBB"
Texas-New Mexico Power Company 4/6/2020 Action: Downgrade from "A-" to "BBB+"
ALLETE 4/22/2020 Action: Downgrade from "BBB+" to "BBB"
On April 22, Moody’s affirmed “stable” outlook for the U.S. public power sector, but cautioned that public
power companies will likely have restricted liquidity and lessened coverage ratios for the next two years.90
Canada has been recently downgraded by Fitch Ratings from AAA to AA+ due to “expanded general
government deficit” and expectations of “higher public debt ratios” resulting from COVID-19 pandemic.91
brattle.com | 44Key Takeaways
Placeholder
imageA Worrisome Resurgence of U.S. COVID-19
U.S. policies of social distancing helped to “flatten the curve” by May, relative to hospital
capacities, but relaxation of those controls has allowed a resurgence.
Now, COVID-19 may not be amenable to ready control with testing, incremental quarantining, and
contact tracing.
This will impair the ability to reopen the economy. Placeholder
image
Various forecasts show a 2020 year-over-year GDP loss of around 4-7%, with a rebound to
around +5-6% in 2021.
However, the CBO forecasts that unemployment rates will remain elevated for many years to come.
Millions of Americans are delaying credit payments, which may be a harbinger of further revenue losses
or difficulties with deferred cost recoveries for utilities.
brattle.com | 46Oil and Gas May Affect Canada
The direct effects of COVID-19 may be not as important to the Canadian economy as the
impact of the pandemic on oil, gas, and natural resource (export) markets.
Oil futures are reflecting a long disruption to the demand and prices—not reaching pre-COVID-19 levels
of even $50/bbl until 2025-2028.
Placeholder
U.S. natural gas demand and prices have remained fairly consistent with normal seasonal declines,
showing no strong or obvious COVID-19 effects.
image
Spot prices have been relatively flat and forwards depressed in front months, mostly due to lower export volumes
and high storage levels.
Worldwide, LNG netback spot prices to Asia and Europe are below Henry Hub spot prices for gas, causing an
estimated 20 US LNG cargoes for June to be cancelled, and more for July and August. This is equivalent to 5-10%
of U.S. demand.
brattle.com | 47Electricity Loads Returning to Normal
The drop in average electric loads due to COVID-19 seems to have peaked in April and May, and
in June is now about 3% below normal (past average) levels.
Residential load is estimated to be up about 8% so the overall load reduction is concentrated in C&I
customers, which would have to have declined about 10-15% due to COVID-19 to explain the overall
reduction.
Placeholder
Month-on-month average ISO load shapes show only modest overall changes, with a slight tendency to lose
load in afternoon hours. image
Specific peaks (not monthly averages) may have greater reductions, per ISO reports.
Gas- and coal-fired generation in June 2020 are up by over 60% compared to May 2020
corresponding to seasonal warming plus partial economic recovery; but compared to June
2019, gas-fired generation is up around 20% and coal is down approximately 10%.*
Forward prices for 2021 and beyond are mostly a bit above pre-COVID-19 levels.
Note: *Analysis includes PJM, MISO, SPP, CAISO, NYISO, ISO-NE, and IESO. brattle.com | 48Utility Risks Elevated
Initial utility revenue reductions should be smaller in percentage terms than load losses, because
the residential increases produce corresponding revenue increases (under volumetric rates) while
the much larger lost C&I load is partly softened in revenues by demand charges.
But the losses from moratoriums on shutoffs for non-payment may grow to levels difficult to
recover, and some businesses may not be viable at reduced traffic,Placeholder
so very significant cost recovery
image
shortfalls could arise despite notional deferral and decoupling mechanisms.
It is likely that the cost of equity for utilities is up due to these heightened cost recovery risks,
reduced and more economy-sensitive growth, and altered market risk characteristics:
The U.S. Market Volatility Index (VIX) is elevated to about the average level seen in the 2008/09 Great Financial
Crisis, causing the Market Risk Premium to be up considerably.
Utility stock volatility has been more correlated with, and actually larger than, the U.S. market as a whole, causing
betas to go up.
brattle.com | 49Sources
Placeholder
imageSources
1: Daily Related Deaths: “Coronavirus Locations: COVID-19 Map by County and State”, USAFACTS, July 3, 2020. Accessed July 4, 2020,
https://usafacts.org/visualizations/coronavirus-covid-19-spread-map.
2: Institute for Health Metrics and Evaluation. “COVID-19 Projections.” Accessed July 3, 2020. https://covid19.healthdata.org/projections.
3: “Download today’s data on the geographic distribution of COVID-19 cases worldwide”, European Centre for Disease Prevention and Control, July 5, 2020, data accessed July 5,
2020, https://www.ecdc.europa.eu/en/publications-data/download-todays-data-geographic-distribution-covid-19-cases-worldwide.
4: Natalie Croker et al., “The US has 4% of the World’s Population but 25% of its Coronavirus cases”, CNNHealth, June 30, 2020. Accessed July 3, 2020,
https://www.cnn.com/2020/06/30/health/us-coronavirus-toll-in-numbers-june-trnd/index.html
Placeholder
5: Lambert, Lance, “Real unemployment rate soars past 20% - and the U.S. has now lost 26.5 million jobs”, Fortune, April 23, 2020. https://fortune.com/2020/04/23/us-
unemployment-rate-numbers-claims-this-week-total-job-losses-april-23-2020-benefits-claims/.
6: Goldman Sachs, “The Way Forward”, June 21, 2020, accessed July 1, 2020.
image
7: Congressional Budget Office, “An Update to the Economic Outlook: 2020 to 2030”, July 2020, https://www.cbo.gov/system/files/2020-07/56442-CBO-update-economic-
outlook.pdf.
8: Smialek, Jeanna, “Fed Leaves Rates Unchanged and Projects Years of High Unemployment”, June 10, 2020, https://www.nytimes.com/2020/06/10/business/economy/federal-
reserve-economy-
coronavirus.html#:~:text=The%20Fed%20is%20projecting%20a,by%205%20percent%20in%202021.&text=Unemployment%20rocketed%20to%2014.7%20percent,to%2013.3%20p
ercent%20in%20May.
9: Strategy&, PwC, “COVID-19 Pandemic and the US Financial Service Sector”, April 27, 2020.
10: AnnMaria Andriotis, “Americans Skip Millions of Loan Payments as Coronavirus Takes Economic Toll”, The Wall Street Journal, June 18, 2020. Accessed July 1, 2020,
https://www.wsj.com/articles/americans-skip-millions-of-loan-payments-as-coronavirus-takes-economic-toll-11592472601.
11: Trading Economics, United States Initial Jobless Claims, U.S. Department of Labor, https://tradingeconomics.com/united-states/jobless-claims.
12: Jobless claims graphic: “Unemployment Insurance Weekly Claims Data”, United State Department of Labor, Data accessed July 1, 2020,
https://oui.doleta.gov/unemploy/claims.asp.
13: Bureau of Labor Statistics, “The Employment Situation – June 2020”, July 2, 2020, accessed July 5, 2020, https://www.bls.gov/news.release/pdf/empsit.pdf.
brattle.com | 51Sources
14: S&P Global Market Intelligence, Oil & Refined Products Summary, February 1, 2020 through July 1, 2020. Accessed July 3, 2020,
https://platform.marketintelligence.spglobal.com/web/client?auth=inherit#markets/OilSummary.
15: Grant Smith and Julian Lee, “OPEC Cuts Output to Lowest Since 1991 as Virus Slams Oil Demand,” Bloomberg, July 1, 2020. Accessed July 3, 2020,
https://www.bloomberg.com/news/articles/2020-07-01/opec-cuts-output-to-lowest-since-1991-as-virus-slams-oil-demand.
16: U.S. Energy Information Administration, “Weekly Petroleum Status Report,” Week Ending July 3, 2020. Accessed July 8, 2020, https://www.eia.gov/petroleum/supply/weekly/.
17: Alex Lawler, “Oil falls below $43 a barrel on virus fears, still heads for weekly gain,” Reuters, July 2, 2020. Accessed July 3, 2020, https://www.reuters.com/article/us-global-
oil/oil-falls-below-43-bbl-on-virus-fears-still-heads-for-weekly-gain-idUSKBN244030.
Placeholder
18: Alex Lawler, Ahmad Ghaddar, and Olesya Astakhova, “OPEC+ panel meeting next week will advise on policy, not decide: sources,” Reuters, June 12, 2020. Accessed July 3, 2020,
https://www.reuters.com/article/us-oil-opec/opec-panel-meeting-next-week-will-advise-on-policy-not-decide-sources-idUSKBN23J1X4.
19: Matt Egan, “China is storing an epic amount of oil at sea. Here’s why,” CNN Business, July 1, 2020. Accessed July 3, 2020, https://www.cnn.com/2020/07/01/investing/oil-prices-
china-imports/index.html.
20: S&P Global Market Intelligence, Futures, February 1, 2020, May 1, 2020 and July 1, 2020. Accessed July 2, 2020,
image
https://platform.marketintelligence.spglobal.com/web/client?auth=inherit#markets/commoditiesChart.
21: Goldman Sachs, “The Future of Refining: More Cautious on cycle in the ‘Age of Consolidation,’” July 2, 2020.
22: Rebecca Elliott, “Fracking Trailblazer Chesapeake Energy Files for Bankruptcy,” The Wall Street Journal, June 28, 2020. Accessed July 3, 2020,
https://www.wsj.com/articles/fracking-trailblazer-chesapeake-energy-files-for-bankruptcy-11593374287.
23: Christopher M. Matthews, “Exxon Mobil Resists Write-Downs as Oil, Gas Prices Plummet,” The Wall Street Journal, June 30, 2020. Accessed July 3, 2020,
https://www.wsj.com/articles/exxon-mobil-resists-write-downs-as-oil-gas-prices-plummet-11593521685.
24: “Mobility Trends,” Apple Inc. Accessed July 2, 2020, https://www.apple.com/covid19/mobility.
25: “Weekly Retail Gasoline and Diesel Prices,” U.S. Energy Information Administration. Accessed July 2, 2020, https://www.eia.gov/dnav/pet/pet_pri_gnd_dcus_nus_w.htm.
26: “Natural Gas Storage Dashboard,” U.S. Energy Information Administration. Accessed July 2, 2020, https://www.eia.gov/naturalgas/storage/dashboard/.
27: “Weekly Working Gas in Underground Storage”, U.S. Energy Information Administration. Accessed July 3, 2020, https://www.eia.gov/dnav/ng/ng_stor_wkly_s1_w.htm.
28: Gas Infrastructure Europe, “AGSI+ Aggregated Gas Storage Inventory,” accessed July 7, 2020, https://agsi.gie.eu/#/.
brattle.com | 52Sources
29: “China lifted underground gas storage capacity to 10.2 bcm in 2019 – state TV,” Reuters, January 23, 2020. Accessed July 3, 2020, https://www.reuters.com/article/china-gas-
storage-idAFL4N29S2CA.
30: “Country Analysis Brief: Japan,” U.S. Energy Information Administration, February 2, 2017, p. 11. Accessed July 3, 2020,
https://www.eia.gov/international/content/analysis/countries_long/Japan/japan.pdf.
31: ICIS Heren LNG Edge database. Accessed July 1, 2020.
32: Victoria Zaretskaya, “U.S. liquefied natural gas exports have declined by more than half so far in 2020,” U.S. Energy Information Administration, June 23, 2020. Accessed June
26, 2020, https://www.eia.gov/todayinenergy/detail.php?id=44196.
Placeholder
33: Corey Paul, “Gas prices will fall as US LNG shut-ins test storage levels, Goldman Sachs says,” S&P Global Market Intelligence, June 25, 2020. Accessed July 3, 2020,
https://platform.marketintelligence.spglobal.com/web/client?auth=inherit#news/article?id=59204291&KeyProductLinkType=23.
34: Harry Weber et al., “US LNG feedgas drop may mean higher than reported June cargo cancellations,” S&P Global Platts, June 15, 2020. Accessed June 26, 2020,
image
https://www.spglobal.com/platts/en/market-insights/latest-news/natural-gas/061520-us-lng-feedgas-drop-may-mean-higher-than-reported-june-cargo-cancellations.
35: Aaron Sheldrick, “China could top Japan’s LNG imports in 2020 as coronavirus cuts demand,” Reuters, June 18, 2020. Accessed June 26, 2020,
https://www.reuters.com/article/china-japan-lng/china-could-top-japans-lng-imports-in-2020-as-coronavirus-cuts-demand-idUSL4N2DT1I0.
36: Harry Weber, et al., “US LNG feedgas drop may mean higher than reported June cargo cancellations,” S&P Global Platts, June 15, 2020, accessed July 5, 2020,
https://www.spglobal.com/platts/en/market-insights/latest-news/natural-gas/061520-us-lng-feedgas-drop-may-mean-higher-than-reported-june-cargo-cancellations.
37: S&P Global Market Intelligence, Natural Gas Forwards & Futures, February 1, 2020, April 30, 2020, and July 1, 2020. Accessed July 2, 2020,
https://platform.marketintelligence.spglobal.com/web/client?auth=inherit#markets/commoditiesChart.
38: S&P Global Market Intelligence, Day-Ahead Natural Gas Prices - Daily, February 1, 2020 through July 1, 2020. Accessed, July 2, 2020,
https://platform.marketintelligence.spglobal.com/web/client?auth=inherit#markets/commoditiesChart.
39: National Oceanic and Atmospheric Administration, National Weather Service Climate Prediction Center, “U.S. Daily Temperature Analyses,” Accessed July 2, 2020,
https://www.cpc.ncep.noaa.gov/products/tanal/temp_analyses.php.
40: Environment and Climate Change Canada, Real-Time Weather Statistics Maps, Government of Canada. Accessed July 5, 2020,
https://collaboration.cmc.ec.gc.ca/cmc/wtoftpa/www/.
brattle.com | 53Sources
41: “Stay-at-home orders led to less commercial and industrial electricity use in April,” U.S. Energy Information Administration, June 30, 2020. Accessed July 1, 2020,
https://www.eia.gov/todayinenergy/detail.php?id=44276&src=email.
42: Velocity Suite, ABB Inc. Accessed July 2, 2020.
43: S&P Global Market Intelligence, Monthly Generation, February 2020, and March 2020. Accessed July 3, 2020,
https://platform.marketintelligence.spglobal.com/web/client?auth=inherit#industry/monthlyGeneration.
44: U.S. Energy Information Administration, Electric Power Monthly, “Table 1.1 Net Generation by Energy Source: Total (All Sectors), 2010-January 2020”, March 24, 2020.
Accessed July 3, 2020. https://www.eia.gov/electricity/monthly/epm_table_grapher.php?t=epmt_1_01.
Placeholder
45: “PJM Coronavirus (COVID-19) Information,” PJM Interconnection, LLC, June 12, 2020. Accessed July 3, 2020, https://www.pjm.com/about-pjm/newsroom/info-connection.aspx.
46: California ISO, “COVID-19 Impacts to California ISO Load & Markets: March 17 – June 21, 2020,” June 29, 2020. Accessed July 3, 2020,
http://www.caiso.com/Documents/COVID-19-Impacts-ISOLoadForecast-Presentation.pdf.
image
47: Calvin Opheim and Sarah Parody, “COVID-19 Load Impact Analysis,” June 30, 2020. Accessed July 3, 2020, http://www.ercot.com/content/wcm/lists/200201/ERCOT_COVID-
19_Analysis_June_30.pdf.
48: Midcontinent Independent System Operator, “COVID-19 Impact to Load & Outage Coordination,” June 22, 2020. Accessed July 3, 2020,
https://cdn.misoenergy.org/COVID%2019%20Impacts%20to%20MISO%20Load%20and%20Outage_as%20of%20June20454548.pdf.
49: ISO New England, “Estimated Impacts of COVID-19 on ISO New England Demand,” June 30, 2020. Accessed July 3, 2020, https://www.iso-ne.com/static-
assets/documents/2020/06/isone-covid-19-update-06-30-2020.pdf.
50: New York Independent System Operator, “COVID-19 Related Updates.” Accessed April 28, 2020, https://www.nyiso.com/covid.
51: Southwest Power Pool, Inc., “SPP's COVID-19 Response - May 14, 2020,” Southwest Power Pool, Inc. press release, May 14, 2020. Accessed July 3, 2020,
https://spp.org/newsroom/covid-19/spps-covid-19-response-may-14-2020/.
52: U.S. Energy Information Administration, “Short-Term Energy Outlook,” July 7, 2020. Accessed July 7, 2020, https://www.eia.gov/outlooks/steo/.
53: “Data Directory,” Independent Electricity System Operator. Accessed July 3, 2020, http://www.ieso.ca/en/Power-Data/Data-Directory.
54: “Forecasting and Planning Update” Webinar, July 6, 2020, IESO, Accessed July 7, 2020, http://ieso.ca/en/Sector-Participants/Engagement-Initiatives/Overview/Public-
Information-Sessions
brattle.com | 54Sources
55: “Currency Converter”, Bank of Canada, data as of July 3, 2020, accessed July 3, 2020, https://www.bankofcanada.ca/rates/exchange/currency-
converter/?lookupPage=lookup_currency_converter_2017.php&startRange=2010-07-
05&rangeType=range&selectToFrom=to&convert=1.00&seriesFrom=Canadian+dollar&seriesTo%5B%5D=FXUSDCAD&rangeValue=1.y&dFrom=&dTo=&submit_button=Convert.
56: S&P Global Market Intelligence, Peak Power Price Forwards, June 15, 2020. Accessed July 2, 2020,
https://platform.marketintelligence.spglobal.com/web/client?auth=inherit#markets/commoditiesChart.
57: “Generation by Fuel Type,” PJM Interconnection, LLC. Accessed July 2, 2020, https://dataminer2.pjm.com/feed/gen_by_fuel.
58: “Generational Fuel Mix (xlsx),” Midcontinent Independent System Operator. Accessed July 2, 2020, https://www.misoenergy.org/markets-and-operations/real-time--market-
Placeholder
data/market-reports/#nt=%2FMarketReportType%3ASummary%2FMarketReportName%3AGeneration%20Fuel%20Mix%20(xlsx)&t=10&p=3&s=MarketReportPublished&sd=desc.
59: “Fuel Mix Report: 2020,” Electric Reliability Council of Texas. Accessed July 2, 2020, http://www.ercot.com/gridinfo/generation.
60. “Ontario’s Energy Capacity,” Independent Electricity System Operator. Accessed July 2, 2020, http://www.ieso.ca/en/Learn/Ontario-Supply-Mix/Ontario-Energy-Capacity.
image
61: “GenMixYTD.” Southwest Power Pool, Inc . Accessed July 2, 2020, https://marketplace.spp.org/pages/generation-mix-historical.
62: “Supply,” California Independent System Operator. Accessed July 2 2020. http://www.caiso.com/TodaysOutlook/Pages/Supply.aspx.
63. The New York Independent System Operator Inc. 2020. “Real-Time Fuel Mix.” Accessed July 2, 2020, http://mis.nyiso.com/public/P-63list.htm.
64. Independent System Operator New England. 2020. “Daily Generation by Fuel Type.” Accessed July 2, 2020, https://www.iso-ne.com/isoexpress/web/reports/operations/-
/tree/daily-gen-fuel-type.
65: American Wind Energy Association, “Wind Powers America: First Quarter 2020 Report,” April 30, 2020. Accessed May 5, 2020, https://www.awea.org/resources/publications-
and-reports/market-reports/2020-u-s-wind-industry-market-reports-(1).
66: Abigail Ross Hopper, “Survey Findings: Things are bad and getting worse,” Solar Energy Industries Association, March 26, 2020. Accessed May 5, 2020,
https://www.seia.org/blog/survey-findings-things-are-badB-and-getting-worse.
67: Energy Storage Association, “Impacts of COVID-19 on the Energy Storage Industry,” https://energystorage.org/wp/wp-content/uploads/2020/04/2020-COVID-report_FINAL-
2.pdf.
68: Iulia Gheorghiu, “New York hits the brakes on 2.5 GW solicitation of offshore wind due to COVID-19,” Utility Dive, April 24, 2020, https://www.utilitydive.com/news/new-york-
hits-the-brakes-on-25-gw-solicitation-of-offshore-wind-due-to-cov/576712/.
brattle.com | 55You can also read


