MASTER THESIS IMPACT OF THE ELECTRIC VEHICLE ON THE ELECTRIC SYSTEM MÉLAINE ROUSSELLE - DIVA
←
→
Page content transcription
If your browser does not render page correctly, please read the page content below

Master Thesis
                        EG201X

Impact of the Electric Vehicle on the Electric System

                Mélaine ROUSSELLE

                          2009

                    Supervisors at RTE

                     Vincent Lefieux

                    Emmanuel Neau

                    Thibault Prévost

                    Supervisor at KTH

                     Lennart Söder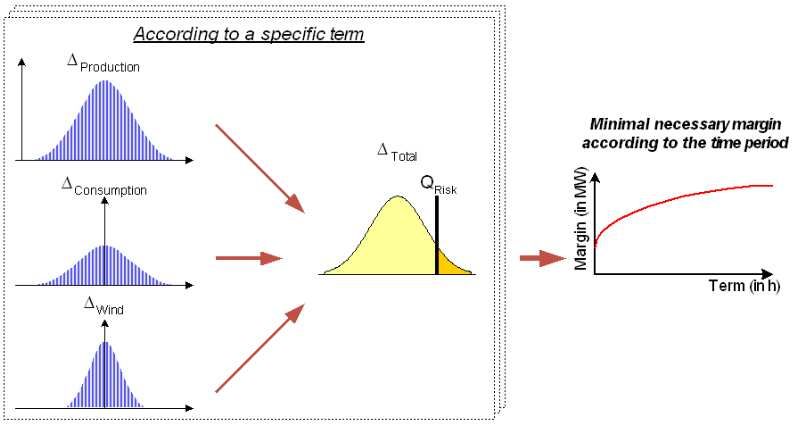
Impact of the Electric Vehicle on the Electric System                       July-November 2009

Since few years the electric vehicles draw the attention. The battery technology’s continual
improvements and incentives from the authorities guarantee them an assured future with a fast
and considerable development. Some figures are forecasted by 2020: one or two millions
electric vehicles. This could mean a huge increase in electricity consumption. The
consequences on the total energy consumption have already been analyzed, however studies
on the impact on the load curve remain scarce. In this context, this master thesis focuses on
the impact of the electric vehicles’ charge on the French load curve and the production and
consumption balancing. The grid issues are not studied here.
The first part presents the state of the art in battery and electric vehicle technology, as well as
battery charge’s characteristics. Besides the French traffic data are studied, in order to build
the most realistic model as possible.
The second part explains the principle of the modeling. A general and flexible model for the
French fleet is built. This model can simulate the times of charge of a vehicle, and the state of
charge of its battery, in order to get a total load curve for several days for an electric fleet.
And finally, the different load curves are analyzed as well as their impacts on the electric
balancing system and the possible solutions to lower these impacts. As the peak load for the
electric vehicles’ charge corresponds to the total consumption peak in the evening according
to the most probable scenario, services have to be implemented to reduce or put back the
overload due to the electric vehicles. Those services (tariff signals regulations, battery
management system, cut-off injunctions) have been tested. A model for grid injections during
peak hours has also been developed, in order to help the electric system, and erase the electric
vehicles’ impact on the load curve. Studies for the optimum load, the reserves and the margins
are also suggested as well as other possible studies, such as EV’s carbon footprint.
The reflections and strategies developed in this master thesis don’t reflect RTE’s policy and
don’t commit the company.

Mélaine Rousselle - RTE-DMA – KTH                                                                1
Impact of the Electric Vehicle on the Electric System                    July-November 2009

I would like to thank my supervisors at RTE, Emmanuel Neau, Thibault Prévost and Vincent
Lefieux for their patience during the development of the master thesis subject from a distance,
between Sweden and France, and for trusting me to carry out this study. I thank them for their
valued help and advice. I am specially thankful to Emmanuel for his guidance and for all the
time he devoted to answering to my questions.

I wish to thank the entire group for welcoming me and integrating me inside the team.

Finally, I am thankful to my examiner and supervisor at KTH, Lennart Söder who agreed to
supervise and review my work.

Mélaine Rousselle - RTE-DMA – KTH                                                            2
Impact of the Electric Vehicle on the Electric System                                                       July-November 2009

ABSTRACT .............................................................................................................................. 1
ACKNOWLEDGMENTS ....................................................................................................... 2
LIST OF FIGURES ................................................................................................................. 5
LIST OF TABLES ................................................................................................................... 7
GLOSSARY AND ABBREVIATIONS.................................................................................. 8
1.      INTRODUCTION............................................................................................................ 9
     1.1.      PRESENTATION OF RTE............................................................................................... 9
     1.2.      BACKGROUND ............................................................................................................. 9
     1.3.      PURPOSE AND AIM .................................................................................................... 10
2.      STATE OF THE ART AND TRAFFIC DATA........................................................... 11
     2.1.    ELECTRIC VEHICLE’S AND PLUG-IN HYBRID VEHICLE’S CONCEPT ........................... 11
     2.2.    BATTERY ................................................................................................................... 12
        2.2.1.   State of the Art.................................................................................................. 12
        2.2.2.   Lithium Batteries’ Principle............................................................................. 13
        2.2.3.   Charge of a Lithium Battery............................................................................. 15
     2.3.    CHARGE FACILITIES .................................................................................................. 17
     2.4.    VEHICLES CHARACTERISTICS .................................................................................... 18
     2.5.    TRAFFIC DATA .......................................................................................................... 20
3.      MODELLING OF A PEVS’ FLEET ........................................................................... 23
     3.1.    CHARACTERISTICS OF THE FLEET’S MODEL .............................................................. 23
     3.2.    SIMULATION PROCESS ............................................................................................... 26
        3.2.1.   Principle ........................................................................................................... 26
        3.2.2.   Changes of State............................................................................................... 27
        3.2.3.   Algorithm.......................................................................................................... 29
     3.3.    MONTE CARLO ANALYSIS ......................................................................................... 31
     3.4.    EXTRAPOLATION ....................................................................................................... 33
     3.5.    REFERENCE SCENARIO .............................................................................................. 34
     3.6.    SENSITIVITY ANALYSIS ............................................................................................. 37
        3.6.1.   Impact of the Battery’s Initial State of Charge ................................................ 37
        3.6.2.   Impact of the EV/PHEV Distribution ............................................................... 40
        3.6.3.   Impact of the CV/PV Distribution .................................................................... 40
        3.6.4.   Impact of the Temperature ............................................................................... 41
        3.6.5.   Impact of the Available Points of Charge Distribution.................................... 42
        3.6.6.   Assumption of a Systematic Charge ................................................................. 46
        3.6.7.   Battery Exchange ............................................................................................. 48
        3.6.8.   Impact of the Other Parameters....................................................................... 49
        3.6.9.   Assumptions’ Impact Recap and Retained Reference Scenario....................... 49
     3.7.    PEVS’ “NATURAL” CHARGE CURVE ........................................................................ 50
4.      IMPACTS ON THE FRENCH ELECTRIC SYSTEM.............................................. 52
     4.1.    FUTURE “NATURAL” CONSUMPTION CURVES ........................................................... 52
        4.1.1.   Background ...................................................................................................... 52

Mélaine Rousselle - RTE-DMA – KTH                                                                                                        3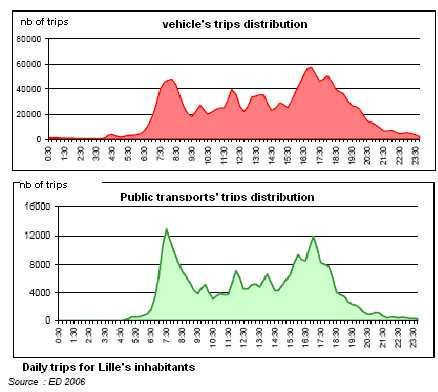
Impact of the Electric Vehicle on the Electric System                                                        July-November 2009

        4.1.2.    Consumption by 2015, 2020 and 2025............................................................. 53
        4.1.3.    Consumption with PEVs................................................................................... 53
     4.2.    TARIFF SIGNALS ........................................................................................................ 57
        4.2.1.    Tariff Signals’ Principle................................................................................... 57
        4.2.2.    Load Curves and Total Consumption Curves with Tariff Signals ................... 58
     4.3.    BATTERY MANAGEMENT SYSTEM............................................................................. 61
        4.3.1.    Battery Management System Principle ............................................................ 61
        4.3.2.    Load Curves and Total Consumption Curves with BMS.................................. 63
     4.4.    BATTERY MANAGEMENT SYSTEM AND TARIFF SIGNAL ............................................ 68
     4.5.    INJECTIONS INTO THE GRID ....................................................................................... 71
     4.6.    OTHER SOLUTIONS .................................................................................................... 75
     4.7.    EXTREME SCENARIOS................................................................................................ 77
        4.7.1.    The Worst Case ................................................................................................ 77
        4.7.2.    The Theoretical Optimum Cases ...................................................................... 78
     4.8.    RESERVES AND MARGINS .......................................................................................... 82
        4.8.1.    Reserves............................................................................................................ 82
        4.8.2.    Margins ............................................................................................................ 84
5.      CO2 FOOTPRINT.......................................................................................................... 86
CONCLUSIONS..................................................................................................................... 89
     MAIN ASPECTS OF THE STUDY .............................................................................................. 89
     PERSPECTIVES ....................................................................................................................... 90
APPENDIX ............................................................................................................................. 91

Mélaine Rousselle - RTE-DMA – KTH                                                                                                         4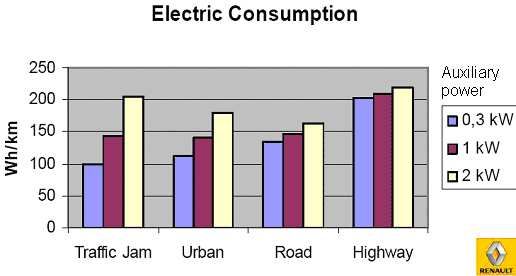
Impact of the Electric Vehicle on the Electric System July-November 2009
Figure 1 - Drivetrain for Plug-in Hybrid Electric Vehicles (PHEVs) [Axsen, Burke, Kurani
(2008)].............................................................................................................................. 11
Figure 2 - Principle of a lithium-ion battery [Anderson (2008)].............................................. 13
Figure 3 - Experience curve for NiMH and Li-Ion batteries [Kromer et al (2007)] ................ 14
Figure 4 - Specific power versus specific energy, and battery possible applications [BERR
and Department for transport (2008)] .............................................................................. 14
Figure 5 - Charging Characteristics at various currents (charge capacity, charge current,
charge voltage) [AA portable power corporation] ........................................................... 16
Figure 6 - Load for the different types of charge ..................................................................... 16
Figure 7 - Electric consumption for EVs [Perrin, Renault (2009)].......................................... 19
Figure 8 - Vehicles’ trips distribution for Lille’s area ............................................................. 21
Figure 9 - Fleet characteristics for the simulation.................................................................... 24
Figure 10 - Possible states and transitions for a vehicle .......................................................... 27
Figure 11 - Simulation’s Flowchart ......................................................................................... 30
Figure 12 - Consumed power and load for three vehicles........................................................ 31
Figure 13 - Load, mean power and box-and-whisker plot: 100 simulations, 5000 vehicles ... 32
Figure 14 - Mean powers and Relative Standard Deviations with different numbers of
simulations ....................................................................................................................... 33
Figure 15 - Mean Power per vehicle and Relative Standard Deviations with 100 simulations34
Figure 16 - Load with an initial SOC of 100% for all the vehicles, for 3 days........................ 38
Figure 17 - Mean powers and Relative Standard Deviations for different initial SOC ........... 39
Figure 18 - SOC distribution function...................................................................................... 39
Figure 19 - Mean powers and Relative Standard Deviations for four scenarios (EV/PHEV) . 40
Figure 20 - Mean Powers and Relative Standard Deviations for six different PV/CV
distributions...................................................................................................................... 41
Figure 21 - Mean powers and Relative Standard Deviations for three temperature’s scenarios
.......................................................................................................................................... 42
Figure 22 - Mean powers and Relative Standard Deviations for three different fast charge
points’ distribution ........................................................................................................... 43
Figure 23 - Mean powers and Relative Standard Deviations for three different standard charge
points’ distributions for PVs ............................................................................................ 44
Figure 24 - Mean powers and Relative Standard Deviations for three different standard charge
points’ distributions for CVs ............................................................................................ 45
Figure 25 - Mean Powers and Relative Standard Deviations for three scenarios for Fast charge
points’ distribution for CVs.............................................................................................. 46
Figure 26 - Mean Power for systematic and not systematic charges during five days ............ 47
Figure 27 - Relative Standard Deviations with and without systematic charge....................... 47
Figure 28 - Load from one simulation with battery exchange ................................................. 48
Figure 29 - Mean load and relative standard deviation with battery exchange........................ 49
Figure 30 - Mean power for the reference scenario ................................................................. 51
Figure 31 - Consumption curves for a winter and summer workday....................................... 52
Figure 32 - Load in 2009, 2015, 2020 and 2025 ...................................................................... 53
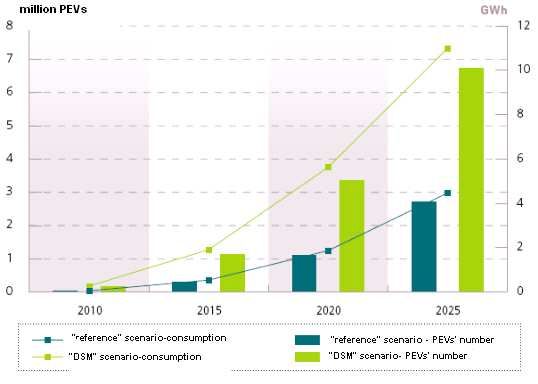
Figure 33 - PEVs’ and electricity demand’s evolution [RTE (2009)] ..................................... 54
Figure 34 - Total load curve with PEVs in 2015...................................................................... 54
Figure 35 - Total load curve with PEVs in 2020...................................................................... 55
Figure 36 - Dynamics of the load curve with and without PEVs in 2020................................ 55
Mélaine Rousselle - RTE-DMA – KTH 5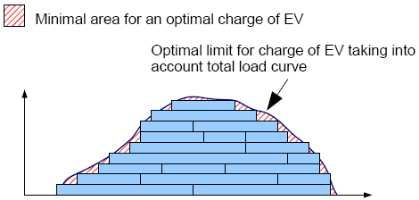
Impact of the Electric Vehicle on the Electric System                                                          July-November 2009

Figure 37 - Total load curve with PEVs in 2025...................................................................... 56
Figure 38 - Dynamics of the load curve with and without PEVs in 2025................................ 56
Figure 39 - Tariff Signal’s principle ........................................................................................ 57
Figure 40 - Load and consumed power for two vehicles ......................................................... 58
Figure 41 - Mean Powers and Relative Standard Deviations for three different scenarios for
    tariff signals...................................................................................................................... 59
Figure 42 - Total load in 2020 with PEVs and tariff signals (40%)......................................... 59
Figure 43 - Dynamics of the load curve with and without PEVs in 2020, with tariff signals . 60
Figure 44 - Total load in 2020 with PEVs and tariff signals (60%)......................................... 61
Figure 45 - Battery Management System’s principle............................................................... 62
Figure 46 - Power for two vehicles with and without BMS..................................................... 63
Figure 47 - Load with different BMSs and without BMS........................................................ 63
Figure 48 - Mean powers and relative standard deviations for three scenarios for BMS’s
    distribution ....................................................................................................................... 64
Figure 49 - Total load in 2020 with PEVs and BMS (40%) .................................................... 65
Figure 50 - Dynamics of the load curve with and without PEVs in 2020, with BMS (40%) .. 65
Figure 51 - Total load in 2020 with PEVs and BMS (80%) .................................................... 66
Figure 52 - Mean powers and relative standard deviations for different distribution for BMS
    bis ..................................................................................................................................... 67
Figure 53 - Total load in 2020 with PEVs and BMS bis (80%)............................................... 67
Figure 54 - Load with different regulations ............................................................................. 68
Figure 55 - Mean powers and relative standard deviations for five different distribution for
    BMS combined with tariff signals ................................................................................... 69
Figure 56 - Total load in 2020 with PEVs and BMS & Tariff Signals (40%) ......................... 70
Figure 57 - Total load in 2020 with PEVs and BMS & Tariff Signals (80%) ......................... 70
Figure 58 - Mean powers with and without injection .............................................................. 71
Figure 59 - Mean power and Mean injected power ................................................................. 72
Figure 60 - Total load curve in 2020 with PEVs and injection into the grid (scenario 1) ....... 73
Figure 61 - Total load curve in 2020 with PEVs and injection into the grid (scenario 13) ..... 74
Figure 62 - Dynamics of the load curve with and without PEVs with injections .................... 74
Figure 63 - Cut off injunction’s principle ................................................................................ 75
Figure 64 - Mean required time to charge................................................................................ 76
Figure 65 - Mean Available Energy......................................................................................... 76
Figure 66 - Mean load with fast charge point at anytime of the day........................................ 77
Figure 67 - Consumption curves in 2020 with 100% of the fleet having access to fast charge
    points at anytime of the day ............................................................................................. 78
Figure 68 - Optimum consumption profile .............................................................................. 79
Figure 69 - Load profiles for optimum case in winter and summer......................................... 79
Figure 70 - Classes of load curves of PEVs according to their required charge time.............. 80
Figure 71 - Optimal load placement......................................................................................... 80
Figure 72 - Load profiles and load ........................................................................................... 81
Figure 73 - Consumption curve with one empirical simulation............................................... 81
Figure 74 - Mean Available Energy......................................................................................... 83
Figure 75 - Margin’s sizing principle....................................................................................... 84
Figure 76 - Mean power for EVs and different slots for CO2 emissions ................................. 86
Figure 77 - Initialisation of a fleet............................................................................................ 92
Figure 78 - Transition Matrix’s Flowchart............................................................................... 93
Figure 79 - Power Block’s Flowchart ...................................................................................... 94
Figure 80 - Number of running vehicles (fleet with 5000 vehicles) ........................................ 94

Mélaine Rousselle - RTE-DMA – KTH                                                                                                             6
Impact of the Electric Vehicle on the Electric System July-November 2009
Table 1 - PHEVs and EVs battery requirement [Kalhammer et. al. (2007)] ........................... 12
Table 2 - Price and safety for actual and potential vehicle batteries presented at a 2007
industry forum [BERR and Department for transport (2008)]......................................... 12
Table 3 - Advantages and disadvantages of a lithium-ion battery [Soncini, RTE (2009)] ...... 13
Table 4 - Different types of charge .......................................................................................... 15
Table 5 - Type of charge according to the location & needed charge points [Renault (2009)]18
Table 6 - Electric consumption for PHEVs in city driving conditions [Hillebrand, Duoba
(2007)].............................................................................................................................. 19
Table 7 - Electric consumption for PHEVs in highway driving conditions [Hillebrand, Duoba
(2007)].............................................................................................................................. 19
Table 8 - French fleet in traffic in 2008 [MEEDDAT/SOeS (2009)] ...................................... 20
Table 9 - Commuting distances [Baccaïni, Sémécurbe, Thomas, INSEE (2007)] .................. 20
Table 10 - Number of daily trips [Lille Métropole (2006)] ..................................................... 21
Table 11 - Number of trips per day in Lille, Lyon and France[CERTU (2008)]..................... 21
Table 12 - Simulation characteristics ....................................................................................... 34
Table 13 - Allocation of PVs’ characteristics .......................................................................... 35
Table 14 - Allocation of CVs’ characteristics .......................................................................... 35
Table 15 - Allocation of number of trips.................................................................................. 36
Table 16 - Allocation of trip length for PVs ............................................................................ 36
Table 17 - Allocation of trip length for CVs ............................................................................ 36
Table 18 - Allocation of consumption...................................................................................... 36
Table 19 - Allocation of departure times ................................................................................. 36
Table 20 - Influence description............................................................................................... 37
Table 21 - Different tested scenarios for the initial SOC impact ............................................. 38
Table 22 - Different distributions for EVs and PHEVs ........................................................... 40
Table 23 - Different PV/CV distributions ................................................................................ 41
Table 24 - Three scenarios for the temperature’s impact......................................................... 42
Table 25 - Fast charge points’ distributions ............................................................................. 42
Table 26 - Standard Charge points’ distributions for PVs ....................................................... 43
Table 27 - Standard Charge points’ distributions for CVs....................................................... 44
Table 28 - Fast Charge points’ distributions for CVs .............................................................. 45
Table 29 - Parameters’ influence recap.................................................................................... 50
Table 30 - Parameters’ influence recap.................................................................................... 50
Table 31 - Three scenarios for tariff signals distribution ......................................................... 58
Table 32 - Three scenarios for BMS’s distribution.................................................................. 64
Table 33 - Different scenarios for BMS bis ............................................................................. 66
Table 34 - Five different scenarios for BMS & Tariff signals distributions ............................ 68
Table 35 - Different scenarios for injection into the grid......................................................... 72
Table 36 - Energy per day, and CO2 emissions........................................................................ 87
Table 37 - Characteristics of the EVs and PHEVs to come ..................................................... 91
Mélaine Rousselle - RTE-DMA – KTH 7Impact of the Electric Vehicle on the Electric System July-November 2009 BMS Battery Management System CC Constant Current CV Commercial Vehicle DoD Depth of Discharge DSM Demand Side Management EV Electric Vehicle HEV Hybrid Electric Vehicle Li Lithium NiMH Nickel-Metal Hydride PEV Plug-in Electric Vehicle PHEV Plug-in Hybrid Electric Vehicle PV Private Vehicle SOC State of Charge TSO Transmission System Operator UCTE Union for the Co-ordination of Transmission of Electricity V2G Vehicle-to-Grid Mélaine Rousselle - RTE-DMA – KTH 8
Impact of the Electric Vehicle on the Electric System                   July-November 2009

   1.1. Presentation of RTE

RTE (“Réseau de Transport de l’Electricité”) is responsible for transmitting electricity from
generation plants to local electricity distribution operators. This company is the only
Transmission System Operator (TSO) in France.
RTE was created in 2000 following the European law opening the European market up to
competition, and became a subsidiary company of EDF (“Electricité de France”) in 2005.
RTE is one of the largest European Transmission System Operator (TSO) with more than
100,000 km of lines. This company employs around 8,400 people, and its turnover in 2008
was around 4,200 M€.
RTE’s goals, defined through a public service contract between the State and the company,
are controlled by the Commission of Energy Regulation (CRE).
RTE has a public service mission and must operate, maintain and develop the French
electricity transport network at the best cost, while reducing its environmental impact. This
company guarantees all users a fair and non-discriminating access to the grid, and preserves
the freedom of all market actors. RTE aims to develop interconnection capacities, in
cooperation with the other European TSOs.
It must secure the balance between production and consumption at anytime (from long to
short terms and in real time), and assure the safety of the electric system operation. It must
also secure supply and alert public authorities in case of disruption risk [rte-france.com].
That is why RTE cares about the plug-in electric vehicles’ development.
DMA (Method and Support Department) is a R&D department of RTE’s. This department
carries out prospective studies, provides expertise on the electric network mechanisms, and
develops tools for the study and the development of the network. Therefore this master thesis
has been carried out in this department.

   1.2. Background

People become more and more aware of the impact of their lifestyle, their mobility on the
environment. The trend is not to have bigger and bigger cars anymore, but less consuming
vehicles. Furthermore, in France, governmental incentives contribute to direct French people
towards less emitting vehicles. Hybrid Electric Vehicles (HEVs) enjoy a real success, but
their electric energy still comes from gasoline, and their battery ranges are really limited.
That’s why vehicles manufacturers focus more and more on Plug-in Electric Vehicles (PEVs)
including electric vehicles (EVs) and plug-in hybrid vehicles (PHEVs).
We currently cannot say if we will face a very high demand in the next couples of years, or if
we will have a slow increase in the vehicles market share. However, many studies foresee
around one million Plug-in Electric Vehicles (PEVs) in 2020. This development of electric
vehicles depends a lot on the improvements in battery technology, on the PEVs price, and the
battery range. The development of recharge facilities, the gas price evolution, or incentives
from the government are other important factors for the PEV’s future.
The PEVs’ carbon footprint depends on the electricity sources. The PEVs can reduce our
country’s dependence on the petroleum importations. Besides it is important to analyze the

Mélaine Rousselle - RTE-DMA – KTH                                                           9
Impact of the Electric Vehicle on the Electric System                      July-November 2009

electric system impacts in order to know accurately if the planned generation capacity will be
sufficient to supply the PEVs’ demands during the peak hours.
Lots of studies have been carried out on the impact of the electric vehicles on the total energy
demand. But the real impact on the consumption curves is still not well analyzed.

   1.3. Purpose and Aim

The aim of this master thesis is to study the impact of PEVs’ development on the French load
curve.
It is important to know the consequences of introducing a large number of vehicles connected
to the grid. According to the time they are plugged in, to the power they require, they can
cause the resizing of reserves, if the installed capacity is not sufficient enough to keep up the
vehicles demand, or they can require the addition of new generation capacity.
We can imagine that the users will charge their vehicles when coming back to home, while
switching on their electric heaters, or the air-conditioning. Will it have an impact on the
production and consumption balancing system? Yes, probably but what will be the amplitude
of this impact? From how many vehicles can it have an impact?
The purpose of this master thesis is to try to answer to these questions, and try to analyze
solutions to reduce a possible impact.
With the announced characteristics for batteries and PEVs and assuming that the PEVs will
replace the conventional vehicles whose utilization is already well known, it is possible to
study such an impact.
That is why we will first study the state of the art of the battery technology and PEV, and
define the charge characteristics for a PEV.
After analyzing the French traffic data, a model for PEV’s fleet is built in order to simulate,
with Matlab, the behavior of a certain number of PEVs. With this model, it will be possible to
know when the EV/PHEV users will charge their vehicles and the state of charge (SOC) of
their battery. A sensitivity analysis is performed.
In a second part, with the load curves resulting from different scenarios, we will study their
impact on the total French load curve, on the reserves, and try to find solutions to remedy for
possible problems. A CO2 study is also performed.
The study is limited to workdays since the consumption is more important during workdays,
and thus the impact might be more important during those days.
Some assumptions are made on the battery technology improvement and on the type of
charges. Simplifying assumptions are used to describe the users’ behavior.
The impact on the electric network (such as overload of lines) is out of scope of this master
thesis.

Mélaine Rousselle - RTE-DMA – KTH                                                             10
Impact of the Electric Vehicle on the Electric System                          July-November 2009

                   !                         "
Many data are available on the state of the art of the battery technology, on PEV and traffic
data. General documents on the introduction of PEVs in a fleet, or on the vehicle-to-grid
concept are disposable, however real analysis on the impact of introducing PEVs on the
electric system are quite scarce.

   2.1. Electric Vehicle’s and Plug-in Hybrid Vehicle’s Concept

In 1899, the first car was electric. But then, due to the gasoline’s easy transport and storage,
the internal combustion engine eclipsed the electric generator to power the vehicles’ wheels.

However, in our current environmental context, Electric Vehicles (EVs) and Plug-in Hybrid
Vehicles (PHEVs) become once again trendy. Car manufacturers are developing new EVs
with higher battery range, and PHEVs are derived from current hybrid vehicles to increase the
“all electric” range. The industries aim at launching these vehicles in the next couple of years.

PHEVs combine operational aspects of both electric vehicles (EVs) and hybrid electric
vehicles (HEVs). Similar to an EV, a PHEV can store energy in an onboard battery for use
during daily driving and recharge the battery from the electric grid. However PHEVs also
have internal combustion engines used for propulsion when the required speed is more
important, or when the state of charge of the battery is not sufficient.
Two main types of PHEVs exist: series or parallel drive train. The principle of both designs is
explained on Figure 1.

   Figure 1 - Drivetrain for Plug-in Hybrid Electric Vehicles (PHEVs) [Axsen, Burke, Kurani (2008)]

In the first design, the gasoline is used to drive an electric generator who powers the wheels,
or recharges the battery. In the parallel design, the wheels rotate thanks to either the gasoline
engine, either the electric generator.

EVs don’t have an internal combustion engine, therefore they need a greater battery size than
PHEVs.

Mélaine Rousselle - RTE-DMA – KTH                                                                     11
Impact of the Electric Vehicle on the Electric System July-November 2009
However, the EVs and PHEVs will have to present some characteristics to be attractive for
the costumers. The whole problem consists of an optimisation between the battery size and
weight, the battery price and the battery range.
Table 1 - PHEVs and EVs battery requirement [Kalhammer et. al. (2007)]
Minimum
Power electric Energy
Max Peak power cost
density start density
weight (kg) (kW)
(W/kg) capacity (Wh/kg)
($/kWh)
(kWh)
PHEV 120 65;50 540;400 6;12 50;75 300
EV 250 50-100 200;400 25;40 100;160 150
Table 1 presents the energy storage requirements for PHEVs and EVs prepared for the
California Air Resources Board on the energy storage requirements for HEVs, PHEVs and
EVs. The figures are deduced from the constraints set up by requirements on the weight, the
cost, the battery range but are not current data for the batteries.
2.2. Battery
2.2.1. State of the Art
The future of the EV and the PHEV depends a lot on the battery technology development. The
lithium-ion technology is the most promising technology for the future EVs and PHEVs.
Indeed, the energy density of a Lithium battery is much higher than the other current
technologies, and this is why this type of battery is highly used for portable devices (digital
cameras, laptops, cell phones…).
Table 2 - Price and safety for actual and potential vehicle batteries presented at a 2007 industry forum
[BERR and Department for transport (2008)]
Li-M- Na-NiCl2
Li-ion NiMH lead-acid
Polymer (Zebra)
Energy density
75-120 100-120 50-70 100-120 20-30
(Wh/kg)
Power density
1000-3000 200-250 1000-1500 180 200-500
(W/kg)
Cost ($/kWh) 1000-2000 ? 1000 600 100-200
300-800
lifetime (valve
(cycles, 100% 1000-3000 ? 2000 1000 regulated
DoD) lead acid
battery)
no
temperature single
Issues safety, cost commercial
limitations supplier
product
The main constraints for EVs and PHEVs batteries are the cost, the safety and the
performance.
Mélaine Rousselle - RTE-DMA – KTH 12Impact of the Electric Vehicle on the Electric System July-November 2009
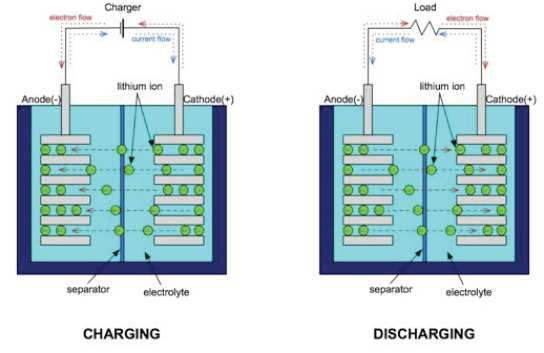
2.2.2. Lithium Batteries’ Principle
Figure 2 - Principle of a lithium-ion battery [Anderson (2008)]
The negative electrode (anode) of Li-Ion battery cell is graphite and the positive electrode
(cathode) is a lithium-bearing metal compound. Li-ion batteries have a good cycling aptitude
due to the stable electrode structure: charging and discharging involves exchange of lithium
ions between the electrodes via the electrolyte [saftbatteries.com].
While charging, the electrons are pumped from the cathode to the anode. Positively charged
lithium ions move from the cathode through the separator via the electrolyte to the anode.
While discharging, positively charged lithium ions move from the anode through the separator
via the electrolyte to the cathode. Electrons move through the external load from the anode to
the cathode, resulting in a current that provides power to the load [Anderson (2008)].
For a problem of safety, the charge intensity and the charge voltage must be correctly adapted
for a Li-ion battery. An important overload can induce the destruction of the battery. Indeed
an overload can produce hydrogen and cause the battery explosion.
Intern protection systems against temperature rises or overload are generally implemented in
the Li-ion batteries [Soncini, RTE (2009)].
Table 3 - Advantages and disadvantages of a lithium-ion battery [Soncini, RTE (2009)]
Advantages Disadvantages
no memory effect explosion risk
Energy density higher than the
other technologies for a lower essential raw material
weigh
advanced technology deep cycles are inadvisable
can have different shapes cost
Mélaine Rousselle - RTE-DMA – KTH 13Impact of the Electric Vehicle on the Electric System July-November 2009
Figure 3 - Experience curve for NiMH and Li-Ion batteries [Kromer et al (2007)]
NiMH is a mature battery technology who has reached a technological advancement’s end.
HEV applications have resulted in reduced costs due to economies of scale, but little
advancement remains for further performance or cost improvements.
Li-Ion battery will clearly be the dominating technology in the future developpment. Indeed,
there is a growing consensus that Li-ion batteries offer the most promising combination of
energy storage capacity with power (Figure 4) [BERR and Department for transport (2008)].
There are numerous opportunities of cost reduction thanks to economies of scale.
Additional cost reductions will come from the use of lower-cost materials, process
improvements, and improved yields [Anderson (2008)].
Figure 4 - Specific power versus specific energy, and battery possible applications [BERR and Department
for transport (2008)]
Mélaine Rousselle - RTE-DMA – KTH 14Impact of the Electric Vehicle on the Electric System July-November 2009
Within twenty years, we can have an evolution of performance of 10%. This means that a
battery of 20 kWh in 2010 will have a capacity of 22kWh in 2020, with the same weight and
same volume [MEEDDAT, SGT, Saft (2009)].
2.2.3. Charge of a Lithium Battery
Currently, we can charge a vehicle with two types of charge: conductive and inductive charge.
Inductive charging is one kind of short distance wireless energy transfer. The conductive
charge requires direct electrical contact between the battery and the charger. The load with
inductive charge might be a little bit higher than a conductive load since there might be more
losses. In this report, we will focus on the conductive charge, since it is the type of charge that
is more likely to be developed.
We can charge a Lithium Ion battery with different current. The different terms used in this
report are expressed in Table 4.
Table 4 - Different types of charge
load charge time
slow charge < 6kVA > 4 hours
standard charge between 6 kVA and 22 kVA between 1 and 4 hours
fast charge between 43 kVA and 125 kVA less than 1 hours
We can see on Figure 5 the charge current, voltage and capacity of a battery cell. We can
observe, that we first have a constant current phase (CC phase), then, when the capacity is
approximately equal to 80%, the voltage becomes constant, and the current starts to decrease
(Constant voltage (CV) phase). On the figure, we can see two different charges: one at
0.1CmA (Capacity milliamp: the current is equal to 0.1 times the capacity of the battery),
which we could call slow charge, and one at 0.5 CmA, which we could call standard charge.
Mélaine Rousselle - RTE-DMA – KTH 15Impact of the Electric Vehicle on the Electric System July-November 2009
Figure 5 - Charging Characteristics at various currents (charge capacity, charge current, charge voltage)
[AA portable power corporation]
With these charge’s characteristics, we could deduce that at the end of the charge, the load
curve looks like an exponential curve. However, in a concern of simplicity for the simulation,
we consider that a normalized charge curve is a constant curve, with two different levels.
Indeed, it is better for the battery to be charged with a constant power. The charge curve
model used for the simulation is represented on Figure 6. This is an assumption for this
model, but it can be adapted according to the battery manufacturers’ announcements.
Figure 6 - Load for the different types of charge
Slow charge
Slow charge will be the most used type of charge because it is already available for a majority
of consumers with current domestic installation. In 90 to 95% of the cases the charge will be
Mélaine Rousselle - RTE-DMA – KTH 16Impact of the Electric Vehicle on the Electric System July-November 2009 done with power under 6kVA, during the night [MEEDDAT, SGT (2009)]. This type of charge can last 7,5 hours for a totally depleted battery. Standard charge It is the type of charge that can be used at workplace, or on long-duration car parks. It can last 2.5 hours [MEEDDAT, SGT (2009)]. Fast charge A battery of 20 kWh charged with a power greater than 10 kW can endure severe damages. There is a possible compromise so that the battery can bear a fast charge, but this has an impact on the battery lifetime. But future improvements on the battery lithium-ion will allow extending the fast charge acceptability domain [MEEDDAT, SGT, Saft (2009)]. This charge lasts only 30 minutes. Battery exchange First, the battery exchange possibility will only be on an experimental phase. Renault plans to use battery exchange stations in a couple of years’ time frame. However, the batteries in these stations would be mostly charged with a fast charge in order to avoid having a large amount of stocked batteries [MEEDDAT, SGT (2009)]. 2.3. Charge Facilities The electrical mobility development depends a lot on the available charge infrastructure. Definitely, nobody will buy a PEV, if he cannot charge it at home. Besides, it is more likely that people will only buy EVs if their daily covered distance is shorter than the battery range. So if people use them properly and don’t forget to recharge it at home during the night, they will probably not even need public charge points when they use their vehicle in their usual way. However public charge points can be necessary to reassure the users, or when they need to do a special trip. Only 43% of the French population have access to a private parking during the night [Lille Métropole (2006)]. There are currently around 80 free public charging points in Paris for PEVs and 30 in Paris’ suburbs [http://www.paris.fr]. There are at total of around 200 points in France (July 2009). The French government will devote 1.5 billions euro for the installation of 400 000 electric plugs by 2020 on the public roads and parking lots [enerzine.com]. Moreover, only 41% of the labour force has access to a parking space at workplace [Gantelet, Sareco (2003)]. On Table 5, we can see the possible number of needed charge points according to the location, figures set up by Renault [Renault (2009)] Mélaine Rousselle - RTE-DMA – KTH 17
Impact of the Electric Vehicle on the Electric System                           July-November 2009

      Table 5 - Type of charge according to the location & needed charge points [Renault (2009)]
                                                                       Charge points for 100
      Place                                          Charge                 EV in 2020
      home, collective housing                  Domestic charge                120
      workplace                                  Normal charge                  30
      Shopping parking places, gas stations       Fast charge                   10
      Short time parking places                   Fast charge                   2,5

Recently, the largest European energy supply companies and vehicle manufacturers agreed on
the basic parameters for the charging connection for electric cars, in order to have a
standardisation of the plug in Europe [mennekes.de].

   2.4. Vehicles Characteristics

The load resulting from the PEVs’ charges depends on the vehicles’ consumption, the battery
size. Data have been collected on this subject.

Battery range and size for EV
Many sources (EDF, Renault…) foresee that the future battery range will be greater than 150
km for EVs. The battery size for EVs should be between 20 kWh (most common, for
domestic use) and 30kWh (for commercial use).

Battery range and size for PHEV
The battery range for a PHEV can fluctuate from 40km to 60km [Sénat (2005)]. For instance,
the Ford Escape will have a battery of around 10kWh, for Renault, it will be around 15kWh.
The Toyota Prius will certainly have a battery size of 9kWh, for Chevrolet Volt it’s around 16
kWh.

EVs engine efficiency
It’s difficult to interpret the announced power consumption for EVs. For [BERR &
Department for transport (2008)], the consumption by 2010 will be 16 kWh/100km, 13
kWh/100km by 2020 to decrease finally until 11 kWh/100km. But these consumptions
certainly don’t take into account the auxiliaries. For the car manufacturer Renault, the
consumption by 2010 with the auxiliaries and losses will be around 22 kWh/100km, and 18
kWh/100km by 2020 [Perrin, Renault (2009)].
Furthermore, this consumption depends also on the type of use (urban, road, highway…).

Mélaine Rousselle - RTE-DMA – KTH                                                                  18
Impact of the Electric Vehicle on the Electric System July-November 2009
Figure 7 - Electric consumption for EVs [Perrin, Renault (2009)]
PHEVs engine efficiency
On Table 6 and Table 7 we can see the consumption of three different PHEVs in city driving
conditions (Table 6) and on highway driving conditions (Table 7).The battery is much more
used when running in the city.
Table 6 - Electric consumption for PHEVs in city driving conditions [Hillebrand, Duoba (2007)]
City driving Average
Charge Usable
conditions - cycle Battery
Depleting Energy
charge depletion usage
range km (kWh)
Operation (Wh/km)
kokam Hymotion Prius 79 38,6 2,9
A123 Hymotion Prius 81 40,2 3,1
EnergyCS Prius 82 54,7 4,5
Table 7 - Electric consumption for PHEVs in highway driving conditions [Hillebrand, Duoba (2007)]
highway driving Average
Charge Usable
conditions - cycle Battery
Depleting Energy
charge depletion usage
range km (kWh)
Operation (Wh/km)
kokam Hymotion Prius 61 52,8 3,2
A123 Hymotion Prius 71 49,6 3,4
EnergyCS Prius 64 80 4,9
Charge-depleting refers to a mode of vehicle operation when all the used energy comes from
the battery pack. EVs operate only in this mode. Most PHEVs operate in charge-depleting
mode at startup, and switch to charge-sustaining mode after the battery has reached its
minimum state of charge (SOC), when the vehicle' s all-electric range is over.
Mélaine Rousselle - RTE-DMA – KTH 19Impact of the Electric Vehicle on the Electric System July-November 2009
2.5. Traffic Data
In order to build a model of a French fleet, it is important to know users’ behaviour (daily
covered distance, number of trips, and hours of their trips…). Therefore statistical data on
traffic have been studied.
Number of vehicles
Table 8 - French fleet in traffic in 2008 [MEEDDAT/SOeS (2009)]
Number of
French fleet in traffic in 2008 vehicles (1000
vehicles)
Private vehicles 30 775
gasoline 14 438
diesel 16 337
Commercial vehicles 5 725
gasoline 809
diesel 4 916
Heavy vehicles 638
Heavy trucks 554
buses 84
Total vehicles number 37 138
The current evolution rate of the French fleet is around 1 % [DDRPE (2008)].
But we can assume by 2025 a yearly average growth rate for the private vehicles fleet of
0.86% [MTET/SESP (2007)].
Around 77% of French people live in urban and suburban areas [Science et Décision (2006)].
Nowadays, around 30% households have two cars, and around 19% have none [IFEN (2007)].
In 2020, we can consider that around 40% household will have more than one car.
Around 70% of people go to work by car [Science et Décision (2006)].
We can assume that the PEV will be a second vehicle for the households, used for the
commuting trips.
Distance and number of trips
Table 9 presents the average and median trip distance for a private car.
Table 9 - Commuting distances [Baccaïni, Sémécurbe, Thomas, INSEE (2007)]
Commuting distance (data 2004) Road Distance (km)
Average Median
Urban poles 23,6 5,8
Suburban cities 30,5 13,6
Rural spaces 28,4 10,2
whole 25,9 7,9
The average number of trips per day is 3.5/day [Science et Décision (2006)].
Mélaine Rousselle - RTE-DMA – KTH 20Impact of the Electric Vehicle on the Electric System July-November 2009
Table 10 - Number of daily trips [Lille Métropole Table 11 - Number of trips per day in Lille, Lyon
(2006)] and France[CERTU (2008)]
number of car trips
Number of daily trips for data 2006
/day/inhabitants
Lille's inhabitants
Lille 2,1
11 and more 2% Lyon 1,6
9 or 10 4% France 2,2
7 or 8 9%
5 or 6 20%
3 or 4 31%
1 or 2 24%
0 9%
Travel hours
The times of the day with the biggest traffic is from 7:00 to 9:30 and it reaches its peak
between 8:00 and 8:30, and from 16:00 to 20:00 with a maximum between 18:00 and 18:30
(the traffic remains high until 21:30 then decreases until midnight).
From 12:00 to 14:00: 50% of the traffic is caused by commuting trips [Science et Décision
(2006)].
Figure 8 - Vehicles’ trips distribution for Lille’s area
On Figure 8 we can see the vehicles’ trips distribution for Lille area. However, this graph
could be generalised to big cities.
Average daily driving distance in urban areas for a captive fleet
The average daily mileage of a commercial vehicle in urban area is 98km/day [DAEI-SESP –
Samarcande (2005)].
Average daily driving distance in rural areas of a captive fleet
Mélaine Rousselle - RTE-DMA – KTH 21Impact of the Electric Vehicle on the Electric System July-November 2009 The average daily mileage of a commercial vehicle in non-urban area is 250 to 350 km/day [DAEI-SESP – Samarcande (2005)]. Mélaine Rousselle - RTE-DMA – KTH 22
Impact of the Electric Vehicle on the Electric System                      July-November 2009

   # $                    %&' (
The previous data are used in order to build a model of a French fleet. The reasoning is valid
for any country by adapting the data. The model will then be simulated with Monte Carlo
method in order to have mean charge curves for a typical day.

   3.1. Characteristics of the Fleet’s Model

To create a representative French fleet, the total number of vehicles was split up into several
classes (see Appendix Figure 77).
First the purpose of use of the vehicle is considered: Commercial Vehicle (CV) or Private
Vehicle (PV); then if it is a plug-in-vehicle (PHEV) or an electric vehicle (EV), and finally, if
the vehicle is used in urban/suburban areas or in rural areas.
Then, for each vehicle, a random number is allocated for the battery size, speed, consumption,
departure times, trips length, and number of trips, initial state, initial State of Charge (SOC),
and the available type of charge at a given period of the day.
The different characteristics are allocated according to the global data, so that the fleet’s
characteristics represent as much as possible the collected data. The initialisation of a fleet
with the allocation of the different characteristics is represented on Figure 9.

Mélaine Rousselle - RTE-DMA – KTH                                                             23
Impact of the Electric Vehicle on the Electric System                          July-November 2009

                                   Initialisation of a fleet

                              Utilisation allocation : PV/CV
                               (% of the fleet according to a
                                    normal distribution)

                                 Type allocation: EV/PHEV
                                (% of the fleet according to a
                                    normal distribution)

                        Geographical allocation : Rural/Urban
                         (% of the fleet according to a normal
                                      distribution)

                                        Battery Size
                                     (Normal distribution)

                                       TripLength
                   (Normal distribution for CV, log normal distribution
                                         for PV)

                     Number of Trips (for each period of the day)
                               (different fixed number)

                                            Speed
                                        (Fixed number)

                                         Consumption
                                         (fixed number)

               Consumption = Consumption * temperature coefficient

                     Available Type of Charge (for each location)

                                        Trip Length
                                   (reduced for some EVs)

                             Departure Time (for each trip)
                                  (normal distribution)

                              Initial Battery State of Charge

                         Figure 9 - Fleet characteristics for the simulation

Mélaine Rousselle - RTE-DMA – KTH                                                             24
Impact of the Electric Vehicle on the Electric System July-November 2009
The battery size for each vehicle is a random number, allocated according to a normal
distribution, with a mean value depending on the type of the PEV (EV/PHEV). However, we
cannot totally deplete the battery, so the usable battery size is lower than the battery size
announced by the manufacturers. So we have to multiply the battery size by a coefficient
representing the usable percentage of the battery.
The trip length is also a random number but it depends on the use of the vehicle (CV/PV),
and on the geographical location (urban/rural). It is assumed here that all the trips covered
during the day by one vehicle have the same length.
We have allocated the length trip according to a log normal distribution for PVs. Indeed the
collected data for private vehicles give us a median and a mean trip length. Given that the
median is much lower than the mean value, a log normal distribution is more appropriate.
σ2
µ+
If X has a log normal distribution of parameters and , then its expectation value is e 2
and its median is e µ . For the trip length, the collected data give us the median m and the
mean value m . So the different parameters are given by:
µ = ln(m)
σ = 2(ln(m ) − ln(m) )
For CVs, the trip length is allocated according to a normal distribution. Indeed, a median
value is not available in the collected data.
For each period of the day (morning, midday, afternoon, evening), a number of trips to cover
is given to the vehicle. It is assumed here, that except for midday, the vehicle has only one trip
to cover for a given period. For midday, it can be two trips.
The speed is not a random number, but depends on the location (urban or rural) and the use of
the vehicle. This data is used in order to know the arrival time of the vehicle.
For each place where the vehicle could be during the day (home, workplace, any place at
midday), the vehicle has a corresponding available type of charge.
For each period of the day, it is allocated to the vehicle a departure time for its trip. Except
for midday, the vehicle has one departure time. Given that the vehicle can cover two trips at
midday, it has two departure times for the both possible trips. For CVs, the departure times
can also correspond to time to charge. Indeed, as the entire work day of a CV is represented
by only one or two trips, the vehicle cannot start to recharge as soon as it parks, otherwise
some vehicles could start to charge at 10am for instance whereas they are considered to still
be working.
The consumption is not a random number, but its value depends on the geographical location
and on the use of the vehicle. For PHEVs the consumption can be modified if the battery
range is not sufficient to run on electricity for the whole day. Indeed, if the battery range is
not sufficient, the user will run more on gasoline, and then we can consider that the electricity
consumption can be decreased. However, it is less decreased for urban PHEVs than for rural
PHEVs, given that the speed and the trip length in urban area are lower than in rural area.
Mélaine Rousselle - RTE-DMA – KTH 25You can also read


