UPDATED REGIONAL POWER STATUS IN AFRICA POWER POOLS REPORT
←
→
Page content transcription
If your browser does not render page correctly, please read the page content below
UPDATED REGIONAL POWER STATUS IN
AFRICA POWER POOLS
REPORT

                                   1
UPDATED REGIONAL POWER STATUS
    IN AFRICA POWER POOLS
    REPORT

    Infrastructure Consortium for Africa (ICA)
    November 2016

    The Infrastructure Consortium for Africa Secretariat
    c/o African Development Bank
    CCIA Building
    P.O. Box 1387
    Abidjan, Ivory Coast
    www.icafrica.org

    Disclaimer

    The ICA Secretariat produced this report in collaboration with a consultant. While care has been taken to ensure the accuracy of the information provided in this report, the authors
    make no represtation, warranty or conevant with respect to its accuracy or validity.

    No responsibility or liability will be accepted by the ICA Secretariat, its members, employees, associates and/or consultants for reliance placed upon information contained in this
    document by any third party.

2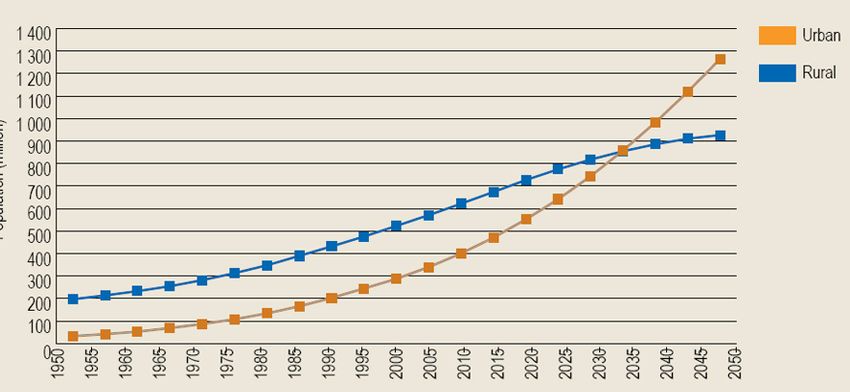
Acknowledgements
           Foreword
This report was prepared by Mr. Kamu Karekaho, consultant for the ICA. Mr. Mohammed Hassan,
ICA Coordinator, provided valuable strategic guidance. Mr. Callixte Kambanda, Chief Infrastructure
Specialist at the ICA Secretariat, ensured the overall coordination for the production of this report
and Ms. Essui Viviane Kouadjo provided highly needed logistical support.

All due appreciation is extended to the following staff members in the various Power Pools and to
the African Energy Commission (AFREC) for their invaluable support during the preparation of this
Report:

 1. West African Power Pool (WAPP) Secretariat
      yy Siengui A. Si.
      yy Adeyemo Babatunde.
      yy Momodou A.K. Njie.
      yy Jeremiah Oyewole.

 2. Eastern Africa Power Pool (EAPP) Secretariat
       yy Lebbi Changullah.
       yy Zelalem Gebrehiwott.
       yy Joseph Magochi.

 3. Southern African Power Pool (SAPP) Coordination Centre
      yy Allison Chikova.
      yy Sydney Zimba.
      yy Edeline Mujongondi.

 4. African Energy Commission (AFREC)
       yy Atef Marzouk.
       yy Abdoulaye Oueddo.

                                                                                                        3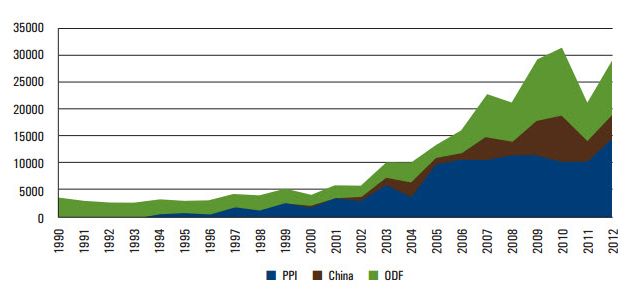
TABLE OF CONTENTS
    Acknowledgements.................................................................................................................................................... 3
    List of Tables................................................................................................................................................................ 6
    List of Figures.............................................................................................................................................................. 7
    Acronyms..................................................................................................................................................................... 8
    Executive Summary.................................................................................................................................................... 9
    1. Introduction to the Report.................................................................................................................................. 11
    2. Eastern Africa Power Pool (EAPP)....................................................................................................................... 12
       2.1 Introduction..........................................................................................................................................................12
       2.2 Vision.....................................................................................................................................................................12
       2.3 Objectives..............................................................................................................................................................12
       2.4 Membership..........................................................................................................................................................13
       2.5 Governance...........................................................................................................................................................13
       2.6 Socio-economic background...............................................................................................................................13
       2.7 Overview of the energy sector...........................................................................................................................14
    		 2.7.1 Installed generation capacity.......................................................................................................................... 14
    		      2.7.2 Production......................................................................................................................................................... 14
    		      2.7.3 Consumption.................................................................................................................................................... 14
    		      2.7.4 Consumption per capita.................................................................................................................................. 14
    		      2.7.5 Imports and exports........................................................................................................................................ 15
    		      2.7.6 Electrification rates........................................................................................................................................... 15
    		      2.7.7 Development projects..................................................................................................................................... 15
    		      2.7.8 Challenges......................................................................................................................................................... 16
    		      2.7.9 Trends................................................................................................................................................................ 16
    3. West African Power Pool (WAPP)........................................................................................................................ 17
       3.1 Introduction..........................................................................................................................................................17
       3.2 Vision.....................................................................................................................................................................17
       3.3 Objectives..............................................................................................................................................................17
       3.4 Membership..........................................................................................................................................................18
       3.5 Governance structure..........................................................................................................................................18
       3.6 Socio-economic background...............................................................................................................................18
       3.7 Overview of the energy sector...........................................................................................................................19
    		 3.7.1 Installed capacity.............................................................................................................................................. 19
    		      3.7.2 Production......................................................................................................................................................... 19
    		      3.7.3 Consumption.................................................................................................................................................... 19
    		      3.7.4 Consumption per capita.................................................................................................................................. 19
    		      3.7.5 Imports and exports........................................................................................................................................ 20
    		      3.7.6 Electrification rates........................................................................................................................................... 20
    		      3.7.7 Development projects..................................................................................................................................... 20
    		      3.7.8 Challenges ahead............................................................................................................................................. 21
    		      3.7.9 Trends................................................................................................................................................................ 21
    4. Southern African Power Pool (SAPP).................................................................................................................. 22
       4.1 Introduction..........................................................................................................................................................22
       4.2 Vision.....................................................................................................................................................................22
       4.3 Objectives..............................................................................................................................................................22
       4.4 Membership..........................................................................................................................................................23
       4.5 Governance...........................................................................................................................................................23
       4.6 Socio-economic background...............................................................................................................................23
       4.7 Overview of the energy sector...........................................................................................................................24
       4.7.1 Installed capacity...............................................................................................................................................24
    		 4.7.2 Production......................................................................................................................................................... 24
    		      4.7.3 Consumption.................................................................................................................................................... 24
    		      4.7.4 Consumption per Capita................................................................................................................................. 24
    		      4.7.5 Imports and Exports........................................................................................................................................ 25
    		      4.7.6 Electrification rates........................................................................................................................................... 25
    		      4.7.7 Development projects..................................................................................................................................... 25
    		      4.7.8 Challenges......................................................................................................................................................... 25
    		      4.7.9 Trend forward................................................................................................................................................... 25
    5. Central African Power Pool (CAPP) / Pool Energé que de l’Afrique Centrale (PEAC).................................... 27
       5.1 Introduction..........................................................................................................................................................27
       5.2 Mission..................................................................................................................................................................27
       5.3 Objectives..............................................................................................................................................................27
       5.4 Membership..........................................................................................................................................................27

4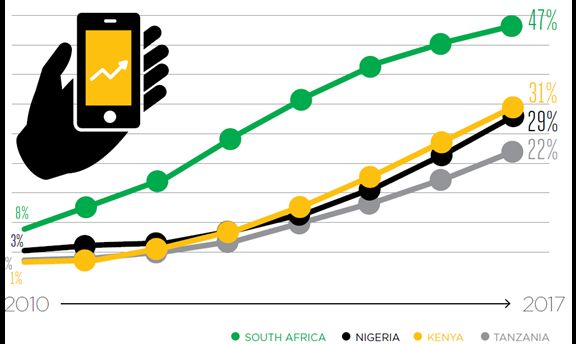
5.5 Governance...........................................................................................................................................................27
   5.6 Socio-economic background...............................................................................................................................28
   5.7 Overview of the energy sector...........................................................................................................................28
		 5.7.1 Installed capacity.............................................................................................................................................. 28
		     5.7.2 Production......................................................................................................................................................... 28
		     5.7.3 Power consumption (GWh)............................................................................................................................. 28
		     5.7.4 Consumption per capita.................................................................................................................................. 29
		     5.7.5 Imports and exports........................................................................................................................................ 29
		     5.7.6 Electrification access........................................................................................................................................ 30
		     5.7.7 Priority projects................................................................................................................................................ 30
		     5.7.8 Challenges......................................................................................................................................................... 30
		     5.7.9 Trends................................................................................................................................................................ 30
6. COMITÉ MAGHRÉBIN DE L’ELECTRICITÉ (COMELEC)......................................................................................... 31
   6.1 Introduction..........................................................................................................................................................31
   6.2 Vision.....................................................................................................................................................................31
   6.3 Objectives..............................................................................................................................................................31
   6.4 Membership..........................................................................................................................................................31
   6.5 Governance...........................................................................................................................................................31
   6.6 Socio-economic background...............................................................................................................................32
   6.7 Overview of the energy sector...........................................................................................................................32
		     6.7.1 Installed capacity.............................................................................................................................................. 32
		     6.7.2 Production......................................................................................................................................................... 33
		     6.7.3 Power consumption......................................................................................................................................... 33
		     6.7.4 Consumption per capita.................................................................................................................................. 33
		     6.7.5 Imports and exports........................................................................................................................................ 33
		     6.7.6 Electrification rates........................................................................................................................................... 34
		     6.7.7 Development projects..................................................................................................................................... 34
		     6.7.8 Challenges......................................................................................................................................................... 34
		     6.7.9 Trends................................................................................................................................................................ 34
7. Analysis of Power Pools data.............................................................................................................................. 35
   7.1 Introduction..........................................................................................................................................................35
   7.2 Power market development status and trends...............................................................................................35
		     7.2.1 EAPP................................................................................................................................................................... 36
		     7.2.2 WAPP.................................................................................................................................................................. 36
		     7.2.3 SAPP................................................................................................................................................................... 36
		     7.2.4 CAPP................................................................................................................................................................... 36
		     7.2.5 COMELEC........................................................................................................................................................... 36
   7.3 Factors for power sector growth........................................................................................................................36
		     7.3.1 Economic growth:............................................................................................................................................. 37
		     7.3.2 Demographics................................................................................................................................................... 37
		     7.3.3 Urbanisation..................................................................................................................................................... 37
		     7.3.4 Technology........................................................................................................................................................ 38
		     7.3.5 China.................................................................................................................................................................. 38
		     7.3.6 International frameworks............................................................................................................................... 38
		     7.3.7 Private sector growth....................................................................................................................................... 39
		     7.3.8 Political will........................................................................................................................................................ 39
		     7.3.9 Increased public awareness............................................................................................................................ 40
		     7.3.10 Regional cooperation..................................................................................................................................... 40
   7.4 Way forward..........................................................................................................................................................40
		     7.4.1 Challenges ahead............................................................................................................................................. 40
		     7.4.2 Recommendations........................................................................................................................................... 41
8. Appendices............................................................................................................................................................ 42
   8.1 Appendix 1: Priority projects in EAPP................................................................................................................42
   8.2 Appendix 2: Priority projects in WAPP...............................................................................................................42
   8.3 Appendix 3: Priority projects in SAPP................................................................................................................43
   8.4 Appendix 4: Priority projects in CAPP................................................................................................................43
   8.5 Appendix 5: Priority projects in COMELEC........................................................................................................44
9. References............................................................................................................................................................. 45

                                                                                                                                                                                          5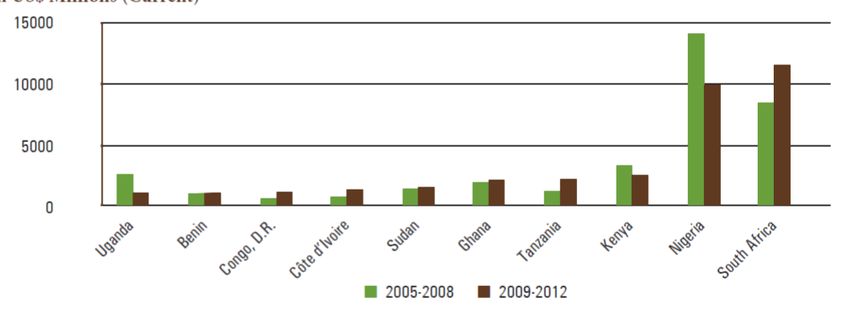
LIST OF TABLES

    TABLE 1: SOCIO-ECONOMIC DATA OF EAPP MEMBER COUNTRIES................................................................................ 13
    TABLE 2: INSTALLED CAPACITY............................................................................................................................................ 14
    TABLE 3: GENERATION.......................................................................................................................................................... 14
    TABLE 4: CONSUMPTION IN EAPP COUNTRIES.................................................................................................................. 14
    TABLE 5: CONSUMPTION PER CAPITA IN 2013.................................................................................................................. 15
    TABLE 6: IMPORTS AND EXPORTS........................................................................................................................................ 15
    TABLE 7: ELECTRIFICATION RATES....................................................................................................................................... 15
    TABLE 8: SOCIO-ECONOMIC DATA OF WAPP MEMBER COUNTRIES............................................................................... 18
    TABLE 9: INSTALLED CAPACITY............................................................................................................................................ 19
    TABLE 10: GENERATION IN WAPP........................................................................................................................................ 19
    TABLE 11: CONSUMPTION (GWh)........................................................................................................................................ 19
    TABLE 12: CONSUMPTION PER CAPITA (kWh).................................................................................................................... 20
    TABLE 13: IMPORTS AND EXPORTS..................................................................................................................................... 20
    TABLE 14: AGGREGATED ELECTRIFICATION RATES............................................................................................................ 20
    TABLE 15: ELECTRIFICATION (%) RATES IN 2015................................................................................................................ 21
    TABLE 16: SOCIO – ECONOMIC DATA OF SAPP MEMBER COUNTRIES............................................................................ 23
    TABLE 17: INSTALLED CAPACITY.......................................................................................................................................... 24
    TABLE 18: GE NERATION....................................................................................................................................................... 24
    TABLE 19: CONSUMPTION.................................................................................................................................................... 24
    TABLE 20: CONSUMPTION PER CAPITA............................................................................................................................... 25
    TABLE 21: IMPORTS AND EXPORTS..................................................................................................................................... 25
    TABLE 22: ELECTRIFICATION RATES..................................................................................................................................... 25
    TABLE 23: SOCIO-ECONOMIC DATA OF CAPP MEMBER COUNTRIES.............................................................................. 28
    TABLE 24: INSTALLED CAPACITY.......................................................................................................................................... 28
    TABLE 25: GENERATION IN CAPP......................................................................................................................................... 29
    TABLE 26: CONSUMPTION.................................................................................................................................................... 29
    TABLE 27: CONSUMPTION PER CAPITA (kWh).................................................................................................................... 29
    TABLE 28: NET IMPORTAND EXPORT (GWh)....................................................................................................................... 29
    TABLE 29: ELECTRIFICATION RATES IN CAPP...................................................................................................................... 30
    TABLE 30: SOCIO-ECONOMIC DATA OF COMELEC MEMBER COUNTRIES...................................................................... 33
    TABLE 31: INSTALLED CAPACITY (MW)................................................................................................................................ 33
    TABLE 32: GENERATION (GWh)............................................................................................................................................ 33
    TABLE 33: CONSUMPTION IN COMELEC(GWh).................................................................................................................. 33
    TABLE 34: CONSUMPTION PER CAPITA (kWh).................................................................................................................... 33
    TABLE 35: IMPORTS AND EXPORTS (GWh).......................................................................................................................... 33
    TABLE 36: ELECTRIFICATION RATES (%) .............................................................................................................................. 34
    TABLE 37: NATIONAL ELECTRIFICATION RATES................................................................................................................. 34
    TABLE 38: PROPOSED POWER TRADE ROAD MAP............................................................................................................. 36

6
LIST OF FIGURES
FIGURE 1: ORGANISATION CHART EAPP.......................................................................................................................... 13
FIGURE 2: WAPP ORGANISATION STRUCTURE................................................................................................................ 18
FIGURE 3: SAPP MANAGEMENT STRUCTURE................................................................................................................... 23
FIGURE 4: CAPP MANAGEMENT STRUCTURE.................................................................................................................. 28
FIGURE 5: ORGANISATION STRUCTURE FOR COMELEC................................................................................................. 32
FIGURE 7: ELECTRICITY PRODUCTION AND CONSUMPTION........................................................................................ 36
FIGURE 8: AFRICA’S ECONOMIC GROWTH....................................................................................................................... 37
FIGURE 9: PROJECTED POPULATION GROWTH IN AFRICA............................................................................................. 37
FIGURE 10: URBANISATION GROWTH IN AFRICA............................................................................................................ 37
FIGURE 11: SMART PHONE GROWTH IN SELECTED AFRICAN COUNTRIES.................................................................. 38
FIGURE 12: EXTERNAL INFRASTRUCTURE INVESTMENT COMMITMENTS 1990 - 2012.............................................. 39
FIGURE 13: TOP 10 PPI RECIPIENTS IN SUB-SAHARAN AFRICA..................................................................................... 39
7Acronyms
ACP African, Caribbean and Pacific
AFREC African Energy Commission
Bn Billion (1,000,000,000)
CAPP/PEAC Central African Power Pool/ Pool Energé que de l’Afrique Centrale
CAR Central Africa Republic
CEO Chief Executive Officer
COMELEC Comité Maghrébin de L’Electricité (Maghreb Electricity Committee)
COMESA Common Market for Eastern and Southern Africa
CPE Commission for Planning and Studies
DAM Day Ahead Market
DRC Democratic Republic of Congo
EAC East African Community
EAPP Eastern Africa Power Pool
ECCAS Central African States
ECOWAS Economic Community for West African States
EDF European Development Fund
EU European Union
GDP Gross Domestic Product
GEIDCO Global Energy Interconnection Development and Cooperation
GW Giga-watt (1,000 mega-watts)
GWh Giga-watt-hours (1,000 MWh)
ICA Infrastructure Consortium for Africa
IEA International Energy Agency
IGMOU Inter-Governmental Memorandum of Understanding
IRENA International Renewable Energy Agency
Km Kilometre (1,000 metres)
kW Kilo-watt (1,000 watts)
kWh Kilo-watt hour (1,000 Watt-hour)
MDG Millennium Development Goals
MOU Memorandum of Understanding
MW Mega-watt (1,000 kilo-watts)
OECD Organization for Economic Co-operation and Development
OMVG Gambia River Basin Development Organisation
OMVS Senegal River Basin Development Organisation
ONE Office National de l’Electricité of Morocco
PIDA Programme for Infrastructure Development in Africa
PPI Private Participation in Infrastructure
PRB Population Reference Bureau
REC Regional Economic Community
RSMO Regional System Market Operator
SADC Southern African Development Community
SAPP Southern Africa Power Pool
SE4ALL Sustainable Energy for All
SONELGAZ Société Nationale de l’Electricité et du Gaz of Algeria
SSA Sub Saharan Africa
STEG Société Tunisienne de l’Electricité et du Gaz of Tunisia
T&D Transmission and Distribution
TICAD Tokyo International Conference on African Development
TWh Terra-watt-hour (1,000,000 GWh)
UMA Union of Maghreb area
UN United Nations
UNECA United Nations Economic Commission for Africa
USD United States Dollar
WAPP West African Power Pool
8Executive Summary
1. Introduction consumption increased from 46,936 GWh
In November 2011, the ICA published a report in 2008 to 50,634 GWh in 2015 respectively.
entitled “Regional Power Status in African
Based on the proposed roadmap, the
Power Pools” that provided an overview of the
attainment of a centralised trading regime
status of Africa’s five Regional Power Pools - the
may occur by 2019 subject to the completion
Eastern Africa Power Pool, the Central African
of the regional interconnection projects.
Power Pool, the Southern African Power Pool,
the West African Power Pool and the Comité 3. S A P P : w i t h a m e m b e r s h i p o f 1 1
Maghrébin de l’Electricité using baseline data countries, has attained a growth in the
from between 2008 and 2010. installed capacity from 55,948 MW and
the corresponding consumption of
This Updated Report provides the status of the 260,081 GWh in and 2008 to 61,859 MW
five Power Pools based on data for the period and 269,375 GWh in 2015 respectively.
between 2013 and 2015. The Southern African Power Pool (SAPP)
was created in 1995 and is now the most
2. Objectivte advanced power pool on the continent;
As part of its mandate to increase knowledge given the developments taking place
and information sharing, ICA carried out an in the region, it is expected that more
update of the 2011 Report in order to provide countries will be operational members by
the end of 2018, and there will also be an
updated data on the energy sector.
interconnection between EAPP and SAPP.
3. Key Findings
4. CAPP: with a membership of 10 countries,
Based on the study findings, there has
has attained a growth in the installed capacity
been growth in the power sector across the from 5,345 MW and the corresponding
African continent since the p u b l i c a t i o n consumption of 15,238 GWh in 2008 to 6,299
of the 2011 Repor t; the progress in MW and 24,744 GWh in 2013 respectively.
each power pool is outlined below:
Given the developments in the region,
1. EAPP: with a membership of 11 countries, it is probable that by end of 2020,
has attained a grow th in the installed CAPP may start functioning as a Power
c a p a c i t y f r o m 3 8 , 513 M W a n d t h e Pool for the interconnected countries.
corresponding consumption of 162,322
G W h in and 20 0 8 to 5 4 , 311 M W and 5. C O M E L E C : w i t h a m e m b e r s h i p o f 5
2 3 2 , 5 0 5 G W h i n 2 013 r e s p e c t i v e l y. countries, has attained a growth in
the installed capacity from 24,027 MW
Based on the proposed roadmap, the and the corresponding consumption
of 160,322 GWh in 2009 to 36,367 MW
attainment of a centralised trading regime
and 120,200 GWh in 2013 respectively.
may occur between 2020 and 2025.
Given the enhanced support to regional
2. WAPP: with a membership of 14 countries,
power development, COMELEC could start
WAPP has attained a growth in the installed
its operations as a Power Pool as early as
capacity from 14,669 MW in 2008 to 19,648
late 2018; but this depends more on political
MW in 2015. And the corresponding
rather than technical considerations.
94. Challenges governments), particularly on power deals;
While in general there has been
yyContinue strengthening the institutional
commendable progress, the key challenges
capacity and skills of the power pools and
include:
directorates in charge of energy in the RECs
– with a focus on enhancing the capacity
yyLack of infrastructure: the need for
and skills for structuring and negotiating
infrastructure requires no over-emphasis
power deals with the private sector; and
as no power trade/exchange can take place
without the necessary infrastructure in place:
yyTake necessary measures to enhance the
yyLack of national strategies: Many countries role of the private sector.
still lack a comprehensive strategic
framework in the context of national goals
and objectives to help guide the roles and
responsibilities for all players including
government utilities, the private sector, civil
society and development organisations;
yyUtility financial distress: These are mainly
attributed to below-cost tariffs, weak
management and political interference; and
yyPolitics: The ultimate goal to harness
energy resources for the socio-economic
transformation of Africa will necessarily
hinge on political will and support. The
need to harmonise power sector regulatory
policies and the adoption of regional master
plans to guide national development plans
cannot be compromised.
5. Conclusion
The Continent needs to sustain the
commendable positive trend, and for this the
countries should continue to:
yyMobilise investments for physical intra-
regional infrastructure - this should
include agreeing on strategies for the
mobilisation of domestic resources such
as pension funds and infrastructure bonds;
yyProvide conducive legal and regulatory
frameworks for private sector participation
- this should include legally empowering the
power pools to act on behalf of RECs (and
10Chapter 1
Introduction to the Report
1.1 Background
In November 2011, the ICA published a report yyPublished data sources include AFREC, UN,
entitled “Regional Power Status in African World Bank and the International Energy
Power Pools” that provided an overview of Agency’s World Outlook 2015 database.
the status of Africa’s five Regional Power Due acknowledgement has been indicated
Pools - the Eastern Africa Power Pool (EAPP), in the text; and
the Central African Power Pool (CAPP), the yyOther sources as indicated in the list of
Southern African Power Pool (SAPP), the West references.
African Power Pool (WAPP) and the Maghreb
1.2 Outline of the report
Electricity Committee (or Comité Maghrébin
de l’Electricité, COMELEC) using baseline data This report is divided into six chapters. Chapter
from between 2008 and 2010. 2 provides a review of East African Power Pool.
Chapter 3 discusses the West African Power
The ICA’s Strategic Business Plan for the three- Pool. Chapter 4, 5, and 6 reviews the various
year period 2014 to 2016 includes a section the status of the Southern African Power Pool,
on “Increased Knowledge and Information Central African Power Pool, and Maghreb
Sharing”. As one of its activities in this area, Electricity Committee respectively. Chapter
the ICA Secretariat produced this Report that 7 provides the analysis of power pool data,
provides an update of the 2011 Report; it challenges along with the recommendation.
includes:
1. Updated data on the energy sector in Africa;
2. Extensive analysis of data, identifying
findings, trends and possible solutions
for the respective regions of the five
Power Pools, and the potential to
build effective power markets in the
regions (an element that was not
exhaustively addressed in the 2011 report);
3. A section on private sector participation.
This Report is based on data collected from the
following:
yyD a t a c o l l e c t e d f r o m 3 P o w e r P o o l s ,
EAPP, WAPP and SAPP during physical
site visits undertaken by the consultant
during October and November 2016;
11Chapter 2
Eastern Africa Power Pool (EAPP)
Box 1: EAPP trends
established in 2005 with the signing of an Inter-
The Eastern Africa Power Pool, established
Governmental Memorandum of Understanding
in 2005 by 7 member countries, had by 2013
(IGMOU) by seven Eastern Africa countries,
grown to cover 11 countries with an estimated
namely: Burundi, Democratic Republic of
population of 450 million, while its installed
Congo (DRC), Egypt, Ethiopia, Kenya, Rwanda
capacity has increased from 38GW in 2008
and Sudan. In a further development, the
to 55GW in 2013. While the region is well
EAPP was adopted as a specialised institution
endowed with natural resources with respect
to foster power system interconnectivity by
to electricity generation, varying from hydro
the heads of states of the Common Market for
in Ethiopia and Uganda, geothermal in Kenya
Eastern and Southern Africa (COMESA) region
and gas in Tanzania, most of this remains
in November 2006. Later Tanzania, Libya and
undeveloped and electrification rates in these
Uganda joined EAPP in March 2010, February
countries vary from 2% in Burundi to 40% in
2011 and December 2012 respectively; Djibouti
Ethiopia.
is the latest entrant.
The EAPP has made commendable progress 2.2 Vision
towards formation of a power pool by
To facilitate and secure power supply to the
undertaking a Master Plan in 2011. This was
countries of the Eastern Africa region at the
updated in 2014 but it still faces a number of
lowest possible cost.
challenges, including:
2.3 Objectives
1. Limited power trade among countries due
yyTo be a framework for pooling energy
to a lack of interconnections;
resources, promoting power exchanges
2. Weak alignment of national development
between utilities in Eastern Africa and
plans with the regional Master Plan;
reduce power supply costs based on an
3. W e a k i n c e n t i v e s f o r p r i v a t e s e c t o r
integrated master plan and pre-established
participation; and
rules (Grid code);
4. Inadequate reliable data.
yyOptimise the usage of energy resources
available in the region by working out
It is expected, however, that if current
regional investment schemes in power
developments are sustained, demand will
generation, transmission and distribution;
increase to about 500TWh by 2030 with
yyReduce electricity costs in the region by
Egypt accounting for more than 75% of the
using power systems interconnection and
total installed capacity. The total required
increasing power exchanges between
investment will amount to about USD$ 400
countries; and
billion to meet the demand.
yyProvide efficient co-ordination between
various initiatives taken in the fields of
2.1 Introduction
power production, transmission as well as
The Eastern Africa Power Pool (EAPP) was exchanges in the Region.
122.4 Membership
The current membership consists of the following eleven (11) countries Burundi, Democratic
Republic of Congo (DRC), Egypt, Ethiopia, Kenya, Rwanda, Sudan, Tanzania, Libya and Uganda;
and the latest addition Djibouti. Based on information from the EAPP Secretariat, South Sudan
is expected to become a member soon.
2.5 Governance
The EAPP has four (4) governing bodies: the Council of Ministers, the Steering Committee, the
Organisational Committees and the General Secretariat; as illustrated in the Figure 1 below:
Council
of
Ministers
Independent
Steering
Regulatory
Committee
Board
Governance
Operation Environment Planning
and HR
Committee Committee Committee
Committee
Secretariat
Source: Oduor, 2010
Figure 1: Organisation chart EAPP
2.6 Socio-economic background
The GDP of the countries is as indicated in Table 1 shows that Egypt is well above the other
members in the region in terms of economic performance. This is followed (at a considerable
distance) by Ethiopia, Kenya and Sudan and this correlates positively with the electricity demand
see Table 4, 5 and 8.
Year 2010 Year 2013
GDP (US$ Bn) GDP per Capita ($) GDP (US$ Bn) Population (Million)
Burundi 2 228 3 10.9
Djibouti 1 1,411 2 0.9
DRC 21 309 35 71.1
Egypt 219 2,922 331 84.7
Ethiopia 30 378 62 89.2
Kenya 40 1,053 63 44.2
Libya 75 11,869 29 6.5
Rwanda 6 594 8 11.1
Sudan 66 1,666 84 34.2
Tanzania 31 781 45 49.1
Uganda 20 691 26 36.9
Source: World Bank database, 2013; PRB database 2010, 2013
Table 1: Socio-economic data of EAPP member countries
132.7 Overview of the energy sector Country 2010 2013
Burundi 241 184
2.7.1 Installed generation capacity Djibouti 325 82
The installed generation capacity in the region DRC 7,600 8,391
has increased from roughly about 39,000MW in Egypt 146,795 157,930
2008 to about 54,000MW in 2013; an increase Ethiopia 4,931 8,461
of about 38%; see Table 2 below for more Kenya 7,467 8,989
details. Based on the available information, Libya 32,753 31,183
the increment in installed capacity is due to a Rwanda 280 769
number of factors that include the increased Sudan 8,009 11,870
capacity to meet demand due to GDP growth, Tanzania 5,080 6,051
global initiatives like SE4ALL that aim at Uganda 2,406 3,207
universal access to modern energy services by Total 215,887 237,117
2030 and increasing regional power trade. Source: AFREC, 2015
Table 3: Generation (GWh)
Country 2008 2013 * %
change demand and GDP growth (refer to the Table 1).
Burundi 33 42 27
Djibouti 130 130 0 Country Consumption Consumption
DRC 2,476 2,506 1 in 2008 in 2013
Egypt 24,185 32,702 35 (GWh) (GWh)
Ethiopia 878 2,311 163 Burundi 61 271
Kenya 1,326 1,723 30 Djibouti 243 341
Libya 6,612 9,455 43 DRC 7,489 7,876
Rwanda 56 109 95 Egypt 106,558 155,596
Sudan 1,268 3,117 146 Ethiopia 3,238 7,633
Tanzania 1,010 1,380 37 Kenya 5,377 8,579
Uganda 539 836 55 Libya 28,396 31,295
Total 38,513 54,311 41 Rwanda 177 769
Source: UN data-base, 2013 Sudan 4,285 11,862
Table 2: Installed capacity (MW) Tanzania 3,292 6,136
Uganda 1,206 2147
2.7.2 Production
Total 160,322 232,505
The production as indicated in the Table 3 Source: AFREC, 2015
shows that there is correspondingly general Table 4: Consumption in EAPP countries
increase of power generation over the period
across all member countries in varying degree; 2.7.4 Consumption per capita
with Ethiopia and Sudan presenting the highest
In line with the GDP growth Table 1 and
increments.
supported by the availability of more capacity
2.7.3 Consumption Table 3; correspondingly the consumption per
capita also increased - Table 5.
In line with the increased production, the
consumption has increased in each of the
countries as shown in Table 4 below supporting
the positive correlation between energy
14Country Consumption Consumption 2.7.6 Electrification rates
per capita in per capita in
Access to electricity in most EAPP countries
2008 (kWh) 2013 (kWh)
is still low with notable differences between
Burundi 7 25
countries as related to the GDP Table 1 and
DRC 113 111
availability Table 2 though improvements
Djibouti 304 379
have been registered during the period
Egypt 1,423 1,837
as shown in Table 7. These improvements
Ethiopia 41 86
reflect the increased commitment by member
Kenya 142 194 countries to comply with global initiatives like
Libya 4,507 4,185 SE4ALL that target universal access to modern
Rwanda 18 69 energy access by 2030 through multi-pronged
Sudan 109 347 approaches ranging from grid extension,
(excluding micro-grids and solar home systems.
South
Sudan) Country National National Urban Rural
Tanzania 82 125 rate in rate in rate rate
Uganda 41 58 2008 (%) 2013 (%) in in
Source: AFREC, 2015 2013 2013
Table 5: Consumption per capita in 2013 (%) (%)
Burundi 2.3 5 28 2
DRC 6 9 19 2
2.7.5 Imports and Exports Djibouti 44 50 61 14
Some increase has been registered as shown in Egypt 99 100 100 99
Table 6 below on bilateral arrangements owing Ethiopia 41 24 85 10
to increased generation but the low levels Kenya 20 20 60 7
in the power trade are still an indication of Libya 100 100 100 99
inadequate interconnection among countries. Rwanda 4 21 67 5
Sudan 30 35 63 21
Country Net imports in Net imports in Tanzania 14 24 71 4
2010 (GWh) 2013 Uganda 10 15 55 7
Source: IEA, 2016
(GWh)
Table 7: Electrification rates
Burundi 84 92
DRC -755 -8
Djibouti 0 0 2.7.7 Development projects
Egypt -1,595 -390
A number of projects are underway in the region
Ethiopia 0 -384
supported through various implementation
Kenya 11 11
arrangements aimed at facilitating power
Libya -82 46
trade and operation of the Power Pool; details
Rwanda 59 90
are attached in Appendix 1.
Sudan 0 0
Tanzania 57 60
Uganda -46 58
Source: AFREC, 2015
Table 6: Imports and Exports
152.7.8 Challenges
EAPP faces a number of challenges that
include:
1. Lack of adequate capacity but a number of
countries that include Rwanda, Tanzania,
Kenya, Uganda and Ethiopia are pursuing
several development projects to address
this;
2. Limited power trade among countries due
to a lack of interconnections, however
a number of priority projects are being
carried out (section 1.7.8) to address this
matter;
3. Weak alignment of national development
plans with the regional Master Plan; this will
be addressed with time as the Power Pool
gains more ground;
4. W e a k i n c e n t i v e s f o r p r i v a t e s e c t o r
participation; a number of countries have
enacted enabling legislation to enhance
Public-Private- Partnerships; and
5. Inadequate reliable data; a key input in
planning but with continued development
and more resources, this matter will also
be addressed.
2.7.9 Trends
Demand is projected to increase by a factor
of 3.5 by 2030, based on the EAPP/EAC
Master Plan, boosting regional demand
to around 500 TWh by 2030, with Egypt
accounting for almost 75% of the total, at
more than 370 TWh. In contrast, five smaller
countries (including Burundi and Rwanda)
would together account for less than 2%
of the total. Demand from industrial users
would account for the largest share by 2030,
at 44%, with urban and rural demand at 39%
and 17% respectively. The total investment
needs would amount to almost US$ 400
billion (undiscounted), of which more than
40% would go to country-level transmission
and distribution networks.
16Chapter 3
West African Power Pool (WAPP)
Box 2: WAPP trends States (ECOWAS) Heads of State and
The West African Power Pool was established Government with the aim of promoting
by the Summit of the Economic Community for reliable power supply in the West African
West African States in 2000 to promote reliable sub-region. Subsequently in January 2006,
power supply in a region that is characterised through Decisions A/DEC.18/01/06 and
by lower levels of connections and power trade A/DEC.20/01/06, the 29th Summit of the
among states - despite widespread and diverse Authority of ECOWAS Heads of State and
energy assets that include crude oil, natural Government held in Niamey respectively
gas and hydropower. adopted the Articles of Agreement for
the establishment and functioning of
Commendable efforts are underway to WAPP, and granted the WAPP Secretariat
deal with this power problem and member status of a specialised institution of ECOWAS.
countries seem committed to the regional
approach through WAPP to convert these 2.2 Vision
resources into power production, with the To integrate the operations of the national
ensuing revenue used for public benefits. This power systems into a unified regional
still faces a number of challenges: electricity market, which will, over the
medium to long term, assure the citizens of
1. Limited power trade among countries due ECOWAS Member States stable and reliable
to a lack of interconnections; electricity supply at a competitive cost.
2. Weak alignment of national development
plans with the Regional Master Plan; 3.3 Objectives
3. W e a k i n c e n t i v e s f o r p r i v a t e s e c t o r WAPP’s key objectives are to:
participation;
4. High tariffs; and
yyIncrease investments needed for power
5. Lack of adequate reliable data.
grid expansion in the region, with emphasis
on the implementation of cross-border
The demand is projected to increase fivefold
projects that will enhance supply and
by 2030, to 250 TWh, based on the ECOWAS
reliability, and reduce costs to end users;
Master Plan with an overall investment need
amounting to US$ 170 billion. This will cover
yyCreate an attractive environment for
domestic transmission and distribution (T&D)
investment in order to facilitate the funding
costs and cross-border transmission line costs.
of power generation and transmission
facilities, including creating a common
3.1 Introduction operating standard, rules and a transparent
and reliable mechanism for the swift
The West African Power Pool (WAPP) was settlement of power trade transactions; and
created by Decision A/DEC.5/12/99 of t h e
2 2 nd S u m m i t o f t h e A u t h o r i t y o f t h e yyFormalise official and extended collaboration
E c o n o m i c C o m m u n i t y f o r West African in the region to expand power generation,
17transmission and trade.
WAPP
General Assembly
3.4 Membership
The present membership consists of the WAPP
Executive Board
following 14 countries: Benin, Burkina Faso,
Côte d’Ivoire, Gambia, Ghana, Guinea, Guinea
Bissau, Liberia, Mali, Niger, Nigeria, Senegal,
Distribution &
Sierra Leone and Togo. Engineering &
Commercialization
Operating Committee
Committee
3.5 Governance structure Strategic Planning &
Environment Finance
WAPP has four (4) governing bodies: the Committee Committee
General Assembly, the Executive Board, the
Organisational Committees and the General HR & Governance
Secretariat; as illustrated in the Figure 2 below: Committee
3.6 Socio-economic background
Secretariat
The GDP of the countries in the region is as
shown in the Table 8, with Nigeria well above
Source: Ki, 2016
the rest other members of the community; and
Figure 2: WAPP Organisation structure
as expected this is positively correlated with
the consumption Table 11 and electrification
rates Table 14:
Year 2008 Year 2015
Country GDP ($Bn) Pop. (Mn) GDP ($Bn) Pop. (Mn)
Benin 7 9.3 8 10.6
Burkina Faso 9 15.2 11 18.5
Côte d’Ivoire 25 20.7 32 23.3
Gambia 1 1.6 1 2
Ghana 32 23.9 38 27.7
Guinea 5 10.3 7 11
Guinea Bissau 1 1.7 1 1.8
Liberia 1 3.9 2 4.5
Mali 11 12.7 13 16.7
Niger 6 14.7 7 18.7
Nigeria 369 148.1 481 181.8
Senegal 12 12.7 14 14.7
Sierra Leone 3 5.5 4 6.5
Togo 3 6.8 4 7.2
Source: World Bank database, 2013; PRB 2008, 2015
Table 8: Socio-economic data of WAPP member countries
18You can also read