Financial integration - heightened Financial Vulnerabilities amid the Pandemic

Page created by Alfredo Armstrong
 
CONTINUE READING
Financial integration - heightened Financial Vulnerabilities amid the Pandemic
4                                    Financial integration
                                          heightened Financial Vulnerabilities
                                          amid the Pandemic

     The onset of the COVID-19 pandemic led                                                                                                                    The pandemic and related containment measures
     to a spike in global financial volatility, a                                                                                                              hit the economies hard around the world. As risk-off
     deterioration in investor sentiment, and                                                                                                                  sentiment spread globally, emerging market assets
     tighter liquidity conditions in March 2020.                                                                                                               were sold off. Sovereign credit default swaps (CDS)
                                                                                                                                                               spreads of selected Asian economies widened sharply
     As the World Health Organization declared the                                                                                                             (Figure 4.2). Amid massive unwinding of risky assets
     coronavirus disease (COVID-19) outbreak a global                                                                                                          and flight to safety, short-term dollar funding markets
     pandemic on 11 March 2020, investor sentiment                                                                                                             tightened (Figure 4.3). Offshore dollar funding costs in
     deteriorated quickly. The Chicago Board Options                                                                                                           emerging market economies, likewise, rose sharply amid
     Exchange’s volatility index (VIX), a measure of risk                                                                                                      disruptions of the dollar supply. The cross-currency basis
     aversion, reached levels last seen during the 2008 global                                                                                                 swap versus the United States (US) dollar widened in
     financial crisis (Figure 4.1). The index rose sharply in early                                                                                            mid-March, particularly for the won and ringgit, and to
     March as economies implemented strict quarantine                                                                                                          a much greater degree than it did for major currencies,
     measures, and its peak in the week of 10 March was                                                                                                        such as the euro, pound sterling, or yen (Figure 4.4).
     slightly higher than the peak reached in October of 2008.

     Figure 4�1: Volatility index
        100

         80

         60

         40

         20

           0
               Jan-08
                        Jun-08
                                 Nov-08
                                          Apr-09
                                                   Sep-09
                                                            Feb-10
                                                                     Jul-10
                                                                              Dec-10
                                                                                       May-11
                                                                                                Oct-11
                                                                                                         Mar-12
                                                                                                                  Aug-12
                                                                                                                           Jan-13
                                                                                                                                    Jun-13
                                                                                                                                             Nov-13
                                                                                                                                                      Apr-14
                                                                                                                                                               Sep-14
                                                                                                                                                                        Feb-15
                                                                                                                                                                                 Jul-15
                                                                                                                                                                                          Dec-15
                                                                                                                                                                                                   May-16
                                                                                                                                                                                                            Oct-16
                                                                                                                                                                                                                     Mar-17
                                                                                                                                                                                                                              Aug-17
                                                                                                                                                                                                                                       Jan-18
                                                                                                                                                                                                                                                Jun-18
                                                                                                                                                                                                                                                         Nov-18
                                                                                                                                                                                                                                                                  Apr-19
                                                                                                                                                                                                                                                                           Sep-19
                                                                                                                                                                                                                                                                                    Feb-20
                                                                                                                                                                                                                                                                                             Jul-20
                                                                                                                                                                                                                                                                                                      Dec-20

     Note: The volatility index refers to the adjusted close value.
     Source: Chicago Board Options Exchange. Volatility Index. http://www.cboe.com/vix (accessed January 2021).

70
Financial integration - heightened Financial Vulnerabilities amid the Pandemic
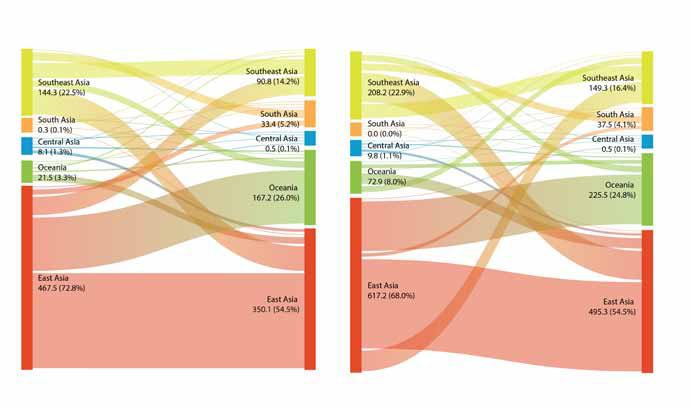
Financial Integration          71

Figure 4�2: Credit Default Swaps—Selected Asian                                                                                               Figure 4�4: Cross-Currency Basis Swap Spread against
Economies (spreads index, 2 January 2020 = 100)                                                                                               the United States Dollar (basis points)

600                                                                                                                                              50                                           A    B
                                                                                                                                                   0
500
                                                                                                                                                -50
400
                                                                                                                                               -100
300                                                                                                                                            -150
                                                                                                                                              -200
200
                                                                                                                                              -250

                                                                                                                                                     Jan 2019
                                                                                                                                                     Feb 2019
                                                                                                                                                    Mar 2019
                                                                                                                                                     Apr 2019
                                                                                                                                                    May 2019
                                                                                                                                                     Jun 2019
                                                                                                                                                      Jul 2019
                                                                                                                                                    Aug 2019
                                                                                                                                                     Sep 2019
                                                                                                                                                    Oct 2019
                                                                                                                                                    Nov 2019
                                                                                                                                                    Dec 2019
                                                                                                                                                    Jan 2020
                                                                                                                                                    Feb 2020
                                                                                                                                                    Mar 2020
                                                                                                                                                    Apr 2020
                                                                                                                                                    May 2020
                                                                                                                                                    Jun 2020
                                                                                                                                                     Jul 2020
                                                                                                                                                    Aug 2020
                                                                                                                                                    Sep 2020
                                                                                                                                                    Oct 2020
                                                                                                                                                    Nov 2020
                                                                                                                                                    Dec 2020
 100

    0
        Jan 2020

                   Feb 2020

                              Mar 2020

                                         Apr 2020

                                                    May 2020

                                                               Jun 2020

                                                                          Jul 2020

                                                                                      Aug 2020

                                                                                                 Sep 2020

                                                                                                             Oct 2020

                                                                                                                        Nov 2020

                                                                                                                                   Dec 2020
                                                                                                                                                           yuan          yen          won           ringgit          baht
                                                                                                                                                    A (19 March 2020): US Federal Reserve established nine
                                                                                                                                                      temporary dollar liquidity swap lines
                                 INO                      JPN                        KOR                    MAL                                     B (30 March 2020): US Federal Reserve introduced temporary
                                 PHI                      PRC                        THA                    VIE                                       foreign and international monetary authorities repo facility

                                                                                                                                              US = United States.
INO = Indonesia, JPN = Japan, KOR = Republic of Korea, MAL = Malaysia,
PHI = Philippines, PRC = People’s Republic of China, THA = Thailand,                                                                          Note: 3-month cross-currency basis swap for the yen, ringgit, and yuan; 6 months
VIE = Viet Nam.                                                                                                                               for the baht; and 3 months for the won versus 6 months for the US dollar.

Notes: A credit default swap is a financial derivative that insures against the risk                                                          Source: Bloomberg.
of default by one party. A higher index value reflects a higher spread, which is
associated with higher default risk.
Source: ADB calculations using data from Bloomberg.
                                                                                                                                              The deterioration in investor sentiment and tighter
                                                                                                                                              liquidity conditions, due to the COVID-19 pandemic and
Figure 4�3: LiBOR–OiS Spread—Global Financial Crisis                                                                                          its impact on economic and financial conditions led to
versus COViD-19 (basis points)                                                                                                                financial market stress around the world. Financial stress
                                                                                                                                              indexes climbed in the euro area, the United Kingdom
 400
                                                                                                                                              and the US. In Asia, they spiked in India, Indonesia,
  350
                                                                                                                                              Japan, the Philippines, Singapore, and Thailand
 300
                                                                                                                                              (Figures 4.5a and 4.5b).
  250
 200
  150
                                                                                                                                              Equity prices in the region plunged in
  100
                                                                                                                                              mid-March 2020, along with the region’s
   50
                                                                                                                                              currencies and a sharp reversal in portfolio
     0
      -10            0        10         20         30         40         50          60         70         80 90 100
                                                                                                                                              equity flows.

                   Number of days since onset of crisis (start of crisis = 0)                                                                 Asset prices in the region dropped significantly in March.
                                                                                                                                              Benchmark stock prices in India; Indonesia; Japan; the
                              Global financial crisis (starts 15 September 2008)
                              COVID-19 (starts 11 March 2020)                                                                                 Republic of Korea; the Philippines; Singapore; Thailand,
                                                                                                                                              and Viet Nam lost more than 30% of their values on 2
COVID-19 = coronavirus disease, LIBOR = London Inter-Bank Offered Rate,                                                                       January 2020 by mid-March (Figure 4.6). But the slump
OIS = Overnight Index Swap.
                                                                                                                                              in the region’s benchmark equity prices from the onset
Source: ADB calculations using data from Bloomberg.
                                                                                                                                              of the pandemic was less severe in 2020 than during the
                                                                                                                                              2008 global financial crisis (Figure 4.7).
Financial integration - heightened Financial Vulnerabilities amid the Pandemic
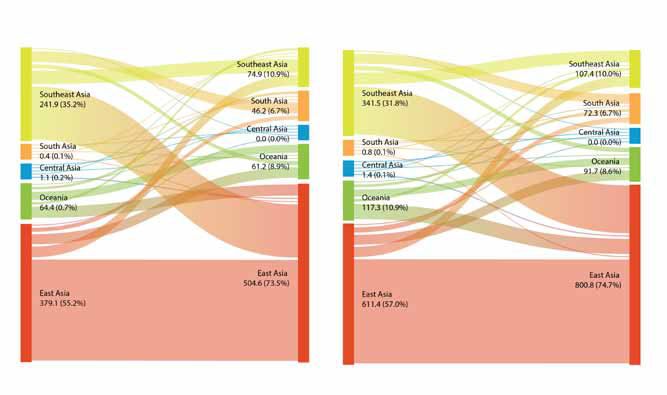
72   Asian Economic Integration Report 2021

     Figure 4.5a: Financial Stress Index—Euro Area, the United                                                                                                                     Figure 4.6: Stock Price Index—Selected Asian Economies
     States, and the United Kingdom                                                                                                                                                (2 January 2020 = 100)
       16
                                                                                                                                                                                   130
                    GFC                       Euro                      Taper                                  Brexit                                 COVID-19
                                              crisis                   tantrum                                 vote                                     onset                      120
       12
                                                                                            PRC-led                                    PRC-US                                       110
                                                                                            market                                      trade
        8                                                                                                                              tension                                     100
                                                                                            distress
                                                                                                                                        onset
                                                                                                                                                                                    90
        4
                                                                                                                                                                                    80
        0                                                                                                                                                                           70
                                                                                                                                                                                    60
      -4
                                                                                                                                                                                    50
         Jan 2008
                     Dec 2008
                                Nov 2009
                                           Oct 2010
                                                      Sep 2011
                                                                 Aug 2012
                                                                            Jul 2013
                                                                                       Jun 2014
                                                                                                   May 2015
                                                                                                               Apr 2016
                                                                                                                           Mar 2017
                                                                                                                                      Feb 2018
                                                                                                                                                 Jan 2019
                                                                                                                                                            Dec 2019
                                                                                                                                                                       Nov 2020

                                                                                                                                                                                          Jan 2020

                                                                                                                                                                                                      Feb 2020

                                                                                                                                                                                                                  Mar 2020

                                                                                                                                                                                                                             Apr 2020

                                                                                                                                                                                                                                        May 2020

                                                                                                                                                                                                                                                    Jun 2020

                                                                                                                                                                                                                                                                Jul 2020

                                                                                                                                                                                                                                                                            Sep 2020

                                                                                                                                                                                                                                                                                        Oct 2020

                                                                                                                                                                                                                                                                                                    Nov 2020

                                                                                                                                                                                                                                                                                                                 Dec 2020
                                                             EUA                         UK                               US
                                                                                                                                                                                       AUS                       HKG            IND                INO               JPN               KAZ                KOR
     COVID-19 = coronavirus disease, EUA = euro area, GFC = global financial crisis,
     PRC = People’s Republic of China, UK = United Kingdom, US = United States.                                                                                                        MAL                       PRC            PHI                SIN               SRI               TAP                THA

     Notes:                                                                                                                                                                             UZB                      VIE
     (i) Based on principal components analysis on data from 4 major finance sectors: the
                                                                                                                                                                                   AUS = Australia; HKG = Hong Kong, China; IND = India; INO = Indonesia;
         banking sector, debt, equity, and foreign exchange markets.
                                                                                                                                                                                   JPN = Japan; KAZ = Kazakhstan; KOR = Republic of Korea; MAL = Malaysia;
     (ii) Principal components are based on the banking sector price index, sovereign yield                                                                                        PHI = Philippines; PRC = People’s Republic of China; SIN = Singapore; SRI = Sri Lanka;
          spreads, stock market volatility, stock price index return, and exchange market                                                                                          TAP = Taipei,China; THA = Thailand; UZB = Uzbekistan; VIE = Viet Nam.
          pressure index.
                                                                                                                                                                                   Source: ADB calculations using data from Bloomberg.
     Sources: ADB calculations using data from Bloomberg; CEIC; Haver Analytics; the
     International Monetary Fund. International Financial Statistics. http://data.imf.org/
     IFS (accessed January 2021); and methodology by Park and Mercado (2014).
                                                                                                                                                                                   Figure 4.7: Comparison of Equity Market Slump—
                                                                                                                                                                                   Selected Economies
     Figure 4.5b: Financial Stress Index—Selected Asian Economies                                                                                                                    120

      12                                                                                                                                                                             110
                GFC                           Euro                     Taper                                   Brexit                               COVID-19
                                              crisis                  tantrum                                  vote                                   onset
                                                                                                                                                                                    100
       8                                                                                          PRC-led                             PRC-US
                                                                                                  market                               trade                                          90
                                                                                                  distress                            tension
                                                                                                                                       onset                                          80
       4
                                                                                                                                                                                      70
       0                                                                                                                                                                              60

                                                                                                                                                                                      50
      -4                                                                                                                                                                               -10             0           10        20         30         40          50          60          70          80          90 100
         Jan 2008
                     Dec 2008
                                Nov 2009
                                           Oct 2010
                                                      Sep 2011
                                                                 Aug 2012
                                                                            Jul 2013
                                                                                       Jun 2014
                                                                                                   May 2015
                                                                                                               Apr 2016
                                                                                                                           Mar 2017
                                                                                                                                      Feb 2018
                                                                                                                                                 Jan 2019
                                                                                                                                                            Dec 2019
                                                                                                                                                                        Nov 2020

                                                                                                                                                                                                     Number of days since onset of crisis (start of crisis = 0)

                                                                                                                                                                                          Asia (1 September 2008 = 100)                                         US (1 September 2008 = 100)
                                                                                                                                                                                          Asia (24 February 2020 = 100)                                         US (24 February 2020 = 100)
                    IND                           INO                        JPN                              PHI                     SIN                      THA                        Europe (1 September 2008 = 100)                                       World (1 September 2008 = 100)
                                                                                                                                                                                          Europe (24 February 2020 = 100)                                       World (24 February 2020 = 100)
     COVID-19 = coronavirus disease, GFC = global financial crisis, IND = India,
     INO = Indonesia, JPN = Japan, PHI = Philippines, PRC = People’s Republic of China,
     SIN = Singapore, THA = Thailand, US = United States.                                                                                                                          US = United States.

     Notes:                                                                                                                                                                        Note: Onset of the crises is defined as follows: Collapse of Lehman Brothers 15
     (i) Based on principal components analysis on data from 4 major finance sectors: the                                                                                          September 2008 (global financial crisis); and imposed lockdown in Italy 9 March
         banking sector, debt, equity, and foreign exchange markets.                                                                                                               2020 (COVID-19 pandemic).
     (ii) Principal components are based on the banking sector price index, sovereign yield                                                                                        Sources: ADB calculations using data from Google Finance. http://google.
          spreads, stock market volatility, stock price index return, and exchange market                                                                                          com/finance; Investing.com. https://www.investing.com/indices/msci-world-
          pressure index.                                                                                                                                                          historical-data; MSCI. MSCI World Index. https://www.msci.com/eqb/esg/
     Sources: ADB calculations using data from Bloomberg; CEIC; Haver Analytics; the                                                                                               performance/106.0.all.xls; and S&P Dow Jones Indices. Dow Jones Industrial
     International Monetary Fund. International Financial Statistics. http://data.imf.org/                                                                                         Average Index. https://us.spindices.com/indices/equity/dow-jones-industrial-
     IFS (accessed January 2021); and methodology by Park and Mercado (2014).                                                                                                      average (all accessed August 2020).
Financial Integration                     73

The drop in equity prices was accompanied by nonresident                           Figure 4�9: nonresident Capital Flows—Selected Asian
portfolio outflows in the region last March (Figure 4.8).                          Economies ($ billion)
Reported nonresident portfolio equity outflows reached                             400
$19 billion in the week of 13 March, and this accounted                            300
for a large share of the overall portfolio outflows to                             200
emerging market economies in that week. The recorded
                                                                                    100
nonresident portfolio outflows repeated a familiar pattern
                                                                                       0
of nonresident capital flow retrenchment or flight to safety
as asset prices fall during episodes of financial stress.                          -100

                                                                                   -200

                                                                                            Q1 2018

                                                                                                        Q2 2018

                                                                                                                  Q3 2018

                                                                                                                            Q4 2018

                                                                                                                                      Q1 2019

                                                                                                                                                Q2 2019

                                                                                                                                                          Q3 2019

                                                                                                                                                                      Q4 2019

                                                                                                                                                                                Q1 2020

                                                                                                                                                                                          Q2 2020
Figure 4�8: nonresident Portfolio Flows—Selected Asian
Economies ($ billion)
   15                                                                                                 Currency and deposits                                     FDI
                                                                                                      Portfolio debt                                            Portfolio equity
                                                                                                      Financial derivatives                                     Loans
                                                                                                      Trade credit and advances                                 Others
    0
                                                                                                      Nonresident capital flows
                                                                                   FDI = foreign direct investment.
                                                                                   Note: Asia includes Bangladesh; Cambodia; Hong Kong, China; India; Indonesia;
  -15                                                                              Kazakhstan; Mongolia; Nepal; the People’s Republic of China; the Philippines; the
                                                                                   Republic of Korea; Taipei,China; and Thailand.
                                                                                   Source: ADB calculations using data from the International Monetary Fund.
                                                                                   Balanced of Payments. Accessed from CEIC.
 -30
           3-Jan-20
          17-Jan 20
          31-Jan 20
         14-Feb 20
        28-Feb 20
         13-Mar 20
        27-Mar 20
         10-Apr 20
        24-Apr 20
          8-May 20
        22-May 20
           5-Jun 20
          19-Jun 20
            3-Jul 20
           17-Jul 20
           31-Jul 20
        14-Aug 20
        28-Aug 20
          11-Sep 20
         25-Sep 20
           9-Oct 20
        23-Oct 20
          6-Nov 20
        20-Nov 20
          4-Dec 20
         18-Dec 20

                                                                                   Regional currencies also weakened during the onset of
                                                                                   the COVID-19 global pandemic, but to varying degrees
                                                                                   (Figure 4.10). The Australian dollar, rupiah, and tenge
             Portfolio debt            Portfolio equity          Total
                                                                                   lost more than 10% of their values on 2 January 2020 by
Sources: ADB calculations using data from the Institute of International Finance   mid-March. The Brunei dollar, Indian rupee, won, ringgit,
and national sources.
                                                                                   Singapore dollar, and baht lost about 5%, while the yuan,
                                                                                   peso, Sri Lanka rupee, and dong lost less than 5% of
Total nonresident financial flows to selected Asian                                their values.
economies dropped by 34% in the first quarter (Q1)
of 2020, compared with the previous quarter, to reach
$138 billion (Figure 4.9). Nonresident portfolio equity                            Swift policy responses across the region
outflows in Q1 2020 amounted to $57 billion, which is                              and elsewhere helped ease liquidity
a significant turnaround from equity inflows of about                              conditions and restored investor
$40 billion in Q4 2019. Aside from nonresident portfolio                           sentiment by June 2020.
equity outflows, trade credit and advances also reported
outflows, amounting to $39 billion. The drop in trade                              In response to the COVID-19 pandemic and subsequent
credits and advances was also observed during the                                  financial market stress, authorities implemented
2008–2009 global financial crisis. However, there were                             measures to navigate economic overhang and ease
increases in some of the components of capital inflows                             financial strains. These included fiscal support, policy
in Q1 2020. Currency and deposits grew by 50% in the                               rate cuts, liquidity support, and credit provisions, among
same quarter to $66 billion, from $44 billion in Q4 2019,                          others. For instance, central banks in Asia slashed policy
implying nonresident investors’ move to more liquid                                rates, on average, by around 50 basis points from March
assets. Loan inflows increased to $52 billion, suggesting                          to May 2020 (Figure 4.11). In response to exchange
higher cross-border demand for credit.                                             rate pressures and volatility, and to support foreign
74   Asian Economic Integration Report 2021

     Figure 4�10: exchange Rate, $/lCu—selected asian                                                              Figure 4�11: Policy Rate Cuts—selected asian economies
     Currencies (2 January 2020 = 100)
                                                                                                                                    Kazakhstan
          110
                                                                                                                             Hong Kong, China
          105                                                                                                                          Sri Lanka
                                                                                                                                        Malaysia
          100
                                                                                                                                     Philippines
           95                                                                                                                          Viet Nam

          90                                                                                                                              India
                                                                                                                                      Singapore
          85
                                                                                                                             Korea, Republic of
          80                                                                                                                           Thailand
                                                    May-20

                                                                                                 Nov-20
                                  Mar-20

                                                                                                          Dec-20
                                                                                        Oct-20
                         Feb-20

                                           Apr-20

                                                                               Sep-20
                                                             Jun-20
                Jan-20

                                                                      Jul-20

                                                                                                                   China, People's Republic of

                                                                                                                                                  -3.0 -2.5 -2.0 -1.5   -1.0   -0.5 0.0
           Australian dollar               baht                       dong                         Hong Kong
                                                                                                   dollar                                            March–May 2020
           Indian rupee                    NT dollar                  peso                         ringgit
           rupiah                          Singapore dollar           Sri Lanka rupee              sum             Source: ADB calculations using data from CEIC.
           tenge                           won                        yen                          yuan

     LCU = local currency unit.
                                                                                                                   the region, shares have yet to reach their start-of-the-year
     Source: ADB calculations using data from Bloomberg.
                                                                                                                   values in 2020. The Australian dollar, yen, won, ringgit,
                                                                                                                   peso, NT dollar, and baht surpassed their start-of-the-year
     exchange liquidity, central banks or monetary authorities                                                     values as of the end of December, but several regional
     entered into bilateral currency swap arrangements                                                             currencies did not. The extent to which regional exchange
     with the US Federal Reserve and/or with other central                                                         rates reacted was significantly more moderate than during
     banks with international currency, including the Bank                                                         the 1997 Asian financial crisis and the global financial crisis.
     of Japan.24 Moreover, some emerging market central                                                            Nonresident portfolio equity outflows stopped, and debt
     banks, including some in the region, implemented                                                              inflows resumed by June 2020 (Figure 4.8).
     unconventional monetary policy measures through
     local currency bond purchase programs, including
     government securities, either to support monetary                                                             But risks of financial volatility remained
     policy or market liquidity. Initial assessment of this                                                        at large in the rest of 2020.
     measure suggests their success as local currency bond
     yields fell with minimal effect on the exchange rate                                                          Although financial conditions improved as early as June
     (Arslan, Drehmann, and Hofmann 2020).                                                                         2020, rising cases of COVID-19 infections, the possibility
                                                                                                                   of localized or wider lockdowns and border closures being
     These swift policy actions by authorities, within and outside                                                 reimposed, and weak economic prospects in the second
     the region, eased financial conditions greatly and restored                                                   half of the year continued to fuel uncertainties and test
     investor sentiment by June 2020. Equity prices and                                                            investor risk sentiment. The VIX remained elevated as of
     exchange rates trended upward after April 2020 (Figures                                                       the end of December 2020, along with financial stress
     4.6 and 4.10). In fact, stock prices in Australia; India; Japan;                                              indexes for selected advanced and Asian economies
     Kazakhstan; the People’s Republic of China (PRC); the                                                         (Figures 4.1, 4.5a, and 4.5b). Moreover, dollar funding
     Republic of Korea; Malaysia; Sri Lanka; Taipei,China; and                                                     costs remained high; and equity prices remained below
     Viet Nam traded above their start-of-the-year values as                                                       their start-of-the-year values for some economies in the
     of the end of December. However, for some economies in                                                        region (Figures 4.4 and 4.6). Total nonresident financial

     24
           In addition to the US Federal Reserve’s standing swap lines with major central banks, the establishment of nine temporary dollar liquidity swap lines
           (19 March 2020), including with regional central banks in Australia, New Zealand, the Republic of Korea, and Singapore, as well as the introduction
           of the temporary foreign and international monetary authorities repo facility (31 March 2020) to a broader group of foreign central banks and other
           international monetary authorities were effective in arresting panic in the US dollar funding market.
Financial Integration           75

flows to selected Asian economies slipped lower to                 Figure 4�12: Variance Decomposition—Equity Returns
$130 billion in Q2 2020, down by 6% from Q1 2020                                       0     10     20 30 40 50 60 70 80 90 100
(Figure 4.9). Although portfolio equity inflows resumed,                    Pre-GFC 11.0           15.6                      73.4
other components of capital inflows declined in Q2 2020,
including currency and deposits; and loan inflows. Should                        GFC        17.3          25.2                     57.5
investor sentiment deteriorate, renewed financial market
turbulence and tighter liquidity conditions may resurface.                 Post-GFC 10.6 18.0                                71.3

                                                                     Pre-COVID-19 7.8 10.6                                 81.6

Given the global nature of the ongoing
                                                                   COVID-19 onset 7.0 19.7                                   73.3
pandemic and associated economic impact, the
share of global shocks in the variation of Asian                          COVID-19 9.3              28.1                          62.6
asset price returns rose sharply and remained
larger than the share of regional shocks.                                                     Regional           Global            Domestic
                                                                   COVID-19 = coronavirus disease, GFC = global financial crisis.
The share of global shocks that explain the variation of           Note: Pre-GFC = January 1999 to September 2007, GFC = October 2007 to June
equity returns in Asia rose to around 20% in Q1 2020,              2009, Post-GFC = July 2009 to December 2015, Pre-COVID-19 = September to
                                                                   December 2019, COVID-19 onset = January to March 2020, COVID-19 = April to
which was almost double the share reported in the final            December 2020.
trimester of 2019 (Figure 4.12). The global share further          Asia includes Australia; Bangladesh; Cambodia; Georgia; Hong Kong, China;
                                                                   India; Indonesia; Japan; Kazakhstan; the Kyrgyz Republic; the Lao People’s
rose to around 28% for the rest of the year, reflecting            Democratic Republic; Malaysia; Mongolia; Nepal; New Zealand; Pakistan; the
the global nature of the pandemic and its associated               People’s Republic of China; the Philippines; the Republic of Korea; Singapore;
                                                                   Sri Lanka; Taipei,China; Thailand; Uzbekistan; and Viet Nam.
economic and financial uncertainties. In contrast, the
                                                                   Sources: ADB calculations using data from Bloomberg; CEIC; and methodology
proportion of regional shocks initially slipped to around          by Lee and Park (2011).
7% in Q1 2020, which was slightly lower than that was
reported in the previous period. But, like global shares,
                                                                   Figure 4�13: Variance Decomposition—Bond Returns
the share of regional shocks increased to 9.3% for the
                                                                                        0    10     20 30 40 50            60 70 80 90 100
rest of 2020. Across subregions of Asia, East Asia’s
equity markets showed the strongest sensitivity to                          Pre-GFC 6.7 10.7                               82.6

global and regional shocks at the start of the COVID-19
                                                                                  GFC 8.4 9.8                              81.8
pandemic, followed by Oceania.
                                                                           Post-GFC 10.7 6.9                               82.4
Similarly, the proportion of global shocks that explain the
variation of bond returns rose to almost 11% in Q1 2020              Pre-COVID-19 6.1 6.8                                 87.1
(Figure 4.13). This was also higher than the share registered in
the final trimester of 2019. The global share increased further    COVID-19 onset 7.6 10.8                                 81.6
to 17% for the rest of 2020. The proportion of regional
                                                                          COVID-19 7.5 17.3                                 75.2
shocks, likewise, increased from January to March 2020,
compared with September to December 2019, and remained                                        Regional           Global            Domestic
stable for the rest of the year. Across subregions, the increase
in the share of global shocks was highest for Oceania              COVID-19 = coronavirus disease, GFC = global financial crisis.
during the onset of the pandemic, while the increase in the        Note: Pre-GFC = January 1999 to September 2007, GFC = October 2007 to June
                                                                   2009, Post-GFC = July 2009 to December 2015, Pre-COVID-19 = September to
proportion of regional shocks was strongest for South Asia.        December 2019, COVID-19 onset = January to March 2020, COVID-19 = April
                                                                   to December 2020.

Compared with the 2008–2009 global financial crisis, the           Asia includes Australia; Hong Kong, China; India; Indonesia; Japan; Kazakhstan;
                                                                   Malaysia; the People’s Republic of China; the Philippines; the Republic of Korea;
shares of global and regional shocks that account for the          Singapore; Thailand; and Viet Nam.
variations in equity returns were considerably lower during the    Sources: ADB calculations using data from Bloomberg; CEIC; and methodology
onset of the COVID-19 pandemic, while the share of domestic        by Lee and Park (2011).
76   Asian Economic Integration Report 2021

     Figure 4�14: Cross-Border Assets—Asia
                                                      a: 2015                                                        b: 2019

                           Intraregional share,                     Intraregional share,     Intraregional share,                Intraregional share,
                           Asia: 46.7%                                      Asia: 17.0%      Asia: 48.3%                                 Asia: 17.9%

                           Bank assets                                  Portfolio debt       Bank assets                                 Portfolio debt
                           $2.0 trillion, 14.0%                     $3.8 trillion, 26.8%     $2.3 trillion, 11.0%                    $5.1 trillion, 24.2%

                                                   $14.1 trillion                                                   $21.0 trillion

                            FDI                                        Portfolio equity      FDI                                        Portfolio equity
                            $5.0 trillion, 35.1%                    $3.4 trillion, 24.1%     $8.2 trillion, 39.1%                    $5.4 trillion, 25.7%

                            Intraregional share,                    Intraregional share,     Intraregional share,                    Intraregional share,
                            Asia: 49.0%                                     Asia: 20.2%      Asia: 47.4%                                     Asia: 19.9%

     FDI = foreign direct investment.
     Notes: FDI assets refer to outward FDI holdings. Bank assets refer to bank claims and limited to loans and deposits. Asia includes ADB regional members for which data
     are available.
     Sources: ADB calculations using data from the Bank for International Settlements. Locational Banking Statistics. https://www.bis.org/statistics/bankstats.htm (accessed
     October 2020); International Monetary Fund (IMF). Coordinated Direct Investment Survey. http://cdis.imf.org (accessed December 2020); and IMF. Coordinated
     Portfolio Investment Survey. http://cpis.imf.org (accessed September 2020).

     shocks was higher (Figures 4.12 and 4.13). The stronger impact                          (Figure 4.14).26 Most of the region’s investment holdings
     of global and regional shocks in 2008 and 2009 reflected                                in the 2019 amount took the form of direct investment
     the financial nature of the global crisis, whereas the ongoing                          assets ($8.2 trillion), followed by portfolio equity
     COVID-19 pandemic is a global health crisis.                                            ($5.4 trillion) and portfolio debt ($5.1 trillion), and then
                                                                                             banking sector loan and deposit holdings ($2.3 trillion).
                                                                                             But around two-thirds of Asia’s asset holdings were
     Recent Trends in Asia’s                                                                 placed in non-regional economies, and about one-third
                                                                                             in regional economies.
     Cross-Border Financial
     Assets and Liabilities                                                                  Asia’s outward portfolio debt holdings increased from
                                                                                             $4.5 trillion in 2018 to $5.1 trillion in 2019, recording a
     Asian investors continued to hold                                                       12% increase while continuing the trend over the past
     considerably more non-regional assets                                                   years.27 The Asian investors’ outward portfolio equity
     and liabilities than regional ones.25                                                   holdings rebounded strongly to $5.4 trillion in 2019, after
                                                                                             declining to $4.5 trillion in 2018. Meanwhile, Asia’s cross-
     Asia’s total cross-border financial asset holdings reached                              border total bank claims (including loans, deposits, debt
     $21.0 trillion at the end of 2019, which was significantly                              securities, and other instruments) continued to rise in
     greater than $14.1 trillion registered at the end of 2015                               2019 to $6.6 trillion, from $6.3 trillion in 2018.

     25
          Asia’s reporting economies include Australia; Bangladesh; Hong Kong, China; India; Indonesia; Japan; Kazakhstan; Malaysia; Mongolia; New Zealand;
          Pakistan; Palau; the People’s Republic of China; the Philippines; the Republic of Korea; Singapore; and Thailand.
     26
          The values reported for total cross-border assets, liabilities, and net position do not reflect total values in the International Investment Position. This
          is because reported values include only those with available bilateral breakdown to decompose regional and non-regional holdings and liabilities.
          Throughout this chapter, cross-border investment holdings include foreign direct investment (FDI), portfolio equity, portfolio debt, and banking sector
          loan and deposit assets (claims) and liabilities. Unlike previous editions of this report, banking sector cross-border claims and liabilities refer to loans and
          deposits instead of total claims and liabilities, which include debt securities and other instruments.
     27
          The overall increase or decrease in stock portfolio holdings and liabilities is attributed to changes in flows and valuation changes of existing portfolio
          holdings and liabilities.
Financial Integration      77

The region’s total external financial liabilities also                                     from 18.3% in the same period. Asia’s banking sector
inched higher to $20.9 trillion by the end of 2019, up                                     cross-border liabilities (including loans, deposits, debt
from $15.7 trillion for 2015 (Figure 4.15). Most of the                                    securities, and other instruments) slightly increased
region’s liabilities at the end of 2019 were foreign direct                                in 2019 to $3.8 trillion from $3.7 trillion in 2018. The
investments ($9.3 trillion), followed by portfolio equity                                  fact that Asian banks’ cross-bank claims exceed their
($5.6 trillion), portfolio debt ($3.2 trillion), and then                                  cross-border liabilities highlights the region’s role as a net
banking sector loan and deposit liabilities ($2.8 trillion).                               global lender, while the downward trending intraregional
Two-thirds of these liabilities were held by non-regional                                  shares imply Asian banks’ increasing integration within
economies, and one-third by regional economies. As                                         the global banking network.
two-thirds of Asia cross-border investment holdings and
liabilities were placed in non-regional economies and                                      As the region held more debt assets than debt liabilities,
in the form of direct investments, the region remained                                     but more equity liabilities than equity assets, it retained
exposed to changing non-regional profit earnings outlook,                                  its long debt, short equity position as of the end of
investor sentiment, and liquidity conditions (Box 4.1).                                    2019. The net debt position rose from $1.2 trillion at
                                                                                           the end of 2015 to $1.5 trillion at the end of 2019, while
Inward debt portfolio investment grew to $3.2 trillion                                     the net equity position improved from –$2.8 trillion in
in 2019, from $2.9 trillion in 2018, while the value of                                    2015 to -$1.3 trillion in 2019. The major share of its long
inward equity portfolio investment rose considerably to                                    debt and short equity positions were with non-regional
$5.6 trillion, after dropping to $4.7 trillion in 2018. The                                economies, as of the end of 2019, mirroring the regional
intraregional share of inward portfolio debt holdings                                      breakdown of its international investment assets and
increased to 28.8% in 2019 from 27.1% in 2018, and                                         liabilities. Annex 4a provides additional discussions on
that of inward portfolio equity investment rose to 19.0%                                   trends in Asia’s cross-border assets and liabilities.

Figure 4�15: Cross-Border Liabilities—Asia
                                                      a: 2015                                                          b: 2019

                          Intraregional share,                      Intraregional share,      Intraregional share,                 Intraregional share,
                          Asia: 37.2%                                       Asia: 26.9%       Asia: 37.5%                                  Asia: 28.8%

                          Bank liabilities                              Portfolio debt        Bank liabilities                         Portfolio debt
                          $2.2 trillion, 14.0%                      $2.4 trillion, 15.2%      $2.8 trillion, 13.2%                 $3.2 trillion, 15.1%

                                                   $15.7 trillion                                                     $20.9 trillion

                            FDI                                                                FDI                                    Portfolio equity
                            $7.3 trillion, 46.1%                       Portfolio equity        $9.3 trillion, 44.6%
                                                                    $3.9 trillion, 24.8%                                           $5.6 trillion, 27.1%

                            Intraregional share,                Intraregional share,           Intraregional share,                Intraregional share,
                            Asia: 44.2%                                 Asia: 17.6%            Asia: 42.6%                                 Asia: 19.0%

FDI = foreign direct investment.
Notes: FDI liabilities refer to inward FDI holdings. Bank liabilities are limited to loans and deposits. Asia includes ADB regional members for which data are available.
Sources: ADB calculations using data from the Bank for International Settlements. Locational Banking Statistics. https://www.bis.org/statistics/bankstats.htm (accessed
October 2020); International Monetary Fund (IMF). Coordinated Direct Investment Survey. http://cdis.imf.org (accessed December 2020); and IMF. Coordinated
Portfolio Investment Survey. http://cpis.imf.org (accessed September 2020).
78   Asian Economic Integration Report 2021

       box 4�1: global Financial Risk and banking sector Flows

       Asia and the Pacific rely heavily on the banking sector                                        relationship evolves during episodes of global financial
       for cross-border financial intermediation. Yet cross-                                          uncertainty. For example, both the 2008 global financial
       border bank flows or transactions, either within or                                            crisis and onset of the COVID-19 pandemic in 2020
       outside the region, are channels through which policies                                        led to heightened investor risk aversion, as measured by
       and risks spill over across economies. They depend on                                          the Chicago Board Options Exchange’s volatility index
       a host of factors, including similarities and familiarities,                                   (VIX). Do these and similar episodes of global financial
       economic linkages, and transaction costs. Based on                                             uncertainties exacerbate information asymmetries,
       the asset trade literature, it is expected that economies                                      leading to a greater decline in bilateral bank flows
       closer to one another tend to have greater economic                                            between economies that are more distant? Or do banks
       ties; lower information asymmetries and transaction                                            reduce transactions more with economies that are closer
       costs; and are more similar compared with those that                                           or with less information asymmetries?
       are farther apart.a Banks are, likewise, expected to
                                                                                                      To address this question, quarterly adjusted bilateral
       lend more to international customers about whom
                                                                                                      banking sector data were used, ranging from the first
       information is easily obtained and monitoring costs are
                                                                                                      quarter of 2004 to the first quarter of 2020 for 44 Asia
       lower. Consequently, cross-border bank flows tend to
                                                                                                      and Pacific economies and their bilateral regional and
       be greater among economies with closer geographic
                                                                                                      non-regional counterparty economies using the Bank for
       proximity. The empirical literature offers a wide range
                                                                                                      International Settlements’ Locational Banking Statistics.
       of evidence showing the inverse relationship between
                                                                                                      Adjusted values were used to capture banking sector
       cross-border banking flows and information asymmetries
                                                                                                      cross-border flows.b The data refer to total banking
       (Brei and von Peter 2018; Herrmann and Mihaljek 2013).
                                                                                                      liabilities based on reported values of counterparty
       As bilateral bank flows tend to decline as information                                         economies. A gravity equation was estimated including
       asymmetries increase, it is of interest to assess how this                                     bilateral factors such as distance, trade, colonial
                                                                                                      relationship, common spoken language, and common
                                                                                                      legal origins. Country, partner, and year fixed effects
       box Figure: Conditional Marginal effects of Cboe                                               were also included. VIX and an interaction term between
       Vix with 95% Cis                                                                               VIX and distance were added.c But since the interacted
                                     0.05
                                                                                                      variables are both continuous, we report marginal effects
                                                                                                      of an increase in VIX on bilateral banking sector liabilities
                                                                                                      at different levels of distance.d
       of liabilities all (% NGDP)
         Effects on linear pred.

                                     0.00
                                                                                                      The conditional marginal effects suggest that the region’s
                                                                                                      bilateral bank inflows decline more for economies that
                                     -0.05                                                            are closer to one another when global risk aversion
                                                                                                      rises. In contrast, it decreases less or even increases at
                                     -0.10                                                            some point for more distant economies when global
                                                                                                      risk increases. For instance, log distance 9 and 10
                                                                                                      reflect the distance between East Asia with Europe
                                     -0.15
                                             6   7       8             9             10               and the Americas. Hence, we do not find any evidence
                                                                                                      that global risks exacerbate information asymmetries,
                                                     Distance (log)
                                                                                                      based on our sample. On the contrary, we provide more
       CBOE = Chicago Board Options Exchange, CIs = confidence intervals,                             evidence that global financial risks can have greater
       NGDP = nominal gross domestic product.
                                                                                                      regional impact, in line with Mercado (2020). This
       Sources: ADB calculations using data from the Bank for International                           finding may reflect the limited degree of regional banking
       Settlements. Locational Banking Statistics. https://www.bis.org/
       statistics/bankstats.htm; Centre d’Etudes Prospectives et d’Informations
                                                                                                      integration in the region and offers support on the
       Internationales (the French Research Center in International Economics).                       importance and significance of regional financial safety
       GeoDist database. http://www.cepii.fr/CEPII/en/welcome.asp; and                                net initiatives.
       International Monetary Fund. Direction of Trade Statistics. https://data.imf.
       org/DOT (all accessed August 2020).

       a
             See Choi, Rhee, and Oh (2014), Portes, Rey, and Oh (2001), and Portes and Rey (2005) on portfolio flows; Brei and von Peter (2018), Herrmann and Mihaljek
             (2013), and Papaioannou (2009) on bank flows; di Giovanni (2005) on mergers and acquisitions; and Daude and Fratzscher (2008) and Mercado (2020) on all
             types of foreign- and domestic-driven investment flows.
       b
             The values were adjusted by exchange rate changes as well as structural breaks from the bilateral holdings data.
       c
             See Mercado (2020) for similar approach using total bilateral capital flows.
       d
             Distance were in log values, and bilateral banking liabilities flows are in percent of an economy’s annual nominal GDP.
       Source: Asian Development Bank.
Financial Integration          79

The currency compositions of Asia’s                                                       size of the effects will depend on the individual economy’s
international investment assets and liabilities                                           degree of financial integration, such that the greater the
indicate the prominence of the US dollar.28                                               financial integration measure, the stronger the valuation
                                                                                          gains or losses will be, and, hence, the corresponding
Almost half of Asia’s international asset holdings                                        welfare effects. Moreover, the dominance of the US dollar
were denominated in US dollars (USD) as of the end                                        implies that changes in the exchange rate versus the
of 2019, followed by other currencies (OTH) at 18%                                        dollar will have stronger valuation and welfare impacts
and then euros (EUR) at 11%. In contrast, almost two-                                     compared with other currencies.
thirds of its external liabilities were dominated in local
currencies (LCU), followed by USD at 25% (Figure 4.16).                                   Across types of investments, equity-type assets, which
Consequently, the region had a foreign currency net asset                                 include FDI equity and portfolio equity, were mostly
position and local currency net liabilities position. As the                              denominated in other currencies as it is assumed that
currency shares remained largely stable over the past                                     currency composition of these investments closely
decade, these are unlikely to change considerably, at least                               track geographic positions. Equity-type liabilities were
in the short term (Figure 4.17). Asia’s foreign and local                                 denominated in local currency as foreign direct and
currency net positions suggest that a uniform movement                                    portfolio equity ownerships are mostly denominated in
of regional currencies versus all currencies will generate                                the host country currency (Figure 4.18a). The currency
welfare effects through valuation gains or losses. But the                                compositions of debt-type investments highlight the

Figure 4�16: Currency Composition of Asia's International Investment Positions (%)

                                          a: Total Assets—2019                                                b: Total Liabilities—2019

                                                                                                      CNY, 0.7
                                                      LCU, 6.3                               JPY, 1.2                 OTH, 5.5
                                                                                              GBP, 0.7
                                                                                               EUR, 3.6
                                        OTH, 17.5

                                  CNY, 9.0                                                                   USD, 25.0
                      JPY, 2.0                          USD, 49.1                                                               LCU, 63.5
                        GBP, 5.3
                                          EUR,
                                          10.8

CNY = yuan, EUR = euro, GBP = pound, JPY = yen, LCU = local currency unit, OTH = other currencies, USD = United States dollar.
Notes:
(i) CNY and JPY are classified as LCU for the People’s Republic of China and Japan, respectively.
(ii) Values were estimated using currency weights for 2017 and International Investment Positions for 2019, and shown as percent of total.
(iii) OTH shares were derived as residual values.
(iv) Asia includes Australia; Hong Kong, China; India; Indonesia; Japan; Malaysia; New Zealand; Pakistan; the People’s Republic of China; the Philippines; the Republic of
Korea; Singapore; Sri Lanka; and Thailand.
Sources: ADB calculations using data from Bénétrix et al. (2019); and International Monetary Fund. Balance of Payments and International Investment Position Statistics.
http://data.imf.org/IIP (accessed September 2020).

28
     In this analysis, we use the currency decomposition of the International Investment Position (IIP), which reports the total external assets and liabilities
     of all sectors across all types of instruments, providing comprehensive analysis on currency breakdown. The primary data set used comes from Bénétrix
     et al. (2019) and includes the IMF Survey on currency composition of IIP for selected economies, including those from the Asia and Pacific region.
     Their data set updated the currency composition data set of Lane and Schambaugh (2010a), Lane and Schambaugh (2010b), and Bénétrix, Lane, and
     Schambaugh (2015) by adding institutional surveys and national sources.
80   Asian Economic Integration Report 2021

     Figure 4�17: Currency Shares of Asia's international investment Assets and Liabilities (share of total)

                                       a: Total Assets                                                                        b: Total Liabilities

                  0.7                                                                                    0.7
                  0.6                                                                                    0.6
                  0.5                                                                                    0.5
                  0.4                                                                                    0.4
                  0.3                                                                                    0.3
                  0.2                                                                                    0.2
                   0.1                                                                                   0.1

                  0.0                                                                                    0.0
                         2010 2011 2012 2013 2014 2015 2016 2017                                               2010 2011 2012 2013 2014 2015 2016 2017

                                           CNY             EUR             GBP           JPY             LCU           OTH             USD

     CNY = yuan, EUR = euro, GBP = pound, JPY = yen, LCU = local currency unit, OTH = other currencies, USD = United States dollar.
     Notes:
     (i) CNY and JPY are classified as LCU for the People’s Republic of China and Japan, respectively.
     (ii) OTH shares were derived as residual values.
     (iii) Data refer to annual median shares of individual economies.
     (iv) Asia includes Australia; Hong Kong, China; India; Indonesia; Japan; Malaysia; New Zealand; Pakistan; the People’s Republic of China; the Philippines; the Republic of
     Korea; Singapore; Sri Lanka; and Thailand.
     Sources: ADB calculations using data from Bénétrix et al. (2019); and International Monetary Fund. Balance of Payments and International Investment Position Statistics.
     http://data.imf.org/IIP (accessed September 2020).

     Figure 4�18a: Currency Composition of Asia's international Equity investments (%)

                                    i: Equity Assets—2019                                                           ii: Equity Liabilities—2019

                                                 LCU, 4.9

                                 OTH, 34.9               USD, 24.0

                                                                                                                                  LCU,
                                                                         EUR, 6.3
                                                                                                                                 100.0
                                       CNY, 20.9
                                                                GBP, 7.3
                                                           JPY, 1.8

     CNY = yuan, EUR = euro, GBP = pound, JPY = yen, LCU = local currency unit, OTH = other currencies, USD = United States dollar.
     Notes:
     (i) CNY and JPY are classified as LCU for the People’s Republic of China and Japan, respectively.
     (ii) Values were estimated using currency weights for 2017 and International Investment Positions for 2019, and shown as percent of total.
     (iii) OTH shares were derived as residual values.
     (iv) Equity investments include foreign direct investment equity and portfolio equity.
     (v) Asia includes Australia; Hong Kong, China; India; Indonesia; Japan; Malaysia; New Zealand; Pakistan; the People’s Republic of China; the Philippines; the Republic of
     Korea; Singapore; Sri Lanka; and Thailand.
     Sources: ADB calculations using data from Bénétrix et al. (2019); and International Monetary Fund. Balance of Payments and International Investment Position Statistics.
     http://data.imf.org/IIP (accessed September 2020).
Financial Integration         81

dominance of the US dollar. For debt assets, which                                       to lower imports. But prices faced by export partners
include FDI debt, portfolio debt, other investments, and                                 will not change because their exchange rate relative to
official reserves, about 63% were denominated in the US                                  dominant currency remains unchanged. Consequently,
dollar, followed by the euro (13%) and other currencies                                  the country’s exports remain the same (Adler et al. 2020).
(9%). In contrast, half of debt liabilities, including FDI                               Hence, under dominant currency pricing, a depreciation
debt, portfolio debt, and other investments, were                                        of the domestic exchange rate leads to lower imports, and
denominated in US dollars, followed by local currency                                    muted response of export volume in the short term.
(28%), and other currencies (10%) (Figure 4.18b).
                                                                                         In Asia, most recent available data indicate that around
                                                                                         87% of the region’s merchandise good exports were
The dominance of the US dollar is more                                                   invoiced in the US dollar, although the US accounted
pronounced on the region’s trade invoices.                                               for only about 9% of the region’s merchandise exports
                                                                                         (Figure 4.19). A similar pattern emerges for merchandise
Recent studies have shown the dominant role of the US                                    good imports. Around 77% of the region’s imports were
dollar in the pricing of merchandise exports and imports,                                invoiced in the US dollar, but the US accounted for only
despite the relatively lower share of the US on bilateral                                about 5% of the region’s merchandise imports. The
trade (Adler et al. 2020; Boz et al. 2020; Gopinath 2015;                                dominance of the US dollar in the region’s trade invoicing
and IMF 2019a). For instance, exports of an economy                                      was striking when compared with other economies
are mostly priced in US dollars even if it trades with                                   (Figure 4.20). For other emerging and developing
economies other than the US. The dominant currency                                       economies, around 57% of exports and 48% of imports
pricing paradigm implies when a country’s exchange rate                                  were invoiced in US dollar; and a significant share
depreciates, its import prices rise in the short term, leading                           was in euros.

Figure 4�18b: Currency Composition of Asia’s international Debt investments (%)

                               i: Debt Assets—2019                                                             ii: Debt Liabilities—2019

                         CNY, 1.5                                                                   CNY, 1.3
                        JPY, 2.1                                                                 JPY, 2.2
                                             OTH, LCU,                                                                   OTH,
                                                                                                    GBP, 1.3
                         GBP, 3.9            9.2   7.0                                                                   10.3

                                                                                                    EUR, 7.1                         LCU, 27.9

                                   EUR, 13.4

                                                     USD, 62.9
                                                                                                                           USD, 49.9

CNY = yuan, EUR = euro, GBP = pound, JPY = yen, LCU = local currency unit, OTH = other currencies, USD = United States dollar.
Notes:
(i) CNY and JPY are classified as LCU for the People’s Republic of China and Japan, respectively.
(ii) Values were estimated using currency weights for 2017 and International Investment Positions for 2019, and shown as percent of total.
(iii) OTH shares were derived as residual values.
(iv) Equity investments include foreign direct investment equity and portfolio equity.
(v) Asia includes Australia; Hong Kong, China; India; Indonesia; Japan; Malaysia; New Zealand; Pakistan; the People’s Republic of China; the Philippines; the Republic of
Korea; Singapore; Sri Lanka; and Thailand.
Sources: ADB calculations using data from Bénétrix et al. (2019); and International Monetary Fund. Balance of Payments and International Investment Position Statistics.
http://data.imf.org/IIP (accessed September 2020).
82   Asian Economic Integration Report 2021

     Figure 4�19: asia's trade with the united states and us                                                     The US dollar share of trade invoicing varies across the
     dollar invoicing (%)                                                                                        region. For merchandise exports, dollar trade invoicing
                                                                                                                 was highest for Southeast Asia, followed by Central
                                        100 TIM_MAZE_X TIM_X    MLD_X                                   CAM_X

                                         90
                                             UZB_X CAM_M
                                                 KAZ_X IND_M        INO_X                                        Asia and India. For merchandise imports, the share was
                                                                       TAP_X                   PAK_X
     Share of US dollar trade invoice

                                                        INO_M
                                        MLD_M
                                         80 SOL_X
                                                   GEO_X PAK_M
                                                   UZB_M AUS_X
                                                                           IND_X
                                                                   MAL_X KOR_X
                                                                         KOR_M
                                                                                                                 largest in India followed by Southeast Asia. Among the
                                                 KGZ_M         MAL_M
                                                                         THA_X
                                                                                                                 subregions, the Pacific and Oceania reported the lowest
          to total trade invoice

                                                                  TAP_M
                                                             GEO_M
                                         70    ARM_X    THA_M        JPN_M

                                         60
                                              MON_X
                                               SOL_M
                                                         AZE_M
                                                                 NZL_X                                           US dollar trade invoicing, although it was still significantly
                                                         ARM_M

                                         50   KGZ_X    MON_M          AUS_M
                                                                                      JPN_X
                                                                                                                 higher than for non-Asian economies for merchandise
                                                      KAZ_M    NZL_M

                                         40       FIJ_M
                                                                                                                 exports. Moreover, the region’s US dollar share of
                                         30                                                                      trade invoicing was stable over the past 2 decades
                                         20                                                                      (Figure 4.21). The high share of US dollar trade invoicing
                                         10                                                                      in Asia may reflect the importance of strategic same-
                                          0
                                                                                                FIJ_X
                                                                                                                 currency pricing with competitors; as well as the use of
                                              0          5      10         15        20         25          30   imported US-dollar-priced intermediate inputs of the
                                                     Share of US bilateral trade to total trade                  region’s exporters.
     ARM = Armenia; AZE = Azerbaijan; CAM = Cambodia; FIJ = Fiji; GEO = Georgia;
     KAZ = Kazakhstan; KGZ = Kyrgyz Republic; IND = India; INO = Indonesia;                                      A high US dollar trade invoicing entails several policy
     JPN = Japan, KOR = Korea, Republic of; MAL = Malaysia; MLD = Maldives;
     MON = Mongolia; NZL = New Zealand; PAK = Pakistan; SOL = Solomon Islands;
                                                                                                                 concerns in the short-term horizon. First, dominant
     TAP = Taipei,China; TIM = Timor-Leste; THA = Thailand; US = United States;                                  currency pricing weakens external rebalancing
     UZB = Uzbekistan; _X = merchandise exports; _M = merchandise imports.
                                                                                                                 mechanism. Specifically, the muted response of export
     Notes: Values are relative shares to total. Values refer to latest year data are available.
                                                                                                                 volumes to exchange rate movements implies that
     Sources: ADB calculations using Boz et al. (2020) data set; and International
     Monetary Fund. Direction of Trade Statistics. http://data.imf.org/DOT (accessed                             much of the external rebalancing takes place through
     September 2020).
                                                                                                                 import compression. Second, unilateral movement of
                                                                                                                 the US dollar against all other currencies may cause

     Figure 4�20: united states dollar and other Currency
     trade invoicing (%)
                                                                                                                 Figure 4�21: Currency shares of asia's trade invoice (%)
         100
                                                                  15                                             50                                                                         100
                                                                                                       23
                80                                       43                                                      45                                                                         90
                                                                                          52
                                                                                                                 40                                                                         80
                60                         78                                73
                                                                                                                  35                                                                        70
                                                                                                                 30                                                                         60
                40                                                85                                             25                                                                         50
                                                                                                       77
                                                         57                                                      20                                                                         40
                                                                                          48
                20                                                                                                15                                                                        30
                                           22                                27
                                                                                                                  10                                                                        20
                         0                                                                                         5                                                                        10
                                           AE       EMDE         AP          AE        EMDE            AP          0                                                                        0
                                                                                                                        2011

                                                                                                                        2013

                                                                                                                        2015

                                                                                                                        2017
                                                                                                                        2012

                                                                                                                        2016

                                                                                                                        2019
                                                                                                                        2014

                                                                                                                        2018
                                                                                                                       2001

                                                                                                                       2010
                                                                                                                       2003

                                                                                                                       2005

                                                                                                                       2007
                                                                                                                       2002

                                                                                                                       2006

                                                                                                                       2009
                                                                                                                       2004

                                                                                                                       2008
                                                                                                                       2000

                                                    Exports                           Imports

                                                  United States dollar             Other currencies                     EUR_X (left)               EUR_M (left)                OTH_X (left)
                                                                                                                        OTH_M (left)               USD_X (right)               USD_M (right)
     AE = advanced economies, AP = Asia and Pacific economies, EMDE = other
     emerging and developing economies.                                                                          EUR = euro, OTH = other currencies, USD = United States dollar, _M = imports,
                                                                                                                 _X = exports.
     Notes: Asia and Pacific economies include Armenia; Azerbaijan; Cambodia; Fiji;
     Georgia; India; Indonesia; Japan; Kazakhstan; the Republic of Korea; the Kyrgyz                             Note: Asia includes Armenia; Azerbaijan; Cambodia; Fiji; Georgia; India;
     Republic; Malaysia; Maldives; Mongolia; New Zealand; Pakistan; Solomon Islands;                             Indonesia; Japan; Kazakhstan; the Kyrgyz Republic; Malaysia; Maldives; Mongolia;
     Taipei,China; Thailand; Timor-Leste; and Uzbekistan. Data refer to the average of                           New Zealand; Pakistan; the Republic of Korea; Solomon Islands; Taipei,China;
     regional annual median values from 2000 to 2019.                                                            Thailand; Timor-Leste; and Uzbekistan.
     Source: ADB calculations using Boz et al. (2020) data set.                                                  Source: ADB calculations using data from Boz et al. (2020).
Financial Integration    83

contractionary or expansionary effect on global trade.           as emerging economies exhibit particularly high and
For instance, an appreciation of the US dollar versus all        rising debt levels (Figure 4.22), with Hong Kong, China;
other currencies will raise domestic prices of imports for       the PRC; the Republic of Korea; and Singapore exhibiting
other economies. This, in turn, will lower import demand,        strong increases as of 2020 compared with 2010. While
which will lead to less global trade (Adler et al. 2020).        public debt levels have increased throughout
Third, the dominant currency pricing is intertwined with         Asia since 2010, especially in Japan, private debt
dominant currency financing, whereby the US dollar               (i.e., corporate and household) has risen considerably in
is commonly used in cross-border corporate external              developing Asia, most notably in Hong Kong, China;
financing (Figure 4.18b). The dominance of the US                the PRC; the Republic of Korea; Singapore; and
dollar in trade invoicing leads to a larger demand for US        Thailand. The current pandemic could expose the
dollar deposits, which makes US dollar funding cheaper           already heavily indebted economies in the region to
than other currencies (Gopinath and Stein 2018). This            additional challenges, as large-scale policy responses
reinforces US dollar dominance in both trade pricing             to COVID-19 will inevitably result in increased
and financing.                                                   debt. The increase is expected to materialize
                                                                 across all sectors, amid (i) fiscal spending at large
                                                                 scale, (ii) accommodative monetary policy resulting
looming financial risks                                          in low interest rates for firms and households, and
                                                                 (iii) revenue reduction due to lackluster economic
stemming from CoViD-19                                           growth. It is estimated that Asia’s public debt-to-
                                                                 GDP ratio could rise from 56.7% in 2019 to 65.8% in
COVID-19 has unraveled global financial markets,                 2020, and to 69.4% by 2021 (IMF 2021). Transiting
putting Asia’s financial resilience to a test and raising the    toward normalized fiscal balances post-COVID-19 will
specter of financial volatility and instability in the region.   be crucial to assuring debt sustainability in the region
Although financial market jitters were quickly quelled           moving forward.
through swift and aggressive policy interventions around
the globe, it still reveals several looming financial risks
that policy makers need to consider. Already high levels         Looming risks of high debt levels
of debt, both sovereign and private, will inevitably             could weaken Asia’s banking and
increase, with the possibility that a deterioration of debt      corporate sectors.
quality in the aftermath of the pandemic will threaten
regional banking sector stability. Furthermore, the              In case interest rates would normalize, interest payments
pandemic exposed the Asian banking sector’s structural           and debt rollover risks may arise. A possible sluggish
vulnerability given the liquidity mismatches associated          economic recovery, combined with ballooning debt
with increased international activity and a reliance on US       levels, could prompt credit rating agencies to downgrade
dollar funding by non-US banks.                                  certain economies’ creditworthiness, further lifting
                                                                 interest rates and exacerbating these risks. As for private
                                                                 sector debt, the risks are similar as weaker corporate
The COVID-19 pandemic poses an ongoing                           earnings and worsening credit conditions could result in
challenge to regional economies with                             insolvencies weighing on banking sector resilience and
elevated debt levels as large-scale policy                       producing adverse social effects.
responses could entail further
debt accumulation.                                               This in turn could spell trouble for Asian banks and
                                                                 corporations, particularly micro, small, and medium-
A decade of historically low interest rates since the global     sized enterprises (MSMEs), due to the looming risk
financial crisis has resulted in elevated debt-to-GDP            of debt quality deterioration. Given the dominant
ratios globally. This pattern also played out in Asia,           role of banks in Asia’s financial systems, this could
84   Asian Economic Integration Report 2021

     Figure 4�22: sectoral debt, 2010 versus 2020*—asia (% of GDP)

                                                   a: Total Debt                                                              b: Sovereign Debt

                    700                                                                           300
                                                               HKG
                    600                                        JPN
                                                                                                  250                                              JPN

                    500
                                                                SIN                               200
                    400                           KOR
                                            PRC

                                                                                          2020
             2020

                                                                                                  150                     SIN
                    300                THA                                                             PRC
                                                   AUS
                                      IND                                                         100 THAPHIPAK
                    200         PHI               NZL
                              INO                                                                    AUS
                                                                                                                        IND
                    100                       MAL                                                  50                  HKG
                                      PAK                                                                    KOR
                                                                                                                       MAL
                                                                                                            NZL
                                                                                                                     INO
                      0                                                                             0
                          0      100        200    300     400        500    600    700                 0       50        100        150     200         250   300
                                                        2010                                                                     2010

                                              c: Corporate Debt                                                            d: Household Debt
                    500                                                                            150
                                                                HKG

                    400                                                                            120                                       AUS
                                                          SIN                                                                         KOR
                                                                                                                                HKG

                    300                                     JPN                                    90                                          NZL
             2020

                                                                                          2020

                                                                                                                          THA        MAL
                                       PRC        KOR                                                              PRC
                    200                                                                            60
                               MAL                                                                                               JPN
                             THA                                                                                          SIN
                           IND      AUS
                    100 PHI                                                                        30          INO
                        PAK      NZL                                                                     PAK     PHI
                                INO                                                                            IND
                      0                                                                             0
                          0       100             200           300         400     500                  0           30         60           90          120     150
                                                         2010                                                                         2010

                                                          Emerging Asia            Mature Asia                 45-degree line

     * = As of Q3 2020.
     AUS = Australia; GDP = gross domestic product; HKG = Hong Kong, China; IND = India; INO = Indonesia; JPN = Japan, KOR = Republic of Korea; NZL = New Zealand;
     PAK = Pakistan; PHI = Philippines; PRC = People’s Republic of China; SIN = Singapore; THA = Thailand.
     Notes: Economy grouping based on Institute of International Finance definition. Emerging Asia includes HKG, IND, INO, KOR, MAL, PAK, PHI, PRC, SIN, and THA.
     Mature Asia includes AUS, JPN, and NZL.
     Source: Institute of International Finance. Global Debt Monitor December 2020. https://www.iif.com/Research/Capital-Flows-and-Debt/Global-Debt-Monitor (accessed
     January 2021).

     breed widespread financial instability and drag on                                          (Figure 4.23), safeguarding banking sector health
     economic recovery. As banks remain the biggest                                              is a prerequisite for sustained economic development
     source of corporate financing in emerging Asia                                              and recovery post-COVID-19.
Financial Integration      85

Figure 4�23: Corporate Financing—Emerging Asia (% of GDP)                             social effects. Usually, MSMEs, representing the backbone
140                                                                                   of the economies, would be the most vulnerable in case
120                                                                                   credit conditions tighten. It is therefore important to prepare
                                                                                      for a smooth transition, to monitor financial health of banks
100
                                                                                      and assure sufficient credits to solvent MSMEs.
  80

  60

 40
                                                                                      Deterioration of banking and corporate sector
                                                                                      debt quality could undermine economic
  20
                                                                                      recovery and weaken future growth.
   0
                1999                     2009                    2019
                                                                                      Past crises have shown that problems associated with
               Corporate bonds             Stock market capitalization                debt quality can have long-lasting effects on the finance
                                       Bank credit                                    sector, still weighing on banks’ balance sheets years after
GDP = gross domestic product.                                                         the crisis. In Asia, more than 2 decades after the Asian
Notes:                                                                                financial crisis, NPL ratios in the region have stabilized
(i) Emerging Asia includes India, Indonesia, the Republic of Korea, Malaysia, the     at a considerably lower level than during crisis periods,
    People’s Republic of China, the Philippines, Thailand, and Viet Nam.
                                                                                      also due to strong postcrisis reforms, a combination
(ii) 1999 corporate bond data for the Republic of Korea, Malaysia, the Philippines,
     Thailand, and Viet Nam as of 2000; and 1999 stock market capitalization data     of micro- and macroprudential policies, and sound
     for Viet Nam as of 2000.
                                                                                      macroeconomic conditions. However, in some Central,
(iii) 2009 corporate data as of 2010 for India; and 2009 stock market
      capitalization data for Indonesia as of 2010.                                   East, and South Asian economies, NPL ratios have been
Sources: AsianBondsOnline; CEIC; Haver Analytics; and national sources (all           rising recently (Figure 4.24). Although moderate relative
accessed April 2020).
                                                                                      to levels during the Asian financial crisis, increasing NPL

Credit conditions could tighten when                                                  Figure 4�24: Development of nPLs, 2015 versus 2019—
temporary financial relief extended to the                                            Selected Asian Economies (NPL ratio, %)
corporate sector is lifted and regulatory                                                                    25
forbearance phased out, highlighting risks of
rising nonperforming loans (NPLs).                                                                           20
                                                                                                                                                            TAJ
                                                                                       NPL ratio, 2019 (%)

Should corporate earnings fall, corporations will face
                                                                                                             15
challenges in their debt servicing capacity, possibly resulting
in defaults. Thus far, large-scale fiscal stimulus helped                                                                       AZE
                                                                                                                                      MON
                                                                                                             10
considerably to prevent the occurrence of corporate                                                                    PHI        IND BAN
                                                                                                                                            PAK
                                                                                                                                                    MLD
                                                                                                                        INO         KGZ KAZ
defaults, while regulatory forbearance has relieved pressure                                                  MAL        THA
from banks in addressing NPLs. Ample liquidity has been                                                       5
                                                                                                              CAM
                                                                                                                          SRI          ARM
                                                                                                                                GEO
provided to the corporate sector to avoid an insolvency                                                      JPN
                                                                                                                             VIE
crisis. However, when temporary relief is lifted and regulatory                                               0       HKG
                                                                                                                       KOR 5
                                                                                                                              PRC
                                                                                                                  0                     10          15            20    25
forbearance tapers off, corporate defaults may
                                                                                                                                      NPL ratio, 2015 (%)
materialize, and banks could become exposed to rising
                                                                                                                                          45-degree line
NPLs. This, in turn, could contribute to a deterioration
                                                                                      ARM = Armenia; AZE = Azerbaijan; BAN = Bangladesh; CAM = Cambodia;
in banks’ balance sheets and therefore impede their                                   GEO = Georgia; HKG = Hong Kong, China; IND = India; INO = Indonesia; JPN = Japan;
capacity for financial intermediation, and thus result in                             KAZ = Kazakhstan; KGZ = Kyrgyz Republic; KOR = Republic of Korea; MAL = Malaysia;
                                                                                      MON = Mongolia; MLD = Maldives; NPL = nonperforming loan; PAK = Pakistan;
negative macrofinancial effects. In addition, financial                               PHI = Philippines; PRC = People’s Republic of China; SRI = Sri Lanka; TAJ = Tajikistan;
instability and an economic downturn could                                            THA = Thailand; VIE = Viet Nam.
                                                                                      Source: ADB calculations using data from Central Bank of Mongolia. https://www.
disproportionately affect MSMEs, which typically do not                               mongolbank.mn/eng; CEIC; the International Monetary Fund. Financial Soundness
have access to capital markets, further amplifying adverse                            Indicators. https://data.imf.org; and World Bank. World Development Indicators.
                                                                                      http://databank.worldbank.org/data/reports.aspx?source=world-development-
                                                                                      indicators (all accessed July 2020).
86   Asian Economic Integration Report 2021

     ratios, alongside the buildup of debt and default risks,            their macrofinancial and possible spillover effects
     pose challenges to financial stability in the region. Given         (Park and Shin 2020a).
     the nature and persistence of NPLs, these challenges
     may last beyond the actual COVID-19 pandemic.                       Empirical evidence shows that emerging market borrowers
                                                                         could suffer a significant increase in capital outflows if the
     Experiences of other regions, like the European sovereign           NPL ratios of both lenders and borrowers rise. This has
     debt crisis, illustrate the long-lasting effects of deteriorating   been evidenced from 2000 to 2017, as globally active
     debt quality. The global financial crisis and succeeding            lenders withdrew capital from emerging market borrowers
     European sovereign debt crisis reversed a downward trend in         when they experienced a rise in NPL ratios. Park and
     NPL ratios in the euro area, with certain economies, mainly         Shin (2020a) find that international banks withdraw
     in Southern Europe, severely affected. In spite of a gradual        funds from emerging economies in response to the
     decline to 3.6% in 2019, the euro area NPL ratio remained           increase in the NPL ratios of either advanced or emerging
     three times higher than equivalent ratios in the US and the         economies, or both (Table 4.1). Given the looming risk of a
     United Kingdom in that year, and precrisis levels have not          rise in credit risk in the wake of the COVID-19 pandemic,
     yet been reached. This underlines the strong persistence of         regional policy makers need to carefully monitor financial
     NPL ratios and the sustained impact they have on banking            conditions and take preemptive action today.
     sector health.
                                                                         table 4�1: impact of nonperforming Loans on Banking
     The significance of banking sector instability and a                Outflows from Emerging Market Economies
     rise in distressed assets is further underscored by                 (LBS total cross-border foreign claims)
     the macrofinancial feedback effects of NPLs. Empirical
                                                                          Variables                   (1)         (2)          (3)          (4)         (5)
     investigation of the determinants and effects of bank-
                                                                          NPL ratio lender        0.851*** 0.909*** 0.688*** 0.875*** 0.696***
     specific NPLs in Asia points to the effect NPLs have on                                      [0.088] [0.114] [0.118] [0.119] [0.121]
     the real economy and financial variables. In particular,             NPL ratio borrower                   0.519*** 0.481*** 0.587*** 0.495***
     a rise in NPL ratio prompts a reduction in gross domestic                                                 [0.044] [0.045] [0.051] [0.049]
     product, a tightening of credit supply, and an increase              Year fixed effects         No           No           Yes          No          Yes
     in unemployment rate (ADB 2017; Lee and Rosenkranz                   R-squared                 0.008        0.03        0.084        0.049         0.111
     2020).                                                               Observations              11,113       6,176        6,176       4,428        4,428

                                                                         LBS = locational banking statistics, NPL=nonperforming loan.
                                                                         Notes: The dependent variable is the growth rate of banking outflows calculated using
     The growing interconnectedness of Asian                             BIS LBS total cross-border foreign claims. Columns (1), (2) and (4) are estimated by
                                                                         pooled ordinary least squares. Year fixed effects are added in columns (3) and (5) but
     and global financial markets, moreover,                             the coefficients are not reported. Columns (4) and (5) include the following non-
                                                                         reported additional regressors: Increase in current account; Real exchange rate change;
     highlights the risks of cross-border spillovers                     Increase in credit; Reserve/M2; GDP growth; Inflation; and Rule of law. The sample
     and contagion effects triggered by global                           period is from 2000 to 2017. Numbers in brackets are robust standard errors. The
                                                                         asterisks denote significance levels. *** at 1%, ** at 5%, and * at 10%.
     shocks and financial distress.
                                                                         Source: Park and Shin (2020b).

     Previous financial crises demonstrated how weaknesses
     in finance sectors can spread to neighboring                        Amid flight to safety, global demand for
     economies. Analysis of direct and indirect banking                  the US dollar soared, threatening local
     sector exposure of emerging economies to crisis-                    financial stability in emerging Asian
     afflicted economies points to the elevated risk                     economies which remain heavily exposed
     of contagion in the form of capital outflows due                    to US dollar funding risks.29
     to increased interlinkages during crisis periods (ADB 2017;
     Park and Shin 2017, 2018, 2020a, 2020b). At a time of               At the peak of the COVID-19 pandemic in March, the
     such heightened interconnectedness, a buildup in NPLs               fear of economic recession and the risk-off sentiment
     can further heighten global banking instability, owing to           unraveled global financial markets, putting Asia’s

     29
          This section draws from Park, Rosenkranz, and Tayag (2020).
You can also read