PRESENTATION TO DEBT INVESTORS - 2nd quarter and 1st half 2019 | September 2019 - Societe Generale

Page created by Norma Delgado
 
CONTINUE READING
PRESENTATION TO DEBT INVESTORS - 2nd quarter and 1st half 2019 | September 2019 - Societe Generale
PRESENTATION TO
DEBT INVESTORS
    2nd quarter and 1st half 2019 | September 2019
PRESENTATION TO DEBT INVESTORS - 2nd quarter and 1st half 2019 | September 2019 - Societe Generale
DISCLAIMER
The information contained in this document (the “Information”) has been prepared by the Societe Generale Group (the “Group”) solely for informational purposes. The Information is proprietary to the
Group and confidential. This presentation and its content may not be reproduced or distributed to any other person or published, in whole or in part, for any purpose without the prior written permission of
Societe Generale.
The Information is not an offer to buy or sell or a solicitation of an offer to buy or sell any security or instrument or to participate in any trading strategy, and does not constitute a recommendation of, or
advice regarding investment in, any security or an offer to provide, or solicitation with respect to, any securities-related services of the Group. This presentation is information given in a summary form and
does not purport to be complete. It is not intended to be relied upon as advice to investors or potential investors and does not take into account the investment objectives, financial situation or needs of
any particular investor. Investors should consult the relevant offering documentation, with or without professional advice when deciding whether an investment is appropriate.
This presentation contains forward-looking statements relating to the targets and strategies of the Societe Generale Group. These forward-looking statements are based on a series of assumptions, both
general and specific, in particular the application of accounting principles and methods in accordance with IFRS (International Financial Reporting Standards) as adopted in the European Union, as well as
the application of existing prudential regulations. These forward-looking statements have also been developed from scenarios based on a number of economic assumptions in the context of a given
competitive and regulatory environment. The Group may be unable to:
-anticipate all the risks, uncertainties or other factors likely to affect its business and to appraise their potential consequences;
-evaluate the extent to which the occurrence of a risk or a combination of risks could cause actual results to differ materially from those provided in this document and the related presentation.
Therefore, although Societe Generale believes that these statements are based on reasonable assumptions, these forward-looking statements are subject to numerous risks and uncertainties, including
matters not yet known to it or its management or not currently considered material, and there can be no assurance that anticipated events will occur or that the objectives set out will actually be achieved.
Important factors that could cause actual results to differ materially from the results anticipated in the forward-looking statements include, among others, overall trends in general economic activity and in
Societe Generale’s markets in particular, regulatory and prudential changes, and the success of Societe Generale’s strategic, operating and financial initiatives. Unless otherwise specified, the sources for
the business rankings and market positions are internal.
Other than as required by applicable law, Societe Generale does not undertake any obligation to update or revise any forward-looking information or statements information, opinion, projection, forecast
or estimate set forth herein.
More detailed information on the potential risks that could affect Societe Generale’s financial results can be found in the Registration Document and its updates filed with the French Autorité des Marchés
Financiers.
The financial information presented for the six-month period ending 30 June 2019 was examined by the Board of Directors on 31 July 2019 and has been prepared in accordance with IFRS as adopted in
the European Union and applicable at this date. The condensed interim consolidated financial statements for the six-month period ending 30 June 2019 were prepared in accordance with IAS 34 “Interim
Financial Reporting” and have been subject to a limited review by the Statutory Auditors. Societe Generale’s management intends to publish complete consolidated financial statements for the year
ended 31 December 2019.
The figures presented in this document have been restated for the application of IAS 12 amendment. As a consequence, the tax effect on interest paid to holders of deeply subordinated notes& undated
subordinated notes is now accounted in the profit and loss of the period on « Income tax ». See supplement.
By receiving this document or attending the presentation, you will be deemed to have represented, warranted and undertaken to (i) have read and understood the above notice and to comply with its
contents, and (ii) keep this document and the Information confidential.

                                                                                                                                  PRESENTATION TO DEBT INVESTORS SEPTEMBER 2019                                2
SOCIETE GENERALE AT A GLANCE
LEADING FRANCHISES                                                                                   WITH AN INTERNATIONAL FOOTPRINT TO SERVE OUR
                          - Société Générale and Crédit du Nord: two complementary
                                                                                                     CLIENTS AND CAPTURE GROWTH POTENTIAL
                            brands focused on premium clients                                                                                          EUR 25.2bn in 2018
                                                                                                                      AMERICAS
                          - Boursorama: undisputed leader in online banking in France                                                                  WESTERN                                 CEE         RUSSIA
                            targeting > 3M clients by 2021                                                             ~6%                             EUROPE
                                                                                                                                                                                                             ~3%
                                                                                                                                                                                                ~11%
                          - International Retail: (BRD) #3 in Romania, (KB) #3 in Czech
                            Republic, (SG Russia) #2 private bank by loans in Russia                                                                           ~68%(1)

                          - Insurance: #5 Bankinsurance in France
                          - Financial Services: (ALD) # 1 Full service leasing in Europe,                       ASIA - OCEANIA                                                                                    AFRICA
                            Equipment Finance # 1 in Europe
                                                                                                                                                                                                                    ~6%
                                                                                                                        ~6%
                          - Presence in Africa as a differentiating factor

                                                                                                         % % of 2018 Group revenues
                           - World leader in Equity derivatives and in Structured Finance
                           - EMEA leader in Investment Banking and in Transaction Banking                                                              LEADERSHIP positions in         Reference bank in HIGH POTENTIAL
                                                                                                      Presence in SELECTED WHOLESALE
                                                                                                                                                              Western Europe                   RETAIL MARKETS
                           - French Leader in Private Banking                                              MARKETS for our core clients
                                                                                                                                                     A reference RETAIL BANK in         Leveraging on GROUP PRESENCE
                                                                                                         CONNECTING WITH EUROPE
                                                                                                                                                                 France                       for our corporate clients

BALANCED RWA ALLOCATION(3) THROUGH BUSINESSES                                                        DISCIPLINED AND SELECTIVE CAPITAL ALLOCATION
                                                                                                     RWA CAGR 2018-2020 constant scope and currency which excludes all model reviews (e.g. TRIM) and IFRS 16
                                 Global Banking &                 French Retail Banking
                                 Investor Solutions                                                      ca. +5%         ca. +4%
                                                      37%     29%                                                                      ca. +1%/+2%
                                                                                                                                                                                                          Group
                                                                                                                                                      ca. +0.5%/+1%
                                                                                                                                                                      Wealth & Asset Global Markets &
                                                                                                                                                                      Management Investor Services

                                                            34%                                      International       Financial
(1)   Including 47% in France                                         International Retail Banking                                     Financing &       French
                                                                                                     Retail Banking      Services
(2)   As of FY 2018 results                                         & Financial Services                                                 Advisory         Retail
(3)   As of 30.06.2019                                                                                                                                   Banking         ca. -2%
                                                                                                                                                                                                ca. -9%

                                                                                                                                      PRESENTATION TO DEBT INVESTORS SEPTEMBER 2019                                        3
1   Q2 & H1 19
    GROUP PERFORMANCE
Q2 19 AND H1 19 KEY HIGHLIGHTS

                     WELL ON TRACK TO                   RESILIENT PROFITABILITY,                               STRONG
                     DELIVER CAPITAL                    RESTRUCTURING ON                                       RISK PROFILE
                     TRAJECTORY                         TRACK
                                              EUR 1.6bn cost program on track: ca.35% of           Low cost of risk (23bp) in H1 19
  CET1 up at 12.0%
                                              cost savings achieved
  >200 bp buffer over MDA                                                                          Decrease in NPL ratio at 3.4%, 55% gross
                                              Group net income(1)   : EUR 1.25bn in Q2 19          coverage ratio
   Strong discipline in RWA consumption
                                              ROTE(1): 9.7% in Q2 19 (9.1% in H1 19)               Solid balance sheet:
   Further progress in Global Markets RWA
    reduction (EUR 2.6bn)                                                                           69% of funding program already
                                                                                                     achieved
   Further progress in refocusing program:                                                         TLAC and MREL compliant
    closing of Eurobank (+8bp)

  Leverage ratio at 4.3%

(1) Underlying data. See supplement.

                                                                                            PRESENTATION TO DEBT INVESTORS SEPTEMBER 2019     5
Q2 19 AND H1 19 GROUP PERFORMANCE

                                                                                                                  INSURANCE AND
                                                                INTERNATIONAL                                                                     GLOBAL BANKING AND                          CORPORATE
 FRENCH RETAIL BANKING                                                                                            FINANCIAL
                                                                RETAIL BANKING                                                                    INVESTOR SOLUTIONS                          CENTRE
                                                                                                                  SERVICES
Revenues                                                       Revenues                                           Revenues                        Revenues                                   EUR +38m
+2.1%, excl. PEL/CEL vs. Q2 18                                 +7.0%* vs. Q2 18                                   +2.9%* vs. Q2 18                -6.1% (-7.3%*) vs. Q2 18
-0.6%, excl. PEL/CEL, vs. H1 18                                                                                                                   -2.6% (-4.6%*) vs. H1 18
                                                                                                                                                                                             Q2 19 Gross operating income
                                                               +7.5%* vs. H1 18                                   +3.6%* vs. H1 18

Increase in net interest margin                                Strong revenue growth in all                      Steady growth in insurance       Sustained Financing activities,
(+1.7% vs. Q2 18) underpinned by good                          regions driven by volume effect                   revenues in France and abroad    subdued Investment Banking activities in
trend in medium-term corporate loans                                                                             Good momentum in                 Europe
                                                                                                                 equipment finance
Fees affected by French banking industry                                                                         New personal car leasing offer   Resilient Global Markets revenues
commitment measures and market                                                                                   in partnership with Amazon
environment

RONE(1)                                                       RONE(1)                                            RONE(1)                          RONE(1)                                    EUR -91m
12.6% in Q2 19                                                17.1% in Q2 19                                     21.3% in Q2 19                   10.0% in Q2 19                             Q2 19 Contribution to Group net
11.5% in H1 19                                                16.5% in H1 19                                     20.9% in H1 19                   8.9% in H1 19                              income

                                                             Q2 19 Revenues EUR 6.3bn, Q2 19 Group net income(1) at EUR 1,247m
(1) Underlying data: adjusted for exceptional items, IFRIC 21 linearisation and PEL/CEL provision for French Retail Banking. See supplement.
* When adjusted for changes in Group structure and at constant exchange rates

                                                                                                                                                        PRESENTATION TO DEBT INVESTORS SEPTEMBER 2019                          6
IMPROVING COST FLEXIBILITY

DELIVERING COST SAVINGS
Grosscostsavings in EURbn
                                                                      1.6

          On going
          Completed
                                           0.7
                                                                      1.0

                                  0.3
                                  0.2
                                                                     0.6
                        0.4

                      COMPLETED   TARGET   TARGET                  CUMULATIVE
                                   2019     2020                   2020 TARGET

                                                    PRESENTATION TO DEBT INVESTORS SEPTEMBER 2019   7
STRONG RISK PROFILE AND CULTURE

    WELL MANAGED                                         CONTAINED                                     A STRICT FOCUS ON
    CREDIT RISK                                          MARKET RISK                                   OPERATIONAL RISK
HIGH ORIGINATION AND PORTFOLIO QUALITY                  MARKET RISK                                CONTINUOUS INVESTMENT IN
                                                        ~5% of total RWA            since 2016     COMPLIANCE
WELL-ESTABLISHED TRACK RECORD OF LOW
COST OF RISK
                                                        HIGHLY DISCIPLINED APPROACH TO RISK        TRANSVERSAL CULTURE          &
ca. 25 bps                      on average since 2016   APPETITE
                                                                                                   CONDUCT          PROGRAMME
KEEPING NPL AT A LOW LEVEL                              VaR*
LOW COST OF RISK, STRONG RISK PROFILE

                                                       _Cost of risk(1) (in bp)
                                                         H1 18     Q2 18      Q3 18    Q4 18   Q1 19   Q2 19   H1 19

                                                                                      29
                                                                              22               21      25        23
                                                        16         14
                                                                                                                           NON-PERFORMING LOAN RATIO
GROUP

                                                                                                                           JUNE 15   JUNE 16   JUNE 17   JUNE 18   JUNE 19

                                                                                                                             5.7%
                                                                                      30                                               5.1%
                                                        24                  25                         27       23
FRENCH RETAIL BANKING                                             20                           20                                               4.6%
                                                                                                                                                          3.9%
                                                                                                                                                                   3.4%
INTERNATIONAL RETAIL                                                         37                39      38       39
                                                                                      33
BANKING AND FINANCIAL                                   25         23
SERVICES
                                                                                                                           GROSS COVERAGE RATE: 55% at end-June 19
                                                                                      25
GLOBAL BANKING AND                                                  2        4                 10       8        9
                                                        -3
INVESTOR SOLUTIONS

(1) Outstandings at beginning of period. Annualised.

                                                                                                                       PRESENTATION TO DEBT INVESTORS SEPTEMBER 2019         9
COMMITED TO POSITIVE TRANSFORMATIONS

                    VOLUNTARY AND                         LONG-TERM VISION TO ACCOMPANY OUR CLIENTS
                    RESPONSIBLE                           THROUGH POSITIVE TRANSFORMATIONS
                    POLICY
                TRANSITION                                       PIONEER IN                        GROW WITH                            TRANSITION TO
                TO LOWER CARBON                                  POSITIVE IMPACT                   AFRICA                               SUSTAINABLE CITIES

 Strengthened commitments in                             EUR 100bn commitment to           Awarded ‘Africa’s Best Bank for       Applying innovation to create
 the energy transition: scheduled                        support the energy transition     Corporate Responsibility’             new models :
 2030 exit from thermal coal in EU                       between 2016 and 2020 :           (Euromoney 2019) for:                 · Founding co-partner of the
 and OECD and 2040 elsewhere                             89% achieved at end-Q2 19         · Commitment to SMEs,                   Netexplo Smart Cities Accelerator
                                                                                             microfinance, women                 · Launch of LaVilleE+® start-up
 Promote and sign commitments                            Inaugural EUR 1bn 10-year           entrepreneurs and staff diversity
 towards decarbonising the                               Positive Impact Covered Bond on
 shipping industry                                       carbon-efficient real estate
                                                                                           Awarded ‘Best Sustainable Export
                                                                                           Finance Deal of the Year’ for EUR
 First Climate Disclosure ‘TCFD’(1)                      Renewable energy:
                                                                                           253m financing of Abidjan drinking
 report published                                        #4 Mandated Lead Arranger
                                                                                           water supply plant (TXF 2018)
                                                         worldwide and #2 EMEA
                                                         (Dealogic 2018)

(1) Task Force on Climate-related Financial Disclosure

                                                                                                           PRESENTATION TO DEBT INVESTORS SEPTEMBER 2019         10
GROUP RESULTS

                                                         In EUR m                                                   Q2 19         Q2 18              Change                H1 19         H1 18               Change
                                                         Net banking income                                         6,284         6,454        -2.6%        -2.1%*        12,475        12,748        -2.1%        -2.0%*
                                                         Underlying net banking income(1)                           6,284         6,454        -2.6%        -2.1%*        12,475        12,748        -2.1%        -2.0%*
RESILIENT REVENUES
                                                         Operating expenses                                        (4,270)       (4,403)       -3.0%        -2.5%*        (9,059)       (9,132)       -0.8%        -0.5%*
Q2 19 Revenues from businesses -0.9%* vs. Q2 18
                                                         Underlying operating expenses(1)                          (4,152)       (4,370)       -5.0%        -4.5%*        (8,500)       (8,594)       -1.1%        -0.8%*
                                                         Gross operating income                                     2,014         2,051        -1.8%        -1.2%*         3,416         3,616        -5.5%        -5.9%*
OPERATING EXPENSES                                       Underlying gross operating income(1)                       2,132         2,084        +2.3%        +3.0%*         3,975         4,154        -4.3%        -4.6%*
Effect of restructuring provisions in GBIS (EUR -227m)   Net cost of risk                                           (314)         (170)       +84.7%       +96.1%*         (578)         (378)       +52.9%       +59.1%*
and IBFS (EUR -29m)
                                                         Underlying net cost of risk (1)                            (296)         (170)       +74.1%       +84.8%*         (560)         (378)       +48.1%        +54.0%*
                                                         Operating income                                           1,700         1,881        -9.6%        -9.4%*         2,838         3,238       -12.4%        -13.0%*
INCOME TAX                                               Underlying operating income(1)                             1,836         1,914        -4.1%        -3.8%*         3,415         3,776        -9.6%        -10.1%
Effect of IAS 12 amendment: tax effect of hybrid         Net profits or losses from other assets                     (80)         (42)        -90.5%       -90.7%*         (131)         (41)          n/s            n/s
coupons recorded in “Income Tax” for EUR +63m            Income tax                                                 (390)         (448)        -12.9%       -12.4%*        (645)         (765)        -15.7%       -16.3%*
in Q2 19 and EUR +118m in H1 19                          Reported Group net income                                  1,054         1,224       -13.9%       -13.4%*         1,740         2,127       -18.2%        -18.6%*
                                                         Underlying Group net income(1)                             1,247         1,333        -6.4%        -5.8%*         2,332         2,590       -10.0%        -10.3%*
                                                         ROE                                                        6.9%          8.6%                                     5.5%          7.5%
                                                         ROTE                                                       8.3%         10.4%                                     6.9%          8.9%
                                                         Underlying ROTE (1)                                        9.7%         11.2%                                     9.1%         11.0%

                                                          (1) Underlying data: adjusted for exceptional items and IFRIC 21 linearisation. See Methodology and Supplement p.48
                                                          Note: 2018 figures restated for IAS 12 impact of tax effect on interest paid to holders of deeply subordinated notes & undated subordinated notes (EUR +68m on Q2 18
                                                          and EUR +121m on H1 18) on “Income tax” and “Group net income”. See supplement.
                                                          (2) Group net income, adjusted for hybrid coupons
                                                          *when adjusted for changes in Group structure and at constant exchange rates
                                                                                                                              PRESENTATION TO DEBT INVESTORS SEPTEMBER 2019                                                      11
2   CAPITAL AND
    LIQUIDITY
BALANCE SHEET RATIOS
ABOVE REGULATORY REQUIREMENTS

                                                                           2019 requirements(2),(3)                                      End-Q2 19 ratios                         Target 2020

                                        CET1                                               9.9%                                                  12.0%                               12%
                               Total Capital                                              13.4%                                                  17.9%
                             Leverage ratio                                                3.5%                                                    4.3%                           4% - 4.5%
                                                                                    19.5% (% RWA)                                           25.8% (% RWA)
                                        TLAC                                       6.0% (% leverage)                                       7.5% (% leverage)

                                      MREL(1)                                       8% (% TLOF)                                           > 8% (% TLOF)

                                          LCR                                            >100%                                                  135%(4)                            >100%
                                        NSFR                                             >100%                                                   >100%                             >100%

(1)   TLOF : Total Liabilities & Own Funds, after full recognition of netting rights on derivatives. Requirements subject to regulatory and legislative changes
(2)   Excluding Pillar 2 Guidance add-on. Including countra cyclical buffer (at 0.1% as of 31 December 2018) and P2R (at 1.75%)
(3)   Requirements are presented as of today’s status of regulatory discussions
(4)   Average on Q2 19

                                                                                                                                                                  PRESENTATION TO DEBT INVESTORS SEPTEMBER 2019   13
CET1 AT 12%
                                                                                                                                                                                   Employee Share
                                                                                                                                                                                      Scheme
                                                                               _Q2 19: change in fully-loaded CET1(1) ratio (in bp)
                                                                                                                                                                                                      -5bp   12.2%
                                                                                                                                                                                           +3bp
CET1(1) UP+52bp AT 12.0%                                                                                                                                                      12.0%        +19bp
>200 bp buffer over MDA                                                +24bp        -13bp                     +8bp
                                                                                                                           -4bp           +8bp        -5 bp       +5bp
                                                                                                                                                                                                       EMC
                                                                                                  +5bp

LEVERAGE RATIO AT 4.3%                                                                                                                                                                   Refocusing
                                                            +24bp
                                                                                                                                                                                         announced
                                                                                                                                                                                         transactions(2)
TLAC(3) RATIO: 25.8% OF RWA
                                               11.5%
ALREADY MREL COMPLIANT
                              10.9%
LIQUID ASSET BUFFER
EUR 188bn at end-June 19
LCR AND NSFR above 100%

69% OF FUNDING
                                                          2018 Scrip Earnings (4) Dividend       Organic                  TRIM /       Refocusing     EMC         Others(5)   Q2 19(1)                       Q2 19(1)
PROGRAM ALREADY               Q4 18(1)         Q1 19(1)
                                                          dividend                provision      RWA*
                                                                                                            Global
                                                                                                            Markets       SRF          closed         integration                                            pro forma
ACHIEVED                                                                                                    RWA
                                                                                                            reduction
                                                                                                                                       transactions

                                   (1)   Fully-loaded, based on CRR/CRD4 rules, including the Danish compromise for Insurance. See Methodology.
                                   (2)   Estimated impact at signing date, excluding IFRS 5 impact, as of August 1 st 2019
                                   (3)   Including 2.5% of Senior Preferred debt.
                                   (4)   Including -5bps of hybrid coupons
                                   (5)   Mainly DTA

                                   *     when adjusted for changes in Group structure and at constant exchange rates

                                                                                                                         PRESENTATION TO DEBT INVESTORS SEPTEMBER 2019                                            14
ON TRACK TO DELIVER OUR 2020 CET1 TARGET
         Completed at end-June 2019, in bp

         To be completed by 2020, in bp                                                                                                                  12.8%
                                                                                                              +33/+43                -26/-46 -30/-50bp
+xbp        2020 capital trajectory
            communicated in Q4 18                                                                                                       -4
                                                                                           +8/+18 +10/+20bp             +80/+90bp
                                                                                             +2
                                                                         +10
                                                                                                               +47                                       12.4%
                                                                                  +25 bp
                                                                          +15
                                                +22
                   12.2%
                                                             +50bp                                                                                       12.0%
                                                +28

                                          Organic capital
                  CET1                    generation post                Global Markets    Other RWA           Refocusing                TRIM and         CET1
                  Q2 19 pro                  dividend                    RWA Reduction     reduction*           program              other regulatory     2020
                  forma                 (Earnings net of AT1 coupons –                                                                  headwinds
                                         50% cash dividend – organic
                                                RWA growth)
* Securitisation, risk transfer, OTD, insurance

                                                                                                                            PRESENTATION TO DEBT INVESTORS SEPTEMBER 2019   15
GROUP TLAC / MREL
                                    _TLAC ratio                                                                     _MREL ratio

      Already meeting 2019 (19.6%) and 2022 (21.5%(1)) requirements                 Already meeting total requirements (notification received in June 2018)

                       % RWA(1)                                                                                                         % RWA    (1) (2)

                                                                                                                           24.4%        >24.4%

                                                                                                                                          5.2%                ~7%
                                                                                                                                                                          SP
                                                                                               % TLOF
                                                             % Leverage
                                                                                                                                          3.3%                            SNP
                                                                                                                                                              ~3%
                                                                                          8%            >8.0%                                                             Tier 2
                                                                        7.5%                                                              2.8%                ~2%
                                                23.3%                                                                                                                     AT1
                                                          6%
                                                                                                                                                                          CET 1

                                                                                                                                         12.0%                12%

         2019 Requirement                           2019 Requirement
                                                      Exigences 2019   30.06.2019   2019 Requirement
                                                                                      Exigences 2019   30.06.2019         2018 Notif.   30.06.2019         Cibles
                                                                                                                                                           Targets2020
                                                                                                                                                                   2020
(1)     Without countra cyclical buffer
(2)     Based on RWAs as of end-December 2016

                                                                                                          PRESENTATION TO DEBT INVESTORS SEPTEMBER 2019                        16
GROUP
                                                        LONG TERM FUNDING PROGRAMME
Parent company 2019 funding                                                         _2019 Expected funding programme(1)
programme similar to 2018
c. EUR 17bn of vanilla debt, well balanced across the                                Senior Preferred and Secured debt                        ~EUR 6/8 bn
different debt formats
Annual structured notes issuance volume in line                                      Senior Non Preferred debt
with amounts issued over the past years (i.e. ~EUR                                                                                            ~EUR 6/7 bn
19bn)
                                                                                     Subordinated debt (AT1/T2)                           ~EUR 2.5/3 bn Max
As of 15 July 2019:
~75% completion of the vanilla funding programme
(including EUR 0.75bn of prefunding in 2018)
                                                        Societe Generale          Societe Generale          Societe Generale              Societe Generale
~EUR 10.6bn of structured notes                         2Y Senior Preferred       5Y Senior Non Preferred   5Y & 10Y Senior Non Preferred 10Y Senior Non Preferred
Competitive funding conditions: MS6M+51bp and           E3M+37bp 14-Jan-21        1.25% 15-Feb-24           0.94% & 1.164% 21-Feb-24 & 29 1.75% 22-Mar-29
average maturity of 4.6 years (incl. senior non         EUR 1,750,000,000         EUR 1,750,000,000         JPY 96,200,000,000             EUR 1,250,000,000
preferred debt, senior preferred debt and covered
bonds)
Additional EUR 1.4bn issued by subsidiaries
                                                        Societe Generale          Societe Generale          Societe Generale               SG SFH
                                                        5Y Senior Non Preferred   PerpNC5 AT1               15NC10 Tier2                   10Y Green Covered Bond
                                                        3.875% 28-Mar-24          6.125% 16-Apr-24          4.5% 18-Apr-34NC29             0.1250% 18-Jul-29
 (1) Excluding structured notes
                                                        USD 1,500,000,000         SGD 750,000,000           AUD 300,000,000                EUR 1,000,000,000

                                                                                              PRESENTATION TO DEBT INVESTORS SEPTEMBER 2019                          17
GROUP LONG TERM
                                                       FUNDING BREAKDOWN(1)
Access to diversified and                                                    30.06.2019
complementary investor bases through:
Subordinated issues                                                                                                   Secured Issues(4)
                                                                              10%
Senior vanilla issuances (public or private                                                   17%                     Senior Vanilla Preferred
placements)                                                                                                           Unsecured Issues(3)
                                                                  13%
Senior structured notes distributed to institutional                                                                  Senior Structured Issues
investors, private banks and retail networks, in
France and abroad                                                              EUR 192bn                              Senior Non-Preferred Issues
Covered bonds (SFH, SCF) and securitizations                     13%
                                                                                                                      Subordinated Debt(2)
                                                                                                      29%

Issuance by Group subsidiaries                                          7%                                            LT Interbank Liabilities(5)
Access to local investor bases by subsidiaries                                      11%
                                                                                                                      Subsidiaries
which issue in their own names or issue secured
transactions (Russian entities, ALD, GEFA, Crédit
                                                            Amortisation schedule as of 30.06.2019, in EUR bn
du Nord, etc.)
Increased funding autonomy of IBFS subsidiaries                  46,9

Balanced amortisation schedule                                               33,9

                                                                                      23,8     22,4

(1)   See Methodology                                     15,0                                          13,3
(2)   Including undated subordinated debt                                                                      12,0
(3)   Including CD & CP >1y                                                                                             4,8    5,3    6,7     7,9
(4)   Including CRH
(5)   Including IFI
                                                          2019   2020        2021     2022     2023     2024   2025    2026   2027    2028   > 2028

                                                                                             PRESENTATION TO DEBT INVESTORS SEPTEMBER 2019            18
STRENGTHENED FUNDING
                                                                                   STRUCTURE
                                                                                        _Loan to Deposit Ratio
Very strong balance sheet
                                                                                          99%            94%              91%            94%            93%            94%
Stable loan to deposit ratio
                                                                                                                                                           463              477
High quality asset buffers                                                                                                   447
                                                                                                                                      418
                                                                                                                                            446      428              447
                                                                                                        388 411       408
                                                                                         364 366
Comfortable LCR at 134% on average in Q2 19
NSFR above regulatory requirements

Liquid asset buffer of EUR 188bn at end-
June 19
High quality of the liquidity reserve: EUR 82bn of                                        Q2 14          Q2 15         Q2 16             Q2 17          Q2 18          Q2 19
HQLA assets at end-June 2019 and EUR 85bn of                                                       Loans (EUR bn)           Deposits (EUR bn)             L/D ratio
Central bank deposits
                                                                                        _Liquid Asset Buffer (in EUR bn)
Excluding mandatory reserves for central bank
deposits
                                                                                                      176                          177            188             Central bank
Unencumbered, net of haircuts for HQLA assets and                                       164                         172
                                                                                                                                                                  deposits(1)
other assets eligible to central bank                                                                  75                           84             85
                                                                                         70                          82                                           High quality liquid
                                                                                                                                                                  asset securities(2)
                                                                                         79            84            73             76             82
                                                                                                                                                                  Central bank
                                                                                         15            16            17             17             21             eligible assets(2)
 *     See Methodology. Q4 2018 data are presented according to IFRS 9 standard.        Q2 18         Q3 18         Q4 18          Q1 19          Q2 19
 (1)     Excluding mandatory reserves
 (2)     Unencumbered, net of haircuts

                                                                                                              PRESENTATION TO DEBT INVESTORS SEPTEMBER 2019                             19
CREDIT RATING OVERVIEW
Strong franchises                                                                                        _Credit Rating as of July 2019
S&P: “Solid foundation in domestic retail, corporate
and investment banking, and financial services to                                                                             DBRS         Fitch       Moody’s        S&P
corporates. Consistent strategy and well-diversified
                                                                                                             LT/ST
revenues by business lines and geography”                                                                                   AA/R-1(high)   A+(dcr)   A1(cr)/P-1(cr)    A/A-1
                                                                                                          Counterparty
Moody’s: “Strong franchise and well-diversified
universal banking business model”                                                                           LT senior
                                                                                                                              A(high)        A+           A1             A
                                                                                                         unsecured debt
Fitch: “Sound company profile, which benefits from
franchise strengths across selected products and
geographies”                                                                                                 Outlook         Positive      Stable       Stable        Positive

Sound balance-sheet metrics                                                                                 ST senior
                                                                                                                            R-1(middle)      F1           P-1           A-1
S&P: “Steady build-up of a comfortable bail-in-                                                          unsecured debt
able debt cushion”                                                                                        LT senior non
                                                                                                                                n/a           A          Baa2          BBB+
Moody’s: “Regulatory capitalisation is good and                                                           preferred debt
improving, underpinned by a strong earnings
generation capacity […] Liquidity is strong and                                                            Dated Tier 2                      A-          Baa3          BBB
                                                                                                                                n/a
broadly in line with large European peers”                                                                subordinated
Fitch: “Strong internal capital generation”                                                                 Additional
                                                                                                                                n/a         BB+        Ba2(hyb)         BB+
                                                                                                              Tier 1
NB: The above statements are extracts from the rating agencies reports on SG and should
not be relied upon to reflect the agencies opinion. Please refer to full rating reports available
on Societe Generale and the agencies’ websites.

                                                                                                                         PRESENTATION TO DEBT INVESTORS SEPTEMBER 2019           20
SUSTAINABILITY RECOGNISED IN
                                    RATINGS

                                      _SG is well recognised by extra-financial rating agencies and included in
                                       the leading sustainability indices, including DJSI:

“In this period of profound                                 Rating                   Position vs peers
change we are experiencing, we
are committed to an approach
supporting the positive
transformations of our clients                            Rated “A”
and all of our stakeholders. CSR
matters are at the heart of our
Transform to Grow strategic plan.
                                                         Rating 75%
As external indicators, these
                                                       “Outperformer”                   91st Percentile
results are proof of the growing
integration of CSR issues in the
development of the Bank’s
activities.”                                            Rated C “Prime”
                                                         (above “Prime”
Diony Lebot, Deputy CEO                                    threshold)

                                                           PRESENTATION TO DEBT INVESTORS SEPTEMBER 2019          21
3   BUSINESS
    PERFORMANCE
FRENCH RETAIL BANKING
                                                     RESULTS
REVENUES
Q2 19 revenues(1) +2.1% vs. Q2 18 (+4.9% vs. Q1 19
and -0.6% vs. H1 18), confirming 2019 revenue(1)     In EUR m                                                                  Q2 19         Q2 18    Change   H1 19     H1 18     Change
guidance between 0% and -1% vs. 2018                 Net banking income                                                        1,994         1,991    +0.2%    3,910     3,999     -2.2%
Net interest income(1) +1.7% vs. Q2 18 (+2.8%           Net banking income excl. PEL/CEL                                       2,021         1,980    +2.1%    3,949     3,971     -0.6%
vs. Q1 19 and -0.8% vs. H1 18) underpinned by        Operating expenses                                                       (1,348)       (1,361)   -1.0%    (2,834)   (2,841)   -0.2%
good momentum in credit to corporates and            Gross operating income                                                     646           630     +2.5%    1,076     1,158     -7.1%
professionals                                          Gross operating income excl. PEL/CEL                                     673           619     +8.8%    1,115     1,130     -1.4%
                                                     Net cost of risk                                                          (129)          (93)    +38.7%   (223)     (227)     -1.8%
Fees -1.2% vs. Q2 18 (+2.9% vs. Q1 19 and -1.9%
vs. H1 18) including a EUR +61m adjustment on        Operating income                                                           517            537    -3.7%     853       931      -8.4%
commission-related taxes. Decrease in fees vs. a     Reported Group net income                                                  356            365    -2.5%     590       635      -7.1%
high comparative base in Q2 18, impacted by          RONE                                                                     12.6%          13.2%             10.5%     11.3%
French banking industry commitment measures          Underlying RONE (2)                                                      12.6%          12.1%             11.5%     11.5%
and market environment

COSTS UNDER CONTROL
Operating expenses -1.0% vs. Q2 18 and stable vs.
                                                     Q2 19 RONE(2): 12.6%
H1 18, confirming 2019 cost guidance between
+1% and +2% vs. 2018

                                                     (1) Excluding PEL/CEL provision
                                                     (2) Underlying data : adjusted for IFRIC 21 linearisation, PEL/CEL provision. See supplement.

                                                                                                                      PRESENTATION TO DEBT INVESTORS SEPTEMBER 2019                         23
DEVELOPING CORE FRANCHISES IN FRENCH RETAIL
BANKING
                                                                                        ADAPTING SET UP
DEVELOPING CLIENT BASE
                                                                                        LEVERAGING ON DIGITAL

             #1                                                                           339 Societe Generale branches closed since end-2015, on track
             Best Bank for corporates(1)                                                  to reach 2020 target

                                                                                          110 Pro corners as of 30 June 19
             +2%
             # of wealthy and mass affluent clients vs. Q2 18                             13 business centres as of 30 June 19
           ~1.9m                                                                          2m     Instant Payments since January
           Boursorama clients as of 30 June 2019
                                                                                          ~70% Online increase in credit cards limits in SG network

         INDIVIDUAL                                                    MEDIUM-TERM      PRIVATE BANKING                         INSURANCE
         CLIENT LOAN                                                  CORPORATE LOAN          AuM                        Life insurance outstandings
        OUTSTANDINGS                                                   OUTSTANDINGS          EUR 67bn                             EUR 95bn
                                                                                          Q2 19 Net inflows                  Protection premiums
             +3% vs. Q2 18                                              +8% vs. Q2 18
                                                                                             EUR 1.1bn                         +1.4% vs. H1 18
(1) Study carried out by Challenges magazine’s among corporate CFOs

                                                                                                    PRESENTATION TO DEBT INVESTORS SEPTEMBER 2019         24
INTERNATIONAL RETAIL BANKING
                                                AND FINANCIAL SERVICES
                                                RESULTS
STEADY REVENUE GROWTH
                                                 In EUR m                                                  Q2 19         Q2 18           Change       H1 19     H1 18         Change
Q2 19 EUR 2,124m (+5.7%* vs. Q2 18)
H1 19 EUR 4,200m (+6.1%* vs. H1 18)              Net banking income                                        2,124         2,075    +2.4%      +5.7%*   4,200     4,064     +3.3%    +6.1%*
                                                 Operating expenses                                       (1,145)       (1,102)   +3.9%      +7.3%*   (2,349)   (2,281)   +3.0%    +6.5%*

SUPPORTING BUSINESS GROWTH                       Gross operating income                                     979           973     +0.6%      +3.9%*   1,851     1,783     +3.8%    +5.8%*
MOMENTUM WITH POSITIVE JAW                       Net cost of risk                                          (133)          (75)    +77.3%      x 2,1    (261)    (166)     +57.2%   +73.1%*
EFFECT IN H1 19(1)                               Operating income                                           846           898     -5.8%      -3.4%*   1,590     1,617     -1.7%    -0.3%*
Operating expenses +5.1%* vs. H1 18,             Net profits or losses from other assets                      0             0      n/s      -100.0%      1        4       -75.0%   -74.8%*
excluding restructuring provision for EUR 29m    Reported Group net income                                  515           541     -4.8%      -2.2%*    979       970      +0.9%    +2.7%*
                                                 RONE                                                      18.6%        18.9%                         17.3%     17.0%
LOW COST OF RISK                                 Underlying RONE (1)                                       18.9%        18.3%                         18.2%     17.7%
39bp in H1 19
                                                Q2 19 RONE(1): 18.9%
IMPROVED PROFITABILITY
H1 19 RONE 18.2%(1)

                                                (1) Adjusted for IFRIC 21 linearisation and restructuring provision for EUR 29m

                                                                                                                   PRESENTATION TO DEBT INVESTORS SEPTEMBER 2019                        25
STRONG PERFORMANCE ACROSS REGIONS IN
  INTERNATIONAL RETAIL BANKING
 EUROPE                                                                                         RUSSIA(1)                                                                     AFRICA AND OTHER
_Net Interest Income (EUR m) _Non-interest Revenues (EUR m)                                    _Net Interest Income (EUR m)                 _Non-interest Revenues (EUR m)    _Net Interest Income (EUR m)   _Non-interest Revenues (EUR m)

               +6%*

                                                                                                                                                                                       +4%*
                                                           +6%*
        603              583                                                                                +7%*
                                                                                                                                                                                                                            +7%*
                                                                                                                                                         +22%*                       269        283
                                                     192              186                               120              131                                     96                                                   143        156
                                                                                                                                                    77
       Q2 18            Q2 19                      Q2 18            Q2 19                             Q2 18            Q2 19                       Q2 18      Q2 19                Q2 18       Q2 19                Q2 18       Q2 19

Revenues up +6%* vs. Q2 18                                                                      Revenues up +13%* vs. Q2 18                                                    Revenues up +5%* vs. Q2 18

Strong revenue growth in all regions                                                           Dynamic growth in retail loan production                                      Steady revenue growth in Africa +8%* driven by
underpinned by positive trend in interest                                                      (+16%* H1 19 vs H1 18) driven by mortgages and                                strong commercial momentum
rates                                                                                          car loans
Solid momentum on Non-interest Revenues                                                        Solid fee momentum in all segments                                             Regional IT hub fully operational
across regions (Western Europe, Czech Republic and
Romania)
                                                            Q2 19 GROUP NET INCOME EUR 297m, RONE 17.1%(2)
* When adjusted for changes in Group structure and at constant exchange rates / (1) SG Russia scope / (2) adjusted for IFRIC 21 linearisation

                                                                                                                                                                      PRESENTATION TO DEBT INVESTORS SEPTEMBER 2019                     26
HIGH PROFITABILITY IN INSURANCE AND FINANCIAL
   SERVICES
     SUSTAINED REVENUE GROWTH IN INSURANCE
                                    32                                                                               GOOD MOMENTUM IN FINANCIAL SERVICES
    _Life Insurance Outstandings (EURbn)                            _Protection Premiums (EURm)                        _ALD Total fleet (‘000 000)        _SGEF Loan and Lease Outstandings(2) (EURbn)

                  +4%*                                                                                                                                                        +3%*
           115                 120                                                                                              +7%
           27%                28%
                                                                                 +12%*
                                                                                         165
                                              UNIT-LINKED                144                   PROPERTY & CASUALTY
                                              EUROFUNDS                                        PERSONAL PROTECTION
                                                                                                                              1.6          1.7                             17,8        18,2
           73%                72%
                                                                         262             289

                                                                                                                             Q2 18         Q2 19                         Q2 18        Q2 19
        Jun 18            Jun 19                                      Q2 18          Q2 19

       Revenues up +3.6%* vs. Q2 18                                                                                      Revenues up +2.6%* vs. Q2 18

   Solid performance across segments                                                                                 ALD: fleet growth annual guidance confirmed , H1 used car sales result well
                                                                                                                     within 2019 guidance
   Good momentum internationally (life insurance                                                                     Selected by Amazon to launch ‘Motors’ personal car leasing platform in Spain
   premiums +34%*, personal protection +27%* and property &                                                          SGEF: confirmation of good Q1 momentum, with revenues up +11%*
   casualty +32%*) which represents 18% of the activity in H1 19

                                                              Q2 19 GROUP NET INCOME EUR 237m, RONE 21.3%(1)
* When adjusted for changes in Group structure and at constant exchange rates.
(1) Adjusted for IFRIC 21 linearisation
(2) Excluding factoring

                                                                                                                                            PRESENTATION TO DEBT INVESTORS SEPTEMBER 2019                27
GLOBAL BANKING AND INVESTOR
                                                    SOLUTIONS RESULTS

                                                     In EUR m                                                  Q2 19        Q2 18         Change        H1 19     H1 18            Change
                                                     Net banking income                                        2,266        2,412    -6.1%    -7.3%*    4,505     4,627     -2.6%     -4.6%*
REVENUES -6.1% vs. Q2 18,
                                                      Operating expenses                                      (1,915)      (1,728)   +10.8%   +10.0%*   (3,941)   (3,752)   +5.0%     +3.7%*
-2.6% vs. H1 18
Strong Financing & Advisory, resilient Global        Gross operating income                                     351          684     -48.7%   -50.1%*    564       875      -35.5%    -39.0%*
Markets                                              Net cost of risk                                           (33)          (7)     x 4,7    x 4,4     (75)       20       n/s        n/s
                                                     Operating income                                           318          677     -53.0%   -54.4%*    489       895      -45.4%    -48.2%*
                                                     Reported Group net income                                  274          507     -46.0%   -47.5%*    414       673      -38.5%    -41.8%*
OPERATING EXPENSES -3.5% vs. Q2 18                   RONE                                                      7.1%        13.6%                         5.2%      9.1%
adjusted for EUR 227m restructuring provision and    Underlying RONE (1)                                      10.0%        11.7%                        8.9%      11.0%
Commerzbank integration costs of EUR 21m
-1.6% vs. H1 18

IMPROVED PROFITABILITY VS. Q1 19
                                                    Q2 19 RONE(1): 10.0%
Underlying RONE up +2pts in Q2 19

                                                    (1) Adjusted for IFRIC 21 linearisation and restructuring provision
                                                    * When adjusted for changes in Group structure and at constant exchange rates

                                                                                                                    PRESENTATION TO DEBT INVESTORS SEPTEMBER 2019                             28
STRONG FINANCING & ADVISORY, RESILIENT GLOBAL
MARKETS
 FINANCING & ADVISORY REVENUES: +3% VS. Q2 18 (H1 19                       GLOBAL MARKETS & INVESTOR SERVICES REVENUES:
 revenues up +10% VS. H1 18)                                               -9% VS. Q2 18
_Financing & Advisory Revenues (EUR m)                                     _Global Markets Revenues (EUR m)

                                                                                      580
                                                                                                                                         522
                                                                                                                                 524
                  665        692         716      711     682                                    494                  450 450
                                                                                                           366                                 FICC

                                                                                                                                               Equities
                                                                                      696        624
                                                                                                 593       550        624        650
                 Q2 18      Q3 18        Q4 18    Q1 19   Q2 19                                                                          648

 Sustained level of activity in Financing with a high level of fees, low
 level of investment banking activity in Europe                                       Q2 18      Q3 18     Q4 18      Q1 19      Q2 19

 Active portfolio management through various deriskingand                  FICC revenues -10% vs. Q2 18 on low currency volatilityand low
 secondary sales initiatives: EUR 10bn notional amount in H1 19 vs. EUR    interest rates, first business closures; revenues +16% vs. Q1 19
 11bn for full-year 2018
                                                                           Equities revenues -7% vs. Q2 18 on lower volumes in flow products;
 Capturing transaction banking market share in Western Europe:
                                                                           revenues +4% vs. Q1 19
 Revenues booked in GBIS up +19% vs. Q2 18
                                                                           First transfer of front office staff and structured derivative positions
 ASSET & WEALTH MANAGEMENT REVENUES: -5% VS. Q2
                                                                           transferred from Commerzbank
 18 (flat VS. H1 18) adjusted for Belgium disposal
 Good private banking inflows in France, Luxembourg and                    Securities Services revenues -16% vs. Q2 18, flat adjusted for Q2 18
 Switzerland and improvement in transaction volumes vs. low Q1 19          Euroclear revaluation

                                                                                               PRESENTATION TO DEBT INVESTORS SEPTEMBER 2019              29
RESTRUCTURING ON TRACK

                              Ongoing closure of OTC commodities principal business
      PORTFOLIO ADJUSTMENT
                              Descartes Trading in run-off

                                New organisation in place since 1st July
                                Staff reduction process started outside of France
      COST BASE REDUCTION
                                Voluntary redundancy plan launched in France on 1st July
                                EUR 227m restructuring provision

                              EUR 4.9bn of the EUR 8bn of Global Markets deleveraging by 2020
         DELEVERAGING
                               completed as of end of Q2

                                               PRESENTATION TO DEBT INVESTORS SEPTEMBER 2019     30
CORPORATE CENTRE

                                                    In EUR m                                                                             Q2 19          Q2 18           H1 19           H1 18
GROSS OPERATING INCOME
                                                    Net banking income                                                                   (100)           (24)            (140)            58
EUR +38m in Q2 19, EUR -75m in H1 19
                                                    Operating expenses                                                                    138            (212)            65            (258)
Adjustment of operating taxes: EUR +241m
                                                    Gross operating income                                                                 38            (236)           (75)           (200)
NET PROFITS OR LOSSES FROM OTHER                    Net cost of risk                                                                      (19)             5             (19)             (5)
ASSETS                                              Net profits or losses from other assets                                               (81)           (28)            (134)           (32)
Effect of IFRS 5 on refocusing program:             Reported Group net income                                                             (91)           (189)           (243)          (151)
PEMA disposal for EUR -43m, Balkans for EUR -27m

                                                   Note: 2018 figures restated for IAS 12 impact of tax effect on interest paid to holders of deeply subordinated notes & undated subordinated
                                                   notes (EUR +68m on Q2 18 and EUR +121m on H1 18) on « Income tax » and « Group net income ». See supplement.

                                                                                                               PRESENTATION TO DEBT INVESTORS SEPTEMBER 2019                                     31
4   CSR STRATEGY
COMMITTED TO POSITIVE TRANSFORMATIONS

         DRAWING ON INNOVATIVE SKILLS AND PIONEERING SPIRIT                         ANCHORING A CULTURE OF RESPONSIBILITY

                    Founding member of the UN Environment                                A Culture & Conduct programme sponsored by the
                                                                                         CEO and reporting to the Board of Directors
                    Programme “Positive Impact Finance Initiative”;
                    inaugural EUR1bn 10-year Positive Impact Covered                     3-year programme with mandatory global all-
                    Bond on carbon-efficient real estate in July 2019                    staff training
     Digital transformation: #1 in eCAC40
                      Pioneering          Awardsenergy:
                                   in renewable 2018    combining                     Embedding conduct risk into Group risk management
                     crowdfunding expertise with renewable energies                   framework

                     Building sustainable cities: founding                            Duty of Care Plan published: maps, measures and
                     co-partner of the Netexplo Smart Cities                          mitigates human rights and environmental risks
                     Accelerator                                 COMMITTED TO
                                                                   POSITIVE
    Accelerating support in renewable energy :
                                                               TRANSFORMATIONS       Grow with Africa initiative, fostering the sustainable and
    #2 Mandated Lead Arranger, #2 Adviser for renewable                              low-carbon development of Africa and contributing to the
    energies EMEA (2018 Dealogic) , #4 MLA worldwide (2018                           UN Sustainable Development Goals, through :
    Inframation News)
                                                                               •   Support for African SMEs
    EUR 100 bn commitment to support the energy
    transition between 2016 and 2020: 89% achieved at 2Q19                     •   Infrastructure financing
                                                                               •   Innovative financing of agriculture and energy
    Integration of climate risk into Group risk management policy,             •   Financial inclusion
    evaluating and controlling climate-related risks and applying a
    mandatory transition risk assessment methodology to key sectors        Awarded Africa’s Best Bank for Corporate Responsibility
                                                                           (Euromoney 2019)
                        FIGHTING CLIMATE CHANGE                                               GROWING WITH AFRICA

                                                                                       PRESENTATION TO DEBT INVESTORS SEPTEMBER 2019              33
A CLEAR CSR STRATEGY INTEGRATED ACROSS THE SG GROUP

                                                 TONE FROM THE TOP

                           • Each year, the Board approves the Group’s CSR objectives and
                              strategy and reviews the developments of the programme
                           • Climate risk monitored by the Board and reviewed by a dedicated
                              Group Management Risk Committee

                              CSR ambitions structured around six main themes
                             and integrated in the TRANSFORM TO GROW strategy

                          Listening to stakeholders to define our Materiality Matrix in 2017
                                          and continue integrating ESG risks

             In our business development goals…              In the way we conduct business…

             Climate Change                                  Client Satisfaction & Protection

             Offers in line with Social Trends               Culture, Conduct & Governance

             Sustainable Development of Africa               Responsible Employer

                                                                                  PRESENTATION TO DEBT INVESTORS SEPTEMBER 2019   34
CLIMATE RISK

      •   Societe Generale has built a climate strategy around three strategic priorities :
           o Implementation of climate risk management
           o Development of sustainable finance offering
           o Managing the bank’s own impact on the climate (via own activities and clients)

      •   Since the COP21 in 2015 Societe Generale has committed to work on methodologies enabling alignment with a climate scenario, initially
          using the IEA reference scenario of 2°C
            o Since then Societe Generale has signed the Katowice Agreement which references the Paris Agreement and a scenario of below 2°C

      •   From 2017 climate-related risks were incorporated in the risk appetite of the Group, with Board approval. Climate-related credit risks are
          reviewed at least annually through the Group Management Risk Committee.

      •   In 2018 a transition risk methodology framework was established, based on a selected climate scenario and a climate vulnerability
          assessment. The output helps to assess the economic impact on sectors and individual clients.

      •   This evaluation is mandatory for clients in key sectors (oil & gas, metals & mining, transport, energy).

      •   Credit is the activity most sensitive to transition risk to a low carbon economy: the analyses carried out on the loan portfolio conclude a
          low global impact and are concentrated on sectors that are particularly CO2 emitting.

      •   Societe Generale has also assessed the exposure to physical risk in French residential real estate.

                         Societe Generale published its first ‘TCFD’ climate disclosure report in June 2019:
                         https://www.societegenerale.com/sites/default/files/documents/Document%20RSE/climate-disclosure-societe-generale-
                         tcfd-report-june.pdf

                                                                                                   PRESENTATION TO DEBT INVESTORS SEPTEMBER 2019        35
EMBEDDING ENVIRONMENTAL RESPONSIBILITY IN CLIENT ACTIVITY
                           Commitment to align activities by 2020 with the IEA’s trajectory to limit global warming to below 2°C
     ENERGY                €100 billion commitment to support the energy transition between 2016 and 2020: 89% completed as of 2Q19
     TRANSITION            No new financing projects of coal, oil sands or Arctic oil (since 2016/17)
                           2019 introduction of corporate exclusion for coal and objective to reduce to zero Societe Generale’s exposure to the thermal coal sector

                             Electricity financing, 30.06.18:
     LESS RELIANCE ON
     FOSSIL FUELS              48.7% non-carbon energies                                               51.3% fossil fuels
                                 ➔ of which 42% renewable energies                                          ➔ of which 19.3% coal
                                                                                                                 Target 19% coal by 2020

                         Accelerating support in renewable energy financing : currently among global leaders
     RENEWABLE
     ENERGY              SG supports and finances R&D of new technologies, large-scale infrastructure projects and innovative start-ups
                         2018 acquisition of the pioneering renewable energy crowdfunding fintech platform :
                             - Offers individuals and companies the opportunity to participate in financing projects

                         12 cross-sector and sector-specific Environmental & Social policies
     E&S RISK
                         E&S risk management framework which extends beyond the regulatory requirements of the French Duty of Care Bill
     MANAGEMENT
                         Compliance with the Equator Principles

                         Environmental & Social advisory for GBIS clients:
     CLIENT SUPPORT         – Assisting clients with the transition to a low-carbon economy
                            – Ensuring clients and transactions meet SG E&S Sector Policies and Guidelines
                            – Managing SG E&S reputation and credit risks

                                                                                                PRESENTATION TO DEBT INVESTORS SEPTEMBER 2019                    36
A BANK PIONEERING RESPONSIBLE FINANCE

   A CONSOLIDATED SUSTAINABLE AND POSITIVE IMPACT FINANCE OFFERING

    Societe Generale is a founding member of the UNEP “Positive Impact Finance Initiative”, since 2001,
     and a core member of the UNEP-FI working group defining “Banking Principles”

    Consolidated « Sustainable and Positive Impact Finance » proposition, whose objective is to develop
     and diversify a range of products and services by introducing more structuring expertise and advice on impact analysis and
     measurement, whilst incorporating the UN’s 17 Sustainable Development Goals

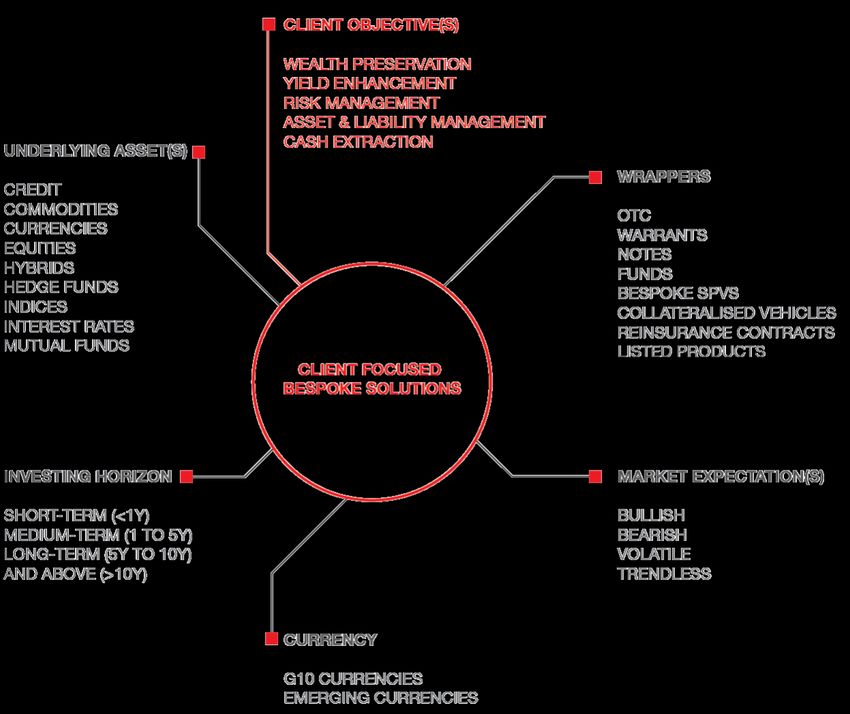
   FROM FINANCING TO INVESTING: EXAMPLES OF THE RANGE OF EXPERTISE AND SOLUTIONS

    Total amount of Sustainable & Positive Impact Finance EUR                   Lyxor ETFs matching 4 UN Sustainable Development Goals:
     11.9bio
                                                                                          Water (the largest one in Europe with EUR485m AUM),
            Of which Positive Impact Finance (as defined by UNEP-                         Renewable energy, Climate action and Gender equality
             FI) EUR 5.1bio
                                                                                 In 2017 Lyxor launched the first Green Bond ETF in the world
            Of which ‘green’ financing EUR 6.5bio
                                                                                 Structuring of ESG stock baskets and indices since 2007
            Of which ‘social/ societal’ financing EUR 5.4bio
                                                                                 Positive Impact Notes: In 2018 launch of Positive Impact
    Green Bond issues arranged: EUR 47.6bio nominal since 2016                   Structured Notes supporting SME financing
    Renewable energy projects: EUR 21.4bio (advisory and / or                   Socially Responsible Deposits: for corporate clients wanting
     financing) since 2016                                                        their cash investments to support socially responsible
                                                                                  businesses: more than EUR 900m collected
    ESG Research top 5 for the past 10 years (Extel)
                                                                                 Launch in 2018 of the first structured product with a charity
                                                                                  dimension by SG Private Banking

                                                                                                      PRESENTATION TO DEBT INVESTORS SEPTEMBER 2019   37
E&S RISK MANAGEMENT: REGULATORY AND VOLUNTARY
                              REGULATORY REQUIREMENTS                          VOLUNTARY COMMITMENTS

                                                  2001                                        2007
                                                                                                               EQUATOR PRINCIPLES - 2007:
                                                                                                                                       Project finance
  NRE, CSR REPORTING - 2001:                                                       2011
  France the first country to require CSR reporting                                                              E&S SECTOR POLICIES - 2011:
                                                                                                                               on 12 sensitive sectors
  GRENELLE 2, ART. 225 - 2012:                                          2012                                                         COP 21 - 2015:
  Broader scope of CSR reporting                                                                  Coal sector policy, alignment with IEA 2°C scenario
                                                                                                           SCIENCE-BASED TARGETS - 2016:
  ENERGY TRANSITION ART. 173 - 2015:                                    2015                                      Setting emissions reduction targets
  Climate reporting and ESG integration compulsory for investors                            REINFORCED SECTOR COMMITMENTS - 2017:
  and insurers                                                                                                                     Arctic oil, oil sands
                                                                        2016
  DUTY OF CARE & SAPIN 2 – 2017:                                                                    STRENGTHENED CLIMATE RISK - 2018:
  Legal responsibility of E&S & HR violations: identify and mitigate    2017                                           Governance and methodology
  risks and publish results                                                                                 KATOWICE COMMITMENT- 2018:
                                                                                        5-bank pledge to align lending portfolio with Paris Agreement
  TRANSPOSITION OF EUROPEAN DIRECTIVE ON                                2018
  NON-FINANCIAL REPORTING - 2018:                                                                                 POSEIDON PRINCIPLES - 2019:
  Obligation to present business model and E&S risks                                                               Decarbonising the shipping industry
                                                                        2019                             STRENGTHENED COAL POLICY - 2019:
                                                                                  Introduction of corporate exclusion and target to reduce exposure to 0
                                                                                                                                         TCFD - 2019:
                                                                                                                         Publication of first TCFD report

                                                     E&S RISK INTEGRATION IN THE BUSINESS MIX
                                                AND GREATER TRANSPARENCY OF E&S RISK MANAGEMENT
                                                                                                                         French law
                                                         BOARD ANNUAL REVIEW OF E&S STRATEGY                             European law
                                                                                                                         SG commitment

                                                                                                PRESENTATION TO DEBT INVESTORS SEPTEMBER 2019               38
WORKING WITH REGULATION TO SHAPE STRATEGY

                  FRANCE CONTINUES TO ENHANCE ITS SUSTAINABLE AND CLIMATE-RELATED REGULATION,
                  STRENGTHENING THE PIONEERING ROLE OF THE PARIS MARKETPLACE IN GREEN FINANCE

     Law on Energy Transition for Green              Grenelle 2 Law – Article 225 /
     Growth - Article 173                                                                                Duty of Care Bill
                                                     EU Non Financial Directive

    In August 2015 France became the first           In 2012, it became compulsory for French            In March 2017, following the UK Modern
    country to introduce mandatory climate           companies to report on the Environmental            Slavery Act, France made it compulsory for
    change-related reporting.                        and Social impacts of their business and to         companies with over 5,000 employees to
                                                     have this information audited.                      implement a vigilance plan whose objective
    Article 173 makes it compulsory for investors
                                                                                                         is to map, measure and mitigate human
    to explain how they take climate risks and       From 2018, the EU Non-Financial Information
    ESG criteria in their investment decisions, in   Directive will reinforce the article 225, and       rights and environmental risks, on a
                                                                                                         worldwide basis.
    line with the voluntary recommendations of       require companies to focus on their major
    the Financial Stability Board’s Taskforce on     E&S risks and on the management of the
    Climate-related Financial Disclosures (TCFD).    adverse impacts of their worldwide activities.

    SG is an active member of the UNEP FI                                                                SG sees this as an opportunity to
                                                     SG is fully supportive of these French
    working group on the TCFD disclosure                                                                 strengthen its existing E&S practices
                                                     and EU regulations, having reported
    and committed to align to these                                                                      and published its Duty of Care Plan
                                                     on E&S impacts since 2003
    recommendations                                                                                      in February 2018

                                                                                                      PRESENTATION TO DEBT INVESTORS SEPTEMBER 2019   39
CONTRIBUTION TO THE SUSTAINABLE DEVELOPMENT OF AFRICA

    SUPPORT FOR AFRICAN SMEs                                                                     INFRASTRUCTURE FINANCING

      Creation of “SME Centres” in each SG Africa subsidiary,                         A key aspect of development in Africa in which the bank is
       bringing together different stakeholders to work together                        already strongly involved. Four areas of focus: energy,
       for business development (public bodies, multilaterals,                          transport, water and waste management and sustainable
       development agencies, private sector, funds etc)                                 cities
                                                                                                   Double Africa workforce dedicated to structured
            Increase outstanding loans to African SMEs by 60%                                      finance by 2019
            over the next 5 years (+ EUR 4bn)
                                                                        GROW                       Increase financial commitments related to structured
                                                                                                   finance in Africa by 20% over the next 3 years
                                                                         WITH
    INNOVATIVE FINANCING                                                AFRICA                                 FINANCIAL INCLUSION
                                                                 LEVERAGING OPERATIONS IN 19
      Improve support of agriculture industries, through                                       Launch of YUP mobile money in 2017 to address
                                                                  COUNTRIES AND HISTORICAL
       a more collaborative approach with farmers,                                               the poorly and unbanked population of Africa.
                                                                   PRESENCE OVER A CENTURY       Introduced in Cote d’Ivoire, Senegal and Burkina
       cooperatives and SMEs
                                                                                                 Faso with more than 300 000 clients at Nov.18
      Support energy inclusion and promote renewable
       energy sources                                                                           Continue to grow microfinance business
            Provide access to range of banking and non-banking                                           Reach 1 million clients with YUP by 2020 and
            services (healthcare, education, advisory) to one                                            roll out to 4 additional countries
            million farmers over the next 5 years, via YUP
            platform                                                                                     Double outstanding loans to microfinance
                                                                                                         organisations by 2022

                                                                                                                                      Targets

                                                                                                  PRESENTATION TO DEBT INVESTORS SEPTEMBER 2019           40
A THREE YEAR CULTURE AND CONDUCT PROGRAMMME TO
ACCELERATE OUR CULTURAL TRANSFORMATION
     THE PROGRAMME HAS 3 MAIN OBJECTIVES...

        Accelerate our cultural transformation

        Achieve the highest standards of quality of service, integrity and behaviour

        Make our culture a key differentiating factor: integrity and ethics, creating performance and a competitive advantage

             …TO BE ACHIEVED OVER 3 YEARS

                       2017                                        2018                                       2019

          Develop the Programme architecture           Ensure the Programme                    Complete Programme roll-out:
           and roadmap                                   becomes highly visible                   fully embedding deliverables
          Communicate to business and service          Deliver on our core conduct              and alignment of HR processes
           units                                         priorities                              Prepare the transition to full
          Launch first deliverables                                                              ownership by business and service
                                                                                                  units

                                                                                           PRESENTATION TO DEBT INVESTORS SEPTEMBER 2019   41
CULTURE & CONDUCT
RELYING ON A MULTI-PRONGED APPROACH
             • Culture & Conduct programme launched January 2017: implementation discussed by the Board twice a year
             • Overall responsibility for the programme is with General Management : the Group Head of Culture & Conduct
               reports directly to the CEO and delivers an annual dashboard of indicators
             • Managers and Excos of each Business/Service Unit champion and lead on culture and conduct which is directly
               under their responsibility

             • The Board formally endorsed the Code of Conduct in 2016 and the Anti-Corruption and Anti-Bribery Code in 2017
             • 2018 global roll-out of a mandatory Conduct Journey Workshop to all active staff, with an additional appropriation all-
               staff test

             • Redefining and broadening our definition of conduct risk and embedding this definition into overall Group risk
               management framework, so that risks can be better identified, assessed and mitigated across the Group

             • Annual dashboard for General Management with indicators on culture and conduct covering regulatory training,
               compliance dysfunctions, operational losses resulting from misconduct, sanctions and compensation reviews,
               results of internal staff survey

             • Alignment of HR processes, including sanctions, performance evaluation and compensation, recruitment and
               induction, talent development
             • Providing tools to support and encourage an ethical approach

             • Communication on 3 levels (General Management, Business/ Service Unit and local level) to embed culture and
               conduct topics into the daily lives of staff

                                                                                 PRESENTATION TO DEBT INVESTORS SEPTEMBER 2019           42
5   SUPPLEMENT
RESILIENT BUSINESS MODEL IN A
"LOW FOR LONG" RATE ENVIRONMENT
           GLOBAL BANKING AND                                                                                                                           FRENCH RETAIL
           INVESTOR SOLUTIONS                                                                                                                           BANKING
 >75% of revenues generated by non                                                                                                            ~50% of revenues generated by non
 interest income                                                                                                                              interest income
 Direct sensitivity to Eurozoneratesmainly                                                                                                    Dynamic loan book growth supporting net
 related to Securities Services and GTB                                                    ~10%                                               interest margin
                                                                                     of Group revenues                                        Direct sensitivity to Eurozone rates related
                                                                                    coming from deposit                                       to deposit margin
                                                                                     margin collected in
                                                                                      Eurozone retail
           FINANCIAL SERVICES                                                             banking                                                       INTERNATIONAL
           & INSURANCE                                                                                                                                  RETAIL BANKING
 >95% of revenues generated by                                                                                                                >25% of revenues generated by non
 non interest income                                                                                                                          interest income
                                                                                                                                              Supportive interest rate environment
                                                                                                                                              combined with strong loan growth

           Deposit margin collected in Eurozone retail banking

Based on net banking income as disclosed in the 2018 financial statements, revenues generated by non interest income are all revenues except interest income

                                                                                                                               PRESENTATION TO DEBT INVESTORS SEPTEMBER 2019                 44
GROUP
QUARTERLY INCOME STATEMENT BY CORE BUSINESS

                                                                                       International Retail Banking   Global Banking and Investor
                                                        French Retail Banking                                                                         Corporate Centre                  Group
                                                                                          and Financial Services               Solutions

In EURm                                                  Q2 19            Q2 18            Q2 19           Q2 18         Q2 19           Q2 18      Q2 19          Q2 18       Q2 19            Q2 18

Net banking income                                       1,994            1,991            2,124           2,075         2,266           2,412      (100)           (24)      6,284             6,454

Operating expenses                                      (1,348)           (1,361)         (1,145)         (1,102)       (1,915)         (1,728)      138           (212)      (4,270)           (4,403)
Gross operating income                                    646              630              979            973            351             684         38           (236)      2,014             2,051

Net cost of risk                                         (129)             (93)            (133)           (75)           (33)            (7)        (19)            5        (314)              (170)

Operating income                                          517              537              846            898            318             677         19           (231)      1,700             1,881
Net income from companies accounted for by the equity
                                                           2                10              (1)              2             2               3          2             (2)         5                 13
method
Net profits or losses from other assets                    1                 1               0               0             0              (15)       (81)           (28)       (80)              (42)

Impairment losses on goodwill                              0                 0               0               0             0               0          0              0          0                  0

Income tax                                               (164)             (183)           (193)           (230)          (40)           (152)        7             117       (390)              (448)
O.w. non controlling Interests                             0                 0              137            129             6               6          38             45        181               180
Group net income                                          356              365              515            541            274             507        (91)          (189)      1,054             1,224

Average allocated capital                               11,306            11,066          11,051          11,452        15,543           14,965     12,350 *       10,484 *   50,250            47,967
Group ROE (after tax)                                                                                                                                                         6.9%               8.6%

  Net banking income, operating expenses, allocated capital, ROE: see Methodology
* Calculated as the difference between total Group capital and capital allocated to the core businesses

                                                                                                                                          PRESENTATION TO DEBT INVESTORS SEPTEMBER 2019                   45
GROUP
HALF YEAR INCOME STATEMENT BY CORE BUSINESS

                                                                                                     International Retail Banking   Global Banking and Investor
                                                                          French Retail Banking                                                                     Corporate Centre                  Group
                                                                                                        and Financial Services               Solutions

In EURm                                                                    H1 19          H1 18            H1 19         H1 18         H1 19           H1 18      H1 19          H1 18       H1 19            H1 18

Net banking income                                                         3,910          3,999           4,200          4,064         4,505           4,627      (140)            58       12,475            12,748

Operating expenses                                                        (2,834)        (2,841)          (2,349)       (2,281)       (3,941)         (3,752)       65           (258)      (9,059)           (9,132)
Gross operating income                                                     1,076          1,158           1,851          1,783          564             875        (75)          (200)      3,416             3,616

Net cost of risk                                                           (223)          (227)           (261)          (166)          (75)            20         (19)           (5)       (578)              (378)

Operating income                                                           853             931            1,590          1,617          489             895        (94)          (205)      2,838             3,238

Net income from companies accounted for by the equity method                4              16               4              8             4               3          3              2          15                29

Net profits or losses from other assets                                     2               2               1              4             0              (15)      (134)           (32)      (131)              (41)

Impairment losses on goodwill                                               0               0               0              0             0               0          0              0          0                  0

Income tax                                                                 (269)          (314)           (371)          (418)          (68)           (199)        63            166       (645)              (765)
O.w. non controlling Interests                                              0               0              245           241            11              11          81             82        337               334
Group net income                                                           590             635             979           970            414             673       (243)          (151)      1,740             2,127

Average allocated capital                                                 11,281          11,226          11,334        11,440        16,062           14,856     11,165 *       10,223 *   49,842            47,745
Group ROE (after tax)                                                                                                                                                                       5.5%               7.5%

  Net banking income, operating expenses, allocated capital, ROE: see Methodology
* Calculated as the difference between total Group capital and capital allocated to the core businesses

                                                                                                                                                PRESENTATION TO DEBT INVESTORS SEPTEMBER 2019                           46
GROUP: IAS 12 AMENDMENT IMPACT
RECONCILIATION WITH 2017/18 AND Q1 19 REPORTED FIGURES

                                                          Income Tax                            Group Net Income
                                               Reported   IAS 12 impact   Adjusted   Reported     IAS 12 impact    Adjusted
                                       2017     (1,708)       198          (1,510)    2,806           198           3,004
                                       Q1 18     (370)         53           (317)      850             53            903
                                       Q2 18     (516)         68           (448)     1,156            68           1,224
                                       H1 18     (886)        121           (765)     2,006           121           2,127
                                       Q3 18     (539)         75           (464)     1,234            75           1,309
                                       Q4 18     (136)         61           (75)       624             61            685
                                       2018     (1,561)       257          (1,304)    3,864           257           4,121
                                       Q1 19     (310)         55           (255)      631             55            686

IAS 12 impacts only Corporate Centre

                                                                                              PRESENTATION TO DEBT INVESTORS SEPTEMBER 2019   47
GROUP: UNDERLYING DATA
RECONCILIATION WITH REPORTED FIGURES
                                                                                                               Net profit or losses
           Q2 19 (in EURm)                                Operating Expenses        Net cost of risk                                         Group net income         Business
                                                                                                               from other assets
           Reported                                                       (4,270)                      (314)                          (80)                  1,054
           (+) IFRIC 21 linearisation                                       (138)                                                                           (101)
           (-) Restructuring provision*                                     (256)                                                                           (192) GBIS (EUR -227m) / IBFS (EUR -29m)
           (-)Group refocusing plan                                                                     (18)                          (84)                  (102) Corporate Centre
           Underlying                                                     (4,152)                      (296)                            4                   1,247

                                                                                                               Net profit or losses
           Q2 18 (in EURm)                                Operating Expenses        Net cost of risk                                         Group net income         Business
                                                                                                               from other assets
           Reported                                                       (4,403)                      (170)                          (42)                  1,224
           (+) IFRIC 21 linearisation                                       (167)                                                                           (118)
           (-) Provision for disputes                                       (200)                                                                           (200) Corporate Centre
           (-)Group refocusing plan                                                                                                   (27)                      (27) Corporate Centre
           Underlying                                                     (4,370)                      (170)                          (15)                  1,333

                                                                                                               Net profit or losses
           H1 19 (in EURm)                                Operating Expenses        Net cost of risk                                         Group net income         Business
                                                                                                               from other assets
           Reported                                                       (9,059)                      (578)                      (131)                     1,740
           (+) IFRIC 21 linearisation                                        303                                                                                222
           (-) Restructuring provision*                                     (256)                                                                           (192) GBIS (EUR -227m) / IBFS (EUR -29m)
           (-)Group refocusing plan                                                                     (18)                      (137)                     (177) Corporate Centre
           Underlying                                                     (8,500)                      (560)                            6                   2,332

                                                                                                               Net profit or losses
           H1 18 (in EURm)                                Operating Expenses        Net cost of risk                                         Group net income         Business
                                                                                                               from other assets
           Reported                                                       (9,132)                      (378)                          (41)                  2,127
           (+) IFRIC 21 linearisation                                        338                                                                                236
           (-) Provision for disputes                                       (200)                                                                           (200) Corporate Centre
           (-)Group refocusing plan                                                                                                   (27)                      (27) Corporate Centre
           Underlying                                                     (8,594)                      (378)                          (14)                  2,590

    GBIS restructuration provision allocation : Global Markets and Investor Services (EUR 160m), Financing & Advisory (EUR 45m), Asset and Wealth Management (EUR 22m)

                                                                                                                                      PRESENTATION TO DEBT INVESTORS SEPTEMBER 2019                    48
GROUP
IFRIC 21 IMPACT
                                                                 International Retail
                                                                                         Global Banking and
                                        French Retail Banking   Banking and Financial                                 Corporate Centre                  Group
                                                                                         Investor Solutions
                                                                       Services

   In EURm                               H1 19        H1 18      H1 19        H1 18      H1 19          H1 18        H1 19            H1 18     H1 19           H1 18

   Total IFRIC 21 Impact - costs         -100          -108       -112         -129      -346               -393      -48              -47       -606           -677
                 o/w Resolution Funds     -70           -66        -42          -47       -262              -313       -2               -1       -376           -427

                                        International Retail    Financial Services to
                                                                                                Insurance                    Total
                                              Banking               Corporates

   In EURm                               H1 19        H1 18      H1 19        H1 18      H1 19          H1 18        H1 19            H1 18

   Total IFRIC 21 Impact - costs          -75          -90         -7           -10       -30               -30       -112            -129
                 o/w Resolution Funds     -40          -45         -2            -2                                    -42             -47

                                                                                                                                                                              Africa, Asia,
                                                                                                                                                                                                 Total International Retail
                                          Western Europe           Czech Republic                Romania                     Russia                Other Europe         Mediterranean bassin and
                                                                                                                                                                                                          Banking
                                                                                                                                                                                Overseas

   In EURm                               H1 19        H1 18      H1 19        H1 18      H1 19          H1 18        H1 19            H1 18     H1 19           H1 18     H1 19         H1 18        H1 19        H1 18

   Total IFRIC 21 Impact - costs          -8            -9        -34           -35       -16                -9        -1              -2        -10             -24        -5           -11          -75           -90
                 o/w Resolution Funds     -5            -4        -27           -27        -5                -4                                   -2              -9                                  -40           -45

                                         Global Banking and                               Asset and Wealth         Total Global Banking and
                                                                Financing and Advisory
                                          Investor Services                                 Management                Investor Solutions

   In EURm                               H1 19        H1 18      H1 19        H1 18      H1 19          H1 18        H1 19            H1 18

   Total IFRIC 21 Impact - costs         -246          -303       -89           -79       -10               -11       -346            -393
                 o/w Resolution Funds    -197          -250       -56           -54        -9                -9       -262            -313

                                                                                                                                              PRESENTATION TO DEBT INVESTORS SEPTEMBER 2019                                   49
GROUP
CRR/CRD4 PRUDENTIAL CAPITAL RATIOS
                                                              _Fully Loaded Common Equity Tier 1, Tier 1 and Total Capital
                                                               In EUR bn                                                     30/06/2019         31/12/2018
                                                               Shareholder equity Group share                                          62.5               61.0
                                                               Deeply subordinated notes*                                              (9.9)               (9.3)
                                                               Undated subordinated notes*                                             (0.3)               (0.3)

                                                               Dividend to be paid & interest on subordinated notes                    (0.9)               (1.0)
                                                               Goodwill and intangible                                                 (6.4)               (6.7)

                                                               Non controlling interests                                                  3.7                3.7
                                                               Deductions and regulatory adjustments                                   (5.4)               (5.3)
                                                               Common Equity Tier 1 Capital                                            43.4               42.0
                                                               Additionnal Tier 1 Capital                                                 9.9                9.4
                                                               Tier 1 Capital                                                          53.3               51.4
                                                               Tier 2 capital                                                           11.4               11.5

                                                               Total capital (Tier 1 + Tier 2)                                         64.7               62.9

                                                               Risk-Weighted Assets                                                     361                376

                                                               Common Equity Tier 1 Ratio                                            12.0%              11.2%

                                                               Tier 1 Ratio                                                          14.8%              13.7%

                                                               Total Capital Ratio                                                   17.9%              16.7%

Ratios based on the CRR/CDR4 rules as published on 26th June 2013, including Danish compromise for insurance. See Methodology. For 31/12/2018, dividend to be paid calculated assuming a 50% takeup on 2018 scrip dividend
*      Excluding issue premiums on deeply subordinated notes and on undated subordinated notes
**     Fully loaded deductions

                                                                                                                                            PRESENTATION TO DEBT INVESTORS SEPTEMBER 2019                                    50
GROUP
CRR LEVERAGE RATIO

                                                                                   _CRR Fully Loaded Leverage Ratio(1)

                                                                                                                              30/06/2019          31/12/2018
                                                                In EUR bn
                                                               Tier 1 Capital                                                           53.3                51.4

                                                               Total prudential balance sheet (2)                                       1,244              1,175

                                                               Adjustement related to derivative exposures                                 (89)                (46)

                                                               Adjustement related to securities financing transactions*                    (7)                (11)

                                                               Off-balance sheet (loan and guarantee commitments)                          102                 100
                                                               Technical and prudential adjustments (Tier 1 capital
                                                                                                                                           (10)                (10)
                                                               prudential deductions)

                                                               Leverage exposure                                                       1,240              1,208

                                                               CRR leverage ratio                                                       4.3%               4.3%

(1)   Fully loaded based on CRR rules taking into account the leverage ratio delegated act adopted in October 2014 by the European Commission. See Methodology. Tier 1 capital calculated assuming a 50% takeup on 2018 scrip
      dividend
(2)   The prudential balance sheet corresponds to the IFRS balance sheet less entities accounted for through the equity method (mainly insurance subsidiaries)
•     Securities financing transactions: repos, reverse repos, securities lending and borrowing and other similar transactions

                                                                                                                                             PRESENTATION TO DEBT INVESTORS SEPTEMBER 2019                                      51
You can also read