Piramal Enterprises Limited Investor Presentation - February 2019

Page created by Sandra Foster
 
CONTINUE READING
Piramal Enterprises Limited Investor Presentation - February 2019
Piramal Enterprises Limited
Investor Presentation
February 2019
Piramal Enterprises Limited Investor Presentation - February 2019
Piramal Enterprises Limited – Investor Presentation                                                                                                                                                     Page 2

Disclaimer
 Except for the historical information contained herein, statements in this presentation and any subsequent discussions, which include words or phrases such as 'will', 'aim',
 'will likely result', 'would', 'believe', 'may', 'expect', 'will continue', 'anticipate', 'estimate', 'intend', 'plan', 'contemplate', 'seek to', 'future', 'objective', 'goal', 'likely', 'project',
 'on-course', 'should', 'potential', 'pipeline', 'guidance', 'will pursue' 'trend line' and similar expressions or variations of such expressions may constitute 'forward-looking
 statements'.

 These forward-looking statements involve a number of risks, uncertainties and other factors that could cause actual results to differ materially from those suggested by the
 forward-looking statements.

 These risks and uncertainties include, but are not limited to Piramal Enterprise Limited’s ability to successfully implement its strategy, the Company’s growth and expansion
 plans, obtain regulatory approvals, provisioning policies, technological changes, investment and business income, cash flow projections, exposure to market risks as well as
 other risks.

 Piramal Enterprises Limited does not undertake any obligation to update forward-looking statements to reflect events or circumstances after the date thereof.

 These materials are not a prospectus, a statement in lieu of a prospectus, an offering circular, an invitation or an advertisement or an offer document under the Indian
 Companies Act, 2013 together with the rules and regulations made thereunder, the Securities and Exchange Board of India (Issue of Capital and Disclosure Requirements)
 Regulations, 2009, as amended, or any other applicable law in India. The securities referred to herein have not been and will not be registered under the U.S. Securities Act of
 1933, as amended, and may not be offered or sold in the United States, except pursuant to an applicable exemption from registration. No public offering of securities is being
 made in the United States or in any other jurisdiction.

 Note: Figures in previous periods might have been regrouped or restated, wherever necessary to make them comparable to current period.
Piramal Enterprises Limited Investor Presentation - February 2019
Piramal Enterprises Limited – Investor Presentation                                                                                                                                           Page 3

   Piramal Enterprises Limited: Business Overview
                                                                                                                                                    9M FY19 Revenues:
                                                                                   Piramal Enterprises                                          Rs. 9,536 Cr (~USD 1.4 Bn)3

                          Financial Services                                                     Pharma                                           Healthcare Insight and Analytics

                  9M FY19 Revenue Contribution: 54%                                9M FY19 Revenue Contribution: 35%                               9M FY19 Revenue Contribution: 11%

           Wholesale Lending                                                Global Pharma                                                   Decision Resources Group (DRG)
           •   Loan Book of Rs. 51,335 Crs (~USD 7.4bn)3                    • Strong portfolio of differentiated branded                    •    Serving a large number of healthcare
           •   ROE of 19.4%2; GNPA ratio of 0.5%                                generic products                                                 companies

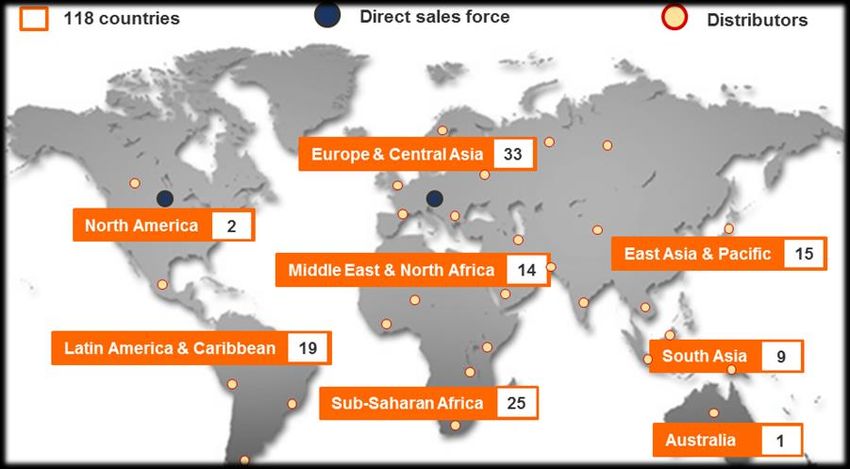
           Alternative Asset Management
                                                                            • Distribution to 100+ countries                                •    Leveraging proprietary data
           • AuM of Rs. 9,095 Crores4                                       • Integrated solutions across APIs, formulations                •    Offers information and analytical insights
           • Marquee partners: CDPQ, APG, Bain, CPPIB                           and delivery systems
                                                                                                                                            •    Global team of over 1,200 eminent industry
           Housing Finance                                                  • 13 sites (9 USFDA inspected) across US, UK                         experts (380+ in India)
                                                                                and India
           • Loan Book Size: INR 3,920 Cr. (~USD 0.5 bn)                                                                                    •    Recurring revenue model and high client
           • Launched HFC in Sep 2017 and expanded                                                                                               retention
              presence to Mumbai, Pune, Delhi-NCR, etc.
           Diversified Retail Exposure via Shriram                          India Consumer Products
           • 20% stake in SCL, 10% stake in both STFC and                   •   Among the leading Indian OTC players
              SCUF5                                                         •   Pan-India distribution network
           • Strong position in CVs, SME, Insurance
                   9M 2019 Capital Employed1 : 59%                                  9M 2019 Capital Employed1 : 23%                                 9M 2019 Capital Employed1 : 18%
Notes: 1) As per books. Excludes unallocated portion of capital employed to various business segments; 2) ROE for current reported period 9M FY2019 is considering Cash Tax and other synergies from merger;
3) Exchange rate for revenues is Rs. 69.8 / USD and for Loan book is Rs. 69.7 / USD   4) In addition, JV with Bain Capital Credit has Assets Under Management of ~INR 734 Crores as on 31 Dec, 2018
5) SCL: Shriram Capital Limited; STFC: Shriram Transport Finance; and SCUF: Shriram City Union Finance
Piramal Enterprises Limited Investor Presentation - February 2019
Piramal Enterprises Limited – Investor Presentation                                                                                                                                            Page 4

                                                                                                                                                                                               (In INR Crores)
     Growth and Profitability track record
                                         9M Total Revenues                                                                                   Normalised Net Profit1,2.3

                                                                                         9,536

                   4-year CAGR – 26%                                                                                          4-year CAGR – 46%
                                                                                                                                                                                                 1,466
                                                                      7,648
                                                                                                                                                                               1,176
                                                    6,084
                                                                                                                                                              941
                                 4,690
              3,825                                                                                                                         712

                                                                                                                         321

               9M                 9M                 9M                 9M                9M                              9M                9M                9M                9M                 9M
              FY15               FY16               FY17               FY18              FY19                            FY15              FY16              FY17              FY18               FY19

Note:
1. FY2016 - FY2019 results have been prepared based on IND AS, prior periods are IGAAP; 2) 9M FY2015 net profit excludes exceptional gain on sale of 11% stake in Vodafone India partly offset by the amount
written down on account of scaling back of our investments in NCE research; 3) 9MFY2019 normalised net profit excludes non-recurring and non-cash accounting charge towards imaging assets in Q1FY2019
Piramal Enterprises Limited Investor Presentation - February 2019
Piramal Enterprises Limited – Investor Presentation                                                                                                                                          Page 5

     Consistent performance                                                                                                                                                      (In Rs. Crores)
                                                                    Revenues                                                                           Net Profits
               Period               Reported Period              Previous Period              % YoY Change              Reported Period             Previous Period              % YoY Change
               Q2FY16                       1,504                       1,243                       +21%                        235                          41                        +473%

               Q3FY16                       1,786                       1,400                       +28%                        307                         224                        +37%

               Q4FY16                       1,691                       1,298                       +30%                        193                         100                        +93%

               Q1FY17                       1,776                       1,401                       +27%                        231                         169                        +36%

               Q2FY17                       1,966                       1,504                       +31%                        306                         235                        +30%

               Q3FY17                       2,342                       1,786                       +31%                        404                         307                        +32%

               Q4FY17                       2,463                       1,691
                                                                                     Financial
                                                                                            +46%
                                                                                                 Services                       311                         193                        +61%

               Q1FY18                       2,254                       1,776                       +27%                        302                         231                        +31%

               Q2FY18                       2,536                       1,966                       +29%                        384                         306                        +25%

               Q3FY18                       2,858                       2,342                       +22%                        490                         404                        +21%

               Q4FY182                      2,991                       2,463                       +21%                        375                         311                        +21%

               Q1FY193                      2,902                       2,254                       +29%                        382                         302                        +27%

               Q2FY19                       3,144                       2,536                       +24%                        480                         384                        +25%

               Q3FY19                       3,489                       2858                        +22%                        603                         490                        +23%

             14 consecutive quarters of delivering 20%+ revenue growth                                14 consecutive quarters of delivering 20%+ Normalised Net Profit growth

Note: 1) FY2016, FY2017, FY2018 & FY2019 results have been prepared based on IND AS 2) Q4FY2018 normalised net profit excludes synergies from reverse merger of subsidiaries in Financial services segment;
3) Q1FY2019 normalised net profit excludes non-recurring and non-cash accounting charge towards imaging assets
Piramal Enterprises Limited Investor Presentation - February 2019
Piramal Enterprises Limited – Investor Presentation                                                                                                                                      Page 6

  Strong performance trend in Financial Services
                            Financial Services Performance                                                                              Performance Highlights
                                                                                     (in INR Cr)                        Asset Quality
               Loan Book                        ROE1 (%)
                                                                                                                • Consistently maintained healthy asset quality; GNPA below 1%
                                                                                                                  since last 11 quarters
       NR*         15%         16%         20%         25%+        25%+          19%        19.4%
                                                                                                                              ROE
                                                                                                                • ROE of 25%+ over last 10 consecutive quarters, prior to the
                                                                                           55,255
               Gross NPA ratio as on                                                                              fund raise
               31 Dec 2018 is 0.5%                                                   Financial Services            — 9M FY2019 ROE of 19.4%2
                                                                                 42,168
                                                                                                                  Portfolio Diversification

                                                                                                                • Housing finance loan book grew 69% QoQ to Rs.3,920 Crores,
                                                                   24,975                                         despite the volatile environment.
                                                                                                                     − The business constitutes ~7% of overall loan book in
                                                       13,338                                                           Dec-2018 vs. 1% in Dec-2017
                                            4,766                                                                           Growth
                   2,016        2,861
        350                                                                                                     • Delivered 45%+ YoY growth in loan book in each of the last 15
                                                                                                                  quarters
       FY12         FY13        FY14        FY15        FY16        FY17         FY18     9M FY19
                                                                                                                     − During 9MFY2019, loan Book grew 45% YoY to Rs.
                                                                                                                        55,255 Crores

*Not reported        Notes: 1) ROE for past periods are reported for full year     2) ROE for current reported period 9M FY2019 considers Cash Tax and other synergies from merger   3) FY2016 - FY2019
results have been prepared based on IND AS, prior periods are IGAAP
Piramal Enterprises Limited Investor Presentation - February 2019
Piramal Enterprises Limited – Investor Presentation                                                                                                                                              Page 7

     Financial Services: Performing better than peers, despite volatile
     environment                                          PEL’s relative position vs. median for peers
                                                                                                                                                           Above  In-line  Below

                                                                                            PEL’s
      Particulars                                                                                   Median –
                                                                             PEL           relative                           Peer 1           Peer 2          Peer 3           Peer 4           Peer 5
      As on Dec 31, 2018, unless otherwise stated                                                    Peers
                                                                                           position

      Loan book growth – YoY (%)                                             45%                             28%              41%              13%              28%              28%              22%

      NIM – 9M FY19 (%)                                                     6.6%
                                                                                      Financial
                                                                                          
                                                                                                Services
                                                                                                 5.0%    11.7%                                  3.5%             7.0%            2.4%             5.0%

      Gross NPA ratio (%)                                                   0.5%                             1.8%             1.8%             1.2%             2.7%            0.5%             6.7%

      Debt-to-equity (D/E)1 (x)                                              4.6x                            6.3x             6.2x             3.4x             7.8x             9.2x             6.3x

      ROE2 – 9M FY19 (%)                                                     19%                             18%              16%              20%              21%              16%              18%

      Price-to-book multiple (x)                                               -                -             3.6x             9.0x             3.7x             3.6x             2.2x             2.0x

Note: Peer data as reported. Peer set includes (not necessarily in the same order): Bajaj Finance, Cholamandalam Finance, HDFC Ltd., L&T Finance and PNB Housing Finance.
(1) D/E multiple for HDFC Ltd. and LIC Housing Finance as of Sep 30, 2018; Gearing multiple for PNB Housing Finance; D/E multiple for PEL’s lending business only, excludes investments in Shriram companies, DTA
benefit from reverse merger and equity allocated to the Alternate AUM business. Overall D/E multiple for PEL’s Financial Services business is 2.7x as of Dec-2018, including investments in Shriram
(2) ROE for PEL on a cash tax basis (considering the capital allocation from the fund raise); Operating Return on Embedded Value for HDFC           Source: Company filings / disclosures, Bloomberg
Piramal Enterprises Limited Investor Presentation - February 2019
Piramal Enterprises Limited – Investor Presentation                                                                                                                                    Page 8

 Consistent performance trend: Pharma
                                  Pharma Performance                                                                                   Performance Highlights
                                                                                      (in INR crores)
              Pharma Revenue1,2,3,4             Global Pharma EBITDA Margin (%)                                          Growth

        4%        9%        12%       15%       17%       17%       15%      21%         21%                  • PEL’s Pharma revenue has grown at a CAGR of 16% over last
                                                                                                                8 years

                                                                                         3,308
                                                                                                                       Profitability

           8 yrs Revenue                                                      2,992                      • Global Pharma (accounts for 93% of Pharma revenues1) has
            CAGR – 16%
                                                           2,538
                                                                     2,679     Financial              Services
                                                                                                           delivered a strong growth in EBITDA margins from 4% in 9M
                                                                                                           FY11 to 21% in 9M FY19
                                                 2,202
                                                                                                                 Quality & Compliance
                                       1,981
                              1,731                                                                           • Successfully cleared 32 USFDA inspections, 130 other
                                                                                                                regulatory audits and 964 customer audits, since FY 2011
                    1,352

          1,021                                                                                                  Differentiated Model
                                                                                                              • Our differentiated business model has enabled us to
                                                                                                                perform better than most of the other Indian Pharma
           9M        9M        9M       9M        9M        9M        9M       9M         9M                    companies
          FY11      FY12      FY13     FY14      FY15      FY16      FY17     FY18       FY19
Notes:                                                                                           3.     Global Pharma revenue accounted for 93% of the overall Pharma revenue during 9MFY19
1. Excludes revenue from JV with Allergan                                                        4.     Pharma revenue includes Global Pharma and consumer products
2. FY2016 - FY2019 results have been prepared based on IND AS, prior periods are IGAAP
Piramal Enterprises Limited Investor Presentation - February 2019
Piramal Enterprises Limited – Investor Presentation                                                                                                                          Page 9

Pharma: Our differentiated business model enabling better performance
vs. peers                                         PEL’s relative position vs. median for peers
                                                                                                                                                 Above  In-line  Below

                                                       PEL -              PEL’s
                                                                                           Median -
Particulars                                           Overall            relative                               Peer 1             Peer 2        Peer 3     Peer 4     Peer 5
                                                                                            Peers
                                                      Pharma             position

                             FY16                        16%                                  12%                12%                 4%          5%         22%        15%

    Revenue                  FY17                        12%                 
                                                                                  Financial
                                                                                         8%
                                                                                            Services
                                                                                                 23%                                 11%          (9%)       6%         8%
  growth – YoY
      (%)                    FY18                        11%                                   1%                (9%)              (14%)         1%         3%         9%

                             9M FY19                     11%                                   7%                 4%                12%          7%         4%         15%

EBITDA margin1 – 9M FY19 (%)                             21%                                  20%                19%                23%          22%        18%        20%

EV / EBITDA (x)2                                           -                  -                17x                17x                17x          17x        16x        13x

Note: Pharma peer set includes (not necessarily in the same order): Aurobindo Pharma, Cipla, Dr. Reddy’s Lab, Lupin and Sun Pharma
(1) EBITDA margin for PEL is for the Global Pharma business (93% of overall Pharma business)    (2) Trailing twelve months as of Feb 13, 2019
Source : Companies reported numbers, Stock Exchange Filings, Bloomberg
Piramal Enterprises Limited Investor Presentation - February 2019
Piramal Enterprises Limited – Investor Presentation                                                                                                                                              Page 10

 Creating significant value for shareholders
   Shareholder value creation in less than 3 decades                                                                                                                                          (In INR Crores)
                         Incremental Market cap                          Dividend Paid                 Capital Returned through Buyback                         Capital Raised

                               A. Before Sale of our Domestic Formulation business to Abbott                                       B. Sale Period            C. Post sale                 A+B+C

                                                                                                                                                               31,1124                    43,7084

                                                                                                                                                                  6,974                    7,467

                                                                                       Financial Services                                                        21,124
                                                                                                                                                                                          36,241
                                                                                                                                        7,396
                                                                                                                4,0644
                                                                       3874               7154
                     7                     26

              FY1988                 FY1989-1992                FY1993-1997         FY1998-2003             FY2004-2009            FY2010-2011              FY2012-2019                 As on Date 3
Note:    1.   Company raised less than INR 500 Cr during the entire period (includes initial capital           3.   Analysis carried out based on market information till 31 Jan 2019
              invested in the company in 1988)                                                                 4.   Value Creation total numbers includes Capital Raised amount
         2.   All numbers till 1992 represents book value

                                                    23%                                                  29%                                                28%*
                                                                                                                                          Annualized return to shareholders over
                                     Revenue CAGR for last 30 years                      Net Profit CAGR for last 30 years
                                                                                                                                                       last 30 years
Source : Bloomberg        * Assumed dividend reinvested in the stock
Piramal Enterprises Limited – Investor Presentation                                                                                                                                                        Page 11

   Long-term returns to shareholders consistently outperforming benchmarks
    Consistently delivered strong shareholder returns – significantly                                                 INR 5,680 Cr3,4,5 returned to shareholders since sale of Domestic
    higher than benchmarked indices¹                                                                                  Formulations business in 2010
                                                                                                                                                                                                          (INR Cr)
                        5 year Annualized Return2                                                                                Normal dividend                    Special dividend                 Buyback
         PEL                         30%                                                                                                                                                                                5
                                                                                                                                                                                                            5     5,680
        Nifty                        12%                                                        5215%                                                                                                   452
                                                                                                                                                                                             362
                                                                                                                                                                                  302
                                                                                                                                                           906        345
                         Nifty        PEL
                                                                                          Financial Services
                                                                                                                                                            604
                                                                                                                        2,709                    302        302
                                                                                                                                     302

                                                                                                                                                                                 4,564      4,866
                                                                                                                                                                      4,219
                                                                                      1464%
                                                                       1146%                                                                   3,011   3,313
                                                                                                                                    2,709         FY2018 Dividend Payout – 29 %
                                                                                                                         2,508
                                              322%           351%
           49%      114%            91%
                                                                                                                          201

                                                                                                                         FY11       FY12       FY13        FY14       FY15       FY16       FY17       FY18       Total
                3 Yrs                    5 Yrs                    10 Yrs                   20 Yrs

Notes:
1) Total shareholder returns are as on 31 Jan 2019. Assumes re-investment of dividend in the stock (Source : Bloomberg);      2) Annualized returns are as on 31 Jan 2019;    3) Of the buy back of 41.8 mn shares shown in
FY11, buyback of 0.7 mn shares happened in FY12;        4) Capital returned to shareholder through dividends doesn’t include amount paid under Dividend Distribution Tax;     5) Excludes any dividend payout upon
conversions of CCDs & related Rights till book closure date
Piramal Enterprises Limited – Investor Presentation                                                                                                        Page 12

Board of Directors                                                         AJAY PIRAMAL
                                                                           CHAIRMAN
                                                                           AWARDED “ASIA BUSINESS LEADER OF THE YEAR” BY CNBC ASIA
                                                                           NON - EXECUTIVE DIRECTOR, TATA SONS PRIVATE LIMITED
                                                                           CHAIRMAN, SHRIRAM CAPITAL LIMITED
                                                                           CO – CHAIR, UK–INDIA CEO FORUM

            DIRECTORS                                                                      INDEPENDENT DIRECTORS

        DR. SWATI PIRAMAL                               N VAGHUL                                 GAUTAM BANERJEE                         ARUNDHATI BHATTACHARYA
        VICE-CHAIRPERSON                                FORMER CHAIRMAN,                         SENIOR MD & Co-CHAIRMAN,                FORMER CHAIRPERSON,
        EMINENT SCIENTIST                               ICICI BANK                               ASIA OPERATING COMMITTEE,               STATE BANK OF INDIA
        AWARDED PADMA SHRI                                                                       BLACKSTONE, SINGAPORE

        NANDINI PIRAMAL
        EXECUTIVE DIRECTOR,
        OTC, HR, QUALITY & RISK
        MBA, STANFORD                                   DEEPAK M SATWALEKAR                       SIDDHARTH (BOBBY) MEHTA            S RAMADORAI
                                                        FORMER MD & CEO,                          FORMER PRESIDENT & CEO             FORMER VICE-CHAIRMAN,
                                                        HDFC STANDARD LIFE                        TRANSUNION                         TCS
        ANAND PIRAMAL
        NON-EXECUTIVE DIRECTOR,
        HEADS PIRAMAL REALTY
        MBA, HARVARD

        VIJAY SHAH                                      PROF. GOVERDHAN MEHTA                      KEKI DADISETH                     DR. R MASHELKAR
        EXECUTIVE DIRECTOR,                             EMINENT SCIENTIST                          FORMER CHAIRMAN,                  EMINENT SCIENTIST
        25+ YEARS WITH GROUP                            FORMER DIRECTOR - IISc                     HINDUSTAN UNILEVER LTD            FORMER DG, CSIR
        TURNAROUND BUSINESSES                           AWARDED PADMA SHRI                                                           AWARDED PADMA VIBHUSHAN
Piramal Enterprises Limited – Investor Presentation                                                                               Page 13

Robust Governance Mechanism

                                                               Board of Directors
                                                                                           Legal, Risk, Quality and Compliance teams are
                                                                                       independent and report directly to the Board members

                                                              Board Sub-committees

                 PHARMA                                           FINANCIAL SERVICES              HEALTHCARE INSIGHT & ANALYTICS

                                                  5 Investment Committees for Real Estate
                                                       Lending, RE Fund Management,              Healthcare Insight & Analytics
    Pharma Operations Board
                                                  Corporate Finance Transactions, Emerging                   Board
                                                   Corporate Lending and Housing Finance
                                                  •   Executive Directors
• Executive Directors                             •   Independent Directors                   • Independent Director
• Key Business CEOs                               •   Financial Services CEO                  • Business CEO
• External Experts                                •   External Experts                        • External Expert
                                                  •   Business Vertical Heads
Piramal Enterprises Limited – Investor Presentation                        Page 14

Trusted Partnerships
Our Strategic Partners

                                                        Financial Services

Our Top Investors
Piramal Enterprises Limited – Investor Presentation                                                                                                    Page 15

  Values Create Value
                                                                                                                        Tenured Leadership
                                      Partnerships

                  Long term partnerships with financial and                                               Professional management team
                  operational partners
                                                                                                          Experienced leadership with domain expertise
                  Pharma business developed through relationships
                  Long-standing relationships with global partners
                  including Allergan (JV since 1996), Bain (JV for
                  distressed debt)
                                                                                                                Alignment with Minority Shareholder Interests
                                                                             Knowledge
                                                                     Financial Services
                                                                             Action                            Largest effective promoter shareholding among
                                                                             Care                              Financial Institutions
                                                                             Impact                            No equity investments of Promoters outside of
                           Shriram –Shared Vision
                                                                                                               Piramal Group
           Retail exposure through investments in Shriram                                                      No inter-group lending to Piramal Realty
           Group
                                                                                                               ESOP program funded by Promoters since 1996
           Opportunity to invest in Shriram Group emerged due
           to matching set of values
           Mr. Ajay Piramal is the Chairman of Shriram Capital
                                                                                         Business Ethics, Integrity and Corporate Governance

                                                                                          32 US FDA Inspections cleared since 2011
                                                                                          High asset quality – GNPA1 of 0.5% in Q3 FY2019
                                                                                          Reputed and experienced Board
Note:
(1) Based on 90 days past due (DPD)
Piramal Enterprises Limited – Investor Presentation   Page 16

Financial Services
Piramal Enterprises Limited – Investor Presentation                                                                                                                                        Page 17

   Diversified exposure across both wholesale and retail financing
                                                                                                                                                                                        As on Dec 31, 2018
                                                                                            Financial Services
                                                             Loan Book – Loan Book –       AUM –        AUMInvestments
                                                                                                               –          in Shriram –
                                                             Rs. 55,255 Cr Rs. 53,793 Cr Rs. 9,095 Cr Rs. 7,620 Cr Rs. 6,782 Cr

                                        Wholesale business                                                                                          Retail business

                          Lending                                                  Alternative AUM                                 Housing Finance                Investments in Shriram
                      Loan Book –                                                       AUM –                                        Loan Book –                     Total Investments-
                      Rs. 51,335 Cr                                                   Rs. 9,095 Cr1                                  Rs. 3,920 Cr                       Rs. 6,782 Cr

  Real Estate              CFG                   ECL             Real Estate              CFG              India Resurgence Fund                         SCL                STFC                  SCUF
    Loans -              Loans –              Loans –              AUM –                AUM –                JV with Bain Capital
 Rs.40,080 Cr          Rs.9,808 Cr          Rs.1,447 Cr                                                                                              20% stake           10% stake              10% Stake
                                                                 Rs.7,265 Cr          Rs. 1,830 Cr                 Credit1

CFG – Corporate Finance Group;                         ECL – Emerging Corporate Lending;                      HFC – Housing Finance Company;                   SCL – Shriram Capital Limited;
STFC – Shriram Transport Finance Corp.                 SCUF – Shriram City Union Finance

                           Strong portfolio with total investments, loans and assets under management of over INR 70,000 Crores
(1) In addition, India Resurgence Fund (the JV with Bain Capital Credit) has Assets Under Management of ~INR 734 Crores as on 31 Dec, 2018
Piramal Enterprises Limited – Investor Presentation                                                                                                                                                                                         Page 18

Continued scaling up of loan book despite liquidity tightening
(in INR Crores)
                                                                                                                                                                      Outstanding loan book

                                                                                                                                                                                                                                                    55,255
     •

                                                                                                                                                                                                                                           52,793
            Total Loan Book grew 45% YoY to Rs. 55,255 Crores as on
            31 Dec 2018

                                                                                                                                                                                                                                  46,995
                                                                                                                                                                                                                         42,168
     •      Robust asset quality :

                                                                                                                                                                                                                38,036
              − Gross NPAs ratio (based on 90 dpd) remained stable

                                                                                                                                                                                                       33,261
                   at 0.5% as on 31 Dec 2018

                                                                                                                                                                                              28,648
                                                                                                                                                                                     24,975
              − Total provisioning maintained at 1.8%

                                                                                                                                                                            22,651
                                                                                                                                                                   19,640
                                                                                                                                                          15,998
                                                                                                                                                 13,338
                                                                                                                                        11,069
                                                                                                                               9,020
                                                                                                                      7,611
                                                                                                             4,766
                                                                                                    3,933
                                                                                           3,602
                                                                                  3,193
                                                                         2,861
                                                       2,650
                                              2,588

                                                                2,590
                                     2,016
                            1,349
                   812
          498
350
Mar-12

                                     Mar-13

                                                                         Mar-14

                                                                                                             Mar-15

                                                                                                                      Jun-15

                                                                                                                                                 Mar-16

                                                                                                                                                                                     Mar-17

                                                                                                                                                                                                                         Mar-18
          Jun-12

                                              Jun-13

                                                                                  Jun-14

                                                                                                                                                          Jun-16

                                                                                                                                                                                              Jun-17

                                                                                                                                                                                                                                  Jun-18
                            Dec-12

                                                                Dec-13

                                                                                                    Dec-14

                                                                                                                                        Dec-15

                                                                                                                                                                            Dec-16

                                                                                                                                                                                                                Dec-17

                                                                                                                                                                                                                                                    Dec-18
                   Sep-12

                                                       Sep-13

                                                                                           Sep-14

                                                                                                                               Sep-15

                                                                                                                                                                   Sep-16

                                                                                                                                                                                                       Sep-17

                                                                                                                                                                                                                                           Sep-18
                                                                                                    Alternative Assets Under Management was Rs. 9,095 Crores1 as on 31 Dec, 2018
Note: Carrying value till Dec’15 and amortised cost thereafter
(1) In addition, India Resurgence Fund (the JV with Bain Capital Credit) has Assets Under Management of ~INR 734 Crores as on 31 Dec, 2018
Piramal Enterprises Limited – Investor Presentation                                                                                                                                    Page 19

                 Consistently expanding product portfolio
                                                                                                                                                                                      +11
                                                                                                                                                                                Loan against property
                                                                                              Total no. of products - 22                                                       Top-up on existing loan
                                                                                                                                                                                   Mid Market CF
                                                                                                                                                                                   Home loans
                          Alternative Asset
                                                                  Real Estate                                                                                                   Loan against shares
                            Management
                                                                                                                                                                               Loan against property
                         Corporate Finance                   Emerging Corporate
                                                                  Lending                                                                                                          Senior debt
                                                                                                                                                                               Working Capital term
                       India Resurgence Fund                    Housing Finance                                                                                                       loan
                                                                                                                                                                                 Capex Funding
                                                                                                                                                                                Promoter Funding
                                                                                                                                                            +3                   Project Finance
Products added

                                                                                                                                                      India Resurgence Fund    India Resurgence Fund
                                                                                                                                                       Acquisition Funding      Acquisition Funding
                                                                                                                                      +2             Lease Rental Discounting Lease Rental Discounting
                                                                                                                             Corporate Finance - AUM Corporate Finance - AUM Corporate Finance - AUM
                                                                                                             +3                   Senior Lending         Senior Lending          Senior Lending
                                                                                                       CF - Commercial           CF - Commercial         CF - Commercial         CF - Commercial
                                                                                                       CF - Residential          CF - Residential        CF - Residential        CF - Residential
                                                                                      +1             Loan Against Shares       Loan Against Shares     Loan Against Shares     Loan Against Shares
                                                                          Mezzanine & Structured    Mezzanine & Structured    Mezzanine & Structured Mezzanine & Structured Mezzanine & Structured
                                                           +1                    Lending                   Lending                    Lending                 Lending                 Lending
                             1                   Mezzanine Lending         Mezzanine Lending         Mezzanine Lending          Mezzanine Lending       Mezzanine Lending       Mezzanine Lending
                     Real Estate – AUM               Real Estate – AUM          Real Estate – AUM     Real Estate – AUM         Real Estate – AUM       Real Estate – AUM        Real Estate – AUM

                          FY2006                        FY2012                      FY2013                FY2015                    FY2016                  FY2017                     FY2018
                  Note : CF – Construction Finance
Piramal Enterprises Limited – Investor Presentation                                                                                                                                     Page 20

Financial Services: Revenues, repayments and key performance indicators
Income from Financial Services1                                                                 Key Performance Indicators: PEL Financial Services (excl. Shriram)
(in INR Crores)                                                                  5,131           Particulars                                                                        9M FY2019

         6-year CAGR – 64%                                           3,586                       Total Loan Book size                                                           Rs. 55,255 Crores
                                                                                                 Total Equity on Lending                                                        Rs. 10,193 Crores
                                                        2,352
                                                                                                 Total Equity on Lending (considering Cash Tax)                                 Rs. 10,411 Crores
                                           1,192
                   546          674                                                              Debt-to-Equity (for Lending business)                                                  4.6x
        264
                                                                                                 Average Yield on Loans                                                                13.7%
       9M13       9M14         9M15        9M16         9M17         9M18        9M19
                                                                                                 Average Cost of Borrowings                                                             8.7%
                                                                                                 Net Interest Margin                                                                    6.6%
Trend of cumulative repayments2
                                                                                                 Cost to Income Ratio                                                                  17.7%
(in INR Crores)                                                                 35,924
                                                                                                 Total Provisioning as on December 31, 2018                                             1.8%
       ~INR 3,000 Cr. of repayments in
        3Q FY2019; or 48% of disbursements                         23,579                        Gross NPA ratio (based on 90 dpd)                                                      0.5%
       ~INR 1,000 Cr. of loans down-sold in
                                                                                                 ROA                                                                                    3.3%
        3Q FY 2019
                                                       9,566                                     ROA (considering Cash Tax and other synergies from merger)                             3.9%
                                          5,379
                  911        2,793
       123                                                                                       ROE                                                                                   16.6%
       FY13      FY14         FY15        FY16         FY17         FY18        9M19             ROE (considering Cash Tax and other synergies from merger)                            19.4%

(1) FY2016, FY2017 & FY2018 numbers are as per IND AS and prior period are as per IGAAP   (2) For loan book only; excludes our investment in Vodafone India, which was exited during FY2015
Piramal Enterprises Limited – Investor Presentation                                                                                                                                 Page 21

    Significant equity allocated to the Financial Services business

                                                                              As of Dec-2018                          Debt-to-Equity (D/E) - Financial Services1
                             Equity (Book Value) - % split(1)

                                                                                                       Excl. investments in Shriram
                                                                                                                                                             Post fund raise
                                                                       Incl. ~INR 3,500 Cr
           Investments in Shriram of
                                                                         Synergies from                                                        In 3Q18, only ~INR 2,300 Cr was
                 ~INR 6,800 Cr.                                                                        Incl. investments in Shriram             allocated to Financial Services
                                                                         reverse merger
                                     32%                  19%
                                                                                                                                                             In 4Q18, the remainder of the
                                                                                                                                                                ~INR 5,000 Cr (of the est.
                                                                                                                                  6.4x                          allocation) was allocated
                                                                                                                        5.5x                                      towards the business
                                                                                                   5.0x       5.0x
                                                         49%                                                                                4.4x                             4.4x        4.6x
                                                                                                                                                      3.7x        3.9x
                                                                                                                                     2.9x                                         2.6x       2.7x
                                                                                                       2.3x      2.2x      2.5x                2.2x                   2.3x
                                                                                                                                                         2.1x
             Total:                                  ~INR 10,000 Cr invested in
                                                        the Lending business
         ~INR 21,000 Cr.

                     Lending          Shriram Investments               Others*                     3Q17       4Q17      1Q18      2Q18      3Q18      4Q18        1Q19       2Q19        3Q19

                 Total equity in the Financial Services (FS) Business of ~INR 21,000 Cr vs. loan book of ~INR 55,000 Cr
* Others includes DTA benefit from reverse merger and equity allocated to Alternate AUM business
(1) Based on estimated allocation. Debt-to-equity ratio of PEL’s lending business only, excludes DTA benefit from reverse merger and equity allocated to Alternate AUM business
Piramal Enterprises Limited – Investor Presentation                                                                                                                              Page 22

  Profitability and asset quality trends

               PEL’s Financial Services ROE1 performance                                                        PEL’s Financial Services GNPA performance

     25%+ 25%+ 25%+ 25%+ 25%+ 25%+                             Post fund raise2

                                                       21%
                                                               19%     19%      20%     19%

                                                                                                     0.6%
                                                                                                                       0.5%                                                    0.5% 0.5%
                                                                                                                0.4%          0.4%                     0.4%
                                                                                                                                                               0.3% 0.3%
                                                                                                                                      0.2% 0.2%

     1Q17 1H17 9M17 FY17 1Q18 1H18 9M18 FY18 1Q19 1H19 9M19                                          1Q17 2Q17 3Q17 4Q17 1Q18 2Q18 3Q18 4Q18 1Q19 2Q19 3Q19

Note: (1) ROE calculation for PEL on a cash tax basis, considering the capital allocation from the fund raise      (2) In 3Q18, ~INR 2,300 Cr was allocated to Financial Services. In 4Q18,
the entire ~INR 5,000 Cr (of the estimated allocation) was allocated to the business.
Piramal Enterprises Limited – Investor Presentation                                                           Page 23

  Consistent diversification of loan book by lowering the risk profile
  Trend of changing portfolio mix (%)
   Total
                    3,933                    11,069           22,651   38,036    55,255
(In INR Crores)

    100%
                                                                       2% 1%       7%
                                               12%             12%                        Housing Finance
                                                                                   2%
                                                                2%       16%
                      33%                       6%              7%
     80%                                                                          18%     Emerging Corporate Lending
                                                                         3%
                                                                         7%
                                                                                   4%     Corporate Finance Group
                                               28%                       7%        6%
     60%                                                                           4%     Hospitality
                                                               44%
                                                                                          Lease Rent Discounting (LRD)
                                                                         40%
     40%                                                                          38%     Construction Finance - Commercial
                      67%
                                                                                          Construction Finance - Residential
                                               54%
                                                                         2%
     20%                                                                           2%     Loans against property (LAP)
                                                               35%
                                                                         22%      19%     Structured Debt
       0%
                    Dec-14                    Dec-15          Dec-16    Dec-17   Dec-18

  Note: Corporate Finance Group incl. education loans
Piramal Enterprises Limited – Investor Presentation                                                                                            Page 24

Real estate and non-real estate loan book development
                                                                                                                                         In INR crores
Real Estate (incl. Housing Finance) Loan Book                                                CFG1 and ECL Loan Book
                                                                   44,000
                                                                   3,920
        Retail          Wholesale                                                                     CFG    ECL
                                                                                                                                        11,255
                                                      31,025                                                                            1,447
                                                       491

                                                                                                                               7,011
                                     19,916                                                                                     619
                                                                   40,080

                                                      30,534                                                                            9,808
                     9,692                                                                                            2,735    6,392
                                                                                                   1,303      1,377
    2,630

   Dec-14           Dec-15           Dec-16           Dec-17       Dec-18                         Dec-14     Dec-15   Dec-16   Dec-17   Dec-18

 Note : Carrying value till Dec’15 and amortised cost thereafter           1) CFG includes education loans
Piramal Enterprises Limited – Investor Presentation                                                                                                      Page 25

  Real Estate end-to-end financing model
                                         Private                          Mezzanine               Construction           Lease Rent                  Housing
      Particulars                        Equity                            Lending                  Finance              Discounting                 Finance
                                                                       Post land purchase till
                                                                                                                           Lease rental
  Stages of lending                 Primarily for land                   commencement of          For construction of                         Providing housing loans
                                                                                                                          discounting for
    for a project                       purchase                       construction (Phase of          projects                                   to home buyers
                                                                                                                        commercial projects
                                                                        obtaining approvals)
                                  Off Balance Sheet (3rd
                                   Party Funds with PEL                 On Balance Sheet          On Balance Sheet       On Balance Sheet       On Balance Sheet
     Current Size               sponsor commitment upto
                                           7.5%)

     Year of                        Started in 2006;
                                                                               2011                    2015                  2016                       2017
  commencement                   acquired by PEL in 2011

     Current Size                  INR 5,490 Crores*                    INR 11,764 Crores        INR 23,361 Crores      INR 4,955 Crores         INR 3,920 Crores

       Yield / IRR                       20-24%                              14-17%                    13-15%               9-11%**                   9-11%**

         Tenor                          4-6 years                            3-5 years               4-6 years              7-15 years              20-30 years

* Includes Ivanhoe commitment    ** To down-sell a portion of the portfolio to maintain ROE
Piramal Enterprises Limited – Investor Presentation                                                                            Page 26

Integrated platform creating significant value for customers

             Marrying distressed                                                                      Working closely with
             partners with others                                                                     regulators to assist in
              with capabilities to                                                                       critical industry
                    execute                                                                                   policies

                                                         Asset Monitoring          Brickex assists
                                                         enables on time           in boosting
                                                         project completion        partner’s sales

                                                                         22 Key
                                                                        Products

                                                       Plan long term
                                                                                   Providing
                                                       growth
                                                                                   insights to
                                                       strategy for
                                                                                   partners through
                                                       our partners
                                                                                   proprietary data     Working towards
             Cross sharing of best
                                                                                                       creating a fiduciary
              practices amongst
                                                                                                       platform providing
               partners across
                                                                                                      exit opportunities to
                    regions
                                                                                                            partners
Piramal Enterprises Limited – Investor Presentation                                                                                        Page 27

Developer concentration and share in industry-wide sales                                                                                    As of Dec-2018
 Share of our clients in industry-wide sales                            Loan book exposure: Top-10 developer loans vs. Other loans
                                              Sales, in the last       Total:                                           Developer 1
                             Total No. of
                                                 6-months          INR 55,255 Cr.
                             Developers                                                                                 Developer 2
  Region / City                               (based on area)                        3%
                                                                                          7%                            Developer 3
                                               Share of PEL’s                   7%
                          Share of PEL (%)                                                                              Developer 4
                                                 clients (%)                                   4%
  MMR                           0.8%                5.1%                                                                Developer 5
                                                                                                    4%
                                                                     18%                                                Developer 6
  Bangalore                     2.6%                3.5%                                                  3%
                                                                                                               2%       Developer 7
  NCR                           2.6%                10.0%
                                                                                                              2%        Developer 8
  Chennai                       2.6%                2.5%                                                  2%            Developer 9
  Pune                          0.5%                3.1%                                                  2%            Developer 10
  Ahmedabad + Surat             0.9%                2.0%                                                           2%
                                                                                                         2%             Other developers
                                                                             42%
  Hyderabad                     0.9%                3.9%                                                                Corporate Finance
  Total                         1.3%                4.7%                                                                Housing Finance
                                                                       Other                                            Emerging Corporate Lending
                                                                   137 developers
Our share in developer        Our developers’ share of sales
     relationships              owing to superior project
                                                                    Top-10 developers constitute ~30% of total lending exposure
                                      performance
Piramal Enterprises Limited – Investor Presentation                                                                                                                       Page 28

Residential RE: Comparison of our portfolio with overall industry on
prices, sales and unsold inventory
YoY change in prices: 2018 vs. 2017                             YoY change in sales1: 2H 2018 vs. 2H 2017                       Unsold residential inventory – YoY change
            Overall Industry         PEL's Portfolio                         Overall Industry         PEL's Portfolio                          Overall Industry:    PEL’s Portfolio:
                                                                                                                                              Unsold Residential   Unsold residential
                   -7%                                                 Mumbai                          4%                                         Inventory           inventory
      Mumbai                                                                                             34%                    Location
                                    1%
                                                                                                        10%                                     Change, in %         Change, in %
           NCR                       2%                                     NCR
                                      3%                                                                              134%                    Dec-18 vs. Dec-17    Dec-18 vs. Dec-17

                         -3%                                                                           4%                       NCR                  -5%                 -20%
          Pune                                                             Pune
                         -3%                                                                             29%
                                                                                                                                Mumbai               -8%                 -14%
                                     2%                              Bengaluru                           35%
    Bengaluru                                                                                                                   Bengaluru            -2%                  -2%
                                     2%                                                                7%
                                    1%                                                                 4%                       Pune                 -9%                 -13%
 Ahmedabad                                                        Ahmedabad
                                   0%                                                                                   153%
                                                                                                                                Chennai              -4%                 -14%
      Chennai          -3%                                             Chennai                          11%
                     -6%                                                                   -15%                                 Ahmedabad           -45%                 -15%

   Hyderabad                                7%                      Hyderabad                           15%                     Hyderabad            -6%                  -8%
                                                        17%                                                           132%
                                                                                                                                Total                -7%                 -14%

                    Our clients witnessed a stronger pick-up sales, relatively stable prices and higher decline in unsold inventory
                                                        as compared to the broader industry
Note: Trends based on number of residential housing units (1) YoY change for PEL’s portfolio includes sales from new launches
Source: Figures based on internal calculations, various industry and brokerage reports
Piramal Enterprises Limited – Investor Presentation                                                                                                             Page 29

  Housing Finance: Growth Drivers
Significant opportunity from existing developer                            Leveraging Brickex                               Focusing on Tier II and Tier III cities
                 relationships

        240                       720                                                                                  Targeting to open 24 branches by 2020
     Developers                 Projects                                              Brickex is India’s leading
                                                      10,000+ Distributors
                                                                                     B2B aggregation platform
                                                                                         focusing on sales &
                                                                                     marketing of Real Estate                                              Tier I
                                                                                       and Financial Services            50%                50%
                                                                                     products with a network
      Tapping even a portion of the existing                                          of 10,000+ distributors                                              Tier II & III
     developers’ customer base can create a                                               across Tier I cities
             significant opportunity

     Extending loans to the self-employed                          LAP, Small Construction Finance                                   Affordable housing

                                                      Small Construction Finance
                                                                                                                   •    Our development partners entering affordable
                            Salaried                  •     Target top developers in Tier II & III cities               segment
                              30%                     •     Leveraging Brickex for market insights / sourcing            o To selectively fund based on existing
                   FY2020                             Loan against property (LAP)                                          relationship

                                                      •     To enter the market through Piramal ecosystem          •    Higher margins with selective use of
               Self-employed                                                                                            syndication/down selling
                     70%                              •     Specialised underwriting cell for self-employed
Piramal Enterprises Limited – Investor Presentation                                                                               Page 30

Housing Finance: Performance trends
                           Customer Mix                                            Home Loans: Average Ticket Size (INR Cr)
                                                              As of Dec-2018
 Salaried
 Self-employed
                                                                                4.9
                     42%

                                                                                          0.7        0.8          0.7      0.65
                                                        58%

                                                                               Dec-17   Mar-18     Jun-18        Sep-18   Dec-18

                       Zone-wise Loan Book                                                       Log-in Trends
                           12%                                As of Dec-2018                                              1,680

  West
                                                                                                                 1,000
  North                                                                                              651
                    15%
                                                                                          292
  South                                                                         155
                                                       73%
                                                                               Dec-17   Mar-18      Jun-18       Sep-18   Dec-18
Piramal Enterprises Limited – Investor Presentation                                                                                                                   Page 31

    Corporate Finance Group: Performance track record
               Increased number of sectors with growth in lending platform                                                FY14 - FY16                         As of Dec-2018

             FY 14                         FY 16                         FY 17                9M FY 19
                                                                                                                                     10        TEAM                    46 1
     Book: INR 925 Cr            Book: INR 1,857 Cr            Book: INR 3,599 Cr         Book: INR 9,707 Cr

             Roads                                                                               Roads                                                           Infra, Cement,
                                           Roads                         Roads
                                                                                                                                              SECTOR           Transmission, Auto
                                                                                                                                    Infra
             Renewable                                                                          Renewable                                     FOCUS             Comp, Logistics,
                                           Renewable                     Renewable                                                                                 Chemicals
                                                                                                 Cement
                                           Cement                          Cement                                                                               Mezzanine, Senior
                                                                                                Auto                         Mezzanine      PRODUCTS          Debt, Project Finance,
                                                                          Auto                  Ancillaries                                                    Loan Against Shares
                                                                          Ancillaries
                                                                                               Transmission

                                                                                                Logistics and               INR 1,857 Cr    LOAN BOOK             INR 9,707 Cr2
                                                                                                Warehousing

                                                                                                Packaging
                                                                                                                            INR 2,015 Cr
                                                                                                                                            LOAN BOOK            INR 11,537 Cr2
                                                                                                                                            (Including APG)
                                  Yield range widened to 13-16%
(1) Includes ‘Partner Functions’, such as Risk Management, Asset Monitoring, Legal etc.   (2) Loan Book excluding Education Loans
Piramal Enterprises Limited – Investor Presentation                                                                                                    Page 32

Launch and progress of Emerging Corporate Lending
             Target segments
 Financing requirements of emerging and mid-market companies                                                                         1 year journey:
                                                                                      Key Strategies
                                                                                                                                     Sep’17 to Dec’18
             Products offered
 Senior Debt, Loan against Property, Lease Rental Discounting, Promoter
  Financing, Structured Debt, Loans against Shares etc.                          Leverage CFG business                            Loan book: INR 1,447
                                                                                        model                                            crores
                 Ticket size
 Offering solutions with ticket size ranging from Rs.10 Cr. to Rs.125 Cr.
                                                                                Leverage learnings from
                                                                                                                                Team size: 27*; Deals: 33
       Sector-agnostic platform                                                      RE financing
 Funding diverse sectors including auto ancillaries, manufacturing,
  pharma, services, hospitality, etc.
                                                                                   Focus on small &                                 Lending to multiple
                Risk profile                                                      medium enterprises                                 sectors across 10
 Low Risk Portfolio with deals backed by cashflows                                    (SMEs)                                            locations

              Progress so far                                                                                                   Offering senior debt, LAP,
                                                                               Expand into Tier II & Tier
 Loan book of Rs.1,447 Cr. as on 31 Dec 2018                                                                                   LRD, Promoter financing
                                                                                       III cities
 Set up team of 27 people including underwriting, investment, dedicated                                                         & Structured debt, etc.
  business operations, legal and asset monitoring functions
 For deal origination, senior relationship managers are based in Mumbai,    * Team size including ‘Partner Functions’, such as Risk Management,
  Delhi, Chennai, Bangalore, Hyderabad, Pune and Ahmedabad                   Asset Monitoring, Legal etc.
Piramal Enterprises Limited – Investor Presentation                                                                                                                      Page 33

 Partnership with Shriram – Strategic in nature
Acquired ~10%                Acquired 20%                  Acquired ~10%                    Total
 stake in STFC                stake in SCL                  stake in SCUF              investments in      •     Market capitalization of c. Rs.                 350 bn
   Invested                     Invested                      Invested                 Shriram Group             (US$4.9bn) for listed entities1,2
Rs.1,636 Crores             Rs.2,146 Crores                Rs.801 Crores               Rs.4,583 Crores
                                                                                                           • US$ 21.2 bn3 of assets under
                                                                                                                 management
              Share Price Performance since investments (Rs. per share)
                                                                                                           • 3,500+ branches3
    Shriram Transport Finance                               Shriram City Union Finance
                                                                                                           •     Customer base of 19.6+                   mn3
                                                                                                           •     Exposure to retail financing segments
                                                                                    1,713                        including: Used and New CVs, Small and
                              1,015                                         43%                                  Medium Enterprises, Consumer and Gold
                  40%                                                                                            loans, Life Insurance and General Insurance
        723                                                  1,200                                         • Leading player in used Commercial
                                                                                                                 Vehicle and Micro, Small and Medium
                                                                                                                 Enterprises financing

                                                                                                         Note: FX rate: 1 USD= Rs. 71
                                                                                                         (1) Listed entities include Shriram Transport Finance and Shriram City Union
    10 May 20134           31 Jan 2019                     5 Jun 2014
                                                                        4
                                                                                  31 Jan 2019            Finance (2) As of 31st Jan, 2019        (3) As of 30st Sep, 2018
                                                                                                         (4) PEL’s purchase price on the respective date of investment - Doesn’t include
                                                                                                         related costs in acquiring these stakes
Piramal Enterprises Limited – Investor Presentation                                                                                                                              Page 34

    Distressed Investment Opportunity
                                      Industry Overview                                                              Our Differentiated Positioning and Strategy
    Stressed Loans (% of Bank Loans in India)1
                                                                  Restructured       GNPA
                                                                                         11.3%                                            Board and     Sponsors track
   11.1%
                                                                                                                                         investment        record in
                                                                                                                                         committee        turnaround
                                                                                                                                          with deep      investments
                                                                                                                                           insights
                                                                                                                          Flexible and                             Engagement with
           Mar '15          Mar '16         Mar '17          Mar '18           Sep '18                                      efficient                                regulators to
                                                                                                                          investment                                 participate in
                                                                                                                            structure                                policy making
    •   NPLs of ~USD 220-250 bn to be resolved to fund new asset creation
    •   RBI firm on ensuring that debt restructuring schemes are viable                                                             Ability to carry         Tailored
    •   Stress lies in industrial sectors (power, steel, cement), export businesses                                                   out deep             investment
                                                                                                                                       business             approach
        (textiles, pharma) and domestic underfed sectors (pharma, hotels)
                                                                                                                                      diligence
    •   Delays in resolution are forcing banks to settle before asset is admitted to IBC

                          Overview of India Resurgence Fund                                                                              Progress so far

                     •   Investments in both debt and equity and across sectors
    Product
                     •   Control and drive restructuring with active participation                     •   JV concluded its 1st transaction in Marine Chemicals space by investing
                                                                                                           USD156m3 in Chennai-based Archean Group through debt and equity

                     •   Partnership with Bain Capital Credit, a multi-asset alternative               •   Active pipeline of ~USD 2 Bn
     Partner
                         investment firm with AUM of USD 41 Bn2

(1) RBI Financial Stability Report          (2) Data estimated as of January 1, 2019. Bain Capital Credit AUM includes Bain Capital Credit, LP, its subsidiaries and credit vehicles managed by its
AIFM affiliate      (3) USD 156m is total investment along with co- investor
Piramal Enterprises Limited – Investor Presentation   Page 35

Measures to ensure healthy asset quality
Piramal Enterprises Limited – Investor Presentation                                                                                            Page 36

Review and governance mechanism
                                                              Board of Directors
                                                                                                                Legal and Risk teams are
                                                                                                           independent and report directly to
                                                       Board Sub-committee for Financial Services                 the Board members
                                                This sub-committee comprise of Executive Directors,
                                                      Independent Directors & External Experts

     5 Investment Committees for Real Estate Lending, RE Fund Management, Corporate Finance Transactions, Emerging Corporate Lending
                                                            and Housing Finance

  These investment committees comprise of Executive Directors, Managing Director, Independent Directors, External Experts and Business Heads

                                                               Deal Clearance Committee

   Independent Risk                  Independent
                                                                Asset Management Team          Finance & compliance            Brickex
  Management Team                     Legal Team

                                                              Investment Teams
Piramal Enterprises Limited – Investor Presentation                                                                                                     Page 37

Risk Management and Stringent controls at every stage
   Dealing with Tier 1 clients through a partnership approach
         and offering innovative, customized solutions                                       Stringent deal underwriting processes
                                                                                                                                                          
                                                                                 Independent risk and legal teams, reporting to the Board
 Over 70% of portfolio comprises of ‘Grade A’ developers, which have a          100% deals with conservative underwriting assumptions based on delay in
  strong track record                                                             sales velocity by 6-12 months
 ~97% of Real Estate lending in Tier 1 cities – Mumbai, Pune, Bengaluru,        Integrated high quality legal set-up, present across entire deal lifecycle
  Hyderabad, Chennai and NCR                                                      from origination to closure to post-closure
 100% deals with escrow accounts on the Cash flow                               3 stage deal approval – Deal Clearance Committee / Executive Clearance
                                                                                  Committee / Investment Committee Framework

                In-depth asset monitoring process
                                                                                Unique ability to takeover and complete a project, in a worst-
                                                                                                         case scenario                                    
 Unique asset monitoring process, comprising of an ‘Early Warning
                                                                                 80% of projects are in the construction stage or completed
  Framework’ and periodic portfolio stress tests
                                                                                 Completed project can be sold through Brickex, the in-house broking and
 100% transaction coverage in ‘Early Warning Signal’ meetings
                                                                                  distribution arm, if required
 100% developer sales MIS are monitored every month
                                                                                 The Group can take over, complete and sell a project (in a worst-case
 Pre- and post-disbursement audit, internal audit and review of processes
                                                                                  scenario)
  by external parties

              100% secured lending with unique ability to takeover, complete and sell a project, if needed
Piramal Enterprises Limited – Investor Presentation                                                                      Page 38

Key parameters - Risk Management and Asset Monitoring
                      Controls at Pre-qualification stage                     Developers                           178*
                    Real Estate lending in Tier I cities of                  Transactions                           312
                   Mumbai, Pune, Bengaluru Hyderabad,         97%
                             Chennai and NCR                         Projects across various cities                 436

                      Portfolio comprising of Grade A                 Controls at Post-disbursement stage
                                 Developers
                                                              70%+

                                                                               Site Visits / month                 200+
                        Controls at Pre-approval stage
                                                                        Developer sales MIS monitored per
                   Deals with underwriting assumptions                                                            100%
                                                                                      month
                   based also on delay in velocity by 6 to    100%
                                12 months
                                                                      Project escrow Accounts monitored per
                                                                                      month                        100%

                           Deals with Escrow A/C              100%
                                                                      Transaction coverage in Early Warning
                                                                                 Signal Meetings                   100%

                    Deals with a ‘Minimum Selling Price’
                  clause ensuring collection of sales value   100%     Projects under construction stage /
                                                                                   completed                        80%
                            into our Escrow A/C

                                                                                             *Including mid-market developers
Piramal Enterprises Limited – Investor Presentation                                                                                                              Page 39

Role of the Asset Monitoring Team
             Physical Presence at Site                                      Operating Performance                                    EWS Meetings

        ‘Ears to the ground’ approach                                Adherence to Business Plan                         ‘Early Warning Signals’ identified
  •   Periodic site visits (Monthly/quarterly)            • Actual v/s Budget (Sales Velocity, Selling              •   Project performance
  •   Construction status                                   Price, Collection, Costs)                               •   Key issues highlighted
  •   Real time feedback to Team                          • Cash Cover Ratio (Actual v/s Budget)                    •   Action items
  •   Micro Market Analysis / Sector Updates              • Sales Trend Analysis                                    •   Market trends
  •   PMC & Board Meetings                                • Operating and financial analysis                        •   Regulatory developments
  •   Engagement with Lender’s Engineer                   • NOC issuance                                            •   APG Portfolio updates
                                                          • Escrow statement

                        Localised Asset Managers with
                                                               18           Escrow Accounts monitored           800+               Projects pan India             425+
                         Techno-financial background

 Real Estate                  Site Visits / month             200+            NOCs issued per month            1,000+            Micro markets tracked            100+

                     Team of CA / Civil Engineers having worked at         In-house technology platform for data           Data analytics for exception reporting and
                          Developers / Consultants /NBFCs                   capturing and operational scalability                     highlighting trends

                                                                                                                             Sectors Tracked (nos)              10 +
                                                    6 member team of CA/ MBAs
 Corporate
                                           Total exp of ~50 years in Banks, NBFCs, Fund                                 Projects managed pan India (nos)       200 +
  Lending
                                            Multi-sectoral and multi-product expertise                                    Renewable Energy Portfolio
                                                                                                                                                               6000 +
                                                                                                                                  (In MW)
Piramal Enterprises Limited – Investor Presentation                                                                         Page 40

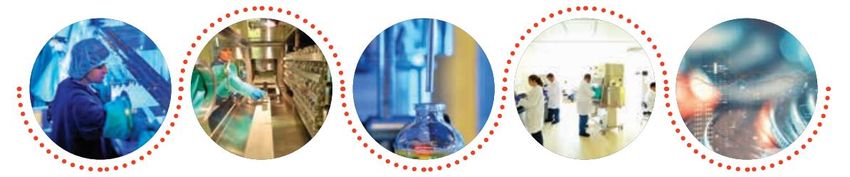
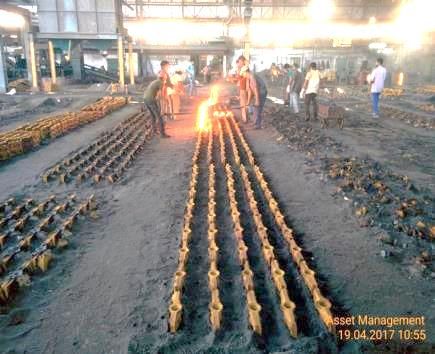
Progress on projects monitored regularly: Sample site visit photos
                                              Real Estate                                              Non-Real Estate
Sep’16 – 5th Floor completed            Dec’16 – 9th Floor Completed   Oct’17 – Finishing near   Operating wind turbines along with
                                                                            completion                      33 kV lines

                                                                                                 Molten metal is poured in moulds
                                                                                                           for casting
Piramal Enterprises Limited – Investor Presentation                                                                                                                               Page 41

  Sample of Site Visit Report
                            Expected
Tower Name                                      Dec 07, 2016              Nov 23, 2016              Oct 20, 2016            Sep 20, 2016             Aug 16, 2016              Jul 18, 2016
                         completion date

 No. of Labours on
                                                  400 - 425                 400 - 425                 400-425                  430-450                  360-380                  310-330
 site

 Tower 1 : 4B + G + 22
 Flr.

                                            Work in progress on        Work in progress on      Work in progress on      Work in progress on      Work in progress on      Work in progress on
 RCC                       Mar, 2017
                                            18th and 19th floors           18th floor.           14th & 15th floor.       12th & 13th floors.      9th & 10th floors.       6th & 7th floors.

 Block Work                 Jun, 2017      12th floor in progress.     9th floor in progress.   6th floor in progress.   4th floor in progress.   3rd floor in progress.   2nd floor in progress.

                                           Gypsum started on 1st
 Plastering / Gypsum        Sep, 2017                                            -                        -                        -                        -                        -
                                               and 2nd floor.

                                            Awaiting for material
 Flooring                   Dec, 2017      to start with flooring in             -                        -                        -                        -                        -
                                                  next week.

 Finishes                   Jun, 2018                  -                         -                        -                        -                        -                        -

                          Dashboard of site visits and stalled projects separately highlighted to the MD on a monthly basis
Piramal Enterprises Limited – Investor Presentation                                                 Page 42

Sample of overall Portfolio Performance Review Sheet
AUM Summary (INR Cr)
                                                 No. of
 Category                                                   Total
                                                 Deals
Green
       – No major concerns
Yellow
      – Closely monitor for next 6 months

Amber
    – Envisage stress over next 6 months                            Teams spend significant time post
                                                                    disbursement to detect and react to
Red
       – Overdue                                                    early warning signals (EWS)

  Total

Key parameters for colour coding
1. Site visit findings
2. Approval timelines
3. Construction cost
4. Sales Velocity in terms of units, area and value
5. Pricing – per sq ft and ticket size
6. Collections
7. Cover computation
8. Ability to meet principal and interest obligations
9. Discussions with developers / promoters
Piramal Enterprises Limited – Investor Presentation   Page 43

Liquidity Position and Borrowing Profile
Piramal Enterprises Limited – Investor Presentation                                                                                             Page 44

    Continued to maintain a robust liquidity position and diversify the
    borrowing mix                        Borrowing mix1 by type of instrument and investor
                                                                    3%       2%                    9%                                      10%
                                                                                                   2%                 16%                   2%
                                                                             18%                                       2%
       Continue to maintain robust liquidity of ~INR 5,400 Cr                                    17%
                                                                                                                      18%
                                                                                                                                           15%

        in the form of cash and several unutilized bank lines                23%                  20%                                      17%
                                                                                                                      17%

       Raised ~INR 10,000 Crores via NCDs and bank loans
                                                                             54%                  51%                                      56%
        (primarily public sector banks) during the quarter                                                            47%

       Reduced CP exposure by ~40% vs. Sep-2018, from
                                                                            Mar-18               Jun-18              Sep-18               Dec-18
        Rs.18,000 Cr. as of Sep-2018 to Rs. 10,750 Cr. as of Dec-
                                                                            Loans           NCDs / Bonds        CP            Tier II          Others
        2018
                                                                     3%          3%               9%                                       10%
       Additional measures / proposals to boost liquidity:                      3%    1%         2%                  16%                  2%
                                                                                                  2%       1%                                       1%
                                                                                                                       2%     1%           3%
                                                                             28%                                       2%
            − Secure additional bank lines                                                        29%                                      21%
                                                                                                                      29%
            − Issue NCDs with a longer-term tenure
            − Received in-principal approval for an ECB lines
                                                                             62%                  55%                                      62%
                                                                                                                      49%
            − Set-up an Euro medium-term note (EMTN)
              programme
                                                                            Mar-18               Jun-18              Sep-18              Dec-18
                                                                         Banks        MFs    Insurance     NBFCs       PF & Others      FIIs       Others
Note: (1) Borrowing mix for PCHFL
Piramal Enterprises Limited – Investor Presentation                                                                                                                               Page 45

     Asset-Liability Management                                                                                                                                                   As on Dec 31, 2018

    Asset-Liability Profile1                                                                                                                   Asset-Liability Mix

                                                                                                                             65,489
    (in INR Crores)
                                                                                                                                                               Fixed   Floating

                                                                                                         55,082
             Cumulative Inflows

             Cumulative Outflows

                                                                                                                                      42,434
                                                                                                                    40,424
                                                                                          38,138
                                                                                         36,620
                                                                                                                                                      51%                     54%

                                                                           17,935
                                                                          16,676
                                                              10,873
                                                              10,015
                                                 7,897
                                                 7,556
                                     6,497
                                     6,286
                         3,485

                                                                                                                                                      49%
                         3,065

                                                                                                                                                                              46%
           798
           516

                                                                                                                                 > 5 yrs
                                                                            up to 1 yr

                                                                                           up to 3 yrs

                                                                                                             up to 5 yrs
             up to 14d

                          up to 1m

                                      up to 2m

                                                   up to 3m

                                                               up to 6m

                                                                                                                                                      Assets               Liabilities

Note: Data for PCHFL
(1) Cumulative inflows / outflows include: cash balances, investments / deposits, unutilized bank lines, interest and principal receipts / repayments on the lending and the liabilities side
Piramal Enterprises Limited – Investor Presentation   Page 46

Pharma
Piramal Enterprises Limited – Investor Presentation                                                                                                                            Page 47

  Pharma business portfolio delivering strong growth within and outside
  India
                                                                                                                                  Pharma Performance
                                   Piramal Pharma
                                 FY2018 Rev: Rs.4,513 Crores                                                  Pharma Revenue1,2,3,4             Global Pharma EBITDA Margin (%)

                                                                                                         4%        9%       12%       15%       17%      17%       15%       21%      21%

                                                                                                                                                                                      3,308
             Global Pharma                                India Consumer Products                                                                                             2,992
                                                                                                           8 yrs Revenue                                            2,679
     FY2018 Rev: Rs.3,976 Crores                           FY2018 Rev: Rs.537 Crores*                       CAGR – 16%                                    2,538

  • End-to-end manufacturing                           • Strong portfolio of OTC brands
                                                                                                                                                 2,202
    capabilities                                                                                                                       1,981
                                                                                                                              1,731
                                                       • 8 brands among top 100 OTC
  • 13 manufacturing facilities                          brands                                                     1,352

  • Portfolio of niche branded generic                 • Large distribution network
                                                                                                          1,021
    products
                                                       • Among top 5 OTC players
  • Distribution to >100 countries
                                                                                                            9M       9M        9M       9M        9M        9M       9M        9M      9M
                                                       Note * Includes Allergan JV Revenue                 FY11     FY12      FY13     FY14      FY15      FY16     FY17      FY18    FY19

Note :                                                                                   3.   Global Pharma revenue accounted for 93% of the overall Pharma revenue during 9MFY19
1. Excludes revenue from JV with Allergan                                                4.   Pharma revenue includes Global Pharma and consumer products
2. FY2016 - FY2019 results have been prepared based on IND AS, prior periods are IGAAP
Piramal Enterprises Limited – Investor Presentation   Page 48

Global Pharma
Piramal Enterprises Limited – Investor Presentation                                                                Page 49

Global Pharma: How are we moving up the value chain?
                                1    Acquired global businesses to enter into niche capabilities
                                                   Injectable                 HPAPI

                                    2    Expanding manufacturing capacities in niche areas
             ADC                                   Injectable         Inhalation Anaesthesia       Drug Discovery
Piramal Enterprises Limited – Investor Presentation                                                                                Page 50

    Global Pharma: How are we moving up the value chain? (cont’d)
3    Adding differentiated hospital branded generic products              4 Strong product portfolio to leverage global distribution network
     organically and inorganically
       Controlled substances             Injectable Anaesthesia

            Desflurane                         Intrathecal

• Leverage global distribution               network        by   adding   • Entry barrier – Complex to manufacture, sell and distribute
  differentiated products                                                   resulting in limited competition

• Differentiated offerings – Niche branded generics and                   • Expands addressable market size from US$ 1 bn Inhalation
  controlled substances                                                     Anaesthesia market to US$20 bn generic hospital product market
                   Our strategy of moving up the value chain will enable us boost growth and enhance margins significantly
Piramal Enterprises Limited – Investor Presentation                                                                          Page 51

Global Pharma Products: Differentiated product portfolio
                                                                 Product Portfolio

                                         Injectable Anaesthesia /             Intrathecal Severe
         Inhalation                                                            Spasticity / Pain
        Anaesthesia                         Pain Management                                               Other Products
                                                                                 Management

        Desflurane                                Sublimaze*                      Gablofen®                Generics API

        Sevoflurane                                 Sufenta*                    Products under          Vitamins & Premixes
                                                                                 development

         Isoflurane                                 Rapifen*
                                                                                      Acquired from
                                                                                     Mallinckrodt LLC       Differentiated
         Halothane                                                                     in Mar 2017
                                                   Dipidolor*                                                  product
    To be launched in FY19                                                           Acquired from             portfolio
                                                 Hypnomidate                            Janssen
                                                                                     Pharmaceutica
                                       * Controlled substances                        in Oct 2016
Piramal Enterprises Limited – Investor Presentation                                                                                                       Page 52

Global Pharma Services: Integrated in Capabilities
                                                                                                                                                       Off-
  Discovery           Preclinical           Phase 1            Phase 2                      Phase 3             Launch          On-patent
                                                                                                                                                      patent

   CRO                Development (CDMO & Generic API)                                         Late Phase & Commercial (CDMO), Generic API
Discovery        Early Phase API        Early Phase Formulation                     Late Phase API (including high Potency)        Late Phase Formulation
Ahmedabad,       (including high                                                                                                   (OSD's & Steriles (Injectables
India            Potency)               Mumbai, Ahmedabad – India                   Digwal, India           Aurora, Canada         & FFS))
                 Ennore,India |         Lexington, KY                               Ennore, India           Riverview, USA         Pithampur, India | Morpeth,
                 Aurora,Canada |        Grangemouth (ADC), UK                       Morpeth, UK,                                   UK | Lexington, KY |
                 Riverview, USA                                                                                                    Grangemouth (ADC), UK

                                                                  Special services

                Antibody Drug           High Potent (HPAPIs)      Clinical Trial Supplies        Regulatory, Patents,     Vitamins & Nutrition
              Conjugates (ADC)            Riverview (USA)             Morpeth (UK)               Pharma co-vigilance     Solutions Mahad (India)
              Grangemouth (UK)                                                                        Mumbai
Piramal Enterprises Limited – Investor Presentation                                                                                                   Page 53

13 manufacturing facilities both in East and West – All key sites US FDA inspected
                                                                          MAHAD*
                                                                          Vitamins & Minerals    PITHAMPUR
                                                     MORPETH              Premixes               Formulations Manufacturing
                                                     API & Formulations   USFDA, WHO-GMP         USFDA, MPA Sweden
                                                     Development &
                                                                            MUMBAI
                                                     Manufacturing                                DIGWAL
                                                                            Generic API
                                                     USFDA, MHRA                                  2 sites:
                                                                            Development
                                RIVERVIEW                                                         API Development &
                                                       GRANGEMOUTH            AHMEDABAD           Manufacturing
                                HPAPI Development       ADC Development       2 sites:            USFDA, MHRA
                                & Manufacturing         & Manufacturing       Drug Discovery &    Anaesthesia Manufacturing
                                USFDA                   USFDA, MHRA           Formulation
                                                                                                   ENNORE
                                                                              Development
        LEXINGTON                AURORA                                                            API Development
                                                                              MPA Sweden
        ADC Sterile              API Development &                                                 & Manufacturing            SHANGHAI
        Development &            Manufacturing                                                     WHO-GMP
        Manufacturing                                                                                                          Sourcing Office
                                 USFDA, MHRA
        USFDA

   BETHLEHEM
    Anaesthesia Manufacturing
    USFDA, MHRA

                                                                                                                      Since 2011, cleared all inspections :
                                                                                                                      •       32 USFDA inspections
                                                                                                                      •       130 other regulatory inspections
                                                                                                                      •       964 customer audits
Note: * Dietary Ingredients
Piramal Enterprises Limited – Investor Presentation                                                                                                       Page 54

    Global Pharma: Strong presence in key geographies

                             Strong presence in North America     Expanding presence in Europe        Strong presence in India           Expanding Presence in Japan

Manufacturing Faculties      • Aurora : API Dev & Mfg            • Grangemouth : ADC Mfg            • Mumbai : API & Form Dev             • One of the two approved
                                                                                                                                            generics in the market
                             • Lexington : Sterile Dev & Mfg     • Morpeth : API & Form. Dev &      • Digwal : API Dev & Mfg &              for Sevoflurane, with
                                                                   Mfg                                Anaesthesia Manufacturing             leading market share
                             • Riverview : HPAPI Dev & Mfg
                                                                                                    • Pithampur : Form. Mfg               • Leading market share for
                             • Bethlehem : Anaesthesia Mfg                                                                                  Fentanyl with the only
                                                                                                    • Ahmedabad : Drug                      currently approved
% Global Business Revenues                                                                            Discovery and Form. Dev               generic in the market
(as on Sep 30, 2018)
                                           41%                                25%
                                                                                                    • Ennore : API Dev & Mfg
Distribution Presence            30% market share in US in      Expanding presence in key countries
                                  Inhalation Anaesthesia         including UK, Italy, Germany, etc. • Mahad : Vitamins &
                                                                                                      Minerals Premixes
                                 Through direct sales force     Through direct sales force and
Distribution Model
                                                                         distributors
                                                                                                       Note:   Form – Formulations; Dev – Development; Mfg - Manufacturing
Piramal Enterprises Limited – Investor Presentation   Page 55

India Consumer Products
Piramal Enterprises Limited – Investor Presentation                                                 Page 56

Strong product portfolio
                                            Eight brands among India’s top 100 OTC brands

                       Most brands are among the top two in their respective representative market
Piramal Enterprises Limited – Investor Presentation                                                Page 57

Developed a large India-wide distribution network
     Wide Distribution Network                                            FY2008   FY2012     Now

                                                          No. of towns
                                                            present
                                                                           16       481       2000

                                                          Total Outlet
                                                           presence
                                                                          24,000   200,000   420,000

                                                         Chemist Outlet
                                                           presence
                                                                          16,000   100,000   220,000

                                                          Field Force
Our chemist coverage is now comparable
       with the top 3 OTC players                                           80       800      2,100
Piramal Enterprises Limited – Investor Presentation                                                                                        Page 58

    Adding products organically and inorganically
                            Products added organically                                          Product portfolios added through acquisition

Instant pain relieving mouth     A non-drowsy anti-allergy
                                                                 Oil Balance Face Wash
          ulcer gel                     OTC brand
                                                                      & Face Scrub

                                                                                                                               5 brands from Organon
                                                                                               4 brands from Pfizer Ltd            India & MSD BV

A sore throat pain relief                                            Paan flavoured
                                    A pregnancy test kit
        product                                                         antacid

                               Detoxifies the after effects of     Educational game Jungle   Baby-care brand ‘Little’s’   Digeplex and associated brands
   Ovulation test kit
                                      socializing, etc.             Magic Garden Sciencz
Piramal Enterprises Limited – Investor Presentation   Page 59

Healthcare Insight & Analytics
Piramal Enterprises Limited – Investor Presentation                                                                                     Page 60

Healthcare Insight and Analytics: At A Glance
  Historically viewed as a syndicated healthcare market research company, Decision Resources Group (DRG) has
               transformed itself into a data-driven, technology enabled, healthcare insights business

We assist our clients in the Pharma, MedTech, Insurance        •    Where to invest?
                                                               •    How to get approved, contracted and paid?
(Payer), and Provider sectors, addressing many of the most
                                                               •    How to prove value?
pressing questions in the healthcare industry:                 •    How to drive commercial success?

We do this by leveraging a large team of area experts, Real    •    Market Research
                                                               •    Services
World Health Data, sophisticated analytics tools and data
                                                               •    Data
science to deliver:                                            •    Analytics

                                                               •    Embedded in our clients’ workflows
                                                               •    Delivering critical client solutions, which have a bespoke front end, but
We are increasingly:                                                which are based upon a series of common back-end algorithms

    Leaders Interview                     Hospital Audit                             Analytical Tools                   Market Forecasts
                                                                 Our
                                                               Business
    Health Plan Data                 Proprietary Survey Data                       Customized Services               Proprietary Databases
Piramal Enterprises Limited – Investor Presentation                                                                                 Page 61

Key Business Highlights
                                                               >10yr Relationships With Our Top Ten Customers
         Serves major Developed and Emerging Markets
                                                                     Customer                     # of Years
                  FY2018 Revenue - US$186 mn                        AstraZeneca                     >10 yrs                   48 of the top 50
                                                                    Bayer                           >10 yrs                   life sciences
                                                                    Boehringer Ingelheim            >10 yrs                   companies
        Capabilities across customer’s product life cycle           Johnson & Johnson               >10 yrs
                                                                    Merck & Co                      >10 yrs
              17 offices across 6 locations globally                Novartis                        >10 yrs
                                                                    Novo Nordisk                    >10 yrs                   17 of the top 20
                                                                    Pfizer                          >10 yrs                   medical device
      1,200+ employees globally (386 employees in India)            Roche                           >10 yrs                   companies
                                                                    Takeda                          >10 yrs

                                                               Top 10 Relationships Comprise
Piramal Enterprises Limited – Investor Presentation                                                                                          Page 62

   Expanded into new markets and established offices in India to drive
   margin improvement
      Feb 2016 - Acquired Adaptive Software
                                                                                                   • DRG launched a new initiative to transform its
      • Leading Solutions for Health Plans and Pharmacy
        Benefit Managers
                                                                                                     global talent pool by expanding to India. Business
      • Marks Company’s entry into payer space                                                       opened offices in Bengaluru (Jan 2015) and
                                                                                                     Gurugram (Feb 2016) with 386 positions on
      May 2015 – Acquired HBI                                                                        boarded (i.e. 31% of DRG’s headcount).
      • Trusted provider of best practice research, training
        & services to >1,400 hospitals in US
      • Marks Company’s entry into provider space
                                                                           US$ 16 bn
                                                                                                   • Scaling India operations to:
                                                                                                      −   Improve customer delight, delivery, and
                                                                                                          response times through building 24/7
                                               US$ 6 bn                                                   capabilities
           US$ 2 bn
                                                                                                      −   Access a large pool of educated professionals
                                                                    Life                                  with substantial expertise
         Life Sciences                       Life Sciences                    Provider     Payer
                                                                 Sciences

                                             Solutions                   Solutions                    −   Establish new international offices in a key
             Data                                                                                         growth market
                                          Consulting Services        Consulting Services
       Research Products
                                          Research Products          Research Products
                                           Data & Analytics           Data & Analytics                −   Accelerate DRG’s profit growth through the
                                                                                                          cost-effective expansion of teams
            2012                                2014                        2017
Source: Based on proprietary market research and internal DRG estimation
You can also read