PRESENTATION TO DEBT INVESTORS - 1st quarter 2019 | May 2019 - 1st quarter 2019 ...
←
→
Page content transcription
If your browser does not render page correctly, please read the page content below

PRESENTATION TO
DEBT INVESTORS
    1st quarter 2019 | May 2019
DISCLAIMER
The information contained in this document (the “Information”) has been prepared by the Societe Generale Group (the “Group”) solely for informational purposes. The Information is proprietary to the
Group and confidential. This presentation and its content may not be reproduced or distributed to any other person or published, in whole or in part, for any purpose without the prior written permission of
Societe Generale.
The Information is not an offer to buy or sell or a solicitation of an offer to buy or sell any security or instrument or to participate in any trading strategy, and does not constitute a recommendation of, or
advice regarding investment in, any security or an offer to provide, or solicitation with respect to, any securities-related services of the Group. This presentation is information given in a summary form and
does not purport to be complete. It is not intended to be relied upon as advice to investors or potential investors and does not take into account the investment objectives, financial situation or needs of
any particular investor. Investors should consult the relevant offering documentation, with or without professional advice when deciding whether an investment is appropriate.
This presentation contains forward-looking statements relating to the targets and strategies of the Societe Generale Group. These forward-looking statements are based on a series of assumptions, both
general and specific, in particular the application of accounting principles and methods in accordance with IFRS (International Financial Reporting Standards) as adopted in the European Union, as well as
the application of existing prudential regulations. These forward-looking statements have also been developed from scenarios based on a number of economic assumptions in the context of a given
competitive and regulatory environment. The Group may be unable to:
-anticipate all the risks, uncertainties or other factors likely to affect its business and to appraise their potential consequences;
-evaluate the extent to which the occurrence of a risk or a combination of risks could cause actual results to differ materially from those provided in this document and the related presentation.
Therefore, although Societe Generale believes that these statements are based on reasonable assumptions, these forward-looking statements are subject to numerous risks and uncertainties, including
matters not yet known to it or its management or not currently considered material, and there can be no assurance that anticipated events will occur or that the objectives set out will actually be achieved.
Important factors that could cause actual results to differ materially from the results anticipated in the forward-looking statements include, among others, overall trends in general economic activity and in
Societe Generale’s markets in particular, regulatory and prudential changes, and the success of Societe Generale’s strategic, operating and financial initiatives. Unless otherwise specified, the sources for
the business rankings and market positions are internal.
Other than as required by applicable law, Societe Generale does not undertake any obligation to update or revise any forward-looking information or statements information, opinion, projection, forecast
or estimate set forth herein.
More detailed information on the potential risks that could affect Societe Generale’s financial results can be found in the Registration Document and its updates filed with the French Autorité des Marchés
Financiers.
Investors are advised to take into account factors of uncertainty and risk likely to impact the operations of the Group when considering the information contained in such forward-looking statements.
The financial statements presented for the quarter ending March 31st 2019 was examined by the Board of Directors on May 2nd 2019 and has been prepared in accordance with IFRS as adopted by the
European Union and applicable at this date. Figures in this presentation are unaudited. The consolidated financial statements for the first quarter 2019 does not constitute financial statements for an
interim period as defined by IAS 34 “Interim Financial Reporting”, and has not been audited. Societe Generale’s management intends to publish complete consolidated financial statements for the year
ended December 31st 2019.
By receiving this document or attending the presentation, you will be deemed to have represented, warranted and undertaken to (i) have read and understood the above notice and to comply with its
contents, and (ii) keep this document and the Information confidential.

                                                                                                                                            PRESENTATION TO DEBT INVESTORS MAY 2019                            2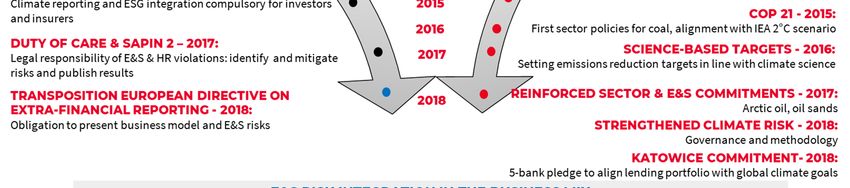
SOCIETE GENERALE AT A GLANCE
LEADING FRANCHISES                                                                                   WITH AN INTERNATIONAL FOOTPRINT TO SERVE OUR
                          - Société Générale and Crédit du Nord: two complementary
                                                                                                     CLIENTS AND CAPTURE GROWTH POTENTIAL
                            brands focused on premium clients                                                                                         EUR 25.2bn in 2018
                                                                                                                      AMERICAS
                          - Boursorama: undisputed leader in online banking in France                                                                 WESTERN                                 CEE         RUSSIA
                            targeting > 3M clients by 2021                                                             ~6%                            EUROPE
                                                                                                                                                                                                            ~3%
                                                                                                                                                                                               ~11%
                          - International Retail: (BRD) #3 in Romania, (KB) #3 in Czech
                            Republic, (SG Russia) #2 private bank by loans in Russia                                                                          ~68%(1)

                          - Insurance: #5 Bankinsurance in France
                          - Financial Services: (ALD) # 1 Full service leasing in Europe,                      ASIA - OCEANIA                                                                                    AFRICA
                            Equipment Finance # 1 in Europe
                                                                                                                                                                                                                   ~6%
                                                                                                                        ~6%
                          - Presence in Africa as a differentiating factor

                                                                                                         % % of 2018 Group revenues
                           - World leader in Equity derivatives and in Structured Finance
                           - EMEA leader in Investment Banking and in Transaction Banking                                                             LEADERSHIP positions in         Reference bank in HIGH POTENTIAL
                                                                                                      Presence in SELECTED WHOLESALE
                                                                                                                                                             Western Europe                   RETAIL MARKETS
                           - French Leader in Private Banking                                              MARKETS for our core clients
                                                                                                                                                    A reference RETAIL BANK in         Leveraging on GROUP PRESENCE
                                                                                                         CONNECTING WITH EUROPE
                                                                                                                                                                France                       for our corporate clients

BALANCED RWA ALLOCATION(3) THROUGH BUSINESSES                                                        DISCIPLINED AND SELECTIVE CAPITAL ALLOCATION
                                                                                                     RWA CAGR 2018-2020 constant scope and currency which excludes all model reviews (e.g. TRIM) and IFRS 16
                                 Global Banking &                 French Retail Banking
                                 Investor Solutions                                                      ca. +5%         ca. +4%
                                                      38%    28%                                                                      ca. +1%/+2%
                                                                                                                                                                                                         Group
                                                                                                                                                     ca. +0.5%/+1%
                                                                                                                                                                     Wealth & Asset Global Markets &
                                                                                                                                                                      Management Investor Services

                                                            34%                                      International       Financial
                                                                      International Retail Banking                                    Financing &        French
                                                                                                     Retail Banking      Services
                                                                    & Financial Services                                                Advisory         Retail
(1)   Including 47% in France                                                                                                                           Banking         ca. -2%
(2)   As of FY 2018 results                                                                                                                                                                    ca. -9%
(3)   As of 31.03.2019
                                                                                                                                              PRESENTATION TO DEBT INVESTORS MAY 2019                                     3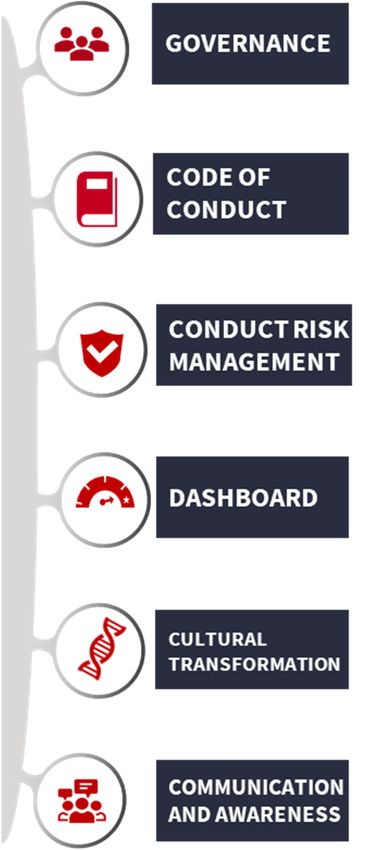
1   Q1 19
    GROUP PERFORMANCE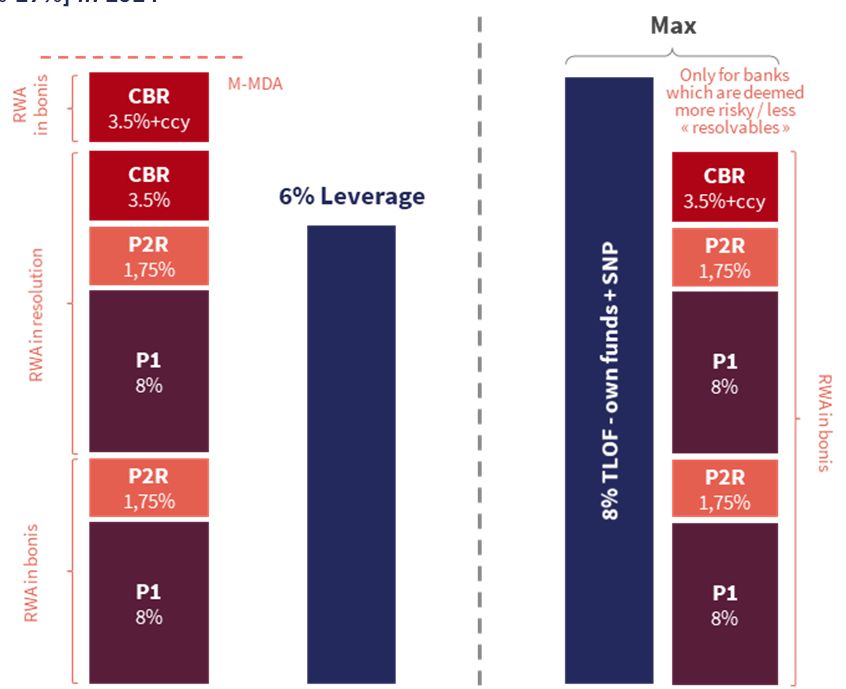
Q1 19 KEY HIGHLIGHTS

REVENUES (1)                                                         ADAPTING STRATEGY                                     STRONG                            ON TRACK TO DELIVER OUR
EUR 6.2 bn, -1.6%
                                                                     IN GLOBAL BANKING                                     RISK PROFILE                      CAPITAL TRAJECTORY
(Core businesses revenues +0.3%)
                                                                     AND INVESTOR
                                                                                                                           Low cost of risk (21bp)           CET1 up +55bp at 11.7%(2)
OPERATING EXPENSES(1)                                                SOLUTIONS
EUR 4.3 bn, +2.9%                                                                                                          Decrease in NPL ratio             Further progress in refocusing
(+1.3% excluding IFRIC 21                                            Refocusing market                                     (3.5%)                            program : + 25bp announced
linearisation)                                                       activities                                                                              including SKB on top of +20bp
                                                                                                                           Almost 60% of funding             closed in Q1 19
                                                                     Executing a new cost                                  program already
GROUP NET INCOME(1)
                                                                     cutting plan                                          achieved                          First impact of Global Markets
EUR 1.0 bn
                                                                                                                                                             RWA reduction (+7bp)
ROTE(1)
8.4%

(1) Underlying data. See supplement.
(2) Pro forma of scrip dividend for +24bp, subject to General Meeting of Shareholders’ approval and assuming 50% take-up

                                                                                                                                                   PRESENTATION TO DEBT INVESTORS MAY 2019    5
Q1 19 GROUP PERFORMANCE

                                                                                                                  INSURANCE AND
                                                                INTERNATIONAL                                                                  GLOBAL BANKING AND                     CORPORATE
 FRENCH RETAIL BANKING                                                                                            FINANCIAL
                                                                RETAIL BANKING                                                                 INVESTOR SOLUTIONS                     CENTRE
                                                                                                                  SERVICES
Revenues                                                       Revenues                                           Revenues                     Revenues                              EUR -113 m
-3.2%, excl. PEL/CEL                                           +8.3%*                                             +3.8%*                       +1.1% (-1.8%*)                        Gross operating income
vs. Q1 18                                                      vs. Q1 18                                          vs. Q1 18                    vs. Q1 18

                                                               Solid commercial                                   Sustained organic growth     Strong performance of Financing       Impact of IFRS 5 on
Net interest margin increasing vs.                                                                                                                                                   refocusing program:
Q4 18                                                          momentum across                                                                 and Advisory
                                                               geographical regions                                                                                                  EUR -53 m
                                                                                                                  Further improved
Stable service fees despite French                                                                                profitability                Resilient Global Markets in a still
banking industry measures          Positive jaws effect                                                                                        challenging environment

2019 revenues(2) expected
between 0% and -1% vs. 2018
RONE(1)                                                         RONE(1)                                           RONE(1)                      RONE(1)                               EUR -207 m
10.4%                                                           15.7%                                             20.5%                        8.0%                                  Group net income

                                               Group net income(1) at EUR 1,010 m (reported at EUR 631 m), ROTE(1): 8.4% in Q1 19
(1) Underlying data: adjusted for exceptional items, IFRIC 21 linearisation and PEL/CEL provision for French Retail Banking. See supplement.
(2) Excluding PEL/CEL provision
* When adjusted for changes in Group structure and at constant exchange rates

                                                                                                                                                           PRESENTATION TO DEBT INVESTORS MAY 2019            6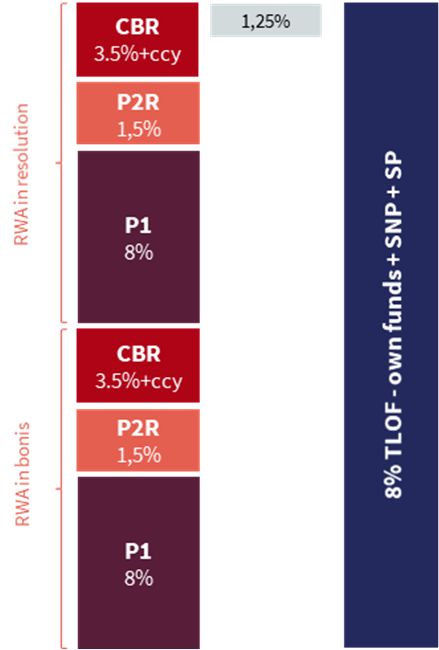
STRONG RISK PROFILE AND CULTURE

    WELL MANAGED                                         CONTAINED                                   A STRICT FOCUS ON
    CREDIT RISK                                          MARKET RISK                                 OPERATIONAL RISK
HIGH ORIGINATION AND PORTFOLIO QUALITY                  MARKET RISK                              CONTINUOUS INVESTMENT IN
                                                        ~5% of total RWA            since 2016   COMPLIANCE
WELL-ESTABLISHED TRACK RECORD OF LOW
COST OF RISK
                                                        HIGHLY DISCIPLINED APPROACH TO RISK      TRANSVERSAL CULTURE          &
ca. 25 bps                      on average since 2016   APPETITE
                                                                                                 CONDUCT          PROGRAMME
KEEPING NPL AT A LOW LEVEL                              VaR*
STRONG RISK PROFILE
                                                                     _Cost of risk(1) (in bp)
                                                                                                                                              NON-PERFORMING LOANS RATIO
                                                                         Q1 18           Q2 18   Q3 18   Q4 18   Q1 19

                                                                          29                             30
                                                                                                 25                                           MAR 15          MAR 16           MAR 17           MAR 18    MAR 19
 FRENCH RETAIL BANKING                                                                   20                       20
                                                                                                                                               5.5%
                                                                                                                                                                   5.0%
                                                                                                                                                                                4.8%
                                                                                                                                                                                                  4.2%
 INTERNATIONAL RETAIL                                                                             37               39
                                                                          28                              33                                                                                                  3.5%
 BANKING AND FINANCIAL                                                                   23
 SERVICES

                                                                                                           25
                                                                                                                   10                      GROSS COVERAGE RATE: 55% at end-March 19
 GLOBAL BANKING AND                                                                        2       4
 INVESTOR SOLUTIONS                                                       -7
                                                                                                                         In EUR bn                                                  31/03/2019           31/12/2018   31/03/2018

                                                                                                                         Gross book outstandings*                                       502,4              501,2         482,1
                                                                                                                         Doubtful loans*                                                17,7                18,0         20,4
                                                                                                                         Group Gross non performing loans ratio*                        3,5%               3,6%         4,2%

                                                                          18                               29      21    Stage 1 provisions                                              0,9                0,9           1,0
 GROUP                                                                                    14      22
                                                                                                                         Stage 2 provisions                                              1,0                1,0           1,2
                                                                                                                         Stage 3 provisions                                              9,7                9,7          11,3
                                                                                                                         Group Gross doubtful loans coverage ratio* (Stage 3
                                                                                                                                                                                        55%                54%           55%
                                                                                                                         provisions / Doubtful loans)

(1) Outstandings at beginning of period. Annualised.
* Customer loans, deposits at banks and loans due from banks, leasing and lease assets
See: Methodology

                                                                                                                                                         PRESENTATION TO DEBT INVESTORS MAY 2019                                   8
GROUP RESULTS
                               In EUR m                                                              Q1 19           Q1 18                  Change
                               Net banking income                                                    6,191           6,294           -1.6%           -1.9%*
                               Underlying net banking income(1)                                      6,191           6,294           -1.6%           -1.9%*
                               Operating expenses                                                   (4,789)         (4,729)          +1.3%           +1.3%*
REVENUES(1)                    Underlying operating expenses(1)                                     (4,345)         (4,223)          +2.9%           +2.9%*
EUR 6.2 bn, -1.6% vs. Q1 18    Gross operating income                                                1,402           1,565          -10.4%           -11.4%*
                               Underlying gross operating income(1)                                  1,846           2,071          -10.8%           -11.6%*
OPERATING EXPENSES(1)          Net cost of risk                                                      (264)           (208)          +26.9%           +29.5%*
EUR 4.3 bn, +2.9% vs. Q1 18
                               Underlying net cost of risk (1)                                       (264)           (208)          +26.9%           +29.5%*

GROUP NET INCOME(1)            Operating income                                                      1,138           1,357          -16.1%           -17.4%*
                               Underlying operating income(1)                                        1,582           1,863          -15.0%           -16.0%*
EUR 1.0 bn, -16.1% vs. Q1 18
                               Net profits or losses from other assets                                (51)              1             n/s              n/s

ROTE(1)                        Income tax                                                            (310)           (370)          -16.2%           -16.2%*
                               Reported Group net income                                              631             850           -25.8%           -27.5%*
8.4% in Q1 19
                               Underlying Group net income(1)                                        1,010           1,205          -16.1%           -17.4%*
                               ROE                                                                   4.2%            6.3%
                               ROTE                                                                  5.5%            7.4%
                               Underlying ROTE (1)                                                   8.4%           10.9%

                               (1) Underlying data: adjusted for exceptional items and IFRIC 21 linearisation. See Methodology and Supplement p.27
                               *when adjusted for changes in Group structure and at constant exchange rates

                                                                                                              PRESENTATION TO DEBT INVESTORS MAY 2019          9
2   CAPITAL AND
    LIQUIDITY
BALANCE SHEET RATIOS
ABOVE REGULATORY REQUIREMENTS
2018 requirements(2) End-Q1 19 ratios(6) 2019 requirements(2),(3) Target 2020
CET1 8.7% 11.7% 9.9% 12%
Total Capital 12.2% 17.5% 13.4%
Leverage ratio 3.5% 4.2%(5) 3.5% 4% - 4.5%
25.2% (% RWA) 19.5% (% RWA)
TLAC 7.4% (% leverage) 6.0% (% leverage)
MREL(1) 8% (% TLOF) > 8% (% TLOF) 8% (% TLOF)
LCR >100% 140%(4) >100% >100%
NSFR >100% >100% >100% >100%
(1) TLOF : Total Liabilities & Own Funds, after full recognition of netting rights on derivatives. Requirements subject to regulatory and legislative changes
(2) Excluding Pillar 2 Guidance add-on. Including countercyclical buffer. On 14 February 2019 the European Central Bank notified the level of additional requirement in respect of P2R for Societe Generale, which applies from 1 March 2019. This level stands at 1.75%. On 22
December 2017 the European Central Bank confirmed the level of additional requirement in respect of P2R for Societe Generale at 1.5%, which came into force as from 1st January 2018. Countercyclical buffer at 0.1% as of 31 December 2018.
(3) Requirements are presented as of today’s status of regulatory discussions.
(4) Average on Q1 19
(5) Leverage ratio at 4.3% after taking into account the decision on 13 July 2018 of the General Court of the European Union on the exclusion of the outstandings of certain savings accounts centralised at the Caisse des Dépôts which requires the agreement of the ECB
(6) Taking into account the option of a dividend payment in shares subject to the approval by the Ordinary General Meeting on May 21st, 2019, taking into account the assumption of a 50% take-up
PRESENTATION TO DEBT INVESTORS MAY 2019 11STRONG INCREASE IN CET1
COMFORTING OUR CAPABILITY TO
CET1(1) AT 11.7%
REACH 12% TARGET +25bp -10bp
Around 180bp over MDA threshold _Q1 19: change in fully-loaded CET1(1) ratio (in bp)
+20bp 11.7%
TLAC(3) RATIO: 25.2% OF RWA
Already meeting requirements +7bp -2bp
+23bp
AHEAD OF FUTURE MREL Hybrid coupons
REQUIREMENTS +14bp
-7bp
11.2%
LEVERAGE RATIO AT 4.2%(4)
LIQUID ASSET BUFFER
EUR 177 bn at end-March 19
LCR AND NSFR above100%
Q4 18(1) Earnings Dividend Organic Global Markets IFRS 16 Refocusing Q1 19(1) Refocusing EMC
provision(6) RWA* RWA reduction and other closed announced acquisition(5)
transactions transactions(2)
ALMOST 60% OF FUNDING PROGRAM (1) Fully-loaded, based on CRR/CRD4 rules, including the Danish compromise for Insurance. Pro forma of scrip dividend for +24bp, subject to General Meeting of
ALREADY ACHIEVED Shareholders’ approval and assuming 50% take-up (excluding scrip effect, CET1 at 10.9% as at 31 December 2019 and 11.5% as at 31 March 2019). See
Methodology.
(2) Estimated impact at signing date, excluding IFRS 5 impact
(3) Including 2.5% of Senior Preferred debt. Requirements without countercyclical buffer. Pro forma of scrip dividend.
(4) Pro forma of scrip dividend, unchanged without scrip effect and leverage ratio at 4.3% after taking into account the decision on 13 July 2018 of the General
Court of the European Union on the exclusion of the outstandings of certain savings accounts centralised at the Caisse des Dépôts which requires the
agreement of the ECB
(5) Commerzbank Capital Markets activities
(6) Corresponding to a 50% pay-out ratio
* when adjusted for changes in Group structure and at constant exchange rates
PRESENTATION TO DEBT INVESTORS MAY 2019 12GROUP TLAC / MREL: ALREADY MEETING REQUIREMENTS
WELL ADVANCED ON UPCOMING SUBORDINATION RULES
_TLAC ratio _MREL ratio
Already meeting requirements Already meeting total requirements (notification received in June 2018)
The Group funding plan is not relying on the tolerance of Senior Preferred Subordination component expected to be framed by SRB in 2019 ; Group 2020
allowance for upcoming TLAC compliance funding plans already in line with future requirements(3)
% RWA (1) (2)
% RWA(1) 24.4% >24.4%
25.2%
Senior preferred
2.5%
5.2% ~7%
19.5% Senior non preferred
5.2% SP SNP
Tier 2
AT1 % TLOF 3.1% ~3%
3.1% % Leverage
Tier 2 AT1
CET 1 8.0% >8.0%
2.6% ~2%
6% 7.4%
2.6%
22.7% CET 1
11.7% 12%
11.7%
Requirement 2019 31.03.2019 Req. 2019 31.03.2019 Req. 2019 31.03.2019 2018 Notif. 31.03.2019 Targets 2020
(1) Without countercyclical buffer (2) Based on RWAs as of end-December 2016
(3) Based on our understanding of current texts
PRESENTATION TO DEBT INVESTORS MAY 2019 13PROGRESS ON THE EU PACKAGE FOR MREL
2018 2019 2020 2021 2022 2023 2024
BRRD1
BRRD2
_Current MREL Requirement _Future Total MREL Requirements(1) _Future MREL Subordination(1)
8% TLOF (~24,36% based on 2016 B/S) [26%-27%] in 2024
The MREL ratio is a minimum requirement for own funds and 23%+ccy
eligible liabilities that are available to absorb losses and
recapitalise the bank according to the conditions stated in the
Bank Recovery and Resolution Directive (BRRD)
The 2019 policy on MREL is based on the current legislative
framework (“BRRD1”). Going forward, banks’ resolvability
and MREL targets will be covered by the “Banking Package”
(CRR2/BRRD2/SRMR2), recently agreed upon but not yet
formally adopted by the co-legislators
Loss-absorbing instruments eligible for future MREL
requirements(1) may include senior preferred debt on top of
own funds and senior non preferred debt
ccy = countercyclical buffer
(1) Based on our understanding of current texts and current requirements Group 2020 funding plans consistent with future expected MREL requirements (1)
PRESENTATION TO DEBT INVESTORS MAY 2019 14GROUP
LONG TERM FUNDING PROGRAMME
_2019 Expected funding program(1)
Parent company 2019 funding programme similar
to 2018 Senior Preferred and Secured debt ~EUR 6/8 bn
c. EUR 17bn of vanilla debt, well balanced across the
different debt formats Senior Non Preferred debt
~EUR 6/7 bn
Annual structured notes issuance volume in line with
amounts issued over the past years (i.e. ~EUR 19 bn)
Subordinated debt (AT1/T2) ~EUR 2.5/3 bn Max
As of 15 April 2019:
~56% completion of the vanilla funding programme
Societe Generale SG SFH Societe Generale Societe Generale
(including EUR 0.75bn of prefunding in 2018) 2Y Senior Preferred 8Y Covered Bond 5Y Senior Non Preferred 5Y & 10Y Senior Non Preferred
~EUR 5.5 bn of structured notes E3M+37bp 14-Jan-21 0.750% 29-Jan-27 1.25% 15-Feb-24 0.94% & 1.164% 21-Feb-24 & 29
Competitive funding conditions: MS6M+64bp and EUR 1,750,000,000 EUR 1,000,000,000 EUR 1,750,000,000 JPY 96,200,000,000
average maturity of 4.6 years (incl. senior non
preferred debt, senior preferred debt and covered
bonds)
Societe Generale Societe Generale Societe Generale Societe Generale
Additional EUR 0.5 bn issued by subsidiaries 10Y Senior Non Preferred 5Y Senior Non Preferred PerpNC5 AT1 15NC10 Tier2
1.75% 22-Mar-29 3.875% 28-Mar-24 6.125% 16-Apr-24 4.5% 18-Apr-34NC29
EUR 1,250,000,000 USD 1,500,000,000 SGD 750,000,000 AUD 300,000,000
(1) Excluding structured notes
PRESENTATION TO DEBT INVESTORS MAY 2019 15GROUP LONG TERM
FUNDING BREAKDOWN(1)
Access to diversified and complementary 31.03.2019
investor bases through:
Subordinated issues Secured Issues(4)
10%
Senior vanilla issuances (public or private placements) 16% Senior Vanilla Preferred
Senior structured notes distributed to institutional Unsecured Issues(3)
12%
investors, private banks and retail networks, in France Senior Structured Issues
and abroad
Covered bonds (SFH, SCF) and securitizations EUR 189bn Senior Non-Preferred Issues
12%
30% Subordinated Debt(2)
8% LT Interbank Liabilities(5)
Issuance by Group subsidiaries 12%
Access to local investor bases by subsidiaries which Subsidiaries
issue in their own names or issue secured
transactions (Russian entities, ALD, GEFA, Crédit du Amortisation schedule as of 31.03.2019, in EUR bn
Nord, etc.)
Increased funding autonomy of IBFS subsidiaries 43,0
31,9
Balanced amortisation schedule
21,0 21,5 22,3
(1) See Methodology
(2) Including undated subordinated debt
12,9 12,3
(3) Including CD & CP >1y
(4) Including CRH 4,7 5,7 6,6 7,5
(5) Including IFI
2019 2020 2021 2022 2023 2024 2025 2026 2027 2028 >2028
PRESENTATION TO DEBT INVESTORS MAY 2019 16STRENGTHENED FUNDING STRUCTURE
_Loan to Deposit Ratio
Very strong balance sheet 104%
97%
Stable loan to deposit ratio 600
95% 91% 95% 95% 105%
High quality asset buffers 500 460
421 443 447 470 80%
378 388 400 421 420
Comfortable LCR at 140% on average in Q1 19 400 356 341
55%
NSFR above regulatory requirements 300
200
30%
100
Liquid asset buffer of EUR 177bn at end-March 19 0 5%
High quality of the liquidity reserve: EUR 76bn of HQLA assets at Q1-14 Q1-15 Q1-16 Q1-17 Q1-18 Q1-19
end-March 2019 and EUR 84bn of Central bank deposits Loans (EUR bn) Deposits (EUR bn) L/D ratio
Excluding mandatory reserves for central bank deposits _Liquid Asset Buffer (in EUR bn)
Unencumbered, net of haircuts for HQLA assets and other assets
167 164 176 172 177
eligible to central bank Central bank
deposits(1)
73 70 75 82 84
High quality liquid
asset securities(2)
77 79 84 73 76
Central bank
16 15 16 17 17 eligible assets(2)
* See Methodology. Q4 2018 data are presented according to IFRS 9 standard. Q1 18 Q2 18 Q3 18 Q4 18 Q1 19
(1) Excluding mandatory reserves
(2) Unencumbered, net of haircuts
PRESENTATION TO DEBT INVESTORS MAY 2019 17CREDIT RATING OVERVIEW
_Credit Rating as of May 2019
Strong franchises DBRS Fitch Moody’s S&P
S&P: “Solid foundation in domestic retail, corporate and investment LT/ST
banking, and financial services to corporates. Consistent strategy and well- AA/R-1(high) A+(dcr) A1(cr)/P-1(cr) A/A-1
Counterparty
diversified revenues by business lines and geography”
Moody’s: “Strong franchise and well-diversified universal banking LT senior
A(high) A+ A1 A
business model” unsecured debt
Fitch: “Sound company profile, which benefits from franchise
strengths across selected products and geographies” Outlook Positive Stable Stable Positive
ST senior F1 P-1 A-1
R-1(middle)
Sound balance-sheet metrics unsecured debt
S&P: “Steady build-up of a comfortable bail-in-able debt cushion” LT senior non
n/a A Baa2 BBB+
Moody’s: “Regulatory capitalisation is good and improving, preferred debt
underpinned by a strong earnings generation capacity […] Liquidity is
strong and broadly in line with large European peers” Dated Tier 2 A- Baa3 BBB
n/a
Fitch: “Strong internal capital generation” subordinated
Additional BB+ Ba2(hyb) BB+
n/a
Tier 1
NB: The above statements are extracts from the rating agencies reports on SG and should not be relied upon to reflect the agencies opinion. Please refer to full rating reports available on Societe Generale and the agencies’ websites.
PRESENTATION TO DEBT INVESTORS MAY 2019 18SUSTAINABILITY RECOGNISED IN RATINGS
SG is well recognised by extra-financial rating agencies and included in the leading sustainability indices, including DJSI:
Rating Position vs peers
“In this period of profound change we
are experiencing, we are committed to
Rated “A”
an approach supporting the positive
transformations of our clients and all of
our stakeholders. CSR matters are at
the heart of our Transform to Grow Rating 75%
“Outperformer” 91st Percentile
strategic plan.
As external indicators, these results are
proof of the growing integration of CSR
issues in the development of the Bank’s Rated C “Prime”
activities.” (above “Prime”
Diony Lebot, Deputy CEO threshold)
PRESENTATION TO DEBT INVESTORS MAY 2019 193 BUSINESS
PERFORMANCEFRENCH RETAIL BANKING
RESULTS
REVENUES
Q1 19 revenues(1) stable vs. Q4 18 (-3.2% vs. Q1 18)
Net interest income(1) increasing vs. Q4 18 In EUR m Q1 19 Q1 18 Change
(-3.3% vs. Q1 18) Net banking income 1,916 2,008 -4.6%
Net banking income excl. PEL/CEL 1,928 1,992 -3.2%
Fees decreasing vs. Q1 18, with financial fees
impacted by unsupportive market environment Operating expenses (1,486) (1,480) +0.4%
Stable service fees vs. Q1 18 despite impacts from Gross operating income 430 528 -18.6%
French banking industry commitment measures Gross operating income excl. PEL/CEL 442 512 -13.7%
Net cost of risk (94) (134) -29.9%
2019 revenues(1) expected between 0% and -1%
Operating income 336 394 -14.7%
vs. 2018
Reported Group net income 234 270 -13.3%
RONE 8.3% 9.5%
COSTS UNDER CONTROL Underlying RONE (2) 10.4% 10.8%
Operating expenses up +0.4% vs. Q1 18
LOW COST OF RISK Q1 19 RONE(2): 10.4%
Cost of risk at 20bp (vs. 30bp in Q4 18)
RESILIENT PROFITABILITY
(1) Excluding PEL/CEL provision
(2) Underlying data : adjusted for IFRIC 21 linearisation, PEL/CEL provision. See supplement.
PRESENTATION TO DEBT INVESTORS MAY 2019 21DEVELOPING BUSINESS INITIATIVES IN FRENCH
RETAIL BANKING
DEVELOPING INDIVIDUAL CORE CLIENT BASE Private Banking
EUR 64.9 bn (+4.9%) AuM
+3% INDIVIDUAL EUR 1.2 bn Net inflows in Q1 19
# of wealthy and mass affluent clients CLIENTS LOANS
OUTSTANDINGS Life insurance
~1.8m
Boursorama clients as of 31 March 2019 (+30%) +3.0% EUR 93.7 bn outstandings
EUR 515 m Net inflows in Q1 19
P&C
DEPLOYING CORPORATES & PROFESSIONALS SET UP Premium +4% vs. Q1 18
MEDIUM-TERM Corporates
15 Corners Pro and 1 XL Pro branch opened this quarter CORPORATE
42 structured finance transactions
4 Business centres opened this quarter LOANS
OUTSTANDINGS completed in Q1 19
+6.3%
PRESENTATION TO DEBT INVESTORS MAY 2019 22INTERNATIONAL RETAIL BANKING
AND FINANCIAL SERVICES
RESULTS
GOOD REVENUE MOMENTUM In EUR m Q1 19 Q1 18 Change
EUR 2,076 m (+6.8%* vs. Q1 18) Net banking income 2,076 1,989 +4.4% +6.8%*
Operating expenses (1,204) (1,179) +2.1% +5.1%*
SUSTAINED HIGH OPERATING Gross operating income 872 810 +7.7% +9.3%*
EFFICIENCY Net cost of risk (128) (91) +40.7% +46.6%*
Positive jaws effect of ca. 170bp* Operating income 744 719 +3.5% +4.7%*
Net profits or losses from other assets 1 4 -75.0% -74.7%
COST OF RISK PROGRESSIVE Reported Group net income 464 429 +8.2% +9.7%*
NORMALISATION RONE 16.0% 15.1%
39bp Underlying RONE (1) 17.6% 17.0%
IMPROVED GROUP NET INCOME AND
PROFITABILITY Q1 19 RONE(1): 17.6%
despite perimeter effects and significant write-
backs in Q1 18
(1) Adjusted for IFRIC 21 linearisation
* When adjusted for changes in Group structure and at constant exchange rates
PRESENTATION TO DEBT INVESTORS MAY 2019 23STRONG COMMERCIAL MOMENTUM ACROSS REGIONS
IN INTERNATIONAL RETAIL BANKING
EUROPE RUSSIA(1) AFRICA AND OTHER
_Loan Outstandings _Deposit Outstandings _Loan Outstandings _Deposit Outstandings _Loan Outstandings _Deposit Outstandings
(EUR bn) (EUR bn) (EUR bn) (EUR bn) (EUR bn) (EUR bn)
+6%*
+4%*
59.9 60.3 +6%* +8%*
52.7 50.6
+18%* +33%*
19.9 21.4 19.6 21.6
8.9 10.2 8.3 10.7
Q1 18 Q1 19 Q1 18 Q1 19 Q1 18 Q1 19 Q1 18 Q1 19 Q1 18 Q1 19 Q1 18 Q1 19
Q1 19 Revenues up +7.9%* vs. Q1 18 Q1 19 Revenues up +12.5%* vs. Q1 18 Q1 19 Revenues up +6.7%* vs. Q1 18
Solid Revenues growth in Czech Republic (+6%*) and High level of loan production in retail segment (+25%) Solid commercial momentum on retail segment
Romania (+9%*) combining volume and spread effect in a dynamic market Strong deposit collection across all regions with a
Strong revenue growth in Western Europe (+10%*) mainly Growing retail client base with acceleration of stable L/D ratio close to 100%
driven by car loans penetration into premium segment
Q1 19 GROUP NET INCOME EUR 246 m (+10%*), RONE 15.7%(2) (+20bp)
* When adjusted for changes in Group structure and at constant exchange rates / (1) SG Russia scope / (2) adjusted for IFRIC 21 linearisation
PRESENTATION TO DEBT INVESTORS MAY 2019 24FURTHER STRENGTHENING THE GROWTH PLATFORM IN
A SOLID ENVIRONMENT
LEVERAGE ON FAVOURABLE MARKET DYNAMICS
Positive tailwind in Central Europe and Russia | Strong momentum in Consumer Finance | Strong long term outlook in Africa
STRENGTHEN FURTHER IMPROVE
COMMERCIAL PLATFORMS OPERATIONAL EFFICIENCY
State-of-the-art digital improving client experience Refocus centralorganization of IBFS
(ca.40% downsizing of central functions)
in retail banking (10min for mortgage approval in
Russia) Switch to agile and integrated organisation
Best-in-class integrated POS tools & market place (agile@scale at KB, merger between Rosbank and
for car dealer & e-commerce (via Vivacar and OTTO Deltacredit in Russia)
platforms) Creation of regional hubs and support local IT in
Differentiated & integrated offer for Corporates Africa and Russia
(partnership agreement in development with ABSA in Further improve strict risk management
Africa)
PRESENTATION TO DEBT INVESTORS MAY 2019 25SOLID PROFITABILITY IN INSURANCE AND FINANCIAL
SERVICES
SUSTAINED GROWTH THROUGH BANCASSURANCE
32 MODEL PROFITABLE GROWTH IN FINANCIAL SERVICES
_Total insurance revenues within the Group (EUR bn) _ALD Total fleet (‘000 000) _SGEF Loan and Lease Outstandings(3) (EUR bn)
+13%
CAGR2016-2018 +9%
2.3 +5*%
2.1
1.8 Booked in Insurance
0.8
0.9 Business Unit
0.7
1.5 1.7
Booked in Retail 17.2 17.9
1.3 1.4 Network
1.1
2016 2017 2018 Q1 18 Q1 19 Q1 18 Q1 19
Q1 19 Revenues up +2.4%* Q1 19 Revenues up +4.6%*
Dynamic protection (premiums +10%*) with strong momentum ALD : sustained high operational efficiency with a cost / income ratio(2)
abroad of 49.6% and resilient car sale results (at EUR 258(2) per unit)
Solid growth in life insurance outstandings +4%* SGEF: solid revenues growth (+12%*) with steady increase of the
Strategic agreement with Roadzen to build Europe’s leading digital margin for new business volume
and contextual insurance player
Q1 19 GROUP NET INCOME EUR 218M (+9%*), RONE 20.5%(1) (+110bp)
* When adjusted for changes in Group structure and at constant exchangerates / (1) Adjusted for IFRIC 21 linearisation / (2) rolling last 4 quarters and based on ALD standalone financials, excluding car saleresults / (3) Excluding factoring
PRESENTATION TO DEBT INVESTORS MAY 2019 26GLOBAL BANKING AND INVESTOR
SOLUTIONS RESULTS
In EUR m Q1 19 Q1 18 Change
REVENUES UP 1.1% (-1.8%*)
Net banking income 2,239 2,215 +1.1% -1.8%*
Strong revenue growth in Financing & Advisory
Operating expenses (2,026) (2,024) +0.1% -1.6%*
Low client activity in Global Markets
Gross operating income 213 191 +11.5% -3.8%*
Net cost of risk (42) 27 n/s n/s
OPERATING EXPENSES FLAT (-1.6%*) Operating income 171 218 -21.6% -31.3%*
Reported Group net income 140 166 -15.7% -26.1%*
RONE 3.4% 4.5%
COST OF RISK Underlying RONE (1) 8.0% 10.2%
Normalisation after provision reversals in Q1 18
Q1 19 RONE(1): 8.0%
(1) Adjusted for IFRIC 21 linearisation
* When adjusted for changes in Group structure and at constant exchange rates
PRESENTATION TO DEBT INVESTORS MAY 2019 27GOOD MOMENTUM IN FINANCING & ADVISORY, MUTED
START TO THE YEAR IN GLOBAL MARKETS
GLOBAL MARKETS & INVESTOR SERVICES REVENUES: FINANCING & ADVISORY REVENUES:
-7% VS. Q1 18 +19% VS. Q1 18
_Global Markets Revenues (EUR m) _Revenues (EUR m)
580
535
494 450
366 FICC
Equities 665 692 716 711
600
659 696 593 624
550
Q1 18 Q2 18 Q3 18 Q4 18 Q1 19 Q1 18 Q2 18 Q3 18 Q4 18 Q1 19
FICC revenues -16% vs. Q1 18: lower Rate activity, better performance in Strong growth in Financing with a high level of originated deals
Credit and Emerging Good momentum in Global Transaction Banking
Equities revenues -5% vs. Q1 18: low client activity, more stable market
conditions ASSET & WEALTH MANAGEMENT REVENUES:
+5% VS. Q1 18
Securities Services revenues +12% vs. Q1 18, including positive impact of SIX Muted start to the year due to market environment
stake revaluation (EUR +34 m) Private Banking revenues +11% vs. Q1 18, including positive impact of SIX stake
revaluation (EUR +32 m), Lyxor revenues -15% vs. Q1 18
PRESENTATION TO DEBT INVESTORS MAY 2019 28CORPORATE CENTRE
In EUR m Q1 19 Q1 18
Net banking income (40) 82
GROSS OPERATING INCOME Operating expenses (73) (46)
EUR -113 m in Q1 19 Gross operating income (113) 36
Net cost of risk 0 (10)
NET PROFITS OR LOSSES FROM OTHER Net profits or losses from other assets (53) (4)
ASSETS Reported Group net income (207) (15)
Effect of IFRS 5 on ongoing disposals for EUR -53 m
in Q1 19 including EUR -67 m on recently
announced disposal of SKB (Slovenia) and residual
impact of transactions closed in Q1 19
(Expressbank in Bulgaria, SG Private Banking
Belgium and SG Albania)
PRESENTATION TO DEBT INVESTORS MAY 2019 294 DEEP DIVE ON
FRENCH RETAIL & CIBA REFERENCE BANK WITH A PROFITABLE MODEL IN
FRENCH RETAIL
BANKING
NETWORKS BOURSORAMA
Digitalise day-to-day banking & leverage our expertise to Undisputed leader in online banking in
CAGR2015-2018
improve our client experience France
# of clients
Targeting >3M clients by 2021 +30%
Enhanced efficiency of the model thanks to the
transformation underway On the road to profitability
2020 RONE: 11.5% - 12.5%
PRESENTATION TO DEBT INVESTORS MAY 2019 31FURTHER STRENGTHENING OUR GROWTH PLATFORM IN
INTERNATIONAL RETAIL BANKING
LEVERAGE ON FAVOURABLE MARKET DYNAMICS
Positive tailwind in Central Europe and Russia | Strong momentum in Consumer Finance | Strong long term outlook in Africa
STRENGTHEN FURTHER IMPROVE
COMMERCIAL PLATFORMS OPERATIONAL EFFICIENCY
State-of-the-art digital improving client experience Refocus centralorganization of IBFS
in retail banking Switch to agile and integrated organisation
Best-in-class integrated POS tools & market place Creation of regional hubs and support local IT in
for car dealers & e-commerce Africa and Russia
Further improve strict risk management
Differentiated & integrated offer for Corporates
IBFS 2020 RONE: 17% - 18%
PRESENTATION TO DEBT INVESTORS MAY 2019 32FURTHER INVESTING IN OUR HIGH-GROWTH STORY IN
INSURANCE AND FINANCIAL SERVICES TO CORPORATE
EQUIPMENT
INSURANCE ALD
FINANCE
Integrated Bancassurance model to Leader in mobility Leader partner for international
capture synergies Pioneer in partnership model vendors at the heart of the financing of
Partnership to accelerate growth Private lease real economy
#5 Bankinsurance in France # 1 Full service leasing in Europe # 1 in Europe
EUR 2.3bn of synergies revenues in 2018 # 2 Worldwide # 2 Worldwide
(+13% CAGR2016-2018) 1.7 million cars (+10.5% CAGR2013-2018) EUR 28.4bn outstandings*
*Group leasing outstandings as of end of March 2019 IBFS 2020 RONE: 17% - 18%
PRESENTATION TO DEBT INVESTORS MAY 2019 33GLOBAL BANKING & INVESTOR SOLUTIONS: A RELATIONSHIP,
PIONEER AND RESPONSIBLE BANK
BY FURTHER LEVERAGING ON OUR
PROVIDE THE BEST CLIENT
INNOVATIVE APPROACH
EXPERIENCE WITH THE BEST PRODUCT
Partnerships (ABSA, DBS…)
Open architecture
Developing investment & financing solutions for institutions and
high net worth clients Coverage
B2B market place strategy
Further strengthening leadership in structured and asset finance
for Corporates AND SUPPORTED BY ADJUSTMENT OF
CAPITAL ALLOCATION CONSISTENT WITH
Developing transaction banking OUR STRATEGIC FOCUS
2020 RONE: 11.5% - 12.5%
PRESENTATION TO DEBT INVESTORS MAY 2019 34EXECUTING OUR ROADMAP TO PROFITABILITY
COST OF RISK
GROWING REVENUES COST DISCIPLINE
MONITORING
Fully LEVERAGING OUR Taking advantage of DIGITAL COMFORT in cost of risk trajectory
EMERGING MARKET PRESENCE TRANSFORMATION in all
businesses
Working on GROWTH
Transforming our model, leveraging on digital, in 2020 ROTE
INITIATIVES in more mature
markets
French retail banking
Supporting growth & transformation in
International Retail Banking & Financial Services
9% - 10%
Leveraging on SG markets platform in Global
Banking & Investor Solutions
Revenue objectives taking into
account CURRENT Delivering EUR 1.6bn EFFICIENCY
ENVIRONMENT PLAN
DELIVERING POSITIVE JAWS ACROSS
ALL BUSINESSES BY 2020 AND BEYOND
PRESENTATION TO DEBT INVESTORS MAY 2019 35DELIVERING OUR ROADMAP TO CAPITAL TARGET
CLOSE
RWA REDUCTION & REFOCUSING ON
MONITORING OF
OPTIMISATION CORE FRANCHISES
ORGANIC GROWTH
+2% CAGR 2018-2020 ca. +25bp from Global Target +80/+90bp by
organic growth of RWA Markets RWA reduction in 2020
2019-2020
ca. +10bp/+20bp optimization
2020 CET 1
in 2019-2020
12%
DISCIPLINED AND SELECTIVE CAPITAL ALLOCATION
RWA CAGR 2018-2020 constant scope and currency which excludes all model reviews (e.g. TRIM) and IFRS 16
ca. +5% ca. +4% ca. +1%/+2% ca. +0.5%/+1% RWA organic
Wealth & Asset Global Markets & Group growth offset
Management Investor Services
by
deleveraging
International Financial Financing & French Retail & optimisation
Retail Banking Services Advisory Banking ca. -2%
ca. -9%
PRESENTATION TO DEBT INVESTORS MAY 2019 36FRENCH RETAIL BANKING
AN ATTRACTIVE FRENCH RETAIL MARKET

               DYNAMIC FRENCH RETAIL MARKET                       STRUCTURAL CHANGES UNDERWAY

                      GDP / capita: USD 42,470
                       Above European Average
                                                                    CHANGING CLIENT
                                                                                               NEW ENTRANTS
                                                                     EXPECTATIONS
                      2019e GDP growth
                      + 1.3%
                                                                      INCREASING             RATE ENVIRONMENT
                                                                      REGULATION               LOW FOR LONG

                      Household financial savings: EUR 5,117 bn
                                                                   HIGHLY COMPETITIVE        PREDOMINANCE OF
                                                                   SITUATION IN FRANCE      RELATIONSHIP MODEL
                      French population: CAGR18-24 +0.6%

Source : IMF , Banque de France

                                                                            PRESENTATION TO DEBT INVESTORS MAY 2019   38
3 COMPLEMENTARY BRANDS ADDRESSING OUR CLIENTS
EXPECTATIONS
3 COMPLEMENTARY THE LEADING FULL
BRANDS WITH UNIVERSAL BANK REGIONAL BANKS
ONLINE BANK
DIFFERENT CLIENT
BASES
Focus on premium clients looking for the highest quality of service Digital & autonomous
clients
Leveraging on a strong Individual clients
Highly recognised
established client base 38 years old on average,
professional franchise
~1% of common clients Focus on wealthy clients mainly city dwellers
High penetration on local
between CDN and SG Strong on nationwide SMEs
SMEs and Entrepreneurs
ca. 15% of Boursorama and large corporates
clients are CDN or SG
clients PHYGITAL MODEL FULLY DIGITAL
2018 REVENUES Individuals Professionals Corporate
PRESENTATION TO DEBT INVESTORS MAY 2019 39ADAPTING OUR MODEL
Improve client experience and reduce cost to serve
STANDARD OPERATIONS CUSTOMERS’ KEY PROJECTS
FULLY AUTOMATED ADVISORY
5 LEVERS
FULLY AUTOMATED LEVERAGE ON DATA EXPERTISE & SET UP ADJUSTMENT
APPLI for Selfcare (day-to-day
banking)
AND IA SPECIALISATION Specialised set up for corporates
& professionals
Increase in revenues Training of account
Transfers, online payments, cards,
budget management
Data Marketing for cross-selling and up managers and back-office ~30 business centers /
selling staff
40 features in 2020 (from 17 in 2016) Real time rebound ~150 pro branches & corners
Fight against fraud in real-time
1 million hours in 2019 in SG
Fewer, more adapted branches
Purchase of products and services networks
with electronic signature Automatic decisions on simple
overdraft
New dedicated experts for core clients # Branches 2015-2020 ca. –22% in SG
Client Journey digitalisation Professionals, Wealthy clients, Liberal
Main front-to-back banking processes: professions network, -9% in CDN network
Account opening, Consumer Credit, Leveraging on call centers
Optimised managerial practices
Mortgage, Corporate credit… Transforming back-offices
Expert platforms, 6 back offices closed
between 2016 and 2020
DIGITALISED AND DATA CENTRIC IT SYSTEM
PRESENTATION TO DEBT INVESTORS MAY 2019 40REVENUE GENERATION SUPPORTED BY BUSINESS
INITIATIVES
NET INTEREST MARGIN NORMALISING FOCUS ON FEES GENERATION
DEPOSIT MARGIN DEPOSIT MARGIN FEES DRIVEN BY REVENUE INITIATIVES
EVOLUTION
impacted by negative replacement FRENCH PRIVATE LIFE INSURANCE
BANKING FEES OUTSTANDINGS
rate but progressively normalising 0,0%
Q1 18 Q3 18 Q1 19
CREDIT MARGIN +4%
YoY evolution +14%
Developing with a selective -5,0%
origination strategy
-10,0%
A SUCCESSFUL SELECTIVE ORIGINATION STRATEGY
2016 2018 2016 Mar 19
5%
2018 REVENUES* / LOAN OUTSTANDINGS IN
INSURANCE PENETRATION
FRENCH RETAIL BANKING
4%
P&C Personal Protection
3% 9,4%
17,7% 18,9%
8,2%
2%
1%
0%
2016 2018 2016 2018
Société Générale Bank 1 Bank 2 Bank 3 Bank 4 Bank 5
Source : Companies on published data
* Revenues Ex PEL / CEL as published
PRESENTATION TO DEBT INVESTORS MAY 2019 41DELIVERING A PROFITABLE RETAIL BANKING MODEL
PROGRESSIVE REVENUE IMPROVEMENT, OPERATING EXPENSES:
IN THE CURRENT RATE ENVIRONMENT FULLY BENEFITING FROM THE TRANSFORMATION
2019 2020 2019 2020
0% to -1% Increasing revenues +1% to +2% Decreasing cost base
vs. 2018 vs. 2019 vs. 2018 vs. 2019
POSITIVE JAW EFFECT FROM 2020 AND BEYOND
COST OF RISK BETWEEN 35BP AND 40BP IN 2020
2020 RONE 11.5% - 12.5%
PRESENTATION TO DEBT INVESTORS MAY 2019 42GLOBAL BANKING AND INVESTOR SOLUTIONS
RECOGNISED LEADERSHIP IN GROWING SEGMENTS

                   STRUCTURAL                                                             MARKET-LEADING
                   GROWTH DRIVERS                                                         EXPERTISE
SAVING FOR RETIREMENT                                                                GLOBAL LEADER IN INVESTMENT PRODUCTS
  45
  40                                                                                  STRUCTURED PRODUCTS   “Societe Generale is, by far, our most efficient
                                         Global retirement savings US$ trillion       HOUSE OF THE YEAR
  35
                                         (OECD)
                                                                                                             counterpart for Structured Products”
  30                                                                                  (RISK MAGAZINE)
                                                                                                             Structured Products Specialist at a Tier 1 European Private Bank
  25
           2012     2014      2016

INFRASTRUCTURE AND ENERGY TRANSITION NEEDS                                           GLOBAL LEADER IN STRUCTURED FINANCE
  5
                                                                                                            “Societe Generale's speed of execution as well as its
  4                                      Annual Infrastructure Investment, Current    GLOBAL PROJECT
  3                                      Trends US$ Trillion                          FINANCE ADVISOR OF     significant knowledge in the fibre space was
  2                                                                                   THE YEAR               instrumental...”
                                         (Global Infrastructure Hub)
  1                                                                                   (PFI)
            2007   2017    2027   2037                                                                       German Telco CFO

NEEDS OF MULTINATIONAL AND EXPORTING CORPORATES                                      REGIONAL LEADER IN TRANSACTION BANKING
 1000                                                                                                       “Societe Generale’s expertise, innovation spirit and
                                         Volume of global exports, 1980 = 100         LEADER IN EMEA
  500                                    (IMF)
                                                                                                             daily customer service has been essential for the
                                                                                                             setup of our global payment & reporting factory
       0
           1980 1991 2002 2013 2024                                                                          across CEEMEA”
                                                                                                             Luxury Goods Company

                                                                                                             PRESENTATION TO DEBT INVESTORS MAY 2019                            44
AN INTERCONNECTED MODEL FOR OUR CLIENTS
Americas Asia, Pacific & Other
17% 15%
of 2018 of 2018
revenues EMEA revenues
STRONG POSITIONS IN 68% CONNECTING ASIA TO THE
of 2018
TARGETED SEGMENTS revenues
WORLD
Top foreign bank in Equity Derivatives & leading
position in Structured Finance Financial Institutions: focused on distribution of
investment solutions to private banks.
LEADERSHIP POSITION IN CIB
SUCCESSFUL GROWING
CORPORATE CLIENT BASE Corporates: increased penetration with EMEA
World leader in Equity derivatives
clients
World leader in Structured Finance
21% EMEA leader in Investment Banking
17%
of Asia Pacific &
of Americas
revenues with
EMEA leader in Transaction Banking other revenues
with European
European French Leader in Private Banking clients
clients
PRESENTATION TO DEBT INVESTORS MAY 2019 45ALLOCATING CAPITAL TO MOST RELEVANT FRANCHISES
% OF 2018 SYNERGIES 2020 ROADMAP:
2018 RWAs RETURN STRATEGIC PRIORITIES
GLOBAL MARKETS INVESTMENT SOLUTIONS ~15% 10-15% STRENGTHEN LEADERSHIP
AND INVESTOR PROMOTE CROSS-ASSET AND
FINANCING ~10% > 15% INNOVATIVE SOLUTIONS
SERVICES
FLOW* ~25% < 5% RESTRUCTURE
STRUCTURED & ASSET FINANCE,
FINANCING &
INVESTMENT BANKING, ~30% > 15% GROW
TRANSACTION BANKING
ADVISORY
CORPORATE LENDING ~10% < 5% INCREASE SELECTIVITY
WEALTH & ASSET GROW PRIVATE BANKING IN
~10% < 5% FRANCE
MANAGEMENT AND ETFs
VERY HIGH GOOD LEVEL FEWER
*Including Securities Services SYNERGIES
LEVEL OF OF SYNERGIES
SYNERGIES
PRESENTATION TO DEBT INVESTORS MAY 2019 46REFOCUSING ON CORE EXPERTISE IN GLOBAL MARKETS
OUR STRATEGY IN GLOBAL CONCENTRATE RESOURCES EUR 8 BN RWA REDUCTION
MARKETS IS BASED ON ON MOST PROFITABLE 2020 TARGET*
THREE FRANCHISES ACTIVITIES & RESTRUCTURE
FLOW
STRENGTHEN LEADERSHIP IN
CROSS-ASSET INVESTMENT
SOLUTIONS Closure of OTC commodities
INCREASE EXECUTION Closure of Descartesproprietary trading FLOW
CAPABILITIES IN FINANCING 80% PRODUCTS
Increase client selectivity in Prime Services
OPTIMISE FLOW PRODUCTS Downsize Fixed Income and Currencies
LEVERAGING ON GROUP
CORPORATE FRANCHISE
EUR 2.3 BN ACHIEVED IN
Q1 19
* At constant regulatory environment
PRESENTATION TO DEBT INVESTORS MAY 2019 47ADJUSTING THE COST BASE
STRATEGIC ACTIONS % OF EUR 500M additional savings plan
GLOBAL MARKETS AND INVESTOR SERVICES INTERNAL Business closures,
STAFF optimisation of IT budget, 69%
Global Markets: business closures and staff reduction,
automation and offshoring
mainly in FICC
Securities Services: exit from wealth management
GLOBAL MARKETS &
EXTERNAL IT Business closures, fewer
services and clearing in the UK AND SUPPORT external contractors, 15% 76% INVESTOR SERVICES
FINANCING & ADVISORY STAFF automation
Merger of Global Finance, Coverage and Investment
Banking Consultants, legal fees,
OTHER COSTS marketing, travel, market 16%
ASSET & WEALTH MANAGEMENT data FINANCING &
Restructure private banking headquarters 14% ADVISORY
EUR 250-300M RESTRUCTURING COST IN 2019 ASSET &
GLOBAL REORGANISATION
10% WEALTH MANAGEMENT
OF IT AND OPERATIONS
PRESENTATION TO DEBT INVESTORS MAY 2019 48REACHING OUR 11.5%-12.5% 2020 RONE TARGET
2020 REVENUES > 2018
2020 COST OF RISK ~20 bps
REVENUES
REDUCING COSTS FROM 2020 RWAs ~ 2018 RWAs
EUR 7.2BN IN 2018 TO EUR including TRIM mostly impacting
6.8BN IN 2020 Global Markets
_RETURN ON NORMATIVE EQUITY* (%)
14.7%
2020 Target
11.2% 11.5% 11.5% - 12.5%
10.8% 10.6%
7.8%
2013 2014 2015 2016 2017 2018 2020
*Adjusted for regulatory fines in 2013 and in 2016 (EURIBOR fine and partial reimbursement)
2013 and 2014 as published in 2014, 2015 and 2016 as published in 2016, 2017 and 2018 as published in 2018
PRESENTATION TO DEBT INVESTORS MAY 2019 492020 GBIS ROADMAP
2019 2020
EUR 10bn RWA optimisation
75% 25%
o/w. EUR 8bn in Global Markets
EUR 500m of cost savings 20/30% 70/80%
EUR -250 to -300 m restructuring costs 100% 0%
Contribution of closed and downsized businesses
EUR 300 m revenues
to 2018 revenues
2020 GBIS RONE TARGET 11.5%-12.5%
PRESENTATION TO DEBT INVESTORS MAY 2019 505 CSR STRATEGY
AT THE FOREFRONT OF POSITIVE TRANSFORMATIONS

          DRAWING ON INNOVATIVE SKILLS AND PIONEERING SPIRIT                            ANCHORING A CULTURE OF RESPONSIBILITY

       Developing disruptive business solutions using blockchain: SG                         A Culture & Conduct programme sponsored by the
       issued first covered bond as a security token on a public blockchain                  CEO and reporting to the Board of Directors

       Founding member of the UN Environment                                                 Mandatory global all-staff training achieved:
       Programme “Positive Impact Finance Initiative”                                        Conduct Journey Workshop and follow up distance
      Digital transformation: #1 in eCAC40 Awards 2018                                       training completed by 95% of staff
                    Pioneering in renewable energy: combining
                    crowdfunding expertise with renewable energies                        Embedding conduct risk into Group risk management
                                                                                          framework
       Building sustainable cities: founding
       co-partner of the Netexplo Smart Cities
                                                                        AT THE            Duty of Care Plan published: maps, measures and
       Accelerator                                                    FOREFRONT           mitigates human rights and environmental risks

                                                                      OF POSITIVE
     Accelerating support in renewable energy :
                                                                   TRANSFORMATIONS       Grow with Africa initiative, fostering the sustainable and
     #2 Mandated Lead Arranger, #2 Adviser for renewable                                 low-carbon development of Africa and contributing to the
     energies EMEA (2018 Dealogic) , #4 MLA worldwide (2018                              UN Sustainable Development Goals, through :
     Inframation News)
                                                                                   •   Support for African SMEs
     EUR 100 bn commitment to support the energy
     transition between 2016 and 2020: 78% achieved at 1Q19                        •   Infrastructure financing
                                                                                   •   Innovative financing of agriculture and energy
     Integration of climate risk into Group risk management policy,                •   Financial inclusion
     evaluating and controlling climate-related risks and applying a
     mandatory transition risk assessment methodology to key sectors           Joint bookrunner for Benin’s first international bond in April 2019

                          FIGHTING CLIMATE CHANGE                                                  GROWING WITH AFRICA

                                                                                                     PRESENTATION TO DEBT INVESTORS MAY 2019          52
A CLEAR CSR STRATEGY INTEGRATED ACROSS THE SG GROUP
TONE FROM THE TOP
• Each year, the Board approves the Group’s CSR objectives and
strategy and reviews the developments of the programme
• Climate risk monitored by the Board and reviewed by a dedicated
Group Management Risk Committee
CSR ambitions structured around six main themes
and integrated in the TRANSFORM TO GROW strategy
Listening to stakeholders to define our Materiality Matrix in 2017
and continue integrating ESG risks
In our business development goals… In the way we conduct business…
Climate Change Client Satisfaction & Protection
Offers in line with Social Trends Culture, Conduct & Governance
Sustainable Development of Africa Responsible Employer
PRESENTATION TO DEBT INVESTORS MAY 2019 53CLIMATE RISK
In 2016 the Risk and CSR teams collaborated to analyse climate-related risk, and from 2017 these risk factors were
Governance incorporated in the risk appetite of the Group, with Board approval
Climate-related credit risks are reviewed at least annually through the Group Management Risk Committee
The risks related to climate change (physical and transition risks) are not considered as a separate risk category: they
constitute a risk factor aggravating credit, operational, insurance and market risks
In October 2018 the Group Management Risk Committee refined the credit risk appetite to take a 2°C transition scenario
into account in the Group’s credit risk profile
Exposure to physical risk in French residential real estate was also presented
Transition risk assessment methodology:
Methodology - A reference climate scenario is selected for the Group’s credit policy and reviewed annually : output helps to
assess the economic impact on sectors and individual clients
- A ‘climate vulnerability’ assessment of transition risks is conducted for all client groups in key sectors.
- This evaluation is mandatory for key sectors impacted by climate: oil and gas, metals and mining, transport and
power sectors for the corporate credit portfolio
SG seeks to participate in the development of methodologies to continue to improve the incorporation of the risk of
Working Groups climate change and participates in a number of working groups:
– the United Nations Environment Programme Finance Initiative (UNEP-FI), from which SG’s methodology is largely
derived
– the working group organised by the French banking regulator (ACPR) and the Banque de France on climate
change risk assessment in the banking sector
– the ClimINVEST initiative, to develop understanding of the impact of physical risk on SMEs in France
PRESENTATION TO DEBT INVESTORS MAY 2019 54EMBEDDING ENVIRONMENTAL RESPONSIBILITY IN CLIENT ACTIVITY
Commitment to align activities by 2020 with the IEA’s* trajectory to limit global warming to 2°C
ENERGY
TRANSITION €100 billion commitment to support the energy transition between 2016 and 2020: 69% completed as of end-2018
No new financing projects of coal, oil sands or Arctic oil (since 2016/17)
Electricity financing, 30.06.18:
LESS RELIANCE ON
FOSSIL FUELS 48.7% non-carbon energies 51.3% fossil fuels
of which 42% renewable energies of which 19.3% coal
Target 19% coal by 2020
Accelerating support in renewable energy financing : currently among global leaders
RENEWABLE
ENERGY SG supports and finances R&D of new technologies, large-scale infrastructure projects and innovative start-ups
2018 acquisition of the pioneering renewable energy crowdfunding fintech platform :
- Offers individuals and companies the opportunity to participate in financing projects
12 cross-sector and sector-specific Environmental & Social policies
E&S RISK
E&S risk management framework which extends beyond the regulatory requirements of the French Duty of Care Bill
MANAGEMENT
Compliance with the Equator Principles
Environmental & Social advisory for GBIS clients:
CLIENT SUPPORT – Assisting clients with the transition to a low-carbon economy
– Ensuring clients and transactions meet SG E&S Sector Policies and Guidelines
– Managing SG E&S reputation and credit risks
PRESENTATION TO DEBT INVESTORS MAY 2019 55A BANK PIONEERING RESPONSIBLE FINANCE
A CONSOLIDATED SUSTAINABLE AND POSITIVE IMPACT FINANCE OFFERING
Societe Generale is a founding member of the UNEP “Positive Impact Finance Initiative”, since 2001,
and a core member of the UNEP-FI working group defining “Banking Principles”
Consolidated « Sustainable and Positive Impact Finance » proposition, whose objective is to develop
and diversify a range of products and services by introducing more structuring expertise and advice on impact analysis and
measurement, whilst incorporating the UN’s 17 Sustainable Development Goals
FROM FINANCING TO INVESTING: EXAMPLES OF THE RANGE OF EXPERTISE AND SOLUTIONS
Positive Impact Finance projects: EUR 5bio since 2016, of which Lyxor ETFs matching 4 Sustainable Development Goals: Water,
2.7bio in 2017 Renewable energy, Climate change and Gender equality
Renewable energy projects: EUR 8.3bio (consulting and In 2017 Lyxor launched the first Green Bond ETF in the world
financing) in 2017
Around EUR 2bn AUM on ESG indices (started in 2006)
Green Bonds: #2 in Europe
and #6 worldwide (Bloomberg, 2017, all currencies). Lead Positive Impact Notes: over EUR 350m issued since early 2017.
managed a total of 25 green, social and sustainability bonds. In 2018 launch of Positive Impact Structured Notes supporting
SME financing
SRI Research top 3 for the past 10 years (Extel)
PRESENTATION TO DEBT INVESTORS MAY 2019 56E&S RISK MANAGEMENT: REGULATORY AND VOLUNTARY
E&S RISK INTEGRATION IN THE BUSINESS MIX
AND GREATER TRANSPARENCY OF E&S RISK MANAGEMENT
French law
BOARD ANNUAL REVIEW OF E&S STRATEGY European law
SG commitment
PRESENTATION TO DEBT INVESTORS MAY 2019 57WORKING WITH REGULATION TO SHAPE STRATEGY
FRANCE CONTINUES TO ENHANCE ITS SUSTAINABLE AND CLIMATE-RELATED REGULATION,
STRENGTHENING THE PIONEERING ROLE OF THE PARIS MARKETPLACE IN GREEN FINANCE
Law on Energy Transition for Green Grenelle 2 Law – Article 225 /
Growth - Article 173 Duty of Care Bill
EU Non Financial Directive
In August 2015 France became the first In 2012, it became compulsory for French In March 2017, following the UK Modern
country to introduce mandatory climate companies to report on the Environmental Slavery Act, France made it compulsory for
change-related reporting. and Social impacts of their business and to companies with over 5,000 employees to
Article 173 makes it compulsory for investors have this information audited. implement a vigilance plan whose objective
to explain how they take climate risks and From 2018, the EU Non-Financial Information is to map, measure and mitigate human
ESG criteria in their investment decisions, in Directive will reinforce the article 225, and rights and environmental risks, on a
line with the voluntary recommendations of worldwide basis.
require companies to focus on their major
the Financial Stability Board’s Taskforce on E&S risks and on the management of the
Climate-related Financial Disclosures (TCFD). adverse impacts of their worldwide activities.
SG is an active member of the UNEP FI SG sees this as an opportunity to
SG is fully supportive of these French
working group on the TCFD disclosure strengthen its existing E&S practices
and EU regulations, having reported
and committed to align to these and published its Duty of Care Plan
on E&S impacts since 2003
recommendations in February 2018
PRESENTATION TO DEBT INVESTORS MAY 2019 58CONTRIBUTION TO THE SUSTAINABLE DEVELOPMENT OF AFRICA
SUPPORT FOR AFRICAN SMEs INFRASTRUCTURE FINANCING
Creation of “SME Centres” in each SG Africa subsidiary, A key aspect of development in Africa in which the bank is
bringing together different stakeholders to work together already strongly involved. Four areas of focus: energy,
for business development (public bodies, multilaterals, transport, water and waste management and sustainable
development agencies, private sector, funds etc) cities
Double Africa workforce dedicated to structured
Increase outstanding loans to African SMEs by 60% finance by 2019
over the next 5 years (+ EUR 4bn)
GROW Increase financial commitments related to structured
finance in Africa by 20% over the next 3 years
WITH
INNOVATIVE FINANCING AFRICA FINANCIAL INCLUSION
LEVERAGING OPERATIONS IN 19
Improve support of agriculture industries, through Launch of YUP mobile money in 2017 to address
COUNTRIES AND HISTORICAL
a more collaborative approach with farmers, the poorly and unbanked population of Africa.
PRESENCE OVER A CENTURY Introduced in Cote d’Ivoire, Senegal and Burkina
cooperatives and SMEs
Faso with more than 300 000 clients at Nov.18
Support energy inclusion and promote renewable
energy sources Continue to grow microfinance business
Provide access to range of banking and non-banking Reach 1 million clients with YUP by 2020 and
services (healthcare, education, advisory) to one roll out to 4 additional countries
million farmers over the next 5 years, via YUP
platform Double outstanding loans to microfinance
organisations by 2022
Targets
PRESENTATION TO DEBT INVESTORS MAY 2019 59You can also read