MASTER IN MASTER'S FINAL WORK - FINANCE PROJECT - OCTOBER 2016 - UTL Repository
←
→
Page content transcription
If your browser does not render page correctly, please read the page content below
MASTER IN
 FINANCE

 MASTER’S FINAL WORK
 PROJECT

EQUITY RESEARCH - MELIÁ HOTELS INTERNATIONAL

 ANA BEATRIZ JORGE CARNEIRO

 OCTOBER - 2016
MASTER IN
 FINANCE

 MASTER’S FINAL WORK
 PROJECT

EQUITY RESEARCH - MELIÁ HOTELS INTERNATIONAL

 ANA BEATRIZ JORGE CARNEIRO

SUPERVISOR:
 PROF. DOUTOR CARLOS MANUEL COSTA
 BASTARDO

 OCTOBER - 2016
ANA BEATRIZ JORGE CARNEIRO EQUITY RESEARCH – MELIÁ HOTELS INTERNATIONAL

Abstract

The purporse of this project is to estimate the intrinsic value of the Meliá’s shares using the

most adequated valuation approaches to the features of the studied firm and trough a

detailed analysis of the firm, the Group and its external environment. This valuation was

based on the Free Cash Flow to the Firm method, which according to the Literature

Review is the best methodology to evaluate the company.

In this research, Melia Hotels International is valued at €2 878M, which leads to a target

share price of €12,53. Therefore, the theoretical price is above the quoted share price.

Thus, a buy recommendation is given for this company shares.

Keywords: Meliá Hotels International; Lodging Industry; Discounted Cash Flow; Free

Cash Flow to the Firm; Enterprise Value.

 i
ANA BEATRIZ JORGE CARNEIRO EQUITY RESEARCH – MELIÁ HOTELS INTERNATIONAL

Acknowledgments

 To Professor Carlos Bastardo, I’m deeply grateful for helping me construct this

analysis and by the dedication and competence in research orientation. Thanks for his

support and suggestions trouhghout the development of this project.

 To my parents, thanks for their effort that allowed me to finish my studies,

guidance troughout my life, encouragement and patience through this process.

 To my sister, Carolina, thanks for her incentive and understanding during these

months.

 To Vitor, thanks for all the love, caring and patience.

 ii
ANA BEATRIZ JORGE CARNEIRO EQUITY RESEARCH – MELIÁ HOTELS INTERNATIONAL

TABLE OF CONTENTS
LIST OF FIGURES ............................................................................................................................ IV

LIST OF TABLES ............................................................................................................................... V

LIST OF GRAPHS .............................................................................................................................. V

ACRONYMS AND ABBREVIATIONS LIST ................................................................................... VI

1. INTRODUCTION...................................................................................................................... 1

2. LITERATURE REVIEW ................................................................................................................. 2

 2.1 FRAMEWORK ............................................................................................................................................................. 2
 2.2 VALUATION METHODS ........................................................................................................................................... 3
 2.2.1 Discounted Cash-Flow Methods .................................................................................................................. 3
 2.2.1.1 Firm Valuation Models .......................................................................................................................... 4
 2.2.1.2. Equity Valuation Models ...................................................................................................................... 5
 2.2.1.3 Adjusted Present Value.......................................................................................................................... 7
 2.2.2 RELATIVE VALUATION ........................................................................................................................................ 7
 2.2.3 SPECIFIC VALUATION METHODS FOR HOTELS ................................................................................................ 9

3. MELIÁ HOTELS INTERNATIONAL - COMPANY OVERVIEW .............................................. 9

 3.1 COMPANY PRESENTATION ..................................................................................................................................... 9
 3.2 BUSINESS MODEL ................................................................................................................................................... 10
 3.3 MEL FUTURE’S STRATEGY ................................................................................................................................... 13
 3.4 OPERATIONAL AND FINANCIAL PERFORMANCE ............................................................................................. 14
 3.5 STOCK PERFORMANCE, DIVIDEND POLICY AND SHAREHOLDER’S STRUCTURE ....................................... 18

4. MACROECONOMIC ENVIRONMENT AND LODGING INDUSTRY OVERVIEW ............. 19

 4.1 SPAIN ........................................................................................................................................................................ 20
 4.2 EUROPEAN UNION ................................................................................................................................................ 20
 4.3 MIDDLE EAST AND NORTH AFRICA ................................................................................................................... 21
 4.4 LATIN AMERICA & CARIBBEAN ........................................................................................................................... 22
 4.5 EMERGING AND DEVELOPING ASIA .................................................................................................................. 22
 4.6 GLOBAL LODGING INDUSTRY OVERVIEW........................................................................................................ 23

5. STRATEGIC ANALYSIS ............................................................................................................... 23

 5.1 SWOT ANALYSIS .................................................................................................................................................... 23
 5.2 PORTER’S FIVE FORCES......................................................................................................................................... 24

6. COMPANY VALUATION ............................................................................................................. 24

 6.1 METHODOLOGY ..................................................................................................................................................... 24
 6.2 ASSUMPTIONS.......................................................................................................................................................... 25
 6.2.1 Revenues ......................................................................................................................................................... 25

 iii
ANA BEATRIZ JORGE CARNEIRO EQUITY RESEARCH – MELIÁ HOTELS INTERNATIONAL

 6.2.2 EBITDAR ...................................................................................................................................................... 25
 6.2.3 Capital Expenditures, Amortizations and Depreciations ....................................................................... 25
 6.2.4 Minority Interests .......................................................................................................................................... 26
 6.2.5 Operating Expenses ...................................................................................................................................... 26
 6.2.6 Net Working Capital ..................................................................................................................................... 27
 6.2.7 Debt ................................................................................................................................................................. 27
 6.2.8 Cost of Capital ............................................................................................................................................... 27
 6.3 VALUATION RESULTS ............................................................................................................................................ 30

7. RELATIVE VALUATION ............................................................................................................. 32

 7.4.1 METHODOLOGY .................................................................................................................................................. 32
 7.4.2 SELECTION OF PEERS ......................................................................................................................................... 32
 7.4.3 RESULTS ................................................................................................................................................................ 32

8. SENSITIVITY ANALYSIS ............................................................................................................. 33

9. CONCLUSIONS ............................................................................................................................ 33

10. REFERENCES ............................................................................................................................. 35

 10.1 ACADEMIC LITERATURE – PAPERS AND BOOKS: ........................................................................................... 35
 10.2 INTERNET BASED SOURCES ............................................................................................................................... 36
 10.3 INVESTOR RELATIONS – COMPANY CONSOLIDATED REPORTS ................................................................. 36
 10.4 DATABASES............................................................................................................................................................ 36

11. APPENDIX ................................................................................................................................... 37

 APPENDIX A – MEL STOCK PRICE EVOLUTION.................................................................................................... 37
 APPENDIX B – GROWTH OF BUSINESS AND LEISURE TRAVEL SPENDING ....................................................... 37
 APPENDIX C – STRATEGIC ANALYSIS ....................................................................................................................... 38
 APPENDIX D – ASSUMPTIONS & FORECAST: REVENUES ...................................................................................... 41
 APPENDIX E – ASSUMPTIONS & FORECAST: CAPITAL EXPENDITURE, DEPRECIATION AND
 AMORTIZATION ............................................................................................................................................................ 43
 APPENDIX F - ASSUMPTIONS & FORECAST: WORKING CAPITAL ........................................................................ 44
 APPENDIX G – ASSUMPTIONS & FORECAST: DEBT ............................................................................................... 44
 APPENDIX H – FORECAST: STATEMENT OF FINANCIAL POSITION .................................................................... 45
 APPENDIX I – SENSITIVITY ANALYSIS ...................................................................................................................... 46

LIST OF FIGURES

Figure 1 - MEL vs Benchmark ........................................................................................................................................ 16
Figure 2 Swot Analysis ...................................................................................................................................................... 38
Figure 3 Porter's Five Forces ........................................................................................................................................... 38

 iv
ANA BEATRIZ JORGE CARNEIRO EQUITY RESEARCH – MELIÁ HOTELS INTERNATIONAL

LIST OF TABLES

Table I - Valuation Methods .............................................................................................................................................. 3
Table II - Relative Valuation Multiples ............................................................................................................................ 8
Table III - Spain Economic Figures (2014-2021; % change) ..................................................................................... 20
Table IV - European Union Economic Figures (2014-2021; % change) ............................................................... 20
Table V - Middle East and North Africa Economic Figures (2014-2021; % change) ........................................... 21
Table VI - Latin America and Caribbean Economic Figures (2014-2021; % change) .......................................... 22
Table VII - Emerging and Developing Asia Economic Figures (2014-2021; % change) ..................................... 23
Table VIII - Operating Expenses Assumptions ........................................................................................................... 26
Table IX - Net Working Capital Assumptions ............................................................................................................. 27
Table X - MEL's WACC ................................................................................................................................................... 30
Table XI - Projected Cash Flow Statement ................................................................................................................... 30
Table XII – Enterprise, Equity Value & Share Price................................................................................................... 31
Table XIII - Valuation with Multiples ............................................................................................................................ 33
Table XIV - Estimated Growth Rates ............................................................................................................................ 42
Table XV - Consolidated Revenues (2015-2021) ......................................................................................................... 42
Table XVI - Revenues and CapEx (2012 – 2021F) ...................................................................................................... 43
Table XVII - Net Fixed Assets and D&A (2012-2021F) ............................................................................................ 43
Table XVIII - NWC Forecast .......................................................................................................................................... 44
Table XIX - Net Debt Forecast ...................................................................................................................................... 44
Table XX - Statement of Financial Position (Consolidated) ...................................................................................... 45
Table XXI - Valuation Individual Sensitivity Analysis ................................................................................................ 46
Table XXII - Valuation Colective Sensitivty Analysis ................................................................................................. 46
Table XXIII - MHI upside potential sensitivity analysis ............................................................................................. 46

LIST OF GRAPHS

 Graph 1 – MEL’s Business Model ................................................................................................................................ 10
Graph 2 - MEL Results (2013-2015; millions of euros) .............................................................................................. 15
Graph 3 - MEL Revenues per Segment; (2013-2015; millions of euros) ................................................................. 15
Graph 4 - Operating Margin & EBIT (2011-2015; millions of euros) ..................................................................... 16
Graph 5 - Net Income (2011-2015; millions of euros)................................................................................................ 17
Graph 6 - MEL Capital Expenditure (2011-2015; millions of euros) ....................................................................... 17
Graph 7 - Evolution of Net Debt (2011 -2015; millions of euros) ........................................................................... 18
Graph 8 - Shareholder's Structure ................................................................................................................................... 19
Graph 9 Stock Price Evolution ....................................................................................................................................... 37
Graph 10 Growth Rates per Segment 2016 .................................................................................................................. 37
Graph 11 Historical Revenue per Region ...................................................................................................................... 41
Graph 12 MEL Leverage Evolution 2015-2021F ........................................................................................................ 44

 v
ANA BEATRIZ JORGE CARNEIRO EQUITY RESEARCH – MELIÁ HOTELS INTERNATIONAL

LIST OF EQUATIONS
Equation 1 – Discounted Cash Flow Model .……………………………………………….………………4
Equation 2 – FCFF …………………. ....………………………….…….…………………………………5
Equation 3 – Firm’s Value ……………….……….. ……………….………………………………………5
Equation 4 – WACC …………...………....……………………..……….…………………………………5
Equation 5 – DDM: Value of Stock …………………………………….………...…………………..……7
Equation 6 – FCFE ……………………………………………………...…………………………………7
Equation 7 – Equity’s Value …………………..………………..………………….……………….………7

ACRONYMS AND ABBREVIATIONS LIST

APV – Adjusted Present Value

ARR – Average Room Rate

BV – Book Value

CapEx – Capital Expenditure

COGS – Cost of Goods Sold

CPI – Consumer Price Index

CRP – Country Risk Premium

D&A – Depreciation and Amortization

DCF – Discounted Cash Flow

DDM – Dividend Discount Model

DecxxA – Actual figures as at 31 December 20xx

DecxxF – Forecasted figures as at 31 December 20xx

EBIT – Earnings Before Interest and Taxes

EBITDA – Earnings Before Interest, Taxes, Depreciation and Amortization

EBITDAR – Earnings Before Interest, Taxes, Depreciation and Amortization, Rental and Leases

EMEA – Europe, Middle East and Africa Region

EVA – Economic Value Added

FCF – Free Cash Flow

FCFE – Free Cash Flow to Equity

FCFF – Free Cash Flow to Firm

IMF – International Monetary Fund

LAC – Latin America & Caribbean

 vi
ANA BEATRIZ JORGE CARNEIRO EQUITY RESEARCH – MELIÁ HOTELS INTERNATIONAL

M&A – Mergers and Acquisitions

MEL – Meliá Hotels International

NWC – Net Working Capital

P – Price per Share

PER – Price Earnings Ratio

PwC – Pricewaterhouse Coopers

RevPAR – Revenue per Available Room

WACC – Weighted Average Cost of Capital

WTTC - World Tourism and Travel Council

 vii
ANA BEATRIZ JORGE CARNEIRO EQUITY RESEARCH – MELIÁ HOTELS INTERNATIONAL

 1. Introduction

 The purpose of this Master’s Project is to estimate the price target of Meliá Hotels

International (hereinafter the “Group”, the “Company” or MEL). The International

Valuation Standards Council define market value as: “The estimated amount for which an

asset or liability should exchange on the valuation date between a willing buyer and a

willing seller in an arm’s length transaction, after proper marketing and where the parties

had each acted knowledgably, prudently and without compulsion.” In actual fact, this type

of value is established on the average market conditions in a certain date and therefore, it is

no concerned with the specific drives of the single investor. These motivations are defined

by another type of value – The Investment Value.

 If we accepted the market capitalization as the market value, once the Group is a

public traded firm, the aim of this work would already have been attained. However,

economic agents do not always act based on rational expectations and occasionally there is

asymmetric information that must be taken into account. Besides, the valuation made by

these economic agents, which is embedded in market capitalization, can be above or below

the intrinsic value of the company (the estimated value in function of the firm’s capacity to

generate future wealth). In summary, this Master´s Final Work will estimate the intrinsic

value of the public traded company Meliá Hotels International.

 Regarding the project structure, it will be presented in six different chapters:

 i. The first chapter contains a literature review, in order to gather pertinent

 information concerning the valuation methodologies available and applicable to

 the Group, based on textbooks, relevant scientific papers, and academic

 publications;

 ii. Next, in the second chapter of this project, a full description of the company

 will be done. This process aims to collect information related to the company’s

 1
ANA BEATRIZ JORGE CARNEIRO EQUITY RESEARCH – MELIÁ HOTELS INTERNATIONAL

 profile, business model, economic and financial evaluation regarding the firm’s

 operational and stock’s market performance;

 iii. The third chapter will cover a brief analysis of the macroeconomic

 environment and hospitality industry in the main markets where Meliá Group

 operates;

 iv. With the conclusions of the analysis made on the second and third chapters, on

 the forth chapter it will be done a strategic analysis of the company, through a

 SWOT and a Porter’s Five Forces analysis.

 v. Subsequently, the fifth chapter will rely on the company’s valuation. It will be

 established some assumptions and then value the company based on the

 methodology more suitable, agreeing with the literature review;

 vi. Finally, the last chapter it will present the results and conclusions from the

 valuation and provide a recommendation for the investors.

 2. Literature Review
 2.1 Framework

 Value is the defining dimension of measurement in a market economy. People invest

expecting that when they sell, the value of the investment will have grown by an amount

large enough to compensate them for the risk they took. Hence a company valuation is the

process of determining the current worth / price of an asset or a company. According to

(Damodaran, 2006) the value of any asset is a function of the cash flows generated by that

asset, the life of the asset, the expected growth in the cash flow, and the riskiness associated

with them.

 Firm valuation comprises a process of major importance in the fields of finance,

considered by many as the core of finance. During the past few years, firm valuation has

 2
ANA BEATRIZ JORGE CARNEIRO EQUITY RESEARCH – MELIÁ HOTELS INTERNATIONAL

gained even more weight, playing a major role in M&A, IPO’s, financial restructuring,

strategic decision making process and portfolio management.

 Despite the careful and detailed valuation in various areas of finance, at the end, there

will be uncertainty about the final numbers and conclusions. That numbers are supported

by assumptions that are made about the future of the company and the economy

(Damodaran, 2012).

 2.2 Valuation Methods

 Depending on the company, the final goal and available time for the valuation (different

models involve different variables and calculations that may consume too much time),

there are a wide range of usable valuation methods. Although there is no general

consensus, valuation methods are classified into three main approaches: i) Discounted Cash

Flows Valuation method, ii) Relative Valuation method and iii) Contingent Claim Valuation

(Real Options) (Berk, J., Demarzo, P., 2013).

Table I - Valuation Methods

 Discounted Cash-Flow Relative Valuation Contigent Claim Asset Based
 Valuation Valuation Valuation
Equity Valuation Models: Multiples: Option Pricing Book Value
DDM – Dividend Discount Model EV/EBITDA Models: Liquidation Value
FCFE – Free Cash-Flow to Equity EV/EBIT Binomial Replacement Cost
Firm Valuation Model: PER Black-Scholes
FCFF – Free Cash Flow to the P/BV
Firm P/S
EVA – Economic Value Added PEG
APV – Adjusted Present Value
Source: Damodaran, A. (2006), Valuation Approaches and Metrics: A Survey of the Theory and Evidence, Stern School of
Business, New York University
 2.2.1 Discounted Cash-Flow Methods

 The purpose of this methodology is to provide an estimate of the intrinsic value of

a firm at a certain period in time. This model defines that the value of an asset is equal to

the present value of the expected future cash-flow on that asset, discounted at the rate that

best describes its riskiness (Fernandez, 2007).

 3
ANA BEATRIZ JORGE CARNEIRO EQUITY RESEARCH – MELIÁ HOTELS INTERNATIONAL

 =∞

 = ∑ (1)
 (1 + )
 =1

 According to Damodaran (2006), there are three distinct approaches of DCF

valuation models: Firm Valuation, Equity Valuation and Adjusted Present Value.

 2.2.1.1 Firm Valuation Models

 These models developed an approach to valuation where the entire firm is valued,

by discounting the cumulated cash flows to all claim holders (stockholders or creditors) in

the firm by the weighted average cost of capital (cost of capital approach) (Damodaran,

2006) or by adding the marginal impact of debt on value to the unlevered firm value

(adjusted present value approach) (Kaplan, S., Ruback, R., 1995). Within this category of

evaluation, the main models are the Free Cash Flow to Firm – FCFF and the Economic

Value Added – EVA. In this project is only referenced the first on it will be used to

evaluate Meliá Hotels International (MEL).

Free Cash Flow to Firm (FCFF) - In this method it’s possible to assess the overall firm

value by discounting the after-tax free cash flow available from operations at a weighted-

average cost of capital (WACC). Fernández (2007) describes free cash flows as the after-tax

cash generated from a firm’s operations assuming there’s no debt. Damodaran (2006) also

defines FCFF as a cash flow computed as “if the firm had no debt and no tax benefits

from interest expenses”. The author highlights that this cash flow is calculated before any

sources of financing and hence, it is unaffected by firms’ financial structure. While there are

many versions of FCFF, the most common one is given as follows:

 = (1 − ) − ( − ) − ∆ (2)

 The firm value is given by discounting FCFF at WACC rate:
 =∞
 ′
 (3)
 = ∑
 (1 + )
 =1

 4
ANA BEATRIZ JORGE CARNEIRO EQUITY RESEARCH – MELIÁ HOTELS INTERNATIONAL

 = × + × (1 − ) (4)
 + +

 Where, E is the market value of Equity, D the market value of Debt and T the tax

rate. WACC is a weighted average of the cost of equity and debt, which are required by

shareholders and debtholders, concerning the company’s financial structure (Fernandez,

2007).

 For some authors, WACC is the most common technique for valuing risky cash-

flows. Its major strength is the simplicity from which deviations in the financing mix can

be built into the valuation model (Damodaran, 2006; Ruback, 2000). Some authors, such

as Luherman (1997) and Damodaran (2012) state that this model it is a practical choice

when managers aim for a constant debt-to-equity ratio over the long run.

 Despite the problems associated to its usage, WACC is still the most widely method

used for firm valuation (Sabal, 2005). For other authors, the WACC is obsolete once it is

affected by deviations in the capital structure, implicating some implementation problems

with FCFF. This is specially true in high levered transactions and project financing in which

capital structure changes over time (Esty, 1999).

 2.2.1.2. Equity Valuation Models

 According to Damodaran (2006), equity valuation models assess the value of the

firm’s equity stake in a business. This is done by discounting the expected cash flows that

are considered belonging to the equity holders, at a rate that reflects the cost of equity

financing.

 Within this category it can be found two different models: i) Dividend Discount

Model (DDM), in which the expected cash flow to the equity is equivalent to the expected

shareholders dividends in perpetuity; ii) Free cash flow to the equity (FCFE), which are

 5
ANA BEATRIZ JORGE CARNEIRO EQUITY RESEARCH – MELIÁ HOTELS INTERNATIONAL

considered all cash flows distributed to shareholders, as well as the potentials, i.e. those that

the company generates, but for some reason chooses not to distribute.

Dividend Discount Model (DDM) - Based on the idea that, when an investor buys

shares from publicly traded companies, he is expecting to earn two different types of cash

flows: dividends during the holding period and an expected price at the end of that period

(Damodaran, 2006). If one assumes that a publicly traded company lasts forever, which in

theory is possible, then the price of a stock is equal to the expected dividends that stock

will pay in perpetuity. The first to identify the connection between present value and

dividends was Williams (1938). After that, several other variations of the model have been

developed differing in assumption about future growth. Durand (1957) introduced the

stable-growth model which was later on, further analysed and promoted by Gordon (1962).

According to this model, the expected dividend of the next period and the cost of equity

adjusted by the expected growth rate in dividends explain the value of a stock.

 (5)
 : =
 −

 Where, Div is the expected dividend for the next period, ke the cost of equity and g

the constant growth rate.

Free Cash Flow to Equity (FCFE) – Traditional CFE represent what is available for

distribution to shareholders after capital expenditures and net working capital needs have

been met, as well as, financial obligations (Damodaran, 2002 and 2006). These obligations

consist of debt payments as well as changes in working capital and preferred dividend

payments. Therefore, FCFE is given by:

 = + & − − ∆ − (
 (6)
 − ) −

 6
ANA BEATRIZ JORGE CARNEIRO EQUITY RESEARCH – MELIÁ HOTELS INTERNATIONAL

 Once the future cash flows to equity are computed, they’re discounted at the

expected cost of equity, in order to obtain the equity value.
 =
 ′
 (7)
 = ∑
 (1 + )
 =1

 Damodaran (2006) makes a comparison between DDM with FCFE, retitling the

latter “potential dividend model” 1 , it means that if a company was to pay out to its

shareholders all its cash flows after debt payment and reinvestment needs, both DDM

(considering company doesn’t inflate dividends by borrowing) and FCFE methods would

yield the same value for the company.

 2.2.1.3 Adjusted Present Value

 According to Fernandez (2007), this method computes the company’s value by

assessing the value of its assets. There are three main types of asset based valuation

methods: book value, replacement cost and liquidation value (Damodaran, 2012). The

book value approach, it uses book value as the measure of the value of the assets;

replacement cost is the estimation of what would be the cost to substitute all of the assets

that a company has today; liquidation value is achieved by combining the estimated sale

profits of the assets owned by a firm. However, these methods do not take into account

the company’s possible future evolution, the money’s temporary value or the industry’s

current situation (Fernández, 2002).

 2.2.2 Relative Valuation

 Relative Valuation is often used in the most of the equity research reports, not only

because it can be a complement to DCF valuation (although the fact that it’s precision is

especially separate from the DCF valuation techniques), but also because it requires less

assumptions and variables.

1Damodaran, A. (2006), Valuation Approaches and Metrics: A Survey of the Theory and Evidence, Stern
School of Business, New York University

 7
ANA BEATRIZ JORGE CARNEIRO EQUITY RESEARCH – MELIÁ HOTELS INTERNATIONAL

 There are three essential steps in order to perform a relative valuation. The first one

requires the analyst to identify a set of comparable companies priced by the market. In

general, analysts often use companies belonging to the same sector or whose potential

growth, profitability and perceived risk are similar. The second step, consists in standardize

the prices to a common variable, since absolute prices cannot be compared. Therefore, the

analyst must convert the prices into multiples so firms with different size and unit can be

compared to their peers. According to Fernández (2002), the most used multiple is the Price

Earnings Ratio (PER), though, some multiples can be more appropriate than others, depending

on the industry (in hotel valuation processes it’s generally used the price per room). Despite

having the prices achieve the standardized form; one can still notice discrepancies between

companies relative to growth, risk and cash-flows. Hence, the final step involves

controlling for those differences.

 According to Fernández (2002) there are three main types of multiples as we can see

on the table below:

Table II - Relative Valuation Multiples

 Multiples based on the market Multiple based on the company’s
 Growth referenced multiples
 capitalization (Equity) value (Enterprise Value)

E.g. E.g. E.g.

Price-to-Earnings (PER) EV/EBITDA PEG

Price-to-Sales (P/S) EV/Sales EV/EG

Price-to-Book Value (P/BV) EV/IC

Price-to-Cash Flow (P/CF)

Dividend Yield (DY)

 Source: Fernández, P. (2002). Valuation using multiples. How do analysts reach their conclusions?, IESE Research

Papers D/450, IESE Business School.

 Even with the easiness of relative valuation, it is difficult to implement when there is

not a quite large number comparable firm in the sector. Moreover, the definition of

 8
ANA BEATRIZ JORGE CARNEIRO EQUITY RESEARCH – MELIÁ HOTELS INTERNATIONAL

comparable firms in itself is not always easy to establish and often leaves space for subjectivity.

That is, relative valuation adds explanatory power and accuracy to DCF’s estimates and

thus, should be used in a second stage as a complementary tool to DCF.

 2.2.3 Specific valuation methods for Hotels

 In this case, the best model to evaluate MEL is the FCFF, discounted at WACC,

not only because it is reasonable to consider a constant target debt to equity ratio, but also

because it allow us to work with the company consolidated accounts without considering

the value of each hotel or business unit. If we were valuing another lodging company with

a different business model than Meliá, we could consider other valuation methods, more

related to the intrinsic value of a company’s real estate properties. If we were concerned

about the value of the hotel, as a real estate asset, then the three most used methods2 are: i)

Market comparative method; ii) Income method; and iii) Cost method.

 The market approach is similar to relative valuation, although the comparatives of

real estate market are specific, like price per square meter, in general, or price per room,

particularly in the hotel sector. The income approach is based on the same methods applied

in corporate field, namely DCF, or the most simple and expedite yield, or cap rate method.

Regarding cost approach, this one is not a driven market method, and so, only when it is

not possible the other methods this one should be applied (also, it does not work in valuing

companies)

 3. Meliá Hotels International - Company Overview

 3.1 Company Presentation

 Founded in 1956 in Palma de Mallorca, Spain, MEL is one of the world’s largest

resort hotel chains, as well as Spain’s leading hotel chain. It currently provides more than

350 hotels in 35 countries, on 4 continents.

2
 Source: International Valuation Standards Council

 9
ANA BEATRIZ JORGE CARNEIRO EQUITY RESEARCH – MELIÁ HOTELS INTERNATIONAL

 All over its history, the company has been involved in several M&A operations

with other hotel companies, allowing the company to grow at a startling rate.

 This evolution and the strategic focus on international growth has allowed Meliá

Hotels International to be the first Spanish hotel company with presence in key markets

such as China, the Middle East, or the US, as well as maintaining its leadership in

traditional markets such as Europe, Latin America or the Caribbean.

 In 1996, it was the first Spanish hotel company to be floated on the stock exchange,

with the resulting requirement of transparency, regulatory control, and corporate social

responsibility. Since then, the company’s focus on maintaining a stable financial position

has seen an increase in loyalty among its shareholders and investors.

 MEL is the only company in the sector to be included in the Spanish Stock

Exchange index of responsible companies, the FTSE4Good. The company is also a point

of reference in the Spanish tourist sector when it comes to Sustainability and Corporate

Social Responsibility. Its Global Sustainability Policy formally sets out its commitment to

the environment, cultural and social integration and sustainable, responsible growth.

 3.2 Business Model

 The group has developed and implemented a new Organisational and Business

Model in order to simplify the alignment with corporation’s strategy. This new model

Graph 1 – MEL’s Business Model relies on four business areas: Hotels, Asia Pacific, Real
 Source: Meliá Hotels International
 Estate and Club Meliá. These four areas

 Owned actively cooperate and are also highly

 18% complementary in their activities to achieve the
 Leased
 company’s strategic challenges: to become a
 58% 24%

 Managemen more global company, with growth in the most
 t&
 Franchised

 10
ANA BEATRIZ JORGE CARNEIRO EQUITY RESEARCH – MELIÁ HOTELS INTERNATIONAL

relevant brands and markets, (especially through management, lease and franchise

agreements), with a special focus on Asia and maximising the profitability of its assets. It

follows a brief description of the activities in each of the different areas:

Hotels

 Responsible for the operations in the MEL hotels, this area includes all of the hotel

brands and the wide range of experiences they offer guests, from the most avant-garde to the

most family-oriented.

 The Hotels area has evolved in 2011 towards a hybrid management model by both

brand and region, which at the same time ensures the personality of the brand and the

efficiency of operations.

 Given the large number of hotels in the company portfolio, MEL developed three

different systems for operating hotels as follows: Ownership: both the ownership and the

management of the property are in the hands of MEL; Management: the management of

the hotel is the responsibility of MEL, but the hotel is owned by a partner with whom the

company has agreed conditions for its management services; Lease: MEL leases facilities

to operate a hotel under one of its hotel brand name.

 Given the Company’s focus towards a low-capital model, it is desirable to manage

and franchise hotels rather than own them. This allows management to do what they do

best: selling rooms, offering their guests an experience and guaranteeing a solid control

over operating costs. The emphasis of the company on the long-term management

contracts and franchising tends to provide more stabilized earnings in periods of economic

softness like that we are living through today, while adding new hotels to the system

generates growth with small or even no investment.

 11
ANA BEATRIZ JORGE CARNEIRO EQUITY RESEARCH – MELIÁ HOTELS INTERNATIONAL

 Asia-Pacific

 The Asia-Pacific area was created with the aim of a growing presence of MEL in

the continent, at the same time that promotes the role of Asia as a feeder market for

company hotels. In order to achieve this goal, MEL has reinforced its sales, distribution

and hotel development squads with the creation of a corporate office in Shanghai from

which the company's Asia-Pacific strategy is managed.

 Real Estate

 Real Estate is another basic foundation for the MEL organisational structure with

the dual goal of, not only maximising the profitability of the company’s real estate assets,

but also using those assets to widen the range of services available to clients.

 Therefore, this area is responsible for enhancing the sustainable profitability of

company assets, ensuring the quality of the real estate portfolio, optimizing the lifecycle of

assets, planning medium and long-term investments, promoting and maintaining

relationships with partners and real estate investors, and marketing and managing

residential developments, shopping malls and golf courses. In order to get the most out of

all the catering and sports facilities in hotels, the company has forged a number of strategic

alliances with market leaders in each area.

 Club Meliá

 Created in 2004, with 27 000 members worldwide, Club Meliá is the vacation club

of MEL, with the aim of completing the company's range of holiday products.

 Club Meliá guarantees its members one week's vacation a year, for 50 years.

Members purchase a “holiday currency” named Options, which they can swap for annual

vacations in a large selection of company hotels or in a network of more than 4,000

affiliated resorts worldwide.

 12
ANA BEATRIZ JORGE CARNEIRO EQUITY RESEARCH – MELIÁ HOTELS INTERNATIONAL

 3.3 MEL Future’s Strategy

 Regarding the future strategy of the Company, MEL aims to keep working based

on the same values, but with a larger and growing hotel chain. The main goal is to

consolidate the brand in the mature markets and to grow in the emerging ones.

 In 2015 the Company signed 25 new hotels of which 5 already opened in 2015 and

therefore they are not included in the pipeline (pipeline data details existing hotel supply

and projected growth globally) at the year end. As a result, the pipeline reached 62 hotels

(16 085 rooms) due to the efforts to reinforce internationalization while also boosting

presence in those traditional markets that generate value for Meliá and its brands.

 82% of the pipeline will be incorporated under management formulas, while only

an 18% are lease contracts, all this lease contracts are located in strategic markets that meet

Company’s requirements in terms of quality, productivity and safety, such as Germany,

U.K, United States or Italy. On the other hand, the focus will be the maintenance of Melia

leadership in the resorts segment while reinforcing the presence in leisure destinations.

 Of these 62 hotels, 2 hotels have opened in January 2016: the Sol Costa Atlantis in

Tenerife (289 rooms under lease agreement) taking advantage of the strong momentum in

Mediterranean resorts and the Company expertise in the Canary Islands; and the Meliá

Braco Village in Jamaica (226 rooms under management) that extends the Meliá footprint

in the English-speaking Caribbean.

 On the other hand, in 2016 the pace of new agreements is expected to remain the

same, with 25-30 new hotels being added to the pipeline, which implied one new signature

every two weeks. In terms of hotel openings, the forecast based on the pipeline as it stood

on 31st December is for Meliá to open 20-25 hotels over the year:

 America (12 hotels / 2 325 rooms): Of the 13 hotels in the pipeline, 5 are

scheduled to open in 2016 including: the Meliá Cartagena (154) in Colombia and 3 hotels in

 13
ANA BEATRIZ JORGE CARNEIRO EQUITY RESEARCH – MELIÁ HOTELS INTERNATIONAL

the United States: the ME Miami (129) and Meliá Costa Hollywood (227) in Miami, and the

Innside New York NoMad, the only lease contract in the pipeline in the Americas.

 Asia (20 hotels; 4,827 rooms): Within the framework of the new Strategic Plan

2016-2018 one of the most important objectives for the company is to increase its presence

in Asia, as reflected in the current pipeline in the region which makes up 27% of the global

rooms pipeline. In recent years, the Company has made great efforts to detect strategic

partners which could contribute to the consolidation of Meliá’s presence in the region, the

fruit of which is a current pipeline which includes the opening in 2016 of 8 hotels (1.823

rooms) all under management agreement.

 EMEA (20 hotels; 4,006 rooms): The pipeline in EMEA is well balanced between

lease and management agreements. Going into 2016 the current pipeline includes the

opening of 3 leased hotels under the Innside brand in Germany) and 2 managed hotels in

Italy and Morocco.

 Mediterranean (3 hotels; 1725 rooms): One of the agreements has been already

opened (the Sol Costa Atlantis), while another 2 hotels in Cape Verde are expected to open

(one of them in 2016).

 Brazil (4 hotels; 1178 rooms): Including 2 hotels which are expected to open in

2016 before the Olympic Games in Rio de Janeiro.

 Cuba (3 hotels; 2024 rooms): Cuba where Meliá currently operates 39% of hotel

rooms in the island remains one of the key markets for the Company.

 3.4 Operational and Financial Performance

 Despite the losses in 2013, MEL has been growing through the past three years.

This is due to the fact that the Company continued opening new hotels each year and

expansion of several MEL brands.

 14
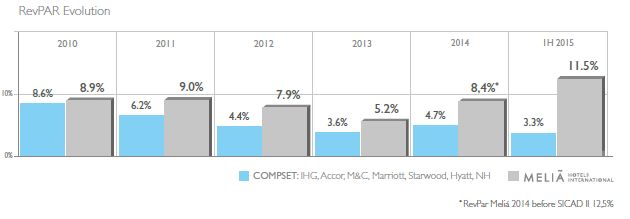
ANA BEATRIZ JORGE CARNEIRO EQUITY RESEARCH – MELIÁ HOTELS INTERNATIONAL

 Graph 2 - MEL Results (2013-2015; millions of euros)

 Revenues Operating Income Net Income

 1738,2
1368,7 1464,3

 174,9 132,4 30,4 163,9
 36

 2013 -73,2 2014 2015

 Source: Meliá Hotels International
 Revenues Graph 3 - MEL Revenues per Segment; (2013-2015; millions of euros)

 2500
 Regarding the results
 2000
 presented by the Group in 2015, it is
 1500 Overheads
 important to note that the main
 Club Meliá
 indicators have grown compared 1000 Real Estate
 Hotels
 with the previous year. These results 500

 are due to consolidation of the 0
 2013 2014 2015
 improvement in all divisions of the
 Source: Meliá Hotels International
 hotel business, generating a record increase of Revenue Per Available Room (RevPAR3). A

 result of an improvement in the business environment and economy in key markets, a

 brand strategy and product repositioning and rise of 13,4% in the prices. This trend should

 continue in 2016, where macro and international instability come together with good

 repositioning results in mature locations.

 The maturity in the hotel management has lead MEL to outperform results when

 compared with the benchmark, registering 19 consecutive quarters of RevPAR growth. The

 differences between MEL’s results and the benchmark are expressed on the next figure. ~

 3 Hotel guestroom revenue divided by the room count

 15
ANA BEATRIZ JORGE CARNEIRO EQUITY RESEARCH – MELIÁ HOTELS INTERNATIONAL

Figure 1 - MEL vs Benchmark

 Source: Meliá Hotels International

 According to MEL annual report 2015, there were improvements in the sales of

every region: In the Americas, RevPAR increased by 20,6% thanks to a rise in Average

Room Rate (ARR4) of 21,3%; In EMEA (includes Premium Hotels in Spain), RevPAR in

owned and leased Hotels grew by 11,2%, 100% explained by increases in prices; In the

Mediterranean Division, RevPAR grew by 8,7%, almost all (7,5%) due to price increases.

The geopolitical situation in other destinations also had an impact on the hospitality

industry in Cape Verde, where Meliá manages about 1 500 rooms; The division Spain

(City hotels) reports an increase in RevPAR of 13,1%, mainly attributable to the consistent

recovery in all market segments which allowed Meliá to maintain its leadership in the most

tourist cities, where the Company takes advantage of its experience and expertise in the

Urban and Leisure segments, to develop its successful "bleisure" strategy (business +

leisure), focused on both the business and leisure travellers, to optimize occupancy and

ARR.

 EBIT & Operating Margin Graph 4 - Operating Margin & EBIT (2011-2015; millions of euros)

 200 14,0%
 As we can see on
 12,0%
 150
Graph 4, MEL’s EBIT has 10,0%
 8,0%
 100 EBIT
been generally increasing over 6,0%
 4,0% Operating Margin
 50
the past five years (with the 2,0%
 0 0,0%
 2011 2012 2013 2014 2015
4 Hotel guestroom revenue divided by the number of rooms sold Source: Meliá Hotels International

 16
ANA BEATRIZ JORGE CARNEIRO EQUITY RESEARCH – MELIÁ HOTELS INTERNATIONAL

exception of 2013-2014). In 2015, EBIT increased by, approximately 25% when compared

with 2014.

 Regarding the Operating Margin, it increases 4,3% from 2014 to 2015. This is due

to the fact of the Group increased the management fees in 19,5M€, when compared with

2014, including hotels owned, leased and under management to third parties.

 Graph 5 - Net Income (2011-2015; millions of euros)
 Net Income 50

In 2015, the net income was up 18,3% 0
 2011 2012 2013 2014 2015 Net Income
in comparison with 2014. Despite the
 -50
 Source: Meliá Hotels International
impact of higher taxes resulted of an
 -100
inspection to verify compliance with tax obligation and duties over the period of 2009-

2012. Excluding the impairment and the extra-taxes, net income increased more than

200%.

 Capital Expenditures Graph 6 - MEL Capital Expenditure (2011-2015; millions of euros)

 In 2015, the Group invested around 160
 140
64M€, mainly in the development of new
 120
hotels, rehabilitation and modernization of 100
 80 Capital
existing ones. For 2016, MEL is expecting to Expenditures
 60
continue the investment through refurbishing 40
 20
of new hotels in order to increase the number 0
 2011 2012 2013 2014 2015
of rooms and hotels under management, aligned with the
 Source: Meliá Hotels International
Strategic Plan for 2016-2018.

 Working Capital

 At the end of 2015, MEL had negative working capital as the current liabilities were

approximately 869,3M€, while the current assets were around 767,2M€. The fact that the

 17
ANA BEATRIZ JORGE CARNEIRO EQUITY RESEARCH – MELIÁ HOTELS INTERNATIONAL

company has negative working capital could indicate that it could experience problems

expanding. However, negative working capital is not necessarily a bad thing, once it could

indicate that the company is very efficient at running over inventory or that MEL has large

financial subsidiaries and institutions.

 Graph 7 - Evolution of Net Debt (2011 -2015; millions of euros)
 Debt Structure

 2015 was the second 2012

consecutive year of debt 2013

reduction, reaching a total Net Debt
 2014

Net Debt of 768,8M€, minus 2015

216M€ than the previous - 500 1.000 1.500

year. Current debt levels are now similar to the ones in Source: Meliá Hotels International

2007, one of the best years in MEL history. There were a successful evolution of Financial

Expenses account with 36M€ savings, when compared with 2014, due to the lower value of

debt and a decrease in the average cost of debt, that now stays at 4,36%.

 Essentially, its debt structure is mainly composed by simple and convertible bonds,

bank loans, mortgage banked-loans, credit facilities and leases.

 3.5 Stock Performance, Dividend Policy and Shareholder’s Structure

 Stock Performance

 MEL is quoted since 1996, when the company became public at the initial price of

6,42€. The stock price decreased by 2,1% during the fourth quarter of 2015, while the

IBEX Medium Cap rose by 5,5% and the IBEX 35 decreased by 0,2%. For the 12 months

of 2015, the stock price rose by 37,5%.

 Over the last 3 years, the market capitalization of the company has been increasing

in average, as can be seen in the graphic at Appendix A. This recent trend and valorization

 18
ANA BEATRIZ JORGE CARNEIRO EQUITY RESEARCH – MELIÁ HOTELS INTERNATIONAL

of the Group reflects the company’s strategy of managing and developing a larger number

of rooms around the world and the intention to invest in the next few years, in order to

scale the business and enlarge the number of hotels under management.

 Dividend Policy

 MEL has the objective of ensure a satisfactory remuneration to the shareholders

through the distribution of dividends. In order to achieve that the Company has been

paying about 20% of the Parent Company’s consolidated profits in dividends. The last

dividends were paid out on August 5th, 2015 with a gross value of 0,03€ per share.

 Graph 8 - Shareholder's Structure
 Shareholder’s Structure Escarrer Julia
 (Gabriel & Family)
 MEL’s capital, in 31 of December
 36%
of 2015, was accounted for 199 053 048 Santander Asset
 Management
shares of common stock outstanding, of 58%

which 58,32% are held by the group and 1% DNCA Investments
 1%
41,68% correspond to floating stock. 1%
 2%
 1%
 The majority of these non-floating shares are held by Source: Meliá Hotels International

Gabriel Escarrer and his family, the founders of MEL. The top 5 shareholders of MEL

hold together around 63% of the Company, with the remaining 37% widely scattered.

 4. Macroeconomic environment and lodging industry overview

 This section comprises an analysis of the macroeconomic outlook in 2016 and for

the subsequent years, in the main regions where MEL operates and a global lodging

industry overview. This macroeconomic perspective will be done across regions rather

being country-specific due to the MEL own strategy.

 19
You can also read