REGIONAL DEMOGRAPHICS AND STRUCTURAL HOUSING DEMAND AT A COUNTY LEVEL - RESEARCH SERIES NUMBER 111 December 2020
←
→
Page content transcription
If your browser does not render page correctly, please read the page content below
RESEARCH
SERIES
NUMBER 111 REGIONAL DEMOGRAPHICS AND STRUCTURAL
December HOUSING DEMAND AT A COUNTY LEVEL
2020
 ADELE BERGIN AND ABIÁN GARCÍA-RODRÍGUEZ

 ENCE FOR POL
 ID IC
 EV Y
REGIONAL DEMOGRAPHICS AND
 STRUCTURAL HOUSING DEMAND AT
 A COUNTY LEVEL

 Adele Bergin

 Abián García-Rodríguez

 December 2020

 RESEARCH SERIES
 NUMBER 111

 Economic and Social Research Institute;
 Department of Housing, Local Government and Heritage

 Available to download from www.esri.ie

 © The Economic and Social Research Institute
 Whitaker Square, Sir John Rogerson’s Quay, Dublin 2

 DOI: https://doi.org/10.26504/rs111

 ISBN: 978-0-7070-0539-3

This Open Access work is licensed under a Creative Commons Attribution 4.0 International License
(https://creativecommons.org/licenses/by/4.0/), which permits unrestricted use, distribution, and
reproduction in any medium, provided the original work is properly credited.
ABOUT THE ESRI
The mission of the Economic and Social Research Institute is to advance evidence-
based policymaking that supports economic sustainability and social progress in
Ireland. ESRI researchers apply the highest standards of academic excellence to
challenges facing policymakers, focusing on 12 areas of critical importance to 21st
Century Ireland.

The Institute was founded in 1960 by a group of senior civil servants led by
Dr T.K. Whitaker, who identified the need for independent and in-depth research
analysis to provide a robust evidence base for policymaking in Ireland.

Since then, the Institute has remained committed to independent research and its
work is free of any expressed ideology or political position. The Institute publishes
all research reaching the appropriate academic standard, irrespective of its
findings or who funds the research.

The quality of its research output is guaranteed by a rigorous peer review process.
ESRI researchers are experts in their fields and are committed to producing work
that meets the highest academic standards and practices.

The work of the Institute is disseminated widely in books, journal articles and
reports. ESRI publications are available to download, free of charge, from its
website. Additionally, ESRI staff communicate research findings at regular
conferences and seminars.

The ESRI is a company limited by guarantee, answerable to its members and
governed by a Council, comprising 14 members who represent a cross-section of
ESRI members from academia, civil services, state agencies, businesses and civil
society. The Institute receives an annual grant-in-aid from the Department of
Public Expenditure and Reform to support the scientific and public interest
elements of the Institute’s activities; the grant accounted for an average of 30 per
cent of the Institute’s income over the lifetime of the last Research Strategy. The
remaining funding comes from research programmes supported by government
departments and agencies, public bodies and competitive research programmes.

Further information is available at www.esri.ie
THE AUTHORS
 Adele Bergin is an Associate Research Professor and Abián García-Rodríguez is a
 Research Officer at the Economic and Social Research Institute (ESRI). All members
 of the research team have adjunct research positions at Trinity College Dublin.

 ACKNOWLEDGEMENTS
 This research has been funded by the Irish Department of Housing, Local
 Government and Heritage under the collaborative research programme between
 the Department and the ESRI. We would like to thank all the individuals within the
 Department who provided assistance and advice during the project, particularly
 Eoin Corrigan, Laura Flannelly and George Hussey. Valuable contributions were
 also made by members of the Research Programme Steering Committee. Finally,
 our thanks go to Professor Kieran McQuinn (Head of Economic Analysis in the ESRI),
 Professor Alan Barrett (Director of the ESRI) and two internal ESRI referees for their
 suggestions and contributions to this report.

This report has been accepted for publication by the Institute, which does not itself take institutional
policy positions. All ESRI Research Series reports are peer reviewed prior to publication. The authors
are solely responsible for the content and the views expressed.
Foreword | i

FOREWORD

 The issue of forecasting the future demand for housing is a critical input to planning
 for a growing population. Managing the future location, typology and tenure of
 housing is a key function of each local authority and requires a robust evidence
 base and approach to implementation. More and better housing data at national,
 regional, local authority and settlement level is needed to improve our
 understanding of structural housing demand and the housing needs of people, in
 order to develop evidence-based and cost-effective policies, programmes and
 funding initiatives.

 Demand for housing is largely a function of population growth and housing
 preferences, and population growth is largely determined by economic conditions.
 Economic conditions can vary significantly within the State at any point in time but
 employment and educational opportunities tend to be the most relevant drivers
 of migration within the State.

 Heretofore projections of future housing demand tended to take account of some,
 but not all of these important inputs with varying levels of consistency in the
 methodologies employed to estimate population into the future. Ensuring that
 that projections are underpinned by the most relevant assumptions, particularly
 for the purposes of housing and planning, results in a strong evidence base from
 which responsive and effective policies can be developed, at a national, regional
 and local level.

 The Department is keen to further strengthen an evidence-based policymaking
 approach to housing and the collaboration with the ESRI on research of this nature
 marks a significant State-funded effort to incorporate all of the relevant inputs in
 a manner that provides the Department, local authorities and other State
 organisations a range of county-level scenarios for future population and housing
 demand, which can be used across a number of domains. This builds on the work
 on population forecasting as part of Project Ireland 2040 which has influenced the
 National Planning Framework (NPF) and Regional Economic and Spatial Strategies.

 This paper was guided by the Steering Committee which oversees the research
 collaboration between the Department and the Institute. The Steering Committee
 includes representatives from the Department, the Institute, the Housing Agency,
 the Residential Tenancies Board, as well as the relevant business units of the
 Department. This paper is a significant output of the research collaboration
ii | Regional demographics and structural housing demand at a county level

 between the Institute and the Department, which also looks at broader issues
 where spatial planning and housing issues intercept.

 One of the main reasons for funding this work is to provide required data input for
 the process of Housing Needs Demand Assessment (HNDA) by local authorities,
 which the local authorities will undertake in line with their obligations under
 National Planning Objective 37 of the National Planning Framework and which will
 feed into their Housing Strategies and County Development Plans. The HNDA
 process will require a range of historical and projected economic and housing
 related variables as inputs, in order to produce robust and credible estimates of
 the future housing need for dwellings and also categorises by tenure type required
 in their areas.

 The work done by the ESRI will be extremely valuable in allowing the Department
 to move forward with our work on the HNDA project in the near term and
 represents an ideal synergy between research and policy. The scenarios employed
 in the research paper include modelling a pattern of population and housing
 demand consistent with achieving the objectives of the NPF. This modelling is
 critical to our own future work on the delivery of the NPF. The use of scenarios
 built around normal migration, and high and low migration have also formed part
 of the work, along with NPF-influenced migration. We look forward to working with
 local authorities to ensure that future development patterns are well informed by
 a coherent and consistent understanding of existing patterns and likely future
 needs.

 We would like to thank the members of the Steering Committee for their input to
 this innovative modelling exercise, and in particular, the report’s authors Dr Adele
 Bergin and Dr Abián García-Rodríguez, for their dedicated work on this paper.

 Assistant Secretary Maria Graham,
 Planning Division of the Department of Housing, Local Government and Heritage

 Assistant Secretary Paul Lemass,
 Housing Policy, Legislation and Governance Division of the
 Department of Housing, Local Government and Heritage
Table of contents | iii

TABLE OF CONTENTS
EXECUTIVE SUMMARY ............................................................................................................................ V
CHAPTER 1 INTRODUCTION ................................................................................................................ 1
CHAPTER 2 REGIONAL DEMOGRAPHICS: RECENT TRENDS ................................................................. 3
 2.1 Introduction ..................................................................................................................... 3
 2.2 Overall trends .................................................................................................................. 3
 2.3 Mortality .......................................................................................................................... 5
 2.4 Fertility ............................................................................................................................. 7
 2.5 International migration.................................................................................................. 10
 2.6 Internal migration .......................................................................................................... 11

CHAPTER 3 METHODOLOGY AND ASSUMPTIONS............................................................................. 15
 3.1 Introduction ................................................................................................................... 15
 3.2 Methodology ................................................................................................................. 15
 3.3 Mortality ........................................................................................................................ 16
 3.4 Fertility ........................................................................................................................... 17
 3.5 International migration.................................................................................................. 17
 3.6 Internal migration .......................................................................................................... 18

CHAPTER 4 DEMOGRAPHIC PROJECTIONS AND SCENARIOS ............................................................ 23
 4.1 Introduction ................................................................................................................... 23
 4.2 Population projections – national.................................................................................. 23
 4.3 Population projections – regional.................................................................................. 25
 4.4 Internal migration: the 50:50 city scenario from the National Planning Framework ... 28

CHAPTER 5 HOUSING DEMAND PROJECTIONS ................................................................................. 31
 5.1 Introduction ................................................................................................................... 31
 5.2 Headship rates ............................................................................................................... 31
 5.3 Obsolescence ................................................................................................................. 33
 5.4 Housing demand at a regional level .............................................................................. 34
 5.5 Types of housing demand – a qualitative assessment .................................................. 36
 5.6 Implications of COVID-19 pandemic on projections...................................................... 39

CHAPTER 6 CONCLUSIONS ................................................................................................................ 41

REFERENCES .......................................................................................................................................... 43

APPENDIX A INTERNAL MIGRATION METHODOLOGY AND DATA ..................................................... 45

APPENDIX B ........................................................................................................................................... 49
iv | Regional demographics and structural housing demand at a county level

LIST OF TABLES
Table 2.1 Usually resident population by region ............................................................................. 4
Table 2.2 Population share by region .............................................................................................. 4
Table 2.3 Young and old dependency rate by region, 1996-2016................................................... 5
Table 2.4 Deaths per 1,000 population by region, average 2007-2016 .......................................... 7
Table 2.5 Fertility rates by county, 1996 to 2016 ............................................................................ 9
Table 2.6 Top ten net internal flows by number of people, 1996 and 2006................................. 13
Table 3.1 Estimation results: gross internal population flows ...................................................... 19
Table 3.2 County-level unemployment rates: data and projections ............................................. 20
Table 4.1 Comparison of assumptions between scenarios ........................................................... 24
Table 4.2 Population projections, annual growth rates and population shares, 2016-2040 ........ 26
Table 5.1 Headship rates by five-year age group, 1996-2016; 2016 max and min ....................... 32
Table B.1 Usually resident population by county .......................................................................... 49
Table B.2 Population projections by county, 2016-2040 .............................................................. 50
Table B.3 Structural housing demand projections by local authority, 2017-2040 ........................ 51

LIST OF FIGURES
Figure 2.1 Life expectancy at birth and at age 65............................................................................. 6
Figure 2.2 Total period fertility rate ................................................................................................. 8
Figure 2.3 Age specific fertility rates by single year of age, 2016 .................................................... 9
Figure 2.4 International migration flows and total population change ......................................... 10
Figure 2.5 International net migration distribution by county ....................................................... 11
Figure 2.6 Net internal migration and top ten Intercounty net flows ............................................ 12
Figure 2.7 Ratio of house prices in Dublin relative to the national average .................................. 14
Figure 4.1 Total population under different scenarios, 2016-2040 ............................................... 24
Figure 4.2 Population age pyramids: National 2016-2040 (population, top); Kildare and Mayo
 2040 (% of total county population, bottom) ................................................................ 27
Figure 4.3 Internal migration in 2040 under the baseline and the 50:50 city scenarios ................ 30
Figure 5.1 Obsolescence rates (%), 2011-2016 .............................................................................. 34
Figure 5.2 Structural housing demand: baseline, high and low migration scenarios, 2017-2040 . 35
Figure 5.3 Housing demand index for the baseline and 50:50 city scenarios, 2030 ...................... 36
Figure 5.4 Type of accomodation by age of household reference person, 2016 ........................... 38
Figure 5.5 Proportion of households in different types of housing units, 2016............................. 39
Executive Summary | v

EXECUTIVE SUMMARY

Regional housing demand, both now and in the future, has significant implications
for housing policy in terms of the number of housing units required, the areas they
are needed and the types of housing. This report provides estimates of structural
housing demand at a local authority level out to 2040, based on regional
demographic projections and projections for rates of household formation. These
estimates are based on a new regional demographic model that explicitly
incorporates the economic mechanisms that determine internal migration, and
projections for headship rates. Our approach is to use the cohort component
methodology to generate regional population projections. This method projects
the population at county level by gender and single year of age for each year based
on the components of population change (fertility, mortality, internal and
international migration). The analysis builds on and develops previous research in
this area, such as Morgenroth (2019).

The report examines a ‘business as usual’ scenario which is based on current trends
and medium-term projections for the Irish economy. Given the uncertainty
inherent in any projection exercise, the report examines a range of alternative
scenarios. As international migration is the key driver of population change in
Ireland, scenarios are explored that incorporate higher and lower international
migration assumptions than in the ‘business as usual’ scenario. The assumptions
underlying these scenarios draw heavily from recent trends and patterns in the
data as well as findings on how certain key determinants of population change
behave and react to the economic environment. The report also includes some
commentary on the potential effects of the COVID-19 pandemic on these
scenarios.

These types of scenarios are based on existing trends and relationships evident
from data and implicitly assume that these relationships are preserved in the
future. The report also considers a scenario, broadly consistent with the 50:50 City
scenario developed in the National Planning Framework, where population growth
is more evenly distributed between the East and Midland region and the rest of
the country and where counties with larger cities attract higher inflows, and this is
achieved by changing relative regional economic conditions. The differences
between the ‘business as usual’ scenario and the 50:50 City scenario gives an
indication of where policy interventions could be used to influence the spatial
distribution of economic activity and ultimately the population to achieve the
targets associated with the 50:50 City scenario. The population projection
scenarios are then used as a key input into estimates of structural housing demand
i.e. the amount of housing needed consistent with population growth at a regional
level and the state of broad underlying economic conditions.
v i | Regional demographics and structural housing demand at a county level

 At a national level, in the baseline scenario, the population is expected to increase
 by around 926,000 people between 2016 and 2040 resulting in a total population
 of over 5.665 million people by the end of the period. This represents significant
 population growth (average of 0.7 per cent per annum), which has clear
 implications for planning in many areas including housing. These projections are
 highly sensitive to international migration flows and in a high international
 migration scenario the total population would reach almost 6 million people by
 2040, whereas in a low international migration scenario, the population would
 stand at around 5.554 million people by 2040. The difference in population in 2040
 compared to the baseline scenario (+318,000 people in the high international
 migration scenario and -112,000 in the low international migration scenario)
 provides a credible range for the future evolution of the population and also helps
 highlight the uncertainty in this type of exercise.

 At a regional level, in the baseline scenario, the Eastern and Midlands region is
 expected to experience the fastest population growth and to capture the majority
 (55.6 per cent or 514,000 people) of the total expected population growth over the
 2016 to 2040 period. Within this region, Dublin is expected to continue have the
 highest population share, although the Mid-East region, the area surrounding
 Dublin, is likely to experience the fastest population growth. The projection results
 also suggest that the slowest growing region will continue to be the Northern and
 Western region, showing signs of an ageing population. Overall, differences in
 population growth at a county level over the projection horizon to 2040 are more
 muted compared to the 1996 to 2016 period.

 By applying county-level age-specific headship rates and incorporating expected
 housing obsolescence, we can convert the population projections into estimates
 of structural housing demand. In the baseline scenario, the level of housing
 demand is around 28,000 per annum over the medium term, although it is higher
 in the short-run given recent net international migration inflows. Housing demand
 in the high international migration scenario is close to 33,000 per annum and is
 around 26,000 per annum in the low international migration scenario. Our baseline
 scenario results suggest, relative to population shares, higher levels of housing
 demand in Dún Laoghaire-Rathdown, Cork City, Meath and Kildare and relatively
 lower levels of demand in Mayo and Fingal. A different regional pattern emerges
 in the 50:50 City scenario. More internal migration and a different distribution of
 international migration lead to higher increases in housing demand particularly in
 Limerick, but also in Cork County and Galway County, as well as to some degree in
 Galway City and Waterford. The higher increases in some local authorities come at
 the expense of lower increases in others such as Meath and Kildare whereas some
 local authorities would see lower housing demand over time including Kerry,
 Tipperary and Wexford.
Introduction | 1

CHAPTER 1
Introduction

This report provides estimates of structural housing demand at a regional level,
over the long-run, based on regional demographic projections and projections for
rates of household formation. Regional housing demand, both now and in the
future, has significant implications for housing policy in terms of the number of
housing units required, the areas they are needed and the types of housing.

The analysis is based on a new regional demographic model which incorporates a
novel treatment of internal migration, specifically where internal migration is
related to economic conditions. Our approach is to use the cohort component
methodology to generate regional population projections. This method projects
the population at county level by gender and single year of age for each year based
on the components of population change (fertility, mortality, internal and
international migration). The analysis builds on and develops previous research in
this area, such as Morgenroth (2018).

We examine a ‘business as usual’ scenario which is based on current trends and
medium-term projections for the Irish economy. Given the uncertainty inherent in
any projection exercise we also examine a range of alternative scenarios. As
international migration is the key driver of population change in Ireland, we
consider scenarios that incorporate higher and lower international migration
assumptions than in the ‘business as usual’ scenario. Additional commentary on
the potential impact of the COVID-19 pandemic on these scenarios has been
included at the end of the report.

These types of scenarios are based on existing trends and relationships evident
from data and implicitly assume that these relationships are preserved in the
future. We also consider a scenario, broadly consistent with the 50:50 City scenario
developed in the National Planning Framework, where population growth is more
evenly distributed between the Eastern and Midland region and the rest of the
country, and where counties with larger cities attract higher inflows and this is
achieved by changing relative regional economic conditions. The differences
between the ‘business as usual’ scenario and the 50:50 City scenario gives an
indication of where policy interventions could be used to influence the spatial
distribution of economic activity and ultimately the population to achieve the
targets associated with the 50:50 City scenario. The population projection
scenarios are then used as a key input into estimates of structural housing demand
2 | Regional demographics and structural housing demand at a county level

 i.e. the amount of housing needed consistent with population growth at a regional
 level and the state of broad underlying economic conditions.

 The remainder of the report is structured as follows: Chapter 2 provides an
 overview of population developments at a regional level; Chapter 3 outlines the
 methodology used in generating the demographic scenarios and describes the key
 assumptions for the drivers of population change; Chapter 4 brings together the
 assumptions and evidence base to generate a range of demographic scenarios;
 Chapter 5 draws on the analysis in the previous sections to estimate structural
 housing demand at a local authority level and Chapter 6 concludes.
Regional demographics: recent trends | 3

 CHAPTER 2
 Regional demographics: recent trends

 2.1 INTRODUCTION
 This section describes the evolution of the population at a regional level. It
 highlights trends in population growth, the spatial distribution and the age
 structure of the population. It then examines patterns in the drivers of population
 change – specifically mortality, fertility, and international and internal migration –
 in more depth. The aim is to use the patterns evident from the data to inform
 assumptions on the future development of the population, particularly for the
 ‘business as usual’ scenario.

 2.2 OVERALL TRENDS
 At a national level, Ireland has experienced extremely rapid population growth in
 recent years, both in absolute terms and relative to other countries. Over the
 20-year period 1996 to 2016, the population grew by an average of 1.3 per cent
 per annum compared to under 0.3 per cent per annum growth in the EU28. 1 This
 amounts to an increase in the population of over 1.1 million between 1996 and
 2016. This strong population growth has not been evenly dispersed around the
 country. Table 2.1 shows the population at various intervals over the 1996 to 2016
 period at a NUTS 3 level 2 and Appendix Table B.1 shows the data at a county level.
 The table shows that, over the 1996 to 2016 period, the Mid-East region
 experienced the highest population growth, averaging 2.2 per cent per annum,
 with Meath and Kildare recording the highest population growth in the region.
 Over the same period, the Mid-West had the lowest population growth, averaging
 just 0.9 per cent per annum, with Limerick and Tipperary experiencing the lowest
 population growth in the region. There is also substantial variation in population
 growth within regions, with counties such as Kerry, Mayo and Sligo having
 relatively lower population growth and counties such as Kildare, Meath and Laois
 experiencing relatively higher population growth.

1 Population growth slowed between 2011 and 2016 at an aggregate level, in the aftermath of the Great Recession, with
 particularly low growth recorded in the Border, West and Mid-West regions.
2 The regions in the table and throughout the report are based on the latest Nomenclature of Territorial Units for
 Statistics (NUTS) classification. The allocation of counties to their NUTS 3 regions is as follows: Dublin: county Dublin;
 Mid-East: Kildare, Louth, Meath and Wicklow; Midlands: Laois, Longford, Offaly and Westmeath; Border: Cavan,
 Donegal, Leitrim, Monaghan and Sligo; West: Galway, Mayo and Roscommon; Mid-West: Clare, Limerick and Tipperary;
 South-East: Carlow, Kilkenny, Waterford and Wexford; South-West: counties Cork and Kerry.
4 | Regional demographics and structural housing demand at a county level

TABLE 2.1 USUALLY RESIDENT POPULATION BY REGION

 Annual Growth,
 Population (‘000)
 1996-2016
 1996 2002 2006 2011 2016 %
 State 3,626.1 3,917.2 4,232.9 4,574.9 4,739.6 1.3
 Eastern and Midland 1,703.4 1,862.6 2,022.2 2,203.0 2,318.2 1.6
 Dublin 1,058.3 1,122.8 1,185.2 1,269.3 1,341.4 1.2
 Mid-East 439.6 514.4 585.7 652.1 685.8 2.2
 Midlands 205.5 225.4 251.3 281.6 291.0 1.8
 Northern and Western 667.5 711.0 770.1 834.9 843.7 1.2
 Border 315.1 330.7 356.5 390.9 392.6 1.1
 West 352.4 380.3 413.6 444.1 451.1 1.2
 Southern 1,255.2 1,343.6 1,440.6 1,537.0 1,577.6 1.1
 Mid-West 392.6 418.7 443.5 466.4 471.2 0.9
 South-East 316.0 344.5 377.0 408.0 418.9 1.4
 South-West 546.6 580.4 620.1 662.6 687.5 1.2

Source: CSO, Census, various issues.

 The population is also unevenly distributed across regions (Table 2.2) and changes
 in population shares over time have been somewhat limited. The Eastern and
 Midland region had just under 49 per cent of the population in 2016, an increase
 of almost two percentage points over its 1996 share. Although Dublin dominates
 in terms of its population share, its share has fallen slightly over time while the
 population share of the Mid-East has risen by just under 2.5 percentage points
 between 1996 and 2016. Overall, the population share in the broader Northern
 and Western and Southern regions has fallen slightly with the exception of the
 South-East region where the population share has shown a marginal increase over
 time.

TABLE 2.2 POPULATION SHARE BY REGION

 Population (share in each region)
 1996 % 2002 % 2006 % 2011 % 2016 %
 State 100.0 100.0 100.0 100.0 100.0
 Eastern and Midland 47.0 47.5 47.8 48.2 48.9
 Dublin 29.2 28.7 28.0 27.7 28.3
 Mid-East 12.1 13.1 13.8 14.3 14.5
 Midlands 5.7 5.8 5.9 6.2 6.1
 Northern and Western 18.4 18.2 18.2 18.3 17.8
 Border 8.7 8.4 8.4 8.5 8.3
 West 9.7 9.7 9.8 9.7 9.5
 Southern 34.6 34.3 34.0 33.6 33.3
 Mid-West 10.8 10.7 10.5 10.2 9.9
 South-East 8.7 8.8 8.9 8.9 8.8
 South-West 15.1 14.8 14.6 14.5 14.5

Source: CSO, Census, various issues.
Regional demographics: recent trends | 5

 There are also differences in the age structure of the population at a regional level.
 Table 2.3 shows young-age and old-age dependency rates by region.3 At a national
 level the old-age dependency rate has increased from 17.6 to 20.4 between 1996
 and 2016, while the young-age dependency rate has fallen from 36.5 to 32.3 over
 the same period. In terms of regional differences, in 2016 the Northern and
 Western region had the highest old-age dependency rate, in particular the Border
 region, whereas Dublin and surrounding areas have the lowest. In the case of
 young-age dependency, the Mid-East and the Midlands regions registered the
 highest rates in 2016, with Dublin recording the lowest rate.

TABLE 2.3 YOUNG AND OLD DEPENDENCY RATE BY REGION, 1996-2016

 Old-Age Dependency Rate Young-Age Dependency Rate
 1996 2006 2016 1996 2006 2016
 State 17.6 16.1 20.4 36.5 29.7 32.3
 Eastern and Midland 15.0 14.1 18.0 35.0 28.7 31.6
 Dublin 14.6 14.5 17.9 32.3 25.7 28.2
 Mid-East 14.2 12.4 17.3 39.2 32.9 36.8
 Midlands 19.5 16.5 20.0 40.3 33.5 36.3
 Northern and Western 22.5 19.0 23.9 39.6 31.4 33.6
 Border 22.6 19.5 24.3 40.7 33.0 35.1
 West 22.5 18.7 23.6 38.6 29.9 32.4
 Southern 18.6 17.4 22.4 37.2 30.4 32.6
 Mid-West 18.8 17.4 22.8 37.6 30.5 32.6
 South-East 18.3 17.3 22.6 38.1 32.1 34.1
 South-West 18.8 17.5 22.0 36.3 29.4 31.7

Source: CSO, Census, various issues.

 2.3 MORTALITY
 Over the course of the twentieth century and into this century, the Irish population
 has experienced significant improvements in mortality. 4 A measure related to
 mortality is the period expectation of life at birth, which is the average number of
 years a new-born would live for, based on prevailing mortality rates for that
 year. This is shown for males and females in Figure 2.1. The graph shows strong
 improvements in mortality for both males and females over, broadly, the first
 60 years of the twentieth century and then continued improvement, albeit at a
 diminished pace from the 1960s to today. The graph also reveals gender

3 The young-age dependency ratio is the ratio of the number of young people at an age when they are normally
 economically inactive (under 15 years old) compared to the working age population (those aged 15 to 64), while the
 old-age dependency ratio refers to those the number of older people at an age when they are generally economically
 inactive (over 65 years old) compared to the working age population.
4 Assumptions on mortality rates (by age and gender and year) are used in developing the population projections. These
 assumptions are also used to calculate summary measures of the mortality level of a population, such as life expectancy
 at birth.
6 | Regional demographics and structural housing demand at a county level

 differences in life expectancy, although this gap has narrowed somewhat in more
 recent years. In 2015, male life expectancy at birth was 79.3 years while the
 comparable figure for females was 83.3 years. Although the data show
 improvements in life expectancy over time, the data for the most recent years
 reveal a slight slowdown in the rate of improvement.

 Changes in life expectancy over time are driven by complex interactions of
 economic, social, institutional and health factors and it is difficult to unpick the role
 of each in shaping changes in mortality. Much of the initial improvement in
 mortality in the first half of the twentieth century is attributable to improvements
 in infant and child mortality rates to low levels by the end of the 1950s (CSO, 2013).
 This means that further improvements in infant and child mortality have only a
 limited impact on the expectation of life at birth. The rate of improvement in
 mortality from the 1960s to 1980s was at a slower pace and increases in the
 incidence of deaths of people of working age from most forms of cancer and
 ischaemic heart disease are considered to be the main contributing factors to this
 pattern (CSO, 2013). From the 1990s, mortality rates began to decrease more
 rapidly with improvements in all age groups, especially for those in older age
 groups (see period life expectancy at age 65 in Figure 2.1) most likely attributable
 to advances in medical care, rising incomes and lifestyle factors (CSO, 2013).

FIGURE 2.1 LIFE EXPECTANCY AT BIRTH AND AT AGE 65

 90 25

 80
 Period Life Expectancy at Age 65 (years)
 Period Life Expectancy at Birth (years)

 70 20

 60
 15
 50

 40
 10
 30

 20 5
 10

 0 0

 Male Birth (left axis) Female Birth (left axis)
 Male 65 years (right axis) Female 65 years (right axis)

Source: CSO, Life Tables.
Regional demographics: recent trends | 7

 Other research has shown that there are some differences in mortality rates
 associated with certain characteristics. For example, people living in affluent areas,
 those in higher social classes, married persons, those with higher levels of
 education and owner occupiers all tend to have lower mortality rates (CSO, 2019a).
 Therefore, we might also expect mortality rates to differ at a county level. However
 this level of disaggregated data is not available. Despite this, we would still expect
 to see differences in mortality (i.e. the number of deaths) across counties
 depending on the age distribution within counties. Table 2.4 shows the number of
 deaths per thousand of population at a national level and across the NUTS3 regions
 broken down by age group. The data show that the number of deaths increases
 with age (except for the youngest age cohort) and that the number of deaths
 essentially increases exponentially with age for the older age groups. The Table
 also reveals some differences across regions with fewer (more) deaths per
 thousand population than the national average in the Mid-East (Mid-West).

TABLE 2.4 DEATHS PER 1,000 POPULATION BY REGION, AVERAGE 2007-2016

 All 0-4 5-14 15-24 25-34 35-44 45-54 55-64 65-74 75-84 85+
 ages years years years years years years years years years years
State 6.3 0.8 0.1 0.4 0.6 1.0 2.5 6.3 16.4 49.8 157.3
Mid-East 4.7 0.8 0.1 0.4 0.5 0.8 2.1 5.7 15.5 50.0 149.8
Dublin 5.9 0.8 0.1 0.3 0.5 1.1 2.7 6.6 16.5 47.6 151.1
Midlands 6.2 0.8 0.1 0.4 0.6 0.9 2.2 5.9 15.8 50.8 168.8
South-East 6.8 0.9 0.1 0.5 0.7 1.1 2.5 6.2 16.5 50.7 158.8
South-West 6.8 0.9 0.1 0.5 0.6 1.1 2.6 6.2 16.7 50.7 160.2
Border 6.9 0.8 0.1 0.4 0.6 1.0 2.3 6.2 16.1 49.8 157.6
West 7.0 0.8 0.1 0.4 0.6 1.0 2.4 6.1 15.8 49.1 153.4
Mid-West 7.3 1.1 0.1 0.5 0.7 1.1 2.6 6.7 18.1 53.9 174.1

Source: CSO, Vital Statistics.

 2.4 FERTILITY
 The total fertility rate (a measure of the number of children that a representative
 woman will have over her lifetime) 5 at a national level declined significantly from
 the early 1980s from over 3 to just under 2 by the mid-1990s and has remained
 broadly stable since then (see Figure 2.2). 6 The data also show differences in
 fertility rates at a regional level. For example, Dublin generally has the lowest
 fertility rate over time and the gap between the rate in Dublin and the national
 average shows no sign of converging over time.

5 Specifically, the total period fertility rate represents the theoretical average number of children who would be born
 alive to a woman during her lifetime if she were to pass through her child bearing years (ages 15-49) conforming to the
 age specific rates of a given year. The rate refers to a theoretical female cohort.
6 This is below the replacement level (the level of fertility at which a population exactly replaces itself from one
 generation to the next) of 2.1 children per woman.
8 | Regional demographics and structural housing demand at a county level

FIGURE 2.2 TOTAL PERIOD FERTILITY RATE

 4.5

 4

 3.5

 3

 2.5

 2

 1.5

 1

 0.5

 0
 1980 1982 1984 1986 1988 1990 1992 1994 1996 1998 2000 2002 2004 2006 2008 2010 2012 2014 2016

 National Dublin Max

Source: CSO, Vital Statistics.

 Table 2.5 shows county-level fertility rates over time. The table shows there is a lot
 of variation in fertility rates across counties. For example, in 2016 while the
 national total fertility rate was 1.81, the range was from 1.64 in Dublin to 2.28 in
 Longford. The tables reveal that these differences in fertility rates across counties
 persist over time so that individual counties tend to consistently have either high
 or low fertility rates.

 There are also differences in fertility by age of women. Figure 2.3 shows the
 prevailing age-specific fertility rates by year of age for women. The age-specific
 fertility rate measures the annual number of births to women of a specified age
 per 1,000 women of that age. The graph indicates that fertility rates increase
 steadily with age and they peak between ages 31-35 before falling sharply for
 women beyond this age group.
Regional demographics: recent trends | 9

 TABLE 2.5 FERTILITY RATES BY COUNTY, 1996 TO 2016

 1996 1997 1998 1999 2000 2001 2002 2003 2004 2005 2006 2007 2008 2009 2010 2011 2012 2013 2014 2015 2016
Dublin 1.71 1.75 1.78 1.76 1.74 1.78 1.77 1.81 1.77 1.72 1.73 1.82 1.83 1.84 1.89 1.90 1.90 1.84 1.76 1.69 1.64
Kerry 1.90 1.96 1.91 1.84 1.84 1.88 1.95 1.84 1.90 1.81 1.93 2.05 2.00 2.10 1.87 2.01 1.93 1.84 1.78 1.75 1.81
Monaghan 1.96 1.88 1.91 1.96 1.77 1.71 1.86 1.81 1.75 1.87 1.80 1.95 2.03 1.94 2.03 2.01 2.00 2.03 1.94 1.96 1.93
Kilkenny 1.86 1.93 1.92 1.83 1.91 1.99 1.97 1.96 1.90 1.85 1.87 1.94 2.07 2.04 2.08 2.03 2.02 1.94 1.91 1.78 1.72
Sligo 1.94 1.92 2.02 1.84 1.84 1.88 1.82 1.85 1.81 1.72 2.01 2.04 2.08 2.12 1.99 2.01 2.21 2.04 1.87 1.84 1.83
Cork 1.89 1.94 1.99 1.83 1.85 1.88 1.95 1.90 1.90 1.88 1.96 2.01 2.07 2.10 2.08 2.02 1.99 1.95 1.87 1.88 1.75
Galway 1.89 2.01 2.07 2.02 2.03 2.10 1.96 1.94 1.93 1.87 1.86 1.96 2.07 1.96 2.01 1.96 2.01 1.96 1.85 1.81 1.83
Donegal 2.05 2.11 2.05 2.10 1.95 2.03 2.00 2.02 1.89 1.91 1.95 1.98 2.00 2.07 1.94 1.96 1.97 1.87 1.78 1.91 1.93
Limerick 2.05 2.08 2.06 1.93 1.87 1.81 1.87 1.95 1.86 1.81 1.94 2.04 2.11 2.16 2.13 2.09 2.00 1.97 1.94 1.97 1.89
Roscommon 1.82 1.90 1.93 1.77 1.68 1.82 1.95 1.89 1.98 2.06 2.01 2.04 2.27 2.27 2.28 2.02 2.10 2.21 1.99 1.92 1.93
Louth 1.88 1.99 2.03 2.05 2.10 2.30 2.06 1.92 1.92 1.83 1.97 1.93 2.04 1.94 2.00 1.99 2.09 2.24 1.98 2.05 1.99
Waterford 1.99 1.94 1.90 1.92 1.93 2.09 2.21 2.09 2.06 1.97 2.18 2.18 2.27 2.15 2.14 2.15 2.04 2.09 2.06 1.99 1.97
Offaly 2.10 2.07 2.22 1.98 1.85 2.13 2.23 2.08 2.12 2.02 2.09 2.09 2.14 2.15 2.06 2.23 2.09 1.98 2.18 1.94 1.98
Mayo 2.11 2.12 2.15 2.09 2.09 2.09 2.01 2.00 1.93 2.00 2.10 2.25 2.21 2.10 2.15 2.13 2.17 2.19 2.06 1.99 2.02
Tipperary 2.09 2.15 1.94 1.99 2.02 1.98 1.97 2.04 2.04 2.11 2.04 2.26 2.26 2.34 2.22 2.17 2.04 2.14 2.04 2.09 2.05
Wicklow 2.01 1.96 2.00 2.03 2.02 2.03 2.16 2.07 2.09 1.92 2.21 2.28 2.32 2.30 2.35 2.18 2.19 2.13 2.05 2.02 1.96
Clare 2.01 2.16 2.08 2.27 2.08 2.19 2.34 2.26 2.16 2.10 2.16 2.15 2.18 2.28 2.03 2.08 2.08 1.89 1.88 2.03 1.96
Laois 2.00 2.07 2.10 2.06 2.04 2.15 2.26 2.30 2.30 2.04 2.11 2.37 2.42 2.50 2.50 2.12 2.03 1.94 1.95 1.96 1.84
Westmeath 2.13 2.14 2.11 2.26 2.29 2.33 2.19 2.17 2.14 2.10 2.22 2.13 2.16 2.17 2.16 2.11 2.11 2.14 2.15 2.00 2.03
Kildare 2.09 2.14 2.18 2.07 2.27 2.31 2.34 2.23 2.20 2.00 2.16 2.31 2.29 2.32 2.29 2.16 2.11 2.02 2.02 1.97 1.93
Leitrim 2.09 2.05 2.10 2.20 2.02 1.92 2.29 2.26 2.25 2.21 2.17 2.45 2.50 2.38 2.27 2.15 2.15 2.23 2.00 2.11 2.17
Meath 1.98 2.05 1.99 2.04 2.09 2.35 2.20 2.33 2.28 2.22 2.16 2.41 2.39 2.35 2.39 2.33 2.14 2.21 2.08 1.99 1.99
Wexford 2.10 2.16 2.19 2.24 2.09 2.21 2.21 2.34 2.27 2.20 2.26 2.29 2.44 2.29 2.18 2.20 2.17 2.05 2.13 2.05 1.95
Carlow 2.06 1.84 2.16 1.98 2.22 2.24 2.40 2.33 2.14 2.16 2.21 2.47 2.59 2.36 2.35 2.38 2.30 2.09 2.32 2.02 1.90
Cavan 2.18 2.44 2.21 2.34 2.10 2.14 2.19 2.09 2.16 2.14 2.29 2.33 2.60 2.52 2.49 2.38 2.29 2.22 2.08 2.09 2.12
Longford 2.26 2.27 2.31 2.20 2.20 2.35 2.73 2.50 2.24 2.24 2.42 2.38 2.78 2.77 2.58 2.31 2.33 2.32 2.16 2.23 2.28

 Sources: CSO and Department of Health.

 FIGURE 2.3 AGE SPECIFIC FERTILITY RATES BY SINGLE YEAR OF AGE, 2016

 140

 120

 100

 80

 60

 40

 20

 0
 >= 45 years
 16 years
 17 years
 18 years
 19 years
 20 years
 21 years
 22 years
 23 years
 24 years
 25 years
 26 years
 27 years
 28 years
 29 years
 30 years
 31 years
 32 years
 33 years
 34 years
 35 years
 36 years
 37 years
 38 years
 39 years
 40 years
 41 years
 42 years
 43 years
 44 years
10 | Regional demographics and structural housing demand at a county level

 2.5 INTERNATIONAL MIGRATION
 International migration has long been the key driver of population change in
 Ireland. These flows in and out of Ireland tend to be very volatile and are highly
 sensitive to economic conditions both domestically and internationally (in the
 source countries for immigrants or the destination countries for emigrants).7
 Figure 2.4 shows these flows in recent years. The graph highlights the close
 relationship between net migration and population change. It also demonstrates
 the variability in migration flows from one year to the next. In the second half of
 the 1990s, strong economic growth and a tight labour market encouraged net
 inflows into the country and these net inflows accelerated and were particularly
 strong following the enlargement of the EU in 2004. The Great Recession led to a
 sharp reversal of the trend in net immigration and Ireland experienced net
 outflows from 2010 to 2014. Following the economic recovery, net inflows
 re-emerged in 2015 and have been increasing in more recent years.

FIGURE 2.4 INTERNATIONAL MIGRATION FLOWS AND TOTAL POPULATION CHANGE

 175

 150

 125

 100
 Thousands

 75

 50

 25

 0

 -25

 -50
 1987 1989 1991 1993 1995 1997 1999 2001 2003 2005 2007 2009 2011 2013 2015 2017 2019

 Immigrants Emigrants Net migration Population change

Source: CSO, Population and Migration Estimates.

 Figure 2.5 shows the spatial distribution of international migrants. The spatial
 distribution of international migrants has remained broadly stable and is highly
 concentrated in certain counties. Five counties comprise the destination for over

7 See, for example, Barrett et al. (2002).
Regional demographics: recent trends | 11

 two-thirds of international migrants with Dublin attracting just under 44 per cent
 of international migrants. In terms of the age distribution of migrants, most are of
 prime working age with around 47 per cent between the ages of 20 and 30 and a
 further 27 per cent between the ages of 31 and 45.

FIGURE 2.5 INTERNATIONAL NET MIGRATION DISTRIBUTION BY COUNTY

 Dublin 43.6%
 Cork 10.9%
 Galway 5.8%
 Kildare 3.7%
 Limerick 3.3%
 Donegal 2.8%
 Meath 2.6%
 Wicklow 2.3%
 Kerry 2.3%
 Mayo 2.1%
 Tipperary 2.0%
 Louth 2.0%
 Clare 1.8%
 Waterford 1.8%
 Wexford 1.8%
 Westmeath 1.7%
 Kilkenny 1.3%
 Cavan 1.2%
 Monaghan 1.1%
 Sligo 1.1%
 Laoighis 0.9%
 Roscommon 0.9%
 Offaly 0.8%
 Carlow 0.8%
 Longford 0.7%
 Leitrim 0.5%

Source: CSO, Census data.
Note: The table shows the average of the 2011 and 2016 county distributions.

 2.6 INTERNAL MIGRATION
 The remaining element that determines regional demographics is internal
 migration. Understanding the determinants of internal migration for a country like
 Ireland is crucial especially given the instability in the pattern of population flows
 between regions in the last 30 years (see, for example, CSO, 2019b). We can
 observe the evolution of intercounty population movements using Census data. As
 the Census asks respondents for current residence and residence one year
 previously, we can track how many people moved from one county to another in
 a given year. This reveals two very different internal migration patterns for the
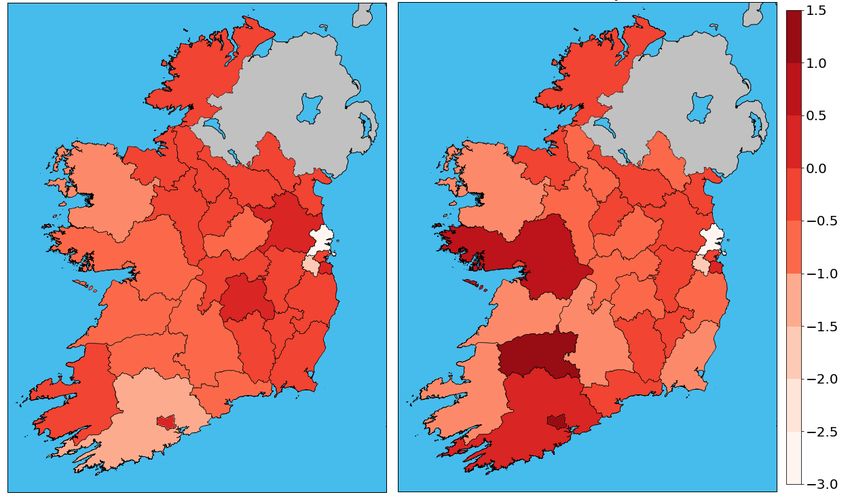
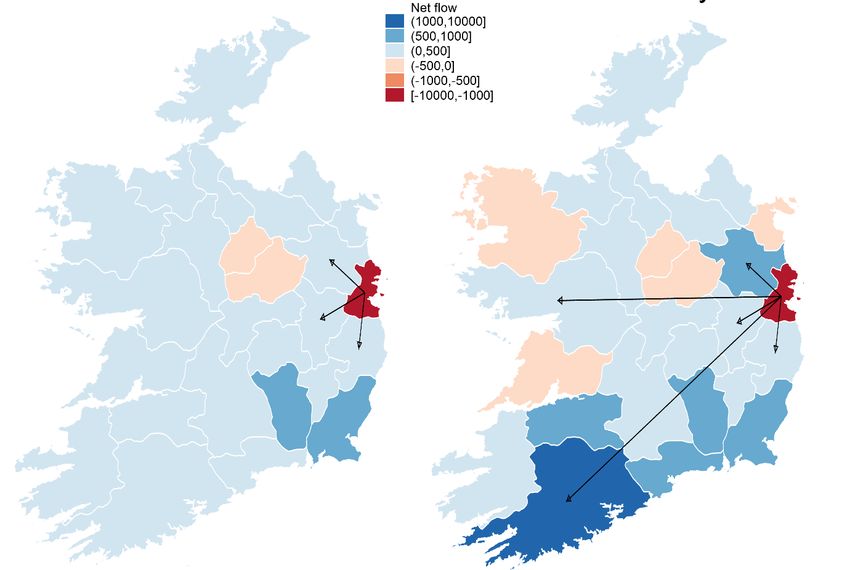
12 | Regional demographics and structural housing demand at a county level

 Census years of 1991, 1996 and 2011 compared to the Census years 2002, 2006
 and 2016.

 Figure 2.6 shows the patterns observed in the years 1996 and 2006, which provide
 illustrative examples of the two different internal migration patterns for those
 years, where the counties in the figure are shaded by the sign and magnitude of
 net internal migration registered for that year. Counties shaded in blue had
 positive internal migration for that year, receiving more population from other
 counties than the population that left to reside in another county while the
 opposite holds for the counties shaded in red. In addition, the map shows the top
 ten net internal migration flows for the two years, indicated by the arrows on the
 map and presented in Table 2.6, and the difference between the two patterns is
 stark. In 1996, the major net gainers were the main cities and the Greater Dublin
 Area. The largest internal migration flows were from the main population centres
 to Dublin and from Dublin to the counties contiguous to Dublin. In contrast, in 2006
 Dublin registered significant net internal outflows, with more than 10,000 people
 leaving to reside in some other county than people moving to Dublin from other
 counties. The top ten net flows are flows out of Dublin, with the population moving
 to counties which are either contiguous to Dublin or are connected to Dublin via
 motorway.

FIGURE 2.6 NET INTERNAL MIGRATION AND TOP TEN INTERCOUNTY NET FLOWS
 1996 2006

Source: Authors’ calculations based on CSO, Census data.
Regional demographics: recent trends | 13

TABLE 2.6 TOP TEN NET INTERNAL FLOWS BY NUMBER OF PEOPLE, 1996 AND 2006

 1996 2006
 Dublin to Kildare 1,127 Dublin to Meath 3,534
 Dublin to Meath 758 Dublin to Kildare 2,301
 Cork to Dublin 696 Dublin to Wicklow 1,718
 Dublin to Wicklow 401 Dublin to Wexford 788
 Limerick to Dublin 367 Dublin to Laois 695
 Kilkenny to Dublin 302 Wicklow to Wexford 475
 Galway to Dublin 281 Dublin to Cavan 470
 Tipperary to Dublin 261 Dublin to Louth 450
 Wexford to Dublin 246 Kildare to Laois 406
 Mayo to Galway 231 Meath to Cavan 394

Source: Authors’ calculations based on CSO, Census data.

 The analysis of the flow patterns demonstrates that movements in and out of
 Dublin are the key element in determining the overall internal migration scenario.
 In turn, these movements are consistent with regional economic developments
 such as the evolution of the housing market in Dublin compared to the rest of the
 country. Figure 2.7 shows the ratio of new house prices in Dublin relative to the
 national average, with the years preceding the censuses highlighted in blue when
 Dublin was a net gainer of internal migration and red when it was a net loser. The
 graph shows this ratio is lower (more moderate house prices in Dublin relative to
 the national average) in the years where Dublin is a net gainer of internal migration
 (1991, 1996 and 2011), whereas the ratio is higher (much higher house prices in
 Dublin relative to the national average) in the years where Dublin experiences
 greater population outflows (2002, 2006 and 2016). As expected, the population
 reacts to underlying economic conditions, such as house prices in this case,
 creating the observed internal migration flows.
14 | Regional demographics and structural housing demand at a county level

FIGURE 2.7 RATIO OF HOUSE PRICES IN DUBLIN RELATIVE TO THE NATIONAL AVERAGE

 1.40

 1.35

 1.30

 1.25

 1.20

 1.15

 1.10

 1.05

 1.00
 1990
 1991
 1992
 1993
 1994
 1995
 1996
 1997
 1998
 1999
 2000
 2001
 2002
 2003
 2004
 2005
 2006
 2007
 2008
 2009
 2010
 2011
 2012
 2013
 2014
 2015
 2016
Source: Department of Housing, Local Government and Heritage.
Methodology and assumptions | 15

CHAPTER 3
Methodology and assumptions

3.1 INTRODUCTION
This section provides an overview of the cohort-component methodology which is
the broad framework used to generate the population projections and scenarios.
It then outlines the key assumptions on mortality, fertility and migration that are
needed to generate demographic projections. The existing trends outlined in the
previous section are used to inform these assumptions. This section also describes
the methodology and results for the new model of internal migration that has been
incorporated into the regional demographic model. Together with projections for
the underlying economic conditions at county level, this produces an estimate of
the future pattern of internal migration in Ireland, providing closure to our
demographic model.

3.2 METHODOLOGY
We use the cohort-component method, the most widely used methodology, to
produce population projections. This method follows two simple equations to
generate the population aged i for county j at time t:

 , −1 −1, , ,
 = �1 − −1 � ∗ −1 + + , for i > 0

 0, 0, 0,
 = + +

 ,
The first equation shows the population aged i in county j, , in a given year is
simply the surviving population (1 − −1
 −1
 ), where −1
 −1
 is the age-specific mortality
 −1,
rate, that was one year younger the previous year ( −1 ) plus net international
( , ) and internal migration ( , ) of the population aged i. The second
equation is for the population aged less than 1, so instead of the surviving
population it uses the number of births in the county . To produce population
projections with this method we need assumptions for mortality rates, births and
international and internal migration.

We have developed this standard methodology in an innovative way. For internal
migration, instead of simply assuming a particular behaviour/pattern for internal
migration, we estimate the determinants of internal migration in Ireland and
incorporate these results into our regional demographic model. We use regression
analysis based on historical data to determine the intensity of the relationship
between internal migration and different determinants like economic conditions
and house prices, which we then combine with projections of these determinants
to create a projection of internal migration. This improves population projections
16 | Regional demographics and structural housing demand at a county level

 in two ways. Firstly, we do not have to arbitrarily choose which of the two internal
 migration patterns described in Section 2.6 is more likely to happen in the future.
 Instead, we create baseline projections for the underlying economic conditions at
 county level consistent with broad national macroeconomic projections (Bergin et
 al., 2016) 8 and then let these determinants shape the future pattern of internal
 migration. Second, by making internal migration a function of economic
 conditions, we can generate alternative scenarios where economic conditions
 change and see how the new pattern of internal migration, and therefore
 population at a regional level, evolves. As mentioned earlier, the fact that
 economic conditions can be influenced by policy interventions, allows for the
 opportunity to model the effects of policy on the distribution of population in
 Ireland.

 This element is vitally important for multi-regional demographic models as it works
 as a balancing element within the model, with internal migration able to respond
 to changes in underlying economic conditions. As such, policy interventions aimed
 at altering the regional distribution of population would operate through the
 internal migration channel, by changing underlying economic conditions to make
 a region relatively more attractive through, for example, higher employment or
 lower house prices.

 3.3 MORTALITY
 Given the historical trends in life expectancy described in Section 2.3, it is expected
 that there will be continued improvements over the projection horizon. We follow
 the mortality assumptions of the recent CSOs national and regional projections
 (see CSO, 2018 and CSO, 2019b). Essentially an age and gender specific profile of
 mortality rates is developed for the projection horizon and these rates are applied
 at a county level. This means that any variation in mortality at a county level will
 be driven by differences in the age structure of that county. A ‘targeting’ method
 is adopted whereby it is assumed that short-term rates of improvement in
 mortality (at each age and for both genders) will slowly converge to common
 long-term rates of improvement (at each age and for both genders) by the target
 year (assumed to be the 25th year of the projections). 9 Mortality rates for males
 and females up to the age of 90 are assumed to improve at 2.5 per cent and 2.0
 per cent per annum respectively. These short-term rates of improvement are
 assumed to decline linearly over a 25-year period to a long-term rate of 1.5 per
 cent per annum for both males and females. It was assumed that there would be
 no mortality improvements at age 100 years and upwards. For those aged between

8 The medium-term projections contained in the Economic Outlook were developed using the ESRI macro-econometric
 model of the Irish Economy, COSMO. See Bergin et al. (2017) for a full description of the mechanisms and behaviour
 of the model. More recent short-term data and projections from the Autumn 2019 Quarterly Economic Commentary
 (McQuinn et al., 2019) have been incorporated into the projections.
9 See Whelan (2008) for a complete discussion of the methodology.
Methodology and assumptions | 17

 90 and 100, the annual rate of improvement is generated by interpolating between
 the assumed rate of improvement at 90 years and 100 years. This implies a
 projected increase in life expectancy at birth for males from 79.3 years in 2015 to
 84.3 years in 2041 and for females from 83.3 in 2015 to 87.1 years in 2041. 10

 3.4 FERTILITY
 Based on the trends described in Section 2.4, the overall total fertility rate (TFR) is
 assumed to decrease from 1.8 in 2016 to 1.6 in 2031 and remain constant
 thereafter. This profile matches the ‘low variant’ or F2 assumption used by the CSO
 (see CSO, 2018 and CSO, 2019b) in their population projections. Starting with
 county-level TFRs, the reduction in the overall TFR is applied proportionally to all
 counties. This ensures the national pattern shown in Table 2.4 is maintained over
 the projection horizon (i.e. counties that historically have had higher TFRs will
 continue to have comparatively higher TFRs over the projection horizon and vice
 versa). In a similar way, age specific fertility rates are adjusted proportionally with
 the headline decline of the overall TFR and applied to each county so that the ASFRs
 add up to their projected TFR. 11

 3.5 INTERNATIONAL MIGRATION
 Given the volatility associated with international migration flows and the inherent
 uncertainty associated with projections of international migration, we include
 three different sets of assumptions. The impact of the different assumptions on
 the projected population profile and age structure will also highlight the sensitivity
 of population projections to changes in the flows of international migrants. All
 three scenarios start in 2020 and incorporate the most recent CSO estimates (CSO,
 2019c) 12 of international migration. The three sets of assumptions are:

 • Baseline/‘business as usual’: net international migration declines linearly from
 +33,700 in 2019 to +15,000 by 2024 and remains constant thereafter. The
 medium-term figure is based on projections from the Economic Outlook (see
 Bergin et al., 2016) and is consistent with expected economic conditions in
 Ireland and abroad. 13

10 In comparison with the mortality projections used in previous analysis such as CSO (2013) and Morgenroth (2018),
 these projections represent a slowdown in the rate of improvement of mortality rates. The previous projections were
 generated after the 2011 Census and assumed life expectancy at birth to be 86.5 years for males and 88.2 years for
 females by the year 2041.
11 With data by single year of age, the TFR is simply the sum of all age-specific fertility rates (ASFR).
12 The latest CSO estimates of net international migration for 2017, 2018 and 2019 are +19,800, +34,000 and +33,700
 respectively.
13 In COSMO, migration is determined by the relative attractiveness of Ireland to alternative labour markets. For example,
 if the returns to working in Ireland disimprove relative to those abroad (lower relative real after-tax earnings in Ireland),
 there will be a tendency for outflows to occur. Similarly, poorer employment opportunities in Ireland relative to abroad
 (higher relative unemployment rate in Ireland) will also lead to outflows. The level of migration implied by projections
 from COSMO is fed into the demographic model.
You can also read