New Zealand Petroleum Supply Security 2017 Update - MBIE
←
→
Page content transcription
If your browser does not render page correctly, please read the page content below
New Zealand Petroleum Supply Security
2017 Update

Prepared for Ministry of Business, Innovation & Employment

September 2017
Hale & Twomey Limited is an energy consultancy specialising in strategic issues affecting the
energy sector. With a comprehensive knowledge of local and international energy markets, we
provide strategic advice, comprehensive analysis and services across the entire sector.

Hale & Twomey prides itself on being able to analyse and interpret the detail, then translate the
implications into strategic directions for our clients. We provide expertise to a broad range of
companies and government departments. Hale & Twomey has established a strong reputation in
the sector by producing timely, high quality, value-adding work.

Authorship

This document was written by:

Ian Twomey                Phone: +64 4 471 1109, e-mail: ian@haletwomey.co.nz
Steve West                Phone: +64 4 471 1153, e-mail: steve@haletwomey.co.nz

Please phone or e-mail for further information.

Disclaimer

Hale & Twomey Limited, its contributors and employees shall not be liable for any loss or damage
sustained by any person relying on this report, whatever the cause of such loss or damage.

                                 P +64 4 471 1155 F +64 4 471 1158
   Level 14, Terrace Conference Centre, 114 The Terrace, PO Box 10 444, Wellington 6143, New Zealand

                                       www.haletwomey.co.nz
Executive Summary
Petroleum is essential to the operation of modern economies so ensuring petroleum supply chains
are secure and robust is of concern for governments and authorities. This applies both to global
supply chains providing crude and product, along with the domestic infrastructure and its
resilience to disruption. This report updates earlier reports on oil security (in 2005 and 2012) for
the Ministry of Business, Innovation and Employment (MBIE). It assesses the resilience of the New
Zealand petroleum supply chain in the context of supply and demand changes through to 2021,
and updated information on risks, particularly recent studies relating to tsunami risks.

The scenarios analysed are the same as in earlier reports with the addition of a multiple terminal
disruption. These are:

1.   International disruption (major international event that disrupts 10% of crude oil supply for
     around six months)

2.   Major (long term) disruption to the refinery at Marsden Point

3.   Short term (three week) disruption to the refinery at Marsden Point

4.   Major (long term) disruption to RAP/Wiri terminal

5.   Short term (three week) disruption to RAP/Wiri terminal

6.   Major disruption at Wellington

7.   Major disruption at Lyttelton (Christchurch)

8.   Multiple port disruption

The likelihood of major disruption for each scenario either has a similar risk of occurring as
assessed in 2012 or increased risk due to a higher tsunami risk. Updated information from recent
global earthquake/tsunami events has led to a reassessment that these events could be larger
than previously assumed, albeit these large scale events are likely to be rare (the significant
events are modelled on a 1 in 500 year or 1 in 2,500 year return period). The table shows the
updated probabilities of each scenario occurring (on an annual basis) along with the level assumed
in 2012.

Change in disruption probabilities

 2012               Scen. 1      Scen. 2     Scen. 3      Scen. 4      Scen. 5      Scen. 6      Scen. 7      Scen. 8
                    Interntal.   Long term   Short term   Long term    Short term   Long term    Long term    Multiple
                    disruption   refinery    refinery     RAP/Wiri     RAP/Wiri     Wellington   Christch.    port
                                 outage      outage       disruption   disruption   disruption   disruption   disruption

 Low probability      2.50%       0.20%       0.50%         0.20%       0.50%        0.15%         0.20%          n.a.
 of occurring

 High probability     2.50%       0.25%       1.00%         0.30%       1.00%        0.25%         0.30%          n.a.
 of occurring

 2017

 Low probability      2.50%       0.25%       0.50%         0.20%       0.50%        0.20%         0.30%       ~0.10%
 of occurring

 High probability     2.50%       0.33%       1.00%         0.30%       1.00%        0.30%         0.40%       ~0.10%
 of occurring

Hale & Twomey: New Zealand Petroleum Supply Security 2017 Update                                              Page i
The findings are similar to the 2012 report for how the industry will respond to disruption and in
the case of petrol and diesel how much shortage there might be in each scenario. The main
difference to earlier work is that major disruption to the jet supply through to Auckland Airport will
now cause more significant problems and is likely to be more costly if that was assessed in an
economic analysis. This effect is due to strong growth in jet fuel demand in recent years along
with growth expected through to 2021. Other means of providing jet fuel (or transferring demand
to other locations) remain limited.
The economic analysis of welfare loss and impact from each disruption scenario carried out by
NZIER in 2012 has not been recalculated with this updated information (this is an economic
analysis outside H&T’s area of expertise). The expectation in discussions with MBIE is the earlier
work is still likely to be valid given the limited inflation since 2012 and relatively minor changes in
the probabilities of occurring. We assess there would likely only be a small increase in the
probability weighted costs for scenarios 2, 4 (higher welfare losses for jet fuel disruption), 6 and
7. In all cases any variation would be within the range of variation calculated by NZIER using
three different approaches for calculating the welfare loss1.
Given an expectation that probability weighted costs will be similar, we can conclude the findings
NZIER reached are still likely to be valid including:
For compliance with New Zealand’s international obligation, purchasing oil stock
tickets remain the most cost effective approach.
New domestic storage remains unappealing as its annual cost greatly exceeds the
avoided cost (weighted probability), even when combining cases and the stock is held
in a location where it could assist with multiple events (e.g. Auckland).
Having spare trucks (and drivers) available for immediate use is still not justified
against the alternative of obtaining them rapidly should there be an event.
Building a connection between the RAP and WAP pipelines in advance of an event is
not cost effective. However, it is probable that the consequence and cost of a jet
supply disruption has increased with the higher jet demand, so having mitigation
plans for responding should an event occur is even more important than previously
found. MBIE and jet fuel suppliers did begin investigating this issue following the
2012 Report. H&T notes that mitigation options should be considered and evaluated
in the context that a major disruption has occurred and it is costing the economy $2-
3 million dollars a day in direct and consequential losses, rather than a business as
usual situation.
The other issues reviewed in this update that should be monitored by officials include:
The important role the Wynyard Wharf facilities in Central Auckland would play
should there be a significant disruption to normal Auckland supply. This needs to be
considered when Auckland Council makes decisions regarding the relocation of these
key facilities.
The sharp rise in jet demand along with possible plans for expanding facilities at Wiri
terminal. Wiri throughputs have increased significantly, particularly for jet fuel.
Constructing additional storage near the Roscommon Road boundary, as noted in the
Auckland Council Planning Hearings, would greatly increase the terminal’s resilience.
1 The NZIER 2012 Results are included in Appendix 3.
Hale & Twomey: New Zealand Petroleum Supply Security 2017 Update Page iiGlossary
COLL Coastal Oil Logistics Limited – joint venture company controlling the ships
that move products from the refinery to ports around the country and the
shared stock scheme. Participants in the Joint Venture are BP, Mobil and Z.
GNS Geological and Nuclear Sciences Limited (GNS Science)
IEA International Energy Agency
MMB Million barrels
MMBD Million barrels per day
RAP Refinery to Auckland Pipeline (RAP) that takes product from Marsden Point
to the Wiri distribution terminal in South Auckland
Wiri terminal Wiri Oil Terminal in South Auckland
WOSL Operating company for Wiri terminal
Hale & Twomey: New Zealand Petroleum Supply Security 2017 Update Page iiiTable of Contents Executive Summary .......................................................................................................... i 1.0 Introduction ......................................................................................................... 1 2.0 Scenario assumptions........................................................................................... 2 2.1 Updated assumptions from previous reports ...................................................................2 2.2 Tsunami risk .................................................................................................................3 2.3 Wynyard Wharf ............................................................................................................4 2.4 Higher truck utilisation ..................................................................................................5 2.5 Jet fuel demand growth ................................................................................................6 2.6 Petrol and diesel demand growth ...................................................................................7 2.7 Terminal disruption probability discussion ......................................................................7 3.0 Scenario details .................................................................................................... 8 3.1 International disruption .................................................................................................8 3.2 Major Refinery Outage ................................................................................................ 10 3.3 Short refinery disruption.............................................................................................. 15 3.4 Long term disruption to RAP/Wiri ................................................................................. 16 3.5 Short Term Disruption to RAP/Wiri ............................................................................... 20 3.6 Long term disruption at Wellington .............................................................................. 22 3.7 Long term disruption at Lyttelton ................................................................................. 24 3.8 Multiple terminal disruption ......................................................................................... 27 4.0 Contingencies ..................................................................................................... 29 4.1 Strategic importance of the Wynyard terminals ............................................................. 29 4.2 Trucking..................................................................................................................... 29 4.3 Storage location ......................................................................................................... 29 4.4 Storage cost ............................................................................................................... 30 5.0 Comment on the likely impact on economic assessment ................................... 31 Appendix 1: Scenario impacts ....................................................................................... 33 Appendix 2: Global oil market disruption risk ............................................................... 36 Appendix 3: NZIER Results 2012 Report ....................................................................... 37 Hale & Twomey: New Zealand Petroleum Supply Security 2017 Update
1.0 Introduction
Hale & Twomey Limited (H&T) has prepared several reports for the Ministry of Business,
Innovation and Employment (MBIE)2 since 2004 on New Zealand’s petroleum supply security.
These include:
The 2004/2005 Oil Security Report with Covec (2005 Report)
RAP Contingency Report in 2011
A 2012 update of the 2005 Report assumptions (the 2012 Report) that fed into an
update of the 2005 Report economics completed by NZIER (the NZIER Report)3
A 2014 update on a refinery outage (strike)
Work on Wellington resilience to earthquakes in late 2016
MBIE has now requested H&T update the 2012 Report to take account of supply and demand
changes since then, particularly the significant increases in jet demand, and build on recent
studies and exercises relating to tsunami risks.
The 2005 and 2012 Reports covered the likely impact of international disruption as well as
domestic events such as refinery outage, a RAP disruption 4 and Wiri terminal disruption. The 2012
Report added assessment of port disruption at Wellington and Lyttelton, along with investigating
impacts from events such as tsunami which may impact multiple ports.
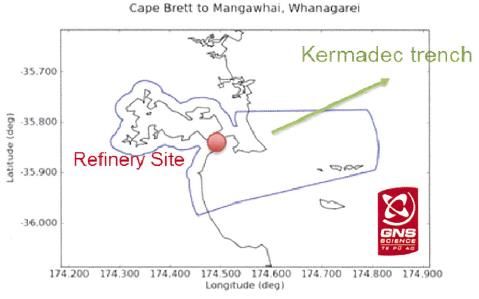
Recently the Ministry of Civil Defence & Emergency Management ran an emergency exercise
(Tangaroa 2016) that assumed a magnitude 9.1 earthquake near the Kermadec Islands resulted in
a series of tsunami waves that affected all the New Zealand coastline with major disruption at the
Marsden Point refinery and most coastal ports.
This update covers similar events as assessed previously and draws on the Tangaroa exercise and
updated research to consider in more detail the potential impacts and contingency options for a
major tsunami event which might impact multiple ports. The role of Wynyard wharf as a resilience
option in a major Auckland disruption event is also considered in more detail.
This report is not required to update the economic analysis carried out by NZIER in 2012. Where
applicable the costs of disruption, mitigation and contingency measures are updated including the
cost of storing fuel.
Relevant companies (key infrastructure owners and operators) were given an opportunity to
comment on a final draft of this report, but no material changes were made.
2 Or its predecessor department, the Ministry of Economic Development (MED)
3 New Zealand Oil Security Assessment Update, NZIER report to Ministry of Economic Development, June 2012
4The Refinery to Auckland Pipeline (RAP) analysis was based on the RAP Contingency Options report that
H&T did for MBIE in 2011, this included details on how trucking might partially mitigate disruption impacts.
Hale & Twomey: New Zealand Petroleum Supply Security 2017 Update Page 12.0 Scenario assumptions
The scenarios covered in this report are based on those in the earlier reports with an additional
case looking at an event that might impact multiple terminals. The scenarios include:
1. International disruption (major international event that disrupts 10% of crude oil supply for
around six months)
2. Major (long term) disruption to the refinery at Marsden Point
3. Short term (three week) disruption to the refinery at Marsden Point
4. Major (long term) disruption to RAP/Wiri terminal
5. Short term (three week) disruption to RAP/Wiri terminal
6. Major disruption at Wellington
7. Major disruption at Lyttelton (Christchurch)
8. Multiple port disruption
So it can be read as a standalone report, each scenario is summarised in this report with the
impacts updated based on the latest (2016) calendar year demand with adjustments made to
reflect forecast demand for 2021. Any known changes in infrastructure provision that may impact
the response is also considered. Where the disruption case is similar to previous reports this
reports uses the earlier descriptions updated as necessary.
While New Zealand has had several natural disasters in the past decade (particularly earthquakes)
none of these have caused significant (medium or long term) impacts on the fuel supply network.
The scope of the events covered here are major events that are best described as low probability,
high impact events. There has not been an incident along the lines of those outlined in these
scenarios in New Zealand’s petroleum supply system to the knowledge of the authors.
2.1 Updated assumptions from previous reports
All the scenarios are reworked using updated assumptions. Changes in assumptions from the
earlier reports that impact on the size of the disruption are covered in each scenario. Significant
changes in assumptions include:
Scale of Tsunami hazard – updated research has found that larger events are
possible (covered in more detail in Section 2.2) so for the same return period an
event will be larger
Wynyard wharf – potentially greater throughput may be available (covered in more
detail in Section 2.3)
Higher truck utilisation – less surge capacity is available as trucks now load closer to
their capacity in normal business following changes to heavy vehicles rules (covered
in more detail in Section 2.4)
Strong jet demand growth – demand for jet fuel has been strong, with national
demand 30% higher than in 2010 (the period used for the 2011 and 2012 reports),
this is covered in more detail in Section 2.5
2021 forecast for product demand (Section 2.6)
Hale & Twomey: New Zealand Petroleum Supply Security 2017 Update Page 22.2 Tsunami risk
The tsunami analysis in the 2012 Report used a 2005 GNS Science 5 report on tsunami hazard
along with work on infrastructure co-dependence and inundation modelling for relevant regional
councils. This report was updated by GNS Science in 2013 (2013 GNS Report)6. The update was
informed by recent changes in scientific knowledge from major events including the 2004 Indian
Ocean tsunami, the 2009 South Pacific tsunami and the 2011 Tohoku (Japan) tsunami. In all cases
these events were larger than had been considered likely to occur in these places. The updated
GNS Science report concludes that:
“For most parts of New Zealand, the overall levels of hazard are quite
similar to the assessed hazard levels in the 2005 report, but the
estimated hazard has generally increased in those areas most exposed
to tsunami from local subduction zones – notably the east-facing coasts
of the North Island, and the southwest corner of the South Island.”7
Significant petroleum infrastructure including the refinery at Marsden Point, and the terminals at
Tauranga and Napier are located on those east facing coasts, so tsunami are a relevant threat.
The 2013 GNS Report calculates hazard curves for the whole New Zealand coast, broken down
into 20km sections. The size of the wave (maximum amplitude) is calculated against the return
period for an event (the longer the return period the higher the maximum amplitude). Tsunami
from all locations (local, regional and distant) go into making up the possible events for each
return period. The 2013 Report assesses maximum wave amplitude which is defined as:
“the maximum height the tsunami would reach against an imaginary
vertical wall at the coast” 8
In addition, the maximum amplitude given for each section should be:
“interpreted as the tsunami height measured at the location within the
section where it is highest; the median tsunami height within the section
may be significantly lower”
The Tangaroa 2016 exercise was informed by this update using a very large 9.1 earthquake near
the Kermadec Islands resulting in tsunami that impacted most of New Zealand’s coast, particularly
the north of the North Island. In terms of risk assessment, the scale of the event used in the
exercise is a rare event, and while contributing to likely 1 in 2,500 year events at the locations it
impacts, is only one of the contributors so is expected to be even rarer. Previously when
evaluating tsunami risks at ports, the 1 in 100 and 1 in 500 year return period assessments have
been used, because the risk of the 1 in 2,500 years event is so low that it has negligible impact on
the economic assessment. In this report we note the size and possible impacts of major rare
events (1 in 2,500 years), while the scenarios risk assessment remains based on the 500 year
return period.
5 GNS Service (2005); Review of Tsunami Hazard and Risk in Zealand (September)
6Review of Tsunami Hazard in New Zealand (2013 Update), Compiled by William Power, GNS Science
Consultancy Report 2013/131 August 2013
7 Ibid pg 173
8 Ibid pg 130
Hale & Twomey: New Zealand Petroleum Supply Security 2017 Update Page 3Updated data from the GNS Science report is expected to be used for more detailed coastal
planning and infrastructure assessment. This is currently happening at the University of Auckland
where PHD students working with Dr Liam Wotherspoon of the University of Auckland have been
disaggregating the GNS data to model ports and harbours in more detail, particularly the stresses
tsunami can put on wharves and jetties. As the University of Auckland work is yet to be published
it is not available for use in this report.
Dr Wotherspoon9 noted the results to date generally indicate that the size of the waves expected
in harbours will be smaller than for the same event on an exposed piece of coastline. This result
would be expected by GNS Science in locations where there is some protection from direct impact
of the waves10. Waves can resonate in harbours so it is not always the case that they will be lower
(particularly if wave is in a similar direction to the harbour). Lyttelton is a location where waves
are known to resonate. It is beyond the scope of this report but it seems sensible to encourage
further modelling work around pieces of significant infrastructure (e.g. Marsden Point and
Tauranga harbour for petroleum infrastructure), particularly where expected damage can be
modelled for contingency planning. We understand that Marsden Point is already part of this work.
Another report that considers tsunami impacts is An Analysis of Tsunami Impacts to Lifelines 11.
This report assesses damage to lifeline structures from previous tsunami events. Unfortunately,
the documentation and evidence relating to energy infrastructure is light. For petroleum
infrastructure it notes:
Damage typically related to coastal storage tanks and associated infrastructure (e.g.
pipelines and facilities);
Tanks can be damaged by hydrostatic forces (generally buckling) or impacted by
buoyancy (floating from foundations);
It was found that at flow depths of 1m there was little or no damage and at 7m there
was always damage with a transition zone between the two;
Tanks that are full are less likely to be impacted;
Fires from petroleum spills are a major risk in a tsunami (petroleum floating on and
being spread by the water flow); and
From work with other infrastructure it appears that buried pipelines are quite
resilient, although there are risks where these are exposed (e.g. attached to bridges)
or where they cross waterways near the coast.
The details on tsunami hazard for each region is covered under the relevant scenario. The risk of a
multi-port impact tsunami event is covered in scenario 8.
2.3 Wynyard Wharf
In the previous reports, H&T assumed more diesel could be put through Wynyard Wharf facilities
should there be disruption to the normal supply of product into Auckland (either the refinery, RAP
or Wiri). There are two 6,000 m3 diesel tanks at Wynyard Wharf with a fill stand that is currently
9 Telephone call Dr Wotherspoon with Ian Twomey 19 June 2017
10Discussion with William Power, GNS Science 27 June. For example, GNS modelling for Takapuna
(Auckland region) is considerably lower than more exposed neighbouring coastlines for a similar event given
the protection of the islands in the Hauraki Gulf. Auckland harbour would be expected to be lower than the
wave height at Takapuna.
An Analysis of Tsunami Impacts to Lifelines, N.A. Horspool and S. Fraser, GNS Science Report 2016/22 for the
11
Auckland and Wellington Lifeline Groups, May 2016.
Hale & Twomey: New Zealand Petroleum Supply Security 2017 Update Page 4used for diesel supply (small volume). There are no facilities for petrol or jet fuel. The diesel facility is owned by Stolt-Nielsen (Stolt) and contracted for use by a participants in the COLL joint venture (so included in the national stock system) Wynyard Wharf also contains facilities for chemicals and oils (multiple smaller tanks) owned by Stolt and Bulk Storage Terminals (BST). These are also generally under contract for use by third parties. Stolt have now advised H&T there could be more throughput through the terminal than previously assumed should some of the chemical and oils facility be converted to petroleum use in an emergency. H&T has previously assumed that diesel could be put through the existing facility up to the capacity of the fill stand (2 trucks per hour with a 90% 24/7 utilisation); this is about 1.3 million litres/day. We have found this amount of diesel is sufficient to supply diesel to most of Auckland, given there will be the need to allocate available trucks across locations so any shortage is evenly spread across the region. Even once more trucks are available, we expect fully utilising the throughput at the existing Wynyard wharf facilities (1.3 million litres/day) and balancing the demand for the outskirts of Auckland to neighbouring terminals will be best strategy for diesel distribution given the terminal’s central Auckland location. Based on Stolt’s updated advice, additional capacity might have more benefit if it could be used to supply a second petroleum product through a different fill stand. Ideally this would be jet fuel as there is no means of alternate supply for the region. Chemical tanks, while a lot smaller, are often built to a quality (e.g. epoxy linings) that would make them suitable for jet fuel. Additional equipment would be required (e.g. coalescer) as well as a complete terminal review to ensure all fittings and equipment are suitable (e.g. no brass fittings) so while this would not be an immediate option, it might be able to be done relatively quickly in an emergency. Stolt advised there are a number of storage tanks around 500m3 capacity that could potentially be used for jet fuel depending on availability. While these tanks are very small by normal petroleum standards, if coupled with a ship on the jetty, they might be able to provide a regular supply of jet fuel. Jet fuel requires quality testing at each stage of its supply chain (including holding periods) so at most this would only give use of one tank per day (probably a little less). As a base assumption these tanks should at maximum be able to provide 450,000 litres per day which is about 10% of expected Auckland Airport supply. There is likely to be some jet trucks available (e.g. normal refuelling trucks) that would be available for hauling jet fuel from central Auckland to the airport should normal supply through to the JUHI not be available. Should more storage be available, it would be possible to supply more (around 16% of expected airport demand, or 700,000 litres/day, before hitting constraints on the fill stand). It is also likely around that point jet truck availability might become a constraint. 2.4 Higher truck utilisation Since the 2012 Report the rules for size and mass of heavy vehicles have changed. Previously fuel tankers were generally restricted to a gross mass limit of 39 tonnes12, but new rules that took effect from 1 February 2017 will allow general access vehicles (including fuel tankers) from 12It was possible to load more if a suitable permit was obtained allowing the vehicle to use specified routes, but consultation with companies in 2011 indicated this was not practical for most fuel haulage tasks. Hale & Twomey: New Zealand Petroleum Supply Security 2017 Update Page 5
December 2017 to have a gross mass limit of 45 to 46 tonnes depending on vehicle configuration
with some transitional arrangements in place prior. 13

A key response mechanism in the prior work was allowing fuel tankers to be fully loaded as most
newer fuel tankers had gross mass capabilities of around 44 tonnes compared to the legal limit of
39 tonnes. At that time allowing these vehicles to maximise loads, along with greater utilisation of
other tankers in the fleet, allowed a further 20% volume to be moved. Discussions with some fuel
suppliers and transport operators has indicated the more recent 44 tonne vehicles will be able to
operate at capacity under the new rules (without permits). However some of the latest vehicle
fleet additions have been larger (around 50 tonne gross mass limits) which may retain some spare
capacity if not used with special permits.

As the changes to the gross mass limits are only changing this year we expect the current ability
to carry more fuel is still be available (this is consistent with feedback received), but this will likely
erode as demand continues to increase 14 and as older tankers are retired from the fleet, although
there is likely to be some offsetting gain from some companies electing to upgrade their fleet with
larger 50 tonne vehicles over time. Looking forward we expect there will still be some capability to
maximise utilisation of the fuel tankers compared to normal operations (i.e. in an emergency there
is likely to be less consideration of operational or economic drivers than would normally be the
case) to the extent they can without compromising their own stringent safety requirements.

To adjust for the new rules of the size and mass of heavy vehicles for the updated report we have
recalculated the utilisation factor to conservatively be ~11% more volume to be moved, primarily
from better utilisation with a smaller uplift from being able to overload the vehicles. The volume
increase could be higher (around 15%) if we assume a greater proportion of 50 tonne vehicles as
part of the fleet.

2.5 Jet fuel demand growth

Demand growth for jet fuel has been strong since the last report with national demand in 2016
30% higher than in 2010 (the period used for the 2011 and 2012 reports), with most of that
growth in the last couple of years. The main driver of aviation fuel consumption is passenger
movements and in recent years New Zealand has had record growth in inbound tourism.

Jet fuel growth would normally lag passenger growth, reflecting increased efficiency of the airline
industry over time. However, in the last two years fuel growth has exceeded passenger growth
significantly driven by a large increase in long haul flights. A greater proportion of flights are now
long haul increasing the amount of fuel used per passenger movement. In addition flight load
factors (percentage of capacity used) have dropped with airlines adding capacity and new routes
into New Zealand15.

In time this trend should revert to a more normal growth pattern (and the load factors should
improve again over time) although the passenger number forecasts still indicate continue strong
growth. Therefore, our expectation is jet will continue to grow by about 20% from 2016 levels

13   http://nzta.thomsonreuters.co.nz/DLEG-NZL-LTSA-T.LTR-41001a.pdf
14In the short term, larger fuel loads would reduce the number of trips made, but as demand grows
companies will be able to increase tanker utilisation back towards previous levels, reducing spare capacity.
15   For example Air New Zealand 2017 interim results show falling load factors on international flights.

Hale & Twomey: New Zealand Petroleum Supply Security 2017 Update                                            Page 6
over the next five years. We have used this figure to estimate jet fuel demand in 2021 for each of
the scenarios analysed in this report.

With Auckland Airport flights consuming over 75% of New Zealand’s jet fuel, most of the growth is
on the jet fuel supply route from the refinery at Marsden Point, through RAP and the Wiri Terminal
to Auckland Airport.

For the scenarios in this report there are limited alternative jet fuel supply options in the short
term (other than for the Refining NZ scenarios where import cargoes are viable) so restoration of
supply will be met by shifting demand to other offshore locations (i.e. aircraft would divert to
other airports to refuel).

2.6 Petrol and diesel demand growth

The forecast used for petrol and diesel in this report (for 2021 demand) are based on those used
by MBIE in its modelling of future energy demand 16. These assume that petrol demand slowly
declines (ay about 1% per year) while diesel demand slowly increases (by about 1% per year). As
the total markets for petrol and diesel are similar the total volume of these products is expected to
be similar to 2016 volumes in 2021.

2.7 Terminal disruption probability discussion

The 2012 Report assessed the probabilities of major disruption at individual terminals to be
relatively low (e.g. 0.2-0.3% per year for Wiri). The statistics on oil terminals incident remain
limited with the 2005 Buncefield terminal explosion (United Kingdom) still being the most recent
major event informing terminal design. Within New Zealand, the most significant recent event
impacting terminal capacity was a slip at Lyttelton during flooding (2014), which initially damaged
(including rupture) two tanks and required more to be taken out of service. The balance of the
port’s tankage remained in service.

While the probability assessment for individual disruption events (in any one year) seems low, this
should be understood in the context that such events (extended duration disruption) in well
maintained petroleum facilities are low, even including the impact of natural disasters. This might
best be understood in the context of operating terminals within New Zealand. On average over the
past few decades there have been around 30 individual terminals operating in New Zealand at 13
different locations. Using the probability given for Wiri for a single terminal disruption, with 30
terminals this would imply that New Zealand would expect a 7.5% chance of one of these
terminals been taken out of action for a long period (i.e. an expected rate of incidence of 1 every
13 years). The incident described above at Lyttelton is the most significant incident over the past
couple of decades and that would be regarded as a partial closure of one of the three terminals at
that location. This includes periods where there have been significant earthquakes impacting
regions with oil terminals (Lyttelton and Wellington).

Viewed on this basis, the assumptions for terminal risk are reasonable despite appearing to be low
when looked at on an individual basis. Natural disaster is as much of the risk as the inherent
nature of the product being handled.

16   These are titled “Electricity demand and generation scenarios” but do also cover liquid fuels.

Hale & Twomey: New Zealand Petroleum Supply Security 2017 Update                                      Page 7
3.0 Scenario details
3.1 International disruption
3.1.1 Probability of event
Both the 2005 and 2012 Reports used data from Oak Ridge National Laboratory (Paul Leiby) to
develop probabilities for an international disruption scenario. The 2012 Report used information
from 2005 when Oak Ridge National Laboratory updated earlier work using new methodology and
more detailed build-up of the probabilities of disruption (Energy Modelling Forum report)17.
In 2013 the International Energy Agency (IEA) undertook a study, The Costs and Benefits of
Stockholdings (2013 IEA Paper).18 The IEA used Paul Leiby and the Oak Ridge National
Laboratory’s team to develop a supply disruption simulation model to assess stockholding benefits.
While this took the modelling forward (modelling the impact of emergency stockholding on market
prices), they continued to use their 2005 work as the basis for the specific risk disruption
probabilities. Given this information is still being used by the experts in the field, we consider the
information used in the 2012 Report for risk assessment remains valid for this update.
The 2012 Report contain a full discussion, but in summary the output from the 2005 Energy
Modelling Forum study assumes at least once during a 10-year timeframe:
The probability of a net disruption of 2 MMBD (million barrels per day) or more
lasting at least 1 month is approximately 80%19
The probability of a net disruption of 2 MMBD or more lasting at least 6 months is
approximately 70%
The probability of a net disruption of 2 MMBD or more lasting at least 18 months is
approximately 35%
The chance of a 3 MMBD net disruption or more lasting at least 1 month is 65%; the
chance of 5 MMBD or more is about 50%
The disruption probability curves from the 2005 Energy Modelling Forum study were used to
develop probabilities for events of certain size and duration (Appendix 2). These need to be large
enough so as to impact on New Zealand supply and international oil prices. An event that causes a
disruption of 7MMBD or more for 6 months duration has a probability of approximately 25% over
a 10-year period (2.5% per annum) with the probability taken from the data between the curves
for a 1-6 month duration and 6-18 month duration. This probability covers an event of this size or
larger. The weighted probability of the size of the events over 7MMBD is around an 8.4 MMBD
disruption, which is an approximate 10% market disruption (using market size at the time of the
study).
Event Summary:
Disruption of 10% (net of spare capacity) to the international crude oil market
Probability of 2.5% of this disruption in any one year (1 in 40 years)
6 month duration
Energy Modeling Forum, Philip C. Beccue and Hillard G. Huntington, 2005.An Assessment of Oil Market
17
Disruption Risks, FINAL REPORT, EMF SR8, October 3.
18 IEA/SEQ(2013)20 Costs and Benefits of Stockholding (final Report) (Note by the Secretariat)
19The disruption size calculation takes into account spare capacity available in the supply system for
covering disruption events.
Hale & Twomey: New Zealand Petroleum Supply Security 2017 Update Page 83.1.2 Market response
In the above event, while normal supply is disrupted by 10%, the actual shortage will be less as
many countries will release their strategic reserves (both IEA countries and other countries with
reserves such as China). Also, the price will increase which will help stimulate supply (i.e. rising
prices will encourage additional supply as well as use of any spare capacity) and reduce demand.
The price rise will be a result of the net price elasticities of supply and demand. There is a
thorough discussion on these elasticities in the paper by Brown et al. (2010) 20. These elasticities
are also in line with similar papers reviewed. In summary, the combination of supply and demand
elasticities yields a midpoint elasticity of -0.136. That is crude oil prices will rise by 7.35%
(=1/0.136) for every 1% reduction in oil supply.
To calculate price and disruption impacts, the response of countries that hold emergency stock
needs to be considered. A 10% disruption for 6 months is a total disruption of approximately
1,600 MMB. This is less that the figure counted for IEA emergency stocks of 2,300 MMB
(comprising government and public emergency stocks) 21. However, given a disruption will likely be
unknown in length and severity, we expect there will be caution in the rate of releasing reserves.
For this scenario we assume the reserve release will be enough to offset half the base disruption
leaving a net disruption of 5%.
Using the elasticity above, the price impact can be calculated. The initial shock of 10% disruption
would be expected to see a price increase of around 74% but once emergency stocks begin to be
released this would fall to an increase of 37% 22. This has the following impact on international and
local prices.
Table 1: Impact of International disruption
Initial response Likely settled
(10%) response (5%)
Increase in base price 74% 37%
Crude oil price (assuming base price US/bbl $87 $68.5
US$50/bbl)
NZ petrol price increase Cpl (%) +45 (22%) +22 (11%)
NZ diesel price increase Cpl (%) +45 (34%) +22 (17%)
NZ jet fuel price increase Cpl (%) +45 (75%) +22 (37%)
The New Zealand price increases shown in Table 1 assumes refining margins and freight also
increase due to the disruption. The local diesel and jet fuel increases are proportionally larger due
to a lower tax charge in the total cost. The exchange rate assumption used was US/NZ 0.70.
Resources for the Future, Stephen P.A. Brown and Hillard G. Huntington, 2010. "Reassessing the Oil
20
Security Premium", February
21IEA/SEQ(2013)20 Costs and Benefits of Stockholding (final Report). This number excludes commercial stocks
held outside an obligation in IEA countries (total IEA countries stocks are more than 4,000 MMB).
22This was done differently in the 2012 analysis for the IEA by Oak Ridge National Laboratory (Benefits of
Emergency Oil Stocks: A Study of IEA Stocks and Benefits). The net effect of a controlled stock release (covering
about ½ the disruption) saw a similar increase of 35-40% in crude oil prices. They did calculate a higher
increase (starting at 160% falling over a year to 100% increase) should there be no strategic stocks to release.
Hale & Twomey: New Zealand Petroleum Supply Security 2017 Update Page 93.1.3 Impact and stockholding benefit The 2012 NZIER Report assessed the economic consequences of the above scenario and concluded that while an international event was likely to have larger potential impact than domestic scenarios, it did not justify stock holding locally. This was because the main economic impacts would come from increased prices which are not prevented by local stockholding. As the 2013 IEA Paper looks at a global response rather than a single country impact, it concludes that global stockpiles are worthwhile because of the damping impact they will likely have on prices in a disruption23. New Zealand contributes to these stockholdings through compliance with its commitment to hold stocks covering 90 days of net daily import. It meets that commitment by using stock tickets to hold stocks offshore in addition to the commercial stocks held in New Zealand. Stock tickets provide a cost-effective solution for New Zealand to ensure compliance and play a part by adding to global stocks for use to mitigate disruption as evaluated in the IEA Paper. In the IEA Paper the benefit of stockholding was calculated on a global basis rather than an individual country basis. It found that stockholding had an average GDP saving to oil importers of approximately 0.75 percent of GDP and reduced their import costs by another 0.55 percent of GDP24. The expected benefits of IEA stocks (those above commercial stockholding) to global import regions was assessed to be US$51 per barrel per year. The annual cost of tickets purchased by the New Zealand Government to meet its commitment as part of that IEA response is currently just over US$1 per barrel per year. From the IEA analysis we can conclude that New Zealand’s spend on stock tickets is worthwhile given the benefits from the stock holding. The additional cost of holding physical stocks in New Zealand (above the ticket cost) would only be justified should that cost be justified by mitigation stock would provide for domestic disruption. This was analysed in the 2012 NZIER Report (and found not to be justified) with the impact of any updated assumptions discussed in Section 5.0. 3.2 Major Refinery Outage The Marsden Point refinery is owned and operated by Refining New Zealand (Refining NZ). This is New Zealand’s only refinery and remains a vital link in the local petroleum supply chain. The refinery has undergone three major investments since 2004 to maintain its share of around 70% of the New Zealand fuels market and to improve its capability to produce the high quality products now required for the New Zealand market. The demand balance is imported directly from refineries in the Asia-Pacific region (sourced primarily from South Korea and Singapore) to ports in New Zealand. Approximately 50% of the refinery’s production is supplied to Auckland through the RAP with the rest distributed by coastal tanker (two ships are used for this task) to ports around the country (10 ports in total – five in the North Island, five in the South). The refinery is also a significant stock holding location and a key part of the supply chain, both to maintain Auckland supply and for maintaining coastal distribution to other ports. Disruption at the 23It is reasonable to have a different conclusion to the NZIER study as global stockholdings are substantial and will have a damping impact on prices, whereas New Zealand stocks on their own won’t change that impact as assumed in the NZIER study. 24Benefits of Emergency Oil Stocks: A Study of IEA Stocks and Benefits, Oak Ridge National Laboratory, October 2012, pg 6. At the time crude prices were more than twice the current level – we expect these benefits may be lower if calculated with current oil prices (the cost of stockholding has also reduced). Hale & Twomey: New Zealand Petroleum Supply Security 2017 Update Page 10
refinery may only impact on processing or, if the event is major, may also impact on stocks held
and ability to distribute product from and through there.
The refinery continues to target (and achieve) reliable performance; Refining NZ noted in the
2016 Annual report in regards to minimising unplanned downtime that they had:
"a world-class unplanned downtime for the year of 0.85%”
Refining NZ’s unplanned downtime since 2008 is provided in Table 2.
Table 2: Refining NZ unplanned downtime
2008 2009 2010 2011 2012 2013 2014 2015 2016
Reliability - Unplanned
Downtime % 0.92% 0.53% 0.55% 1.37% 0.59% 1.11% 0.24% 0.33% 0.85%
Source: Refining NZ
The 2012 Report noted that Refining NZ performed in the top quartile for operational availability
(reliability) in the Asia-Pacific region as benchmarked by Solomon Associates. While this
information has not been updated the unplanned downtime measure is in line with the earlier
period. Based on Refining NZ performance continuing in line with the earlier analysis, we can
conclude that the risk of a major extended outage at Refining NZ is low, although with a high
impact given its importance to the supply chain.
3.2.1 Outage scenario
The scenario assumes an incident (be it a natural disaster or internal event) takes the refinery out
of action for an extended period requiring the refinery customers to re-establish supply routes
using 100% import supply. While the refinery is off line, the scenario assumes within a couple of
weeks refinery tankage and RAP will be available for imported cargoes. Any delay in using these
facilities will not change the overall product shortage (from a national perspective), rather it would
concentrate the shortage on the Auckland region. An extended outage of import facilities at
Marsden Point would essentially be a more severe version of the extended RAP/Wiri outage
(Scenario 3) with added severity for Northland supply.
The scenario calculation assumes:
Imports already meet some of the market demand (35% petrol, 28% jet and 38% diesel
based on the 2021 forecast data).
It takes 6 weeks (42 days) for companies to re-establish full supply via imports.
Some of the larger oil companies operating in New Zealand are able to secure additional
short term imports by diverting cargoes from other destinations or securing very prompt
cargoes (this would be the equivalent of two additional cargoes in two to three weeks and
two more in four to five weeks). It may be that the fuel quality of these prompt imports may
differ slighting from the New Zealand specifications, so importing companies may require a
waiver on certain specifications before use.
Companies will draw down existing buffer and safety stocks held in the system. We estimate
this to be about seven to nine days consumption at normal rates. While there is more stock
than this in the system this is required to keep the system operating - if some of this stock
was able to be used it might alter the profile of when the stock shortage occurred but would
not alter the size of shortage itself.
Hale & Twomey: New Zealand Petroleum Supply Security 2017 Update Page 11Petrol and diesel impact
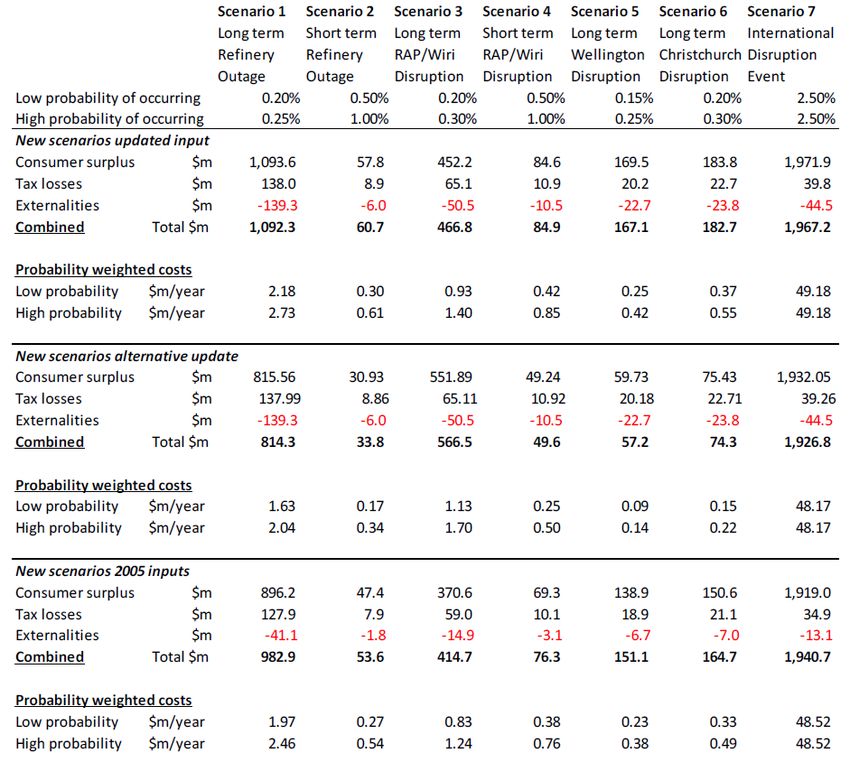
The net impact over a two-month period is shown in Figure 1 with further details given in
Appendix 1. Over the period about 25% of normal petrol and diesel demand would not be met.
While the shortage is shown at its worst in the first two weeks, it might be possible to reduce the
initial impact by drawing down inventories faster in the initial period (rather than evenly over 42
days). It is assumed the shortage is evenly spread over the country and the shortage for
petrol/diesel is about 50/50.
Jet fuel impact
The shortage for jet is worse as Refining NZ supplies more of the market (although by 2021 this is
about 72%, rather than around 85% currently observed) so there are less imports to assist with
meeting demand. As a result about 39% of normal demand is unable to be met over the period.
As jet demand in New Zealand is weighted towards international (~79%) this will primarily affect
international demand. The expectation is there will be some rationalisation of international and
domestic flight timetables to better load aircraft and reduce fights and that most short haul
international flights (e.g. Trans-Tasman) will tanker in fuel for their return journey when flying to
New Zealand. Long haul traffic (New Zealand to/from Asia or North America) will not be able to
tanker sufficient fuel so will need to stop elsewhere (e.g. Brisbane, Nadi) either before or after the
New Zealand stop to load additional fuel. Some international flights might be rationalised and long
haul passengers may need to depart through Australia.
The summary for the jet shortage impacts are:
Demand still met: 61% or 3.36 ml/day
Lower demand from rationalising flights: 10% or 0.55 ml/day25
Tankering from Australia for trans-Tasman flights: 10% or 0.55 ml/day26
Remainder of demand that won’t be met locally: 19% or 1.02 ml/day
Figure 1: Major refinery outage - impact on supply over time
Long term disruption to RNZ
Petrol and Diesel Jet Fuel
100% 100%
90% 90%
Volume (% of normal supply)
Volume (% of normal supply)
80% 80%
70% 70%
60% 60%
50% 50%
40% 40%
30% 30%
20% 20%
10% 10%
0% 0%
-6 0 6 12 18 24 30 36 42 48 54 60 66 -6 0 6 12 18 24 30 36 42 48 54 60 66
Day (#) Day (#)
Volume shortage Volume supplied Disruption
25 Level chosen based on normal aircraft loadings around the 80-85% level
26Based on discussions with Air New Zealand and the Board of Airline Representatives New Zealand during
the work on RAP contingency options, updated for 2021 demand situation.
Hale & Twomey: New Zealand Petroleum Supply Security 2017 Update Page 123.2.2 Probability The probabilities for an event of this scale were assessed at range of 0.20-0.25% per year (1 in 400 to 500 years) in the previous report based on analysis of international literature and possible local events (such as earthquake and tsunami). These sources have again been reviewed along with some additional information to provide an updated estimate. The European Major Accidents Reporting System (MARS)27 database was reviewed to add the most recent five years data to the previous analysis. The number of reported major incidents for oil refineries/petrochemicals in the last five years (only has reports available to 2015) is only 13 in comparison to 28 in the prior five year period and a higher number before that. As in the earlier analysis a considerable number of events (about half) related to petrochemical facilities rather than refining (these facilities are often co-located). The incident mix was similar to previous reviews with the largest group being either liquid or gas releases to atmosphere (in most cases having limited or no impact on production). The most severe accidents were vapour leaks causing fire and explosions. Compared to the previous analysis there were less incidents causing fatalities and fewer with a significant impact on production (impacts were primarily on petrochemical plants). Based on this sample and as there are approximately 100 refineries in Europe if there was one incident causing an extended shutdown over a 10 year period then the probability would be 0.1% for that period, in line with earlier assumptions. However, there may have been other shutdowns not detailed. Given Refining NZ’s reliability and safety performance we would expect it to have a lower disruption probability than the European average, although it was not clear how long the resulting shutdown was with some of the reported incidents. A paper by Jim Thomson (Safety in Engineering) 28 was also reviewed as this covered only oil refineries and listed major refinery accident losses from 1972-2011 (global list based on Marsh data of Value of Insured Losses). Based on his analysis and making allowances for underreporting, he concludes the in a 50-year life “any given Refinery has about a one in ten chance of suffering a major accident during its operation lifetime”.29 This is equivalent to a 0.2% chance in any year, higher than derived from the European data but with the same provisos when applying to Refining NZ. Analysis of the incidents in the Marsh document, The 100 Largest Losses 1974-201530, would give a ratio for refineries of ~0.14% per year for major incidents recorded, calculated on the same basis as Jim Thomson’s work. Based on the variety of these sources and there level we conclude our earlier assumption for Refining NZ is still valid. The internal incidents covered above need to be combined with other incidents than might happen such as marine oil spill, external supply problem (e.g. electricity) or natural disaster. For natural disasters, one of the reasons Marsden Point was chosen for the refinery site was due to the region’s lower risk to natural disasters (e.g. lowest earthquake risk within New Zealand). 27 https://emars.jrc.ec.europa.eu/ 28 Refineries and Associated Plant: Three Case Studies, Jim Thomson, Safety in Engineering 2013 29 Ibid pg 3 The 100 Largest Losses 1974-2015, Large property damage losses in the hydrocarbon industry, Marsh, 30 March 2016 Hale & Twomey: New Zealand Petroleum Supply Security 2017 Update Page 13
The 2012 Report highlighted that the Northland Lifelines Group Infrastructure Resilience Plan 31
identified infrastructure co-dependences as a key risk to manage (including the refinery’s
dependence on electricity and water supply) and assesses infrastructure failure scenarios and the
risk posed by natural hazards. With the update of the tsunami information since the last report we
consider how this might have changed the refinery disruption risk.

The tsunami risk is considerably higher than the earlier assessment with the maximum amplitude
wave along that coastline for a 500 year return period now modelled as 4.8 metres (50 percentile)
with a 2,500 year return period event being around 7.5 metres. More distant events (e.g. South
America) are the main contributors to the shorter return period (500 years), whereas the
local/regional Kermadec trench event would be a rare but severe event (contributes 50% of the
cases for the 2,500 year return period).

However, as discussed in Section 2.2, the actual wave at the refinery might be considerably lower
than the maximum estimated on the coast. Figure 2 shows the refinery is protected from direct
impact from a Kermadec event, as it would be for many South American events.

Without detailed modelling it is difficult to estimate the likely impact other than to note that a
2,500 year event would still be expected to cause considerable inundation and damage, whereas
Figure 2: Direction of tsunami wave                                 for a 500 year event, it may well
                                                                    be below the level (say under 4
                                                                    metres) where it would cause
                                                                    major damage.

                                                                   Refining NZ noted32 it has tsunami
                                                                   event plans and for distant events
                                                                   will have the time to make the
                                                                   refinery safe which may make it
                                                                   easier to recover from any
                                                                   damage. A local/regional event is
                                                                   more difficult to manage and may
                                                                   result in the refinery being
                                                                   unavailable for a period of time,
                                                                   although as noted above this is
  Source: Refining NZ/GNS Science                                  expected to be a rare event. It
                                                                   may also be that associated
infrastructure damage (e.g. electricity supply) is the reason for the refinery outage.

With events now expected to be larger (particularly rare events), there is greater risk that the
refinery could be damaged, although the return periods are still considerable (i.e. rare). We
therefore update the risk range assessed of between 0.04-0.20% to the higher end of that range;
0.10-0.20% (i.e. 500 to 1000 years rather than 500-2500 years). It would be useful if more
detailed modelling of the Marsden Point coast could refine this risk a little more.

When combining the various risks, the 2012 Report gave this major refinery outage scenario a risk
range of 0.20-0.25% (1 in 400 to 500 years). With a higher tsunami risk and a higher major event

31Northlands Lifelines Group: Infrastructure Resilience Plan (October 2009). Part B: Infrastructure/Hazard
Risk Profile.
32   Call Julian Young/Ian Twomey 16 June 2017

Hale & Twomey: New Zealand Petroleum Supply Security 2017 Update                                      Page 14
risk from the global data in comparison to the European, we have now increased this slightly to
0.25-0.33% (1 in 300 to 400 years).
3.2.3 Additional supply costs during disruption
This section covers additional costs incurred by the suppliers to minimise the disruption rather
than the cost of not meeting demand. For this scenario the oil companies re-establish supply using
imports, so while they are likely to face some increased costs to access prompt cargoes, ultimately
supply via import will use the same benchmark level used to price into the market. Therefore,
there will not be significant incremental costs to consider.
We do not consider the cost to the refinery from the disruption (they carry business interruption
insurance) nor do we consider loss of refining margin to the refinery users.
3.3 Short refinery disruption
This scenario assesses a shorter duration outage of the refinery when it commences operation
again within a timeframe that is not worth establishing full re-supply using imports. In effect this
is a more severe version of refinery upsets that happen from time to time and are managed by
companies using inventories they carry (Table 2) but of a smaller scale than the previous scenario.
3.3.1 Outage scenario
This scenario assumes some incident (be it a natural disaster or internal event) takes the refinery
out of action for three weeks, although in practice it may be a shorter refinery outage with one
unit down for an extended period because of an incident on one unit. While it won't be known
immediately, it is expected the approximate timeframe for restart would be known within a few
days after the incident so companies will know they are not switching to a complete import
supply. In this case it is assumed that other than for a relatively short period (a few days), the
refinery tankage and RAP pipeline will be operational.
The scenario calculation assumes:
Imports already meet some of the market demand (35% petrol, 28% jet and 38% diesel).
Some of the larger oil companies operating in New Zealand are able to secure additional
short term imports by diverting cargoes intended for other destinations (this would be the
equivalent of two additional cargoes in two to three weeks), although some of these cargoes
may require a waiver on certain specifications before use.
Companies will draw down buffer and safety stocks in the system, but because the duration
is shorter these will likely be drawn down more quickly than in the long term disruption case.
The net impact over the two month period is shown in Figure 3 with further details given in
Appendix 1. Use of inventories (including buffer stocks) and a couple of very prompt imports could
mean the actual stock shortages could be minimal (approximately 4% for petrol and diesel and
about 23% for jet fuel). In practice there will be stock outs in certain areas for short periods as
suppliers ration available product around the country. It is likely the actual shortage will occur
from week two through to week four or five rather than over the immediate three week period as
shown in Appendix 1 (although the magnitude of the shortage will be similar).
The shortage of jet fuel will require action to be taken by the airline industry. The assumption is
this will largely be managed by short term rationalisation of flights and tankering of jet fuel from
Australia for the trans-Tasman flights – this would mitigate about 20% of the shortage leaving a
3% shortage to be covered by adjusting how some of the long-haul flights are fuelled.
Hale & Twomey: New Zealand Petroleum Supply Security 2017 Update Page 15You can also read