New Zealand blue whales: Recent findings and research progress - Oregon ...
←
→
Page content transcription
If your browser does not render page correctly, please read the page content below
New Zealand blue whales: Recent findings and research
progress

Leigh G. Torres1, Dawn R. Barlow1, Kristin Hodge2, Holger Klinck2, Debbie Steel1, C. Scott Baker1, Todd
Chandler1, Pete Gill3, Mike Ogle4, Callum Lilley4, Sarah Bury5, Brittany Graham5, Philip Sutton5, Jonathan Burnett6,
Mike Double7, Paula Olson8, Nadine Bott4, Rochelle Constantine9
1
 Marine Mammal Institute, Department of Fisheries and Wildlife, Oregon State University, Newport, Oregon, USA
2
 Bioacoustics Research Program, Cornell Lab of Ornithology, Cornell University, Ithaca, New York, USA
3
 Blue Whale Study, Inc., Narrawong, Victoria, Australia
4
 New Zealand Department of Conservation, Wellington, New Zealand
5
 National Institute of Water and Atmospheric Research Ltd., 301 Evans Bay Parade, Hataitai, Wellington, New
Zealand
6
Aerial Information Systems Lab, Department of Forest Engineering, Resources, & Management, Oregon State
University, Corvallis, USA
7
 Australian Marine Mammal Centre, Australian Antarctic Division, Kinston, Tasmania, Australia
8
 Southwest Fisheries Science Center NMFS/NOAA, La Jolla, California, USA
9
 School of Biological Sciences, University of Auckland, Auckland, New Zealand
ABSTRACT
Since 2012, we have investigated a newly documented group of blue whales (Balaenoptera musculus sp.) in the
New Zealand region. Field research has focused on multi-disciplinary data collection regarding the ecology of blue
whales occurring in the South Taranaki Bight (STB) region of New Zealand (40.15 S, 173.30 W). The STB region
incurs significant anthropogenic activities from oil and gas exploration and extraction, fishing activities, vessel
traffic, and would also be affected by proposed seabed mining. Therefore, an improved understanding of the
population and ecological parameters of blue whales occurring in the STB and throughout New Zealand waters is
essential to develop appropriate and effective conservation management plans that mitigate impacts at individual
and population levels. Vessel-based field research in the STB was conducted during January and February of 2014,
2016, and 2017. Data collection focused on visual surveys to assess blue whale distribution patterns with concurrent
oceanographic and prey (krill) sampling, blue whale behavioral observations, photo-identification, tissue biopsy and
fecal sample collection, and health assessment through photogrammetric Unmanned Aerial System (UAS; drone)
operations. Additionally, a five-unit hydrophone array was deployed in the STB region in January 2016, which will
remain in place for two years to record blue whale vocalizations and ambient noise levels. Data analyses to date has
revealed the following significant findings: blue whales occur regularly in the STB to forage on krill; the population
consists of a minimum of 140 photo-identified individuals; blue whales occur in the STB region almost year-round
as described by vocalization detections at the five hydrophones of the New Zealand blue whale call; these whales
are most genetically similar to Australian ‘pygmy’ blue whales (B. m. brevicauda), with one unique mtDNA
haplotype identified and very low haplotype diversity; blue whales shift habitat use patterns across the STB region
relative to oceanographic patterns, as demonstrated by a markedly different distribution pattern in 2016 during an El
Niño event; individual blue whales re-occur within the STB and New Zealand waters inter-annually, including one
individual seen three times over a six-year period; blue whales likely also use the STB region as a nursing and
breeding area as indicated by behavioral observations and regular acoustic detection of the New Zealand blue whale
call. Many lines of evidence now lead us to hypothesize that these whales form a New Zealand population of blue
whales that are either resident or semi-resident in New Zealand waters. Continued data collection and analysis is
necessary to fill pressing knowledge gaps regarding the ecology of this blue whale population in order to inform
environmental management decisions.
KEYWORDS: BLUE WHALES, NEW ZEALAND, PHOTO-ID, ECOLOGY, BEHAVIOR, FORAGING
GROUND, ACOUSTICS, GENETICS, ANTHROPOGENIC IMPACTS, STABLE ISOTOPE VALUES,
CONSERVATION, POPULATION PARAMETERS
 1
J. CETACEAN RES. MANAGE.

INTRODUCTION
A hypothesis was put forward by Torres (2013) that the South Taranaki Bight (STB) region of New Zealand (Fig. 1)
is an important foraging ground for blue whales (Balaenoptera musculus sp.). This hypothesis was based on (1)
opportunistic and marine mammal observer (on seismic surveys) sightings of blue whales in the STB, (2) historical
sightings of blue whales in the STB from Soviet and Japanese whaling records, (3) stranding records of blue whales
around New Zealand, and (4) oceanographic studies in the STB documenting regional upwelling events that cause
high productivity (Shirtcliffe et al. 1990) and lead to large aggregations of krill (Nyctiphanes australis), a known
blue whale prey item in the Australasian region (Gill 2002).
The STB region is of particular interest as it is New Zealand’s most industrial marine region. There are active oil
and gas extraction platforms, and ongoing seismic survey efforts to explore for more oil and gas reserves. Busy
vessel traffic frequents the STB with multiple major ports in the region and the neighboring major shipping channel
of the Cook Strait. Additionally, the STB is the site of a proposed contentious seabed mine, whereby Trans-Tasman
Resources Ltd. is proposing to extract 50 million tons of iron sands from the seafloor each year over a 35-year
period (http://www.epa.govt.nz/EEZ/whats-going-on/current-applications/ttr-2016/Pages/default.aspx). Hearings for
the permit application case are currently ongoing, and the New Zealand Environmental Protection Authority
Decision Making Committee is anticipated to make their decision by the end of June 2017. Throughout the permit
application hearings, data presented here in this report have been requested to aid in the decision-making process.
Understanding distribution and residency patterns, population connectivity, habitat use, and health of this little-
studied blue whale population is critical for the evaluation of the potential impacts they may face from the
aforementioned industrial activities.
In order to fill knowledge gaps regarding blue whales in the STB, we initiated a dedicated research program in 2013
that consists of a multi-disciplinary approach to enhance our ecological and biological understanding of these whales
and their habitat. Since this time we have compiled various data streams regarding blue whale ecology in the STB
and New Zealand waters that have developed our knowledge and potential for conservation management of this
newly documented blue whale population.

METHODS
Field efforts: Data collection took place in January and February of 2014, 2016, and 2017 in the STB region (Fig.
1). Field work consisted of survey effort for blue whales, oceanographic sampling, collection of hydroacoustic
backscatter data on prey availability, behavioral observations of whales, collection of photo-identification data, skin
and blubber biopsy sampling, unmanned aerial system (UAS, a.k.a. “drone”) flights over whales for
photogrammetric data collection, and opportunistic collection of blue whale fecal samples and krill. A 14m jet-
propelled catamaran, equipped with oceanographic sampling capabilities and a flying bridge for observational work,
was used as the research platform for the 2014 and 2016 field seasons. In 2017, a 19.2 m vessel equipped with the
same survey and oceanographic sampling capabilities was used as the platform for field work. Prior to each survey
day, daily images of sea surface temperature (SST) and chlorophyll-a (chl-a) were assessed to locate areas of
upwelled water and high surface productivity, and survey effort was directed toward those areas or to areas
previously unsurveyed.

 2
J. CETACEAN RES. MANAGE.

Figure 1. A map of New Zealand, with the South Taranaki Bight (STB) region delineated by the black box.
Survey effort was conducted on days with suitable weather conditions (Beaufort Sea State < 5). Profiles of water
column depth, temperature, salinity and fluorescence were recorded using a Sea-Bird microCAT (SBE 911plus)
Conductivity, Temperature and Depth (CTD) sensor that was lowered at a rate of 1 m/s until approximately 10 m off
the bottom. CTD casts were performed at the start and end of survey, approximately every hour while on survey,
and at all blue whale sightings. Survey effort was conducted at 8 knots, with one observer posted on the port and
starboard sides of the flying bridge. Additional observers surveyed the entire area. Hydroacoustic backscatter data
were recorded while on survey using a Simrad EK60 echosounder (Simrad ES120-7DD splitbeam transducer,
120kHz transceiver, 250 W, 1.024 ms pulse length, 0.5 s ping rate) deployed 1.26 m below the research vessel in
2014 and 2016, and 1.45 m below the vessel in 2017. At all blue whale sightings, survey effort was stopped, the
transducer raised from the water (to increase vessel maneuverability), date, time, and location recorded, and the
animal(s) were approached for behavioral observation and further data collection. Immediately after each blue whale
sighting in 2014 and 2016, hydroacoustic data were collected to assess prey availability in the region. In 2017, a
RHIB tender was utilized to collect photo-identification and biopsy data, allowing the main research vessel to collect
hydroacoustic data during the sighting.
Photo-identification images of the left and right sides of each blue whale were captured whenever possible. After
effort was spent on photography, biopsy effort was initiated, with simultaneous photography effort to identify
sampled whales. Skin and blubber biopsy samples were collected using a lightweight biopsy dart (cutting head 7 X
19 mm) fired from a Paxarms biopsy projector (Krützen et al. 2002; New Zealand Department of Conservation
permits Rnw/HO/2009/03; AEC225; AEC266). Samples of sufficient size were divided for genetic, hormone, and
stable isotope analyses. All samples were either frozen at -20°C or stored in 90% ethanol, dependent on biological
analysis. When conditions permitted, the UAS was launched from the aft deck and navigated over the whale at least
30 m above the surface of the water. Once behavioral observations and satisfactory images for photogrammetry
were obtained, the UAS was retrieved. A fine-mesh (300 µm) dip net attached to a long pole was used to collect
fecal and krill samples from surface waters opportunistically when material was observed. Sample materials were
placed in sterilized plastic jars and frozen.

 3
J. CETACEAN RES. MANAGE.

Photo-Identification analysis: Photographs of blue whales were reviewed and grouped by individual within each
sighting. Using unique pigmentation patterns on the sides of each animal and dorsal fin shape, the number of
individuals documented during the field effort was determined. Using standard methods (Sears et al. 1990), images
of STB whales were compared to 13 other sources of photo-identification from New Zealand waters, as well as three
catalogs from Australian waters and one from Antarctic waters (Table 1).
Table 1. Sources of photo-identification data from within New Zealand waters and from Australian and Antarctic
regions.
 Number
 Contributor Years Region
 of IDs
 Australian Marine Mammal Centre (Double et al. 2013) 2013 South Island 14
 Cawthron Institute 2013 South Taranaki Bight 2
 Chris Tessaglia-Hymes, Cornell University 2017 South Taranaki Bight 3
 2004, 2008,
 Department of Conservation, Cook Strait Survey Cook Strait 13
 2011, 2013, 2014
 Eric De Boer, Department of Conservation Westport Office 2015 Westport 4
 Westport, Raoul
 Olive Andrews, Silversea Expeditions 2015 5
 Island
 Petroleum Geo-Services Seismic Survey 2016 South Taranaki Bight 2
 Don Neale, Department of Conservation Technical Advisor 2015 Westport 1
 Theresa Kirchner, Oregon State University 2013 Kaikoura 1
 Todd Energy Survey 2013 South Taranaki Bight 3
 University of Auckland 2010 Hauraki Gulf 2
 2010, 2012,
 Whale Watch Kaikoura Kaikoura 13
 2013, 2014, 2016
 Wings Over Whales 2016 Kaikoura 1
 Bonney Upwelling,
 Australian Marine Mammal Centre 2012 56
 South Australia
 1998-2000, Bonney Upwelling,
 Blue Whale Study, Inc. 139
 2003-2011 South Australia
 East Coast of
 Brian Miller, Australian Antarctic Division 2014 2
 Australia
 Australian Marine Mammal Centre (Double et al. 2013) 2013 Antarctica 65

Genetics: Tissue (n = 19) and fecal samples (n = 7) collected in the STB during 2014 and 2016 were analyzed along
with 14 individuals identified from beachcast or biopsy samples held at the New Zealand Cetacean Tissue Archive
(NZCeTA) (described in Torres et al. 2015).

Total genomic DNA was extracted from skin tissue following standard proteinase K digestion and
phenol/chloroform methods (Sambrook et al. 1989), modified for small samples (Baker et al. 1994). Fecal samples
were first filtered through a 0.4 µm Cyclopore polycarbonate track etched membrane filter (GE Healthcare Life
Sciences). The filter was transferred to a 2 ml tube and frozen in 800 µl of Longmire’s buffer (Longmire et al. 1997)
until extraction. Total genomic DNA was extracted from the filtered samples using the phenol/chloroform method
described above for skin samples with an extended mixing period during the first PCI step to ensure the filter had
completely dissolved. Initial attempts to amplify DNA from fecal samples failed, suggesting the presence of PCR
inhibitors. Affected DNA was cleaned with a OneStepTM PCR inhibitor removal kit (Zymo Research), in some cases
two applications were necessary to remove all inhibitors.

All samples were used for a standard DNA profile, including molecular sex identification, amplification and
sequencing of the mitochondrial DNA (mtDNA) control region, and microsatellite genotyping followed Sremba et

 4
J. CETACEAN RES. MANAGE.

al. (2012). Control region sequences were edited to a 410 bp consensus region (Sequencher v4.6). Individual
haplotypes were aligned with previously published blue whale haplotypes downloaded from GenBank (LeDuc et al.
2007, Sremba et al. 2012, Torres-Florez et al. 2014). Microsatellite alleles were analyzed using Genemapper v4.0
(Applied Biosystems) with peaks visually inspected. Replicate samples of individual whales were identified using
CERVUS v3.0.3. Mismatches of up to three loci were allowed to prevent false exclusion due to allelic dropout and
other genotyping errors (Waits et al. 2001). Electropherograms from mismatching loci were reviewed and corrected
or repeated.

ARLEQUIN v3.5.1.2 (Excoffier & Lischer 2010) was used to calculate haplotype diversity and to test for mtDNA
haplotype differentiation between STB and NZCeTA samples, and among the combined New Zealand samples, and
three other populations of blue whales: the Southern Ocean (n=183, Sremba et al. 2012), the Southeast Pacific
including the Chilean coast (n=113, Torres-Florez et al. 2014), and Australia (n=28, LeDuc et al. 2007; n=89, Attard
et al. 2015) populations. We note that LeDuc et al. (2007) refers to the ‘Indian Ocean’ population, including samples
collected from the southern and western coasts of Australia, the southwest Indian Ocean near Madagascar and from
near the Maldives. Here we use only the samples from the southern and western coasts of Australia. We also note
that Australian samples from LeDuc et al. (2007) are reportedly included in the total of n = 89 samples in Attard et
al. (2015). The significance of differences in haplotype diversity between the New Zealand dataset and the other
blue whale populations were tested using a permutation procedure available in R, Genetic_diversity_diffs v1.0.4
(Alexander et al. 2016).

Acoustics: Low-frequency acoustic data, including blue whale vocalizations, were collected using Marine
Autonomous Recording Units (MARUs) (Calupca et al. 2000). Distances between surveyed sites ranged between
52.34 km and 192.47 km. Data have been collected continuously over the course of two deployments at each
surveyed site: Deployment 01 (January 22nd 2016 - July 1st 2016) and Deployment 02 (July 10th 2016 – December
30th 2016). MARU recordings cover the 10 Hz to 800 Hz frequency range (2 kHz sampling rate).

Data were examined for the acoustic occurrence of the New Zealand blue whale call type (McDonald et al. 2006)
(Fig. 2) using Raven Pro 1.5 (Cornell Lab of Ornithology, Ithaca, USA). Data were visually reviewed in 15-minute
spectrograms, with a 10-250 Hz frequency bandwidth, a 512-point Hann window, and 50% overlap. Nearly 300
days of recordings (MARU 1: n = 298; MARU 2: n = 299; MARU 3: n = 299; MARU 4: n = 295; MARU 5: n =
302) were browsed in entirety, and the daily acoustic presence/absence of the New Zealand blue whale call type was
annotated for each MARU location.

 5
J. CETACEAN RES. MANAGE.

Figure 2. Example spectrogram of the New Zealand blue whale call type recorded at surveyed site MARU 2 on
April 22nd, 2016 (1024-point FFT, Hann window, 90% overlap). The call type consists of four parts (A-D), and
often occurs in long sequences.

Percent monthly presence for each site was normalized for recording effort by dividing the number of days
containing the New Zealand blue whale call type by the number of recording days analyzed within the month:
 ℎ ℎ
Percent Monthly Presence for Each Site (%) = * 100
 ℎ

The monthly site presence of all recording sites within and outside of the STB was averaged for each month, and
reported as an average monthly array presence with standard error.

UAS flights and photogrammetry: Photogrammetry images of blue whales to derive metrics of body condition
(length, width, health, pregnancy, lactation) were collected using a UAS (DJI Phantom 3), which was launched from
the aft deck of the research vessel when weather conditions and whale behavior were favorable. The UAS was then
directed to the whale and flown no lower than 30 m above the water over the whale with the camera in nadir. For
calibration purposes, the UAS was flown above an object of known length (e.g., the transom of the research vessel
or a board) before each flight at variable altitudes.
Still images of the whales and the scaling object were extracted from UAS video using the Windows program VLC
Media Player, and stills were only taken when the object of interest was in the center of the frame. All stills of the
whales were taken when the animal was at the surface and their body was stretched out to its full length and not bent
or curved. The known altitude of the camera during the capture of each still image was used to scale image pixel
length to a metric unit using the new MATLAB-based program Whale Calibration Object Measurement (Burnett et
al., In Review). Whale length measurements from the 2016 UAS flights were then made using the new MATLAB-
based program Whale Measurement (Burnett et al., In Review).
Stable isotope analysis: Biopsy samples collected from blue whales during the 2014 and 2016 field seasons, and a
homogenate sample of several individual krill (n = 25) collected in 2014, underwent bulk carbon and nitrogen stable
isotope analysis. This analysis was carried out on a Delta V Plus continuous flow isotope ratio mass spectrometer
linked to a Flash 2000 elemental analyzer using a MAS 200 R autosampler (Thermo-Fisher Scientific, Bremen,
Germany) at the NIWA Ecological Stable Isotope Laboratory in Wellington, New Zealand. The δ15N and δ13C
values were compared between years to examine any shifts in feeding ecology between the two years.
 6
J. CETACEAN RES. MANAGE.

New Zealand-wide blue whale sightings: A total of 553 opportunistically and systematically collected blue whale
sightings across all New Zealand waters have been compiled. Our project represents the only directed blue whale
survey in New Zealand waters to-date. Therefore, other sources of blue whale sightings include those compiled in
the New Zealand Department of Conservation sightings database, reported by marine mammal observers during
seismic surveys, and opportunistic sightings reported during surveys for other marine mammals (Table 1). The 553
blue whale sightings were reported between 1980 and 2017; 513 had precise sighting coordinates, whilst for the
remainder of the sightings regional locations were provided. The temporal and spatial extent of these sightings were
examined to conduct a preliminary assessment of blue whale distribution within New Zealand waters.

 7
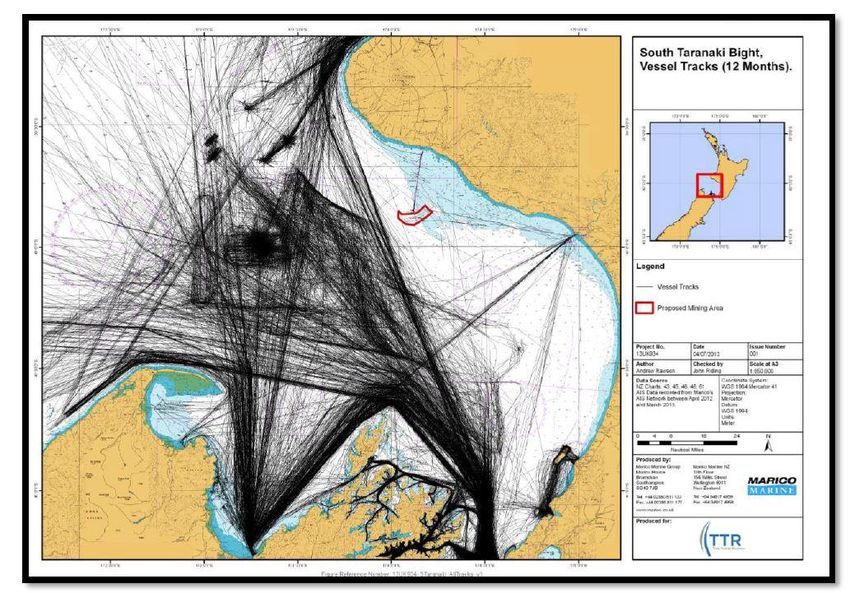
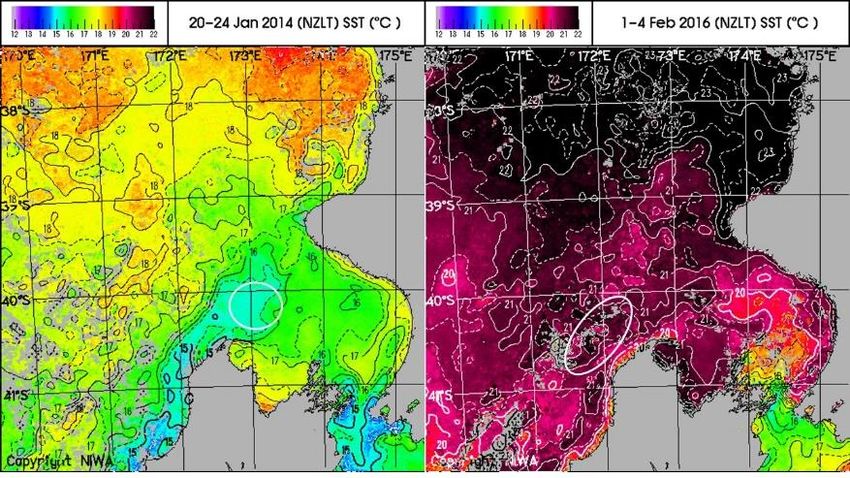
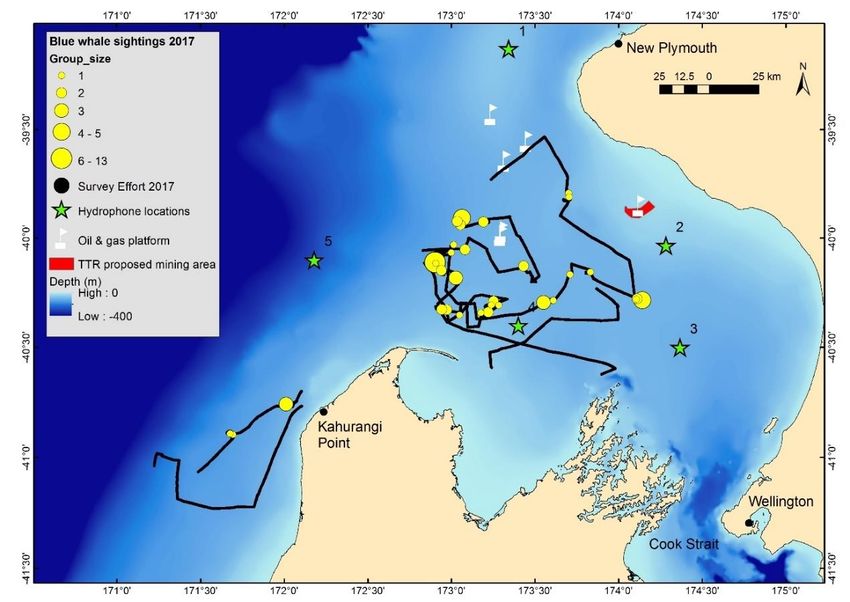
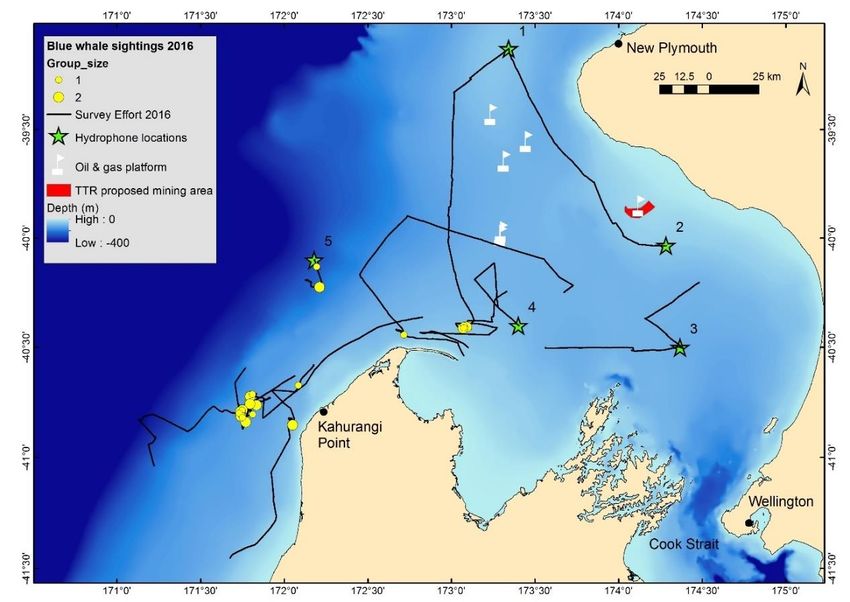
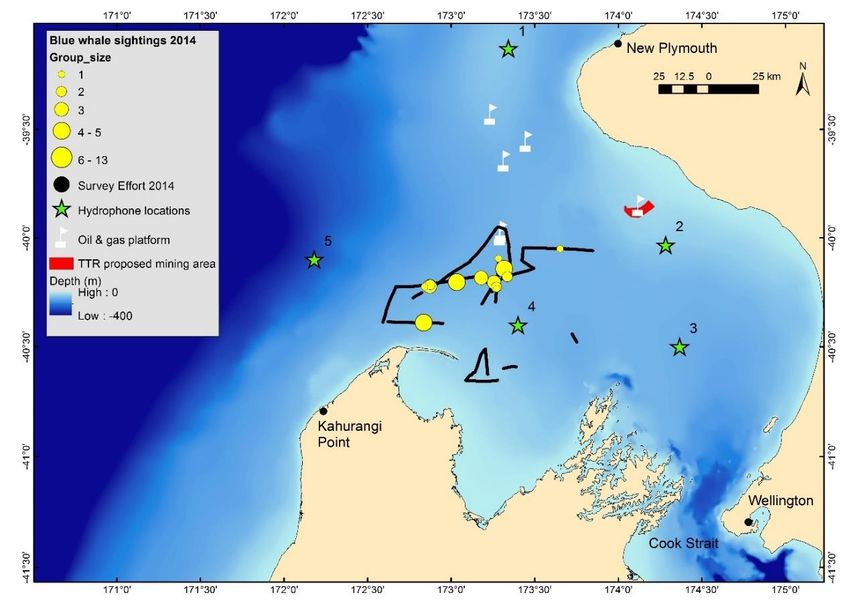
RESULTS
Field efforts: Each survey year yielded new insights and data regarding this population of blue whales in New
Zealand. Despite half as much survey effort in 2014 compared to 2016 and 2017, all years of effort have provided a
robust dataset for further analysis of ecology, biology, and population parameters (Table 2).
Table 2. Summary of field effort and data collected during the blue whale research program in the STB during the
three years of study, and the cumulative total.
 2014 2016 2017 Total
 Survey days 5 10 9 24
 Survey effort (nm) 170 1,490 906 2,566
 Cetacean sightings 14 39 48 101
 Blue whale sighting events 10 22 32 64
 Number of blue whales sighted 50 33 68 151
 Photos 2,326 4,000 9,742 16,068
 Mother/calf pairs 1 4 3 8
 Biopsy samples 10 10 23 43
 Fecal samples 2 8 9 19
 UAS flights 0 8 23 31
 Number of whales flown over 0 6 26 32
 CTD casts 25 84 87 196
 Echosounder hours 21 44 91 156
 Krill samples 1 0 1 2

Distribution patterns: Blue whales were observed in the STB region in all survey years. In 2014 and 2017 most
observations of blue whales were made within the central region of the STB, while in 2016 more blue whales were
observed in the western region of the STB, west of Kahurangi Point (Fig. 3). Preliminary oceanographic assessment
leads us to believe that this shift in blue whale distribution during 2016 was due to a strong El Niño event that
caused elevated water temperatures across the region, which were notably higher than in both 2014 and 2017 (Fig.
4). The water temperatures in the STB reached 10°C warmer in 2016 than in 2014 or 2017. Blue whales were mostly
seen off the west coast in 2016. In comparison, during 2014 and 2017 blue whale sightings were concentrated in the
cold plume of upwelled water that is generated off of Kahurangi Point and curves around Farewell Spit into the STB
(Shirtcliffe et al. 1990), as can be seen in Figure 4a and 4c. Additionally, few krill were observed at the surface and
on the echosounder in 2016 compared to 2014 and 2017.

 8
9

a

b

 9
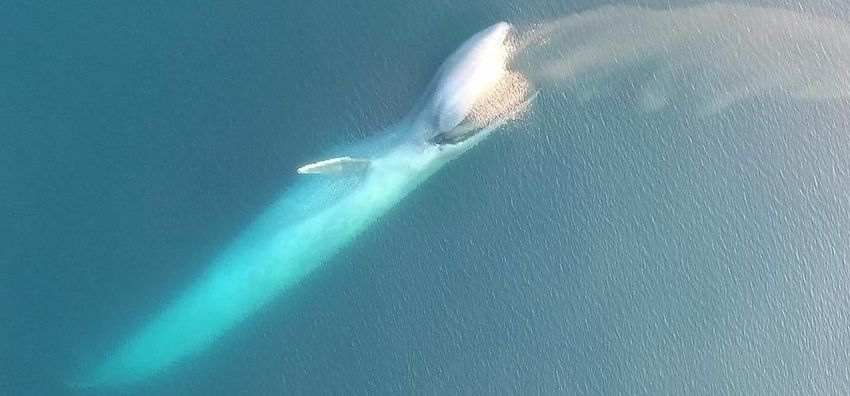
10

 c

Figure 3. Blue whale vessel survey effort and location of sightings in the STB region during (a) 2014, (b) 2016,
and (c) 2017. The deployment locations of the five MARU hydrophones are denoted. Oil and gas rigs and the
area of proposed seabed mining are also identified.

 a b c

Figure 4. A comparison of satellite images of sea surface temperature (SST) in the STB region between late
January 2014 (a), early February 2016 (b), and late January 2017 (c). The white circles on each image denote
where the majority of blue whales were encountered during each field season.

Behavioral observations: The most commonly observed blue whale behavior during our survey effort was
foraging. This behavior was characterized by whales staying in one area, moving slowly, diving and changing
direction frequently, and occasionally lunging at the surface. Krill patches were also evident in the surface
waters and on the echosounder display. During surface lunges, the pectoral fin and fluke were usually visible
above the water, and sometimes the throat pleats were visible as well. Additionally, we observed surface lunge
behavior from video footage captured by the UAS (Fig. 5; video viewable here:
https://www.youtube.com/watch?v=YARe1etnNZE&feature=youtu.be). During this sequence, the whale
approached a dense patch of krill (Nyctiphanes australis), rolled on its left side, and then rolled completely onto
its right side to lunge and engulf the krill. The whale subsequently swam past numerous patches of krill that were
smaller in size without lunging at them.

 10
11

Figure 5. UAS still image of a blue whale surface lunge feeding. The krill patch is also visible in this image; the
species of krill is presumed to be N. australis.

Eight mother and calf pairs were identified in the STB region during our survey effort over the total three year’s
observations, and one pair was seen multiple days in a row in the same area in 2017. In 2016, the UAS was
flown over a calm mother and calf pair and we recorded 10 minutes of apparent nursing behavior
(https://www.youtube.com/watch?v=9hpfVmP0hJ4). It is believed that this is the first aerial footage of this
behavior in a baleen whale. The calf can be seen alternating between surfacing to breath and going under the
mother and stationing at the approximate location of the mammary slits (Fig. 6). The pair were not
moving/traveling in the water so it is unlikely that this position was facilitating transit, for example by using the
echelon position.

 a b

Figure 6. Still images captured from the UAS video of the mother-calf pair nursing in the South Taranaki Bight
region. The pair surface to breath (a) and then the calf stations under the mother (b). The calf’s pectoral fins and
flukes are visible under the mother.

In 2016, we observed a pair of blue whales racing for approximately 30 minutes at 15-18 knots, after which they
slowed with occasional bursts of speed. The two animals stayed very close together and one animal was smaller
than the other (Fig. 7). Genetic analysis of biopsy samples of these racing individuals determined that both were
female.

 11
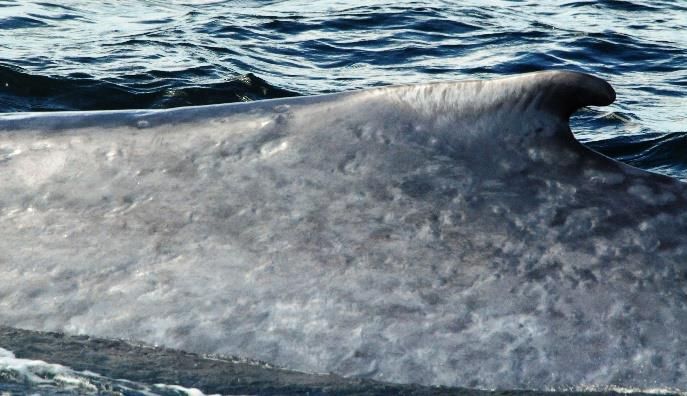
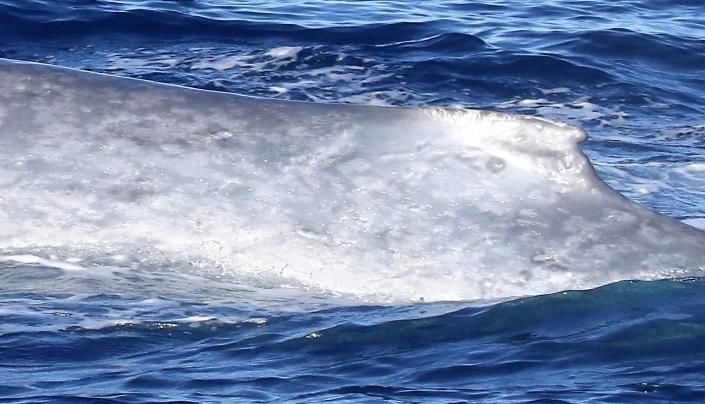
12

Figure 7. Two blue whales engaged in racing behavior in the STB during the 2016 survey.

Two blue whales with apparent deformities were observed, one in 2016 and one in 2017 (Fig. 8). Both whales
had a dish-like depression behind the blowhole and an unusual swimming pattern in which they appeared to
“plow” through the water. The whale observed in 2016 also had a large protrusion on its right hand side, and its
spine was visible indicating that the whale was likely malnourished.

 a b

Figure 8. Two whales with apparent malnourishment and/or deformities seen in (a) 2016 and (b) 2017 in the
STB.

Photo-Identification: Over the three years of survey effort in the STB region, 107 blue whales were observed. Of
those, a total of 88 unique individual blue whales were identified. A discovery curve showing the cumulative
number of identified individuals for each sequential day of survey effort continues to increase with data
collection efforts (Fig. 9), indicating that we have not identified most individuals in this population yet.

Figure 9. Photo-identification discovery curve from our survey effort, showing the cumulative number of photo-
identified individuals with each sequential day of survey effort.
 12
13

With all blue whale photo-identification records in New Zealand (Table 1) compiled with our images captured
during survey effort in the STB region, our New Zealand blue whale photo-identification catalog consists of 140
unique individuals. Eight matches have been made between years within New Zealand waters (Table 3), and 16
whales have been seen multiple times within the same year. The inter-annual matches included one individual
(NZBW031) that was seen in three different years in three different regions of New Zealand, and with a different
calf each time. Another noteworthy resighting is of NZBW004, which was seen by our team in 2014 and again in
2016. In 2014 the whale appeared to be in good health (Fig. 10a), however in 2016 this whale had apparent
deformities, including a collapsed dorsal fin, a dish-like depression behind the blowhole, and a very large
protrusion which may have been a tumor or vessel strike injury (Figs. 8a, 10b). This match was initially made
via genetics, as visual appearance of the animal had changed drastically, hindering photo-id matching. Yet,
closer photo-id comparison of images between sightings has also confirmed this match (Fig 10).
No photo-identification matches have been made between a blue whale sighted in New Zealand waters with a
cataloged photo of a blue whale sighted in Australian or Antarctic waters (n = 262 individuals; Table 1).

Table 3. New Zealand blue whale photo-identification matches made between years.
 Sighting 1 Sighting 1 Re-sighting Re-sighting
 Whale ID Sighting 1 Re-sighting
 Location Catalog Location Catalog
 Oregon State
 South
 University of University,
 NZBW031 8-Nov-2010 Hauraki Gulf 28-Jan-2014 Taranaki Bight
 Auckland GEMM Lab

 Whale Watch
 Kaikoura,
 11-Aug-2016 Kaikoura
 Wings Over
 Whales
 Department of
 Oregon State
 Conservation South
 NZBW003 27-Jun-2011 Cook Strait 23-Jan-2016 University,
 Cook Strait Taranaki Bight
 GEMM Lab
 Survey
 Oregon State
 South Todd Energy South
 NZBW023 22-Feb-2013 5-Feb-2016 University,
 Taranaki Bight Survey Taranaki Bight
 GEMM Lab
 Oregon State Oregon State
 South South
 NZBW004 25-Jan-2014 University, 26-Jan-2016 University,
 Taranaki Bight Taranaki Bight
 GEMM Lab GEMM Lab
 Oregon State Chris
 South South
 NZBW008 1-Feb-2016 University, 5-Jan-2017 Tessaglia-
 Taranaki Bight Taranaki Bight
 GEMM Lab Hymes
 Australian
 Oregon State
 Marine South
 NZBW011 31-Jan-2013 Westport 2-Feb-2016 University,
 Mammal Taranaki Bight
 GEMM Lab
 Centre
 Oregon State Oregon State
 South South
 NZBW018 5-Feb-2016 University, 19-Feb-2017 University,
 Taranaki Bight Taranaki Bight
 GEMM Lab GEMM Lab
 Department of
 Conservation Whale Watch
 NZBW078 27-Jun-2008 Cook Strait Jan-2013 Kaikoura
 Cook Strait Kaikoura
 Survey

 13
14

 a b

Figure 10. Blue whale NZBW004 photographed in (a) 2014 and (b) 2016 when it had apparent deformities (also
see Fig. 8a). Note how the dorsal fin has collapsed in the photo taken in 2016. Genetic identification confirms
this individual match. Matching photo-id skin pigmentations are highlighted in color-matched boxes.
Genotype identification and population comparison: All 20 STB biopsy samples, and six of the seven fecal
samples amplified for 14 or 15 microsatellite loci and were retained as part of the quality controlled dataset.
Matching of these genotypes identified four animals sampled twice by biopsy within sampling years 2014 and
2016 (confirmed by photo-identification), and three animals (from four samples) sampled by both biopsy and
fecal collection (in 2016). After removing replicates, genotypes of the nine individuals sampled during the 2016
field season were compared to genotypes of the 12 individuals previously biopsied (nine from 2014 STB survey
and three from NZCeTA). This comparison identified one individual sampled in the STB in both the 2014 and
2016 field seasons (Fig. 10). After removing this replicate, the New Zealand blue whale genetic catalogue (i.e.,
the DNA register) contains 31 individuals, which include 12 beachcast animals, 17 animals identified from
biopsy samples, and two identified from fecal samples.

Control region haplotypes were sequenced from all eight of the new individuals sampled in 2016 (Table 4). Only
two haplotypes were identified, ‘haplotype d’ and ‘haplotype e’, both previously described in this region (Torres
et al. 2015). There was no significant difference in mtDNA haplotype frequencies between the NZCeTA and the
STB collections (FST= 0.00, p=0.88). Comparison of the haplotype frequencies from the combined New Zealand
collection to the Southern Ocean and Southeast Pacific populations showed highly significant differences for
both FST and ΦST, but there was no significant difference between the New Zealand collection and either of the
Australian datasets (Table 5). However, the haplotype diversity of the New Zealand dataset (h=0.443, ± 0.105,
Table 4) was significantly lower than any of the other blue whale populations tested (p
15

Table 5. Results of pairwise comparisons of mitochondrial DNA haplotype (FST) and nucleotide (ΦST)
diversity between New Zealand blue whales and three other populations: (1) The Southern Ocean, (2) the
Southeast Pacific including Chile, Ecuador and Peru, and (3) two publicly available datasets from Australia
(LeDuc et al. 2007, Attard et al. 2015). Mitochondrial DNA information from 31 New Zealand individual blue
whales was used for these comparisons. Haplotype diversity for the New Zealand dataset is 0.443 ± 0.105. Note:
LeDuc et al. 2007 refers to the ‘Indian Ocean’ population, including samples collected from the southern and
western coasts of Australia, the southwest Indian Ocean near Madagascar and from near the Maldives. Here we
use only haplotypes from the samples from the southern and western coasts of Australia.

 #haps
 Sample # hap. diversity P P
 Dataset shared FST ΦST
 size haps (h) value value
 with NZ
 Southern
 183 52 1 0.969 ± 0.004 0.233 < 0.001 0.314 < 0.001
 Ocean
 Southeast
 113 19 1 0.869 ± 0.012 0.280 < 0.001 0.356 < 0.001
 Pacific
 Australia
 (LeDuc et al. 28 10 4 0.709 ± 0.091 0.015 0.162 0.000 0.586
 2007)
 Australia
 (Attard et al. 89 14 4 0.680 ± 0.053 0.022 0.072 0.009 0.171
 2015)

Figure 11. Haplotype frequencies of sampled New Zealand blue whales and the two Australian datasets (LeDuc
et al. 2007, Attard et al. 2015).

Acoustics: In the approximately 11 months of acoustic data collected during hydrophone deployments 01 and 02,
the New Zealand blue whale call type was detected regularly (> 69% daily occurrence) at each of the five
surveyed sites (Fig. 3) within and surrounding the STB region (Table 6, Fig. 12). Blue whales were most
frequently detected at survey sites MARU 1 and 5, with 96.6% and 99.7% daily detection of acoustic presence,
respectively (Table 6, Fig. 12).

Table 6. Percent daily occurrence of the New Zealand blue whale call type at each surveyed site within and
surrounding the South Taranaki Bight, New Zealand.

 # Recording Days # Days Acoustic
 Site Percent Daily Presence
 Analyzed Presence
 MARU 1 298 288 96.6%
 MARU 2 299 232 77.6%
 MARU 3 299 205 68.6%
 MARU 4 295 262 88.8%
 MARU 5 302 301 99.7%

 15
16

Figure 12. Daily acoustic presence of the New Zealand blue whale call type at all five survey sites. Colored dots
indicate presence; black rectangles indicate no data were collected or analyzed during that period at that survey
site.

With acoustic detections averaged across the entire hydrophone array, blue whales were acoustically detected
within and surrounding the STB ≥70% days per month during January-August and November 2016 (Fig. 7).
Average blue whale vocal presence decreased to 50.7% days per month sampled in September 2016, and
increased to 65.8% in October 2016 (Fig. 13). We believe the dip in blue whale acoustic detections during
January and February 2016 is due to the unfavorable oceanographic conditions in the central portion of the STB
caused by the strong El Niño event and elevated water temperatures (Fig. 4), which corresponds to a lack of
visual sightings detected during the same time period (Fig. 3b).

Figure 13. Blue whale average array monthly acoustic presence across all survey sites, ± standard error.

 16
17

UAS flights and photogrammetry: In 2016 the UAS was flown over six blue whales: four adults and two calves.
The photogrammetric measurements determined that mean whale length was 19.92 ± 0.51 m for the adults
(mean ± standard error, n=4) and 14.44 ± 1.19 m for the calves (mean ± SE, n=2).

Stable Isotope Analysis: In comparison to the stable isotope results from samples collected during the 2014 field
season in the STB, the 2016 δ15N values are similar, yet the δ13C values are higher (Fig. 14). This result indicates
that the blue whales had different feeding ecology between years, which may have been affected by the El Niño
oceanographic conditions in 2016. Analysis of the krill and blue whale tissue samples collected in 2017 will help
to elucidate blue whale foraging patterns and their relationship to environmental patterns.

Figure 14. Stable isotope results from blue whale biopsy tissue samples collected from blue whales in 2014 and
2016, and a homogenate krill sample in 2014.

Opportunistic Sightings: Compilation of opportunistic blue whale sighting records in New Zealand waters reveal
that blue whales have been reported during every month of the year (Fig. 15). November, January, February, and
March are the months with the most sightings, and the least sightings were reported during the winter months. It
is important to note that many of these sightings do not distinguish between ‘Antarctic’ and ‘pygmy’ blue
whales. It is also worth emphasizing that this monthly distribution is composed of uneven survey effort, and
therefore does not necessarily reflect the actual temporal distribution of blue whales in New Zealand waters.
Rather, it is an attempt to tabulate when sightings have been reported, even though they were collected in a non-
systematic fashion.

Figure 15. Cumulative number of reported blue whale sightings per month from all sighting records in New
Zealand waters (n=553), uncorrected for survey effort and absence data (see text).
 17
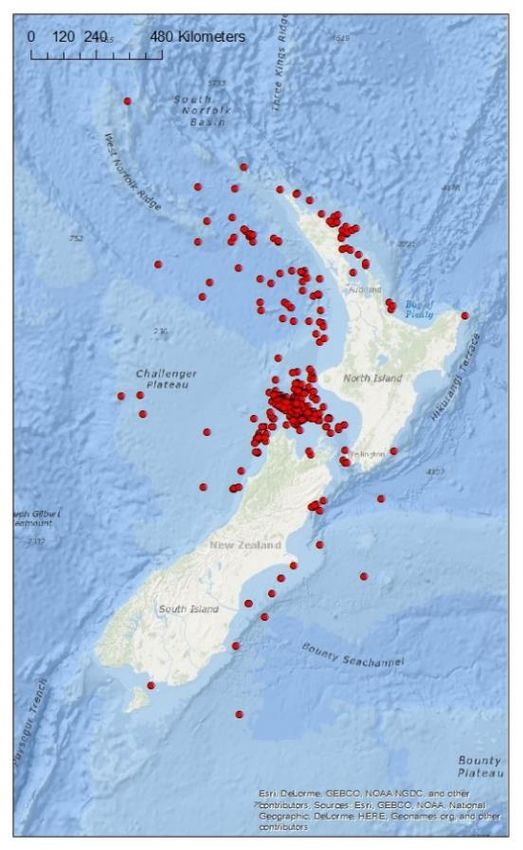
18

Blue whale sightings have been reported broadly across the New Zealand Exclusive Economic Zone (Fig. 16).
The majority of reported blue whale sightings are from the STB region. Numerous reports are also clustered
around the north end of the North Island. There are virtually no reports from the waters to the southwest of the
South Island, although relatively few vessels transit this area. It is important to note that many of these sightings
do not distinguish between ‘Antarctic’ and ‘pygmy’ blue whales. As with the temporal distribution of these
sightings (Fig. 15), it is important to emphasize here that survey effort was uneven and non-systematic.
Therefore, Figure 16 does not reflect the true spatial distribution of blue whales in New Zealand because no
account has been made for absence and effort data.

Figure 16. Geographic distribution of all reported sightings of blue whales within New Zealand waters,
including our survey effort in the STB region and opportunistic sightings records reported between 1980 and
2017 (n=513).

DISCUSSION
Based on our multiple observations of blue whale feeding behavior, acoustic detection of blue whale feeding
calls, and identification of N. australis – a known prey source for pygmy blue whales (Gill 2002), we are
confident that the STB region is a blue whale foraging ground as hypothesized by Torres (2013). The frequent
detection of the New Zealand blue whale call indicates that the STB region may also be used for reproductive
and social behaviors. Additionally, the numerous sightings of mother and calf pairs and the documentation of
nursing behavior provide strong evidence that the STB region is important for nursing and calf-rearing.
Many lines of evidence presented here lead us to now hypothesize that these whales form a New Zealand
population of blue whales that are either resident or semi-resident in New Zealand waters:
 (1) The use of the STB region by blue whales for multiple critical life history functions.
 (2) Multiple photo-identification matches of individual blue whales within New Zealand waters across
 multiple years (maximum 6 years).
 (3) A lack of a photo-identified match between any blue whale observed in New Zealand waters with any
 individual observed elsewhere (Australia or Antarctica).
 (4) Genetic identification of a new haplotype currently undescribed in the Australian pygmy blue whale
 population, as well as significantly lower haplotype diversity compared to the Australian population.
 (5) Acoustic detection of the New Zealand call type in the STB region during all 11 months for which
 recordings have been analyzed.
 (6) Year-round records of blue whale sightings in New Zealand waters.

 18
19

Previous studies also support the hypothesis of a New Zealand population of blue whales. The New Zealand blue
whale call type has been detected in New Zealand coastal waters outside the STB region (Kibblewhite et al.
1967, McDonald 2006, Miller et al. 2014). Additionally, blue whale foraging behavior has been opportunistically
reported in a few other locations around New Zealand – yet with reduced consistency as compared to the STB
region – (Torres 2013, Olson et al. 2015), suggesting that blue whales may occasionally utilize other productive
areas in New Zealand’s coastal waters in addition to the STB region.
Currently, blue whales are listed as ‘Migrant’ under the New Zealand Threat Classification System (Baker et al.
2016). If our work has identified a New Zealand population of blue whales as indicated by our preliminary
analyses, our results may be used to update the threat classification accordingly.
The STB region is New Zealand’s most industrially active marine region; it is the site of active oil and gas
extraction platforms, ongoing seismic surveys for more oil and gas reserves, extensive vessel traffic (Fig. 17),
fishing activity, and a proposed seabed mining operation which would extract 50 million tons of iron sands from
the seafloor over a 35-year period. Cumulative and isolated impacts on blue whales and their habitat from these
activities should be carefully considered by environmental managers. In particular, elevated anthropogenic ocean
noise may disturb blue whale behavior and physiology, with consequences for individual health and population
viability. For instance, blue whales in the Gulf of St. Lawrence Estuary, Canada alter their acoustic behavior in
the presence of seismic survey activity by calling more frequently to compensate for elevated ambient noise
conditions (DiLorio & Clark 2010). Such increased calling can have energetic consequences for cetaceans (Holt
et al. 2015). Furthermore, low-frequency noise from shipping traffic has been shown to increase stress levels in
North Atlantic right whales, Eubalaena glacialis (Rolland et al. 2012). Habitat displacement is also a significant
concern, whether caused by changes in ocean noise, prey distribution, or pollution. Our work demonstrates the
importance of the STB as a blue whale foraging ground, justifying concern regarding accessibility to efficient
feeding opportunities. Additionally, heavy vessel traffic across the STB region (Fig. 17) poses ship strike risk to
blue whales, as seen in other regions of space-use conflict between baleen whales and vessel traffic (van der
Hoop & Vanderlaan 2012, Constantine et al. 2015).

Figure 17. Vessel traffic patterns in the South Taranaki Bight region during 12 months from April 2012 through
March 2013, derived from Automated Identification System (AIS) data. Map produced by Marico Marine NZ
Ltd. for Trans-Tasman Resources Ltd (Rawson & Riding 2015).

 19
20

The combination of threats posed by human activities in the STB, the significant use of the region by blue
whales, and knowledge gaps about this population warrants continued evaluation of blue whale ecology, health,
and response to anthropogenic impacts in the STB and New Zealand. Specifically, by gaining a better
understanding of blue whale spatial and behavioral ecology the STB, it may be possible for industrial impacts on
blue whales to be mitigated by dynamic management of activities in the area.

FUTURE RESEARCH
With mounting evidence that blue whales spend a significant amount of time in the STB, and potentially
represent a distinct New Zealand population with strong residency patterns, a robust abundance estimate of this
blue whale population is critical information for management purposes. Using both photo-identification and
genetics data, we intend to produce capture-recapture abundance estimates for blue whales in the STB region and
in New Zealand waters.
Genetic analysis will continue for the biopsy and fecal samples collected during the 2017 field season, and 2017
samples will be compared with the results presented in this report.
The hydrophone array will record blue whale vocalizations through early 2018, with a turnaround scheduled for
June 2017 to recover data and replace battery supplies. The acoustic analysis from the hydrophone array will
continue as the next portion of the data are recovered. Once the full two-year dataset is in-hand, we will
investigate spatial and temporal patterns of blue whale call detection. Additionally, we will investigate relative
call density in relationship to the sources and levels of ambient anthropogenic noise present in the STB
soundscape.
We are currently processing the UAS images from 2016 and 2017 for photogrammetric analyses. With this
photogrammetric analysis, we will assess the health and reproductive status of these whales (e.g., malnourished,
pregnant, lactating).
Hormone analysis (progesterone, testosterone, cortisol) of both blubber and fecal samples is underway through
collaboration with colleagues at the Seattle Aquarium. We will assess how hormone levels vary between years
and demographic and health status of individuals. The assessment of cortisol levels will allow us to evaluate
stress levels in sampled blue whales; The pairing of cortisol levels with other hormone levels, morphometric data
from photogrammetry analysis, environmental conditions from oceanographic data collection, and ambient noise
data from the hydrophone array will allow us to identify potential contributors to elevated stress, such as
pregnancy, seismic survey noise, or malnourishment.
Stable isotope analysis will continue on the blue whale biopsy samples and krill sample collected in 2017. These
δ15N and δ13C values will be compared with the 2014 and 2016 datasets to investigate shifts in foraging ecology
between years.
Blue whale species distribution models (SDMs) will be generated to better understand New Zealand blue whale
ecology and to enhance predictability of occurrence across the region. SDMs will be generated at two different
scales: (1) within the STB region, and (2) across the New Zealand Exclusive Economic Zone (EEZ). Using the
oceanographic and hydroacoustic prey data collected in situ during our three seasons of survey effort in the STB,
we will develop a fine-scale SDM of blue whale habitat use in the STB relative to oceanographic patterns (e.g.,
water temperature, mixed layer depth, maximum fluorescence) and prey availability (e.g., krill density, depth,
and patch size). Remotely sensed measurements of SST and chl-a will also be incorporated into this SDM to
assess relevance and contribution at this fine spatial and temporal scale relative to the larger scale New Zealand
wide SDM based solely on remotely sensed data and using all blue whale sighting records (opportunistic and
systematic). Through these multi-scale SDMs we aim to enhance the predictability of blue whale distribution in
the STB and across the New Zealand EEZ to improve conservation management decisions regarding industrial
and other anthropogenic activities, including climate change.

ACKNOWLEDGEMENTS
Funding for this project was provided by The Aotearoa Foundation, The National Geographic Society Waitt
Foundation, The New Zealand Department of Conservation, The Marine Mammal Institute at Oregon State
University, The National Oceanographic and Atmospheric Administration’s Cooperative Institute for Marine
Resources Studies (NOAA/CIMRS), Greenpeace New Zealand, OceanCare, Kiwis Against Seabed Mining, The
International Fund for Animal Welfare, The Thorpe Foundation, and an anonymous donor. The project was
accomplished through the dedicated work and support of many individuals including the crew of the RV Star
Keys (Western Work Boats, Ltd.) and the RV Ikatere (NIWA, Ltd.), Kim Bernard, Craig Hayslip, Kathy Minta

 20
21

and Minda Stiles from Oregon State University, Richard Nelson, Matt Walkington, and Brett Grant from NIWA,
Shawn Larson and Amy Green from the Seattle Aquarium, Ian Angus, Laura Boren and Dave Lundquist from
the New Zealand Department of Conservation, and Christopher T. Tessaglia-Hymes and Edward James Moore
III from the Bioacoustics Research Program at Cornell University. Blue whale sightings and photo-identification
contribution is also recognized from Deb Glasgow, Nadine Bott, Terry Visser, Helen McConnell, Hannah
Hendricks, Dan Govier, Deanna Clement, Roger Williams, Olive Andrews, Eric de Boer, Tony Crocker, Haley
Baxter, Don Neale, Theresa Kirchner, Chris Tessaglia-Hymes, Viraj Gamage, and Aneke Bowker.

REFERENCES
Alexander, A., Steel, D., Hoekzema, K., Mesnick, S.L., Engelhaupt, D., Kerr, I., Payne, R., and Baker, C.S.
 2016. What influences the worldwide genetic structure of sperm whales (Physeter macrocephalus)? Mol.
 Ecol. 25:2754–2772.
Attard, C.R.M., Beheregaray, L.B., Jenner, K.C.S., Gill, P.C., Jenner, M.M., Morrice, M.G., Teske, P.R., and
 Mo, L.M. 2015. Low genetic diversity in pygmy blue whales is due to climate-induced diversification
 rather than anthropogenic impacts. Biol. Lett. 11:5.
Baker, C.S., Chilvers, B.L., Childerhouse, S., Constantine, R., Currey, R., Mattlin, R., van Helden, A.,
 Hitchmough, R., Rolfe, J. 2016. Conservation status of New Zealand marine mammals, 2013.
Baker, C.S., Slade, R.W., Bannister, J.L., Abernethy, R.B., Weinrich, M.T., Lien, J., Urban, J., Corkeron, P.,
 Calmabokidis, J., Vasquez, O. 1994. Hierarchical structure of mitochondrial DNA gene flow among
 humpback whales Megaptera novaeangliae, world-wide. Mol. Ecol. 3:313–327.
Burnett, J.D., Lemos, L.S., Barlow, D.R., Wing, M.G., Chandler, T.E., Torres, L.G. In Review. Estimating
 morphometric attributes on baleen whales using small UAS photogrammetry: A case study with blue and
 gray whales. Mar. Mammal Sci.
Calupca, T.A., Fristrup, K.M., Clark, C.W. 2000. A compact digital recording system for autonomous
 bioacoustic monitoring. J. Acoust. Soc. Am. 108:2582.
Constantine, R., Johnson, M., Riekkola, L., Jervis, S., Kozmian-Ledward, L., Dennis, T., Torres, L.G., Aguilar,
 de Soto, N. 2015. Mitigation of vessel-strike mortality of endangered Bryde’s whales in the Hauraki Gulf,
 New Zealand. Biol. Conserv. 186:149–157.
DiLorio, L., Clark, C.W. 2010. Exposure to seismic survey alters blue whale acoustic communication. Biol. Lett.
 6:51–54.
Double, M.C., Barlow, J., Miller, B.S., Olson, P.A., Andrews-Goff, V., Leaper, R., Ensor, P., Kelly, N., Wadley,
 V., Lindsay, M., Peel, D., Calderan, S., Collins, K., Davidson, M., Deacon, C., Donnelly, D., Olavarria, C.,
 Owen, K., Rekdahl, M., Schmitt, N., Gales, N.J. 2013. Cruise report of the 2013 Antarctic blue whale
 voyage of the Southern Ocean Research Partnership. International Whaling Commission SC/65a/SH21:1–
 16.
Excoffier, L,. Lischer, H.E.L. 2010. Arlequin suite ver 3.5: A new series of programs to perform population
 genetics analyses under Linux and Windows. Mol. Ecol. Resour. 10:564–567.
Gill, P. 2002. A blue whale (Balaenoptera musculus) feeding ground in a southern Australian coastal upwelling
 zone. J. Cetacean Res. Manag. 4:179–184.
Holt, M.M., Noren, D.P., Dunkin, R.C., Williams, T.M. 2015. Vocal performance affects metabolic rate in
 dolphins: implications for animals communicating in noisy environments. J. Exp. Biol. 2:1–8.
Kibblewhite, A.C., Denham, R.N., Barnes, D.J. 1967. Unusual low-frequency signals observed in New Zealand
 waters. J. Acoust. Soc. Am. 41:644–655.
Krutzen, M., Barre, L.M., Moller, L.M., Heithaus, M.R., Simms, C., Sherwin, W.B. 2002. A biopsy system for
 small cetaceans: Darting success and wound healing in Tursiops SPP. Mar. Mammal Sci. 18:863–878.
LeDuc, R.G., Dizon, A.G., Goto, M., Pastene, L.A., Kato, H., Nishiwaki, C.A., LeDuc, C.A., Brownell, R.L.
 2007. Patterns of genetic variation in Southern Hemisphere blue whales and the use of assignment test to
 detect mixing on the feeding grounds. J. Cetacean Res. Manag. 9:73–80.
Longmire, J.L., Maltbie, M., Baker, R.J. 1997. Use of “Lysis Buffer” in DNA isolation and its implications for
 museum collections. Occas. Pap. Museum Texas Tech Univ:1–3.

 21
22

McDonald, M.A. 2006. An acoustic survey of baleen whales off Great Barrier Island, New Zealand. New Zeal. J.
 Mar. Freshw. Res. 40:519–529.
McDonald, M.A., Mesnick, S.L., Hildebrand, J.A. 2006. Biogeographic characterisation of blue whale song
 worldwide: using song to identify populations. J. Cetacean Res. Manag. 8:55–65.
Miller, B.S., Collins, K., Barlow, J., Calderan, S., Leaper, R., McDonald, M.A., Ensor, P., Olson, P.A.,
 Olavarria, C., Double, M.C. 2014. Blue whale vocalizations recorded around New Zealand: 1964-2013. J.
 Acoust. Soc. Am. 135:1616–1623.
Olson, P.A., Ensor, P., Olavarria, C., Bott, N., Constantine, R., Weir, J., Childerhouse, S., van der Linde, M.,
 Schmitt, N., Miller, B.S., Double, M.C. 2015. New Zealand Blue Whales: Residency, Morphology, and
 Feeding Behavior of a Little-Known Population. Pacific Sci. 69:477–485.
Rawson, A., Riding, J. 2015. South Taranaki Bight marine traffic study.
Rolland, R.M., Parks, S.E., Hunt, K.E., Castellote, M., Corkeron, P.J., Nowacek, D.P., Wasser, S.K., Kraus, S.D.
 2012. Evidence that ship noise increases stress in right whales. Proc. Biol. Sci. 279:2363–8.
Sambrook, J., Fritsch, E.F., Maniatis, T. 1989. Molecular Cloning: A Laboratory Manual. Cold Spring Harbor
 laboratory press.
Sears, R., Williamson, M.J., Wenzel, F.W., Bérubé, M., Gendron, D., Jones, P. 1990. Photographic identification
 of the Blue Whale (Balaenoptera musculus) in the Gulf of St. Lawrence, Canada. Rep. Int. Whal. Comm.
 (special issue) 335–342.
Shirtcliffe, T.G.L., Moore, M.I., Cole, A.G., Viner, A.B., Baldwin, R., Chapman, B. 1990. Dynamics of the Cape
 Farewell upwelling plume, New Zealand. New Zeal. J. Mar. Freshw. Res. 24:555–568.
Sremba, A.L., Hancock-Hanser, B., Branch, T.A., LeDuc, R.L., Baker, C.S. 2012. Circumpolar diversity and
 geographic differentiation of mtDNA in the critically endangered antarctic blue whale (Balaenoptera
 musculus intermedia). PLoS One 7.
Torres, L.G. 2013 Evidence for an unrecognised blue whale foraging ground in New Zealand. New Zeal. J. Mar.
 Freshw. Res. 47:235–248.
Torres, L.G., Gill, P.C., Graham, B., Steel, D., Hamner, R.M., Baker, C.S., Constantine, R., Escobar-Flores, P.,
 Sutton, P., Bury, S., Bott, N., Pinkerton, M. 2015. Population, habitat and prey characteristics of blue
 whales foraging in the South Taranaki Bight, New Zealand. J. Cetacean Res. Manag.
Torres-Florez, J.P., Hucke-Gaete, R., LeDuc, R., Lang, A., Taylor, B., Pimper, L.E., Bedriñana-Romano, L.,
 Rosenbaum, H.C., Figueroa, C.C. 2014. Blue whale population structure along the eastern South Pacific
 Ocean: Evidence of more than one population. Mol. Ecol. 23:5998–6010.
van der Hoop, J.M., Vanderlaan, S.M. 2012. Absolute probability estimates of lethal vessel-strikes to North
 Atlantic right whales in Roseway Basin, Scotian Shelf. Ecol. Appl. 22:2021–2033.
Waits, L.P., Luikart, G., Taberlet, P. 2001. Estimating the probability of identity among genotypes in natural
 populations: Cautions and guidelines. Mol. Ecol. 10:249–256.

 22
You can also read