Global coral reef ecosystems exhibit declining calcification and increasing primary productivity
←
→
Page content transcription
If your browser does not render page correctly, please read the page content below
ARTICLE
                  https://doi.org/10.1038/s43247-021-00168-w               OPEN

                  Global coral reef ecosystems exhibit declining
                  calcification and increasing primary productivity
                  Kay L. Davis        1 ✉,   Andrew P. Colefax2, James P. Tucker1, Brendan P. Kelaher1 & Isaac R. Santos                                 1,3

                  Long-term coral reef resilience to multiple stressors depends on their ability to maintain
                  positive calcification rates. Estimates of coral ecosystem calcification and organic productivity
                  provide insight into the environmental drivers and temporal changes in reef condition. Here,
                  we analyse global spatiotemporal trends and drivers of coral reef calcification using a meta-
                  analysis of ecosystem-scale case studies. A linear mixed effects regression model was used
1234567890():,;

                  to test whether ecosystem-scale calcification is related to seasonality, methodology, calcifier
                  cover, year, depth, wave action, latitude, duration of data collection, coral reef state, Ωar,
                  temperature and organic productivity. Global ecosystem calcification estimated from changes
                  in seawater carbonate chemistry was driven primarily by depth and benthic calcifier cover.
                  Current and future declines in coral cover will significantly affect the global reef carbonate
                  budget, even before considering the effects of sub-lethal stressors on calcification rates.
                  Repeatedly studied reefs exhibited declining calcification of 4.3 ± 1.9% per year (x̄ = 1.8 ±
                  0.7 mmol m−2 d−1 yr−1), and increasing organic productivity at 3.0 ± 0.8 mmol m−2 d−1 per
                  year since 1970. Therefore, coral reef ecosystems are experiencing a shift in their essential
                  metabolic processes of calcification and photosynthesis, and could become net dissolving
                  worldwide around 2054.

                  1 National Marine Science Centre, School of Environment, Science and Engineering, Southern Cross University, Coffs Harbour, NSW, Australia. 2 Sci-eye,

                  Goonellabah, NSW, Australia. 3 Department of Marine Sciences, University of Gothenburg, Gothenburg, Sweden. ✉email: kay.davis@scu.edu.au

                  COMMUNICATIONS EARTH & ENVIRONMENT | (2021)2:105 | https://doi.org/10.1038/s43247-021-00168-w | www.nature.com/commsenv                                  1
ARTICLE COMMUNICATIONS EARTH & ENVIRONMENT | https://doi.org/10.1038/s43247-021-00168-w
T
he ability for coral reefs to maintain critical ecosystem Here, we analysed data from 116 hydrochemical case studies
functions and services is under threat1,2. Global climate quantifying ecosystem-scale coral reef production and calcifica-
change is affecting coral ecosystems disproportionally, with tion. We determined key global-scale biogeochemical drivers of
waters surrounding coral reefs acidifying faster than the open calcification and predicted global Gnet using linear mixed effects
ocean3–5. Steadily increasing thermal stress is triggering major regression models (LMER). We aim to uncover whether over-
bleaching events and lowering coral reef resilience6–8. Predicting arching trends in ecosystem metabolic rates are related to
the future of coral reef persistence relies heavily on understanding experimental designs to assess potential methodological biases
the key processes driving ecosystem functionality, such as calci- that can influence the interpretation of long-term trends. We
fication and productivity9. hypothesised that Gnet is driven by interactive effects of biogeo-
Assessments of net ecosystem calcification (Gnet) and organic chemical parameters, climate change and reef states. Overall, we
productivity (Pnet) in coral reefs provide valuable information expect declines in Gnet with increasing Pnet over time due to
about stress responses and reef longevity. Organic productivity reductions in coral cover and declining reef condition as pre-
(Pnet) is the net balance between photosynthesis and respira- viously reported at the local scale9,16,17,43. Our meta-analysis of
tion, and gives insight about algal versus coral dominance, in situ, hydrochemical, ecosystem-scale calcification rates reveals
short- versus long-term carbon fluxes, and photosynthetic global patterns and trends, building on the breadth of case study
efficiency in aquatic ecosystems10,11. Pre-1975, Pnet in coral and laboratory-based investigations to pinpoint the drivers of Gnet
reefs was estimated to be net-zero or ‘slightly’ positive11. Recent and predict the future of coral reefs.
observations of Pnet indicate a response of coral reefs to stress
events and changing environmental conditions9,12. Increasing
Pnet relative to Gnet also indicates a shift from coral to algal Results
dominated ecosystems13–15. Gnet is the net balance between Summary of the literature. A total of 53 publications fit our
calcification and dissolution, which quantifies the productivity meta-analysis criteria (see methods), providing 116 unique diel-
of all calcifiers within an ecosystem. Changing rates of Gnet and integrated calcification rates from 36 coral reef sites in 11 coun-
Pnet can indicate growth9, degradation16–18 or phase tries (Fig. 1, Supplementary Data 1). Australian reefs contributed
shifting16,19,20. Higher rates of Gnet tend to indicate reefs with 35% of studies which mostly occurred on the Great Barrier Reef
higher coral cover9,21,22, and ecosystems which have not been (GBR) (Fig. 1). Shiraho Reef, Japan, is the most well-studied
impacted by significant stressors23–26, whereas declining and ecosystem with 12 investigations, followed by Lizard Island44
net-dissolving calcification rates indicate stressed corals16,18,27 (n = 9) and One Tree Island9 (GBR, n = 7) and Kaneohe Bay,
or ecosystems which have little to no live corals25,28. Therefore, Hawaii41 (n = 7). Reefs in Palau17, Moorea45 and Heron Island46
Gnet and Pnet are increasingly used as proxies for coral reef (GBR) also have multiple repeat studies (n = 4–6). 51% and 49%
ecosystem health10,29,30. of studies occurred in the Northern and Southern Hemispheres,
Community census and hydrochemistry are the most widely respectively. Although >50% of all coral reefs exist in the 0–15°
used approaches to estimate coral reef ecosystem calcification31. latitude range47, only 20% of ecosystem calcification estimates
Community census techniques estimate Gnet by multiplying cal- occurred in low-latitude reefs near the equator. Mid-latitude reefs
cifier growth rates with biotic abundances31, while hydrochemical (15–28°) represented 72% of studied reefs, whereas high-latitude
methods derive Gnet and Pnet rates from changes in seawater reefs (28–32.5° N and S), which constitute only 1.5% of reefs
carbonate chemistry32. Census investigations can resolve the globally, but are hotspots of change20,48,49, were the focus of 8%
relative contribution of different species of calcifiers, but often of ecosystem metabolism studies (Fig. 1, Supplementary Fig. 1).
rely on growth rates from literature approximations rather than Although the methodology and equipment required to estimate
in situ observations. Data obtained from corals studied with hydrochemical coral ecosystem calcification has existed for more
different methodologies, locations, depths, stressors, seasons, and than 50 years, 40% of all coral reef metabolism studies have
years can introduce errors in taxon-specific calcification rates occurred within the past decade. The 1970s and 1980s together
>10-fold30, making accurate reflections of ecosystem-scale con- produced 15% of studies, the 1990s produced 30%, and the 2000s
ditions difficult. In contrast, hydrochemical methods for mea- produced 15%. There were 38% of Gnet studies that occurred in
suring Gnet and Pnet of coral reefs have the benefit of being summer, 21% were undertaken in autumn, 20% in winter, and
spatially and temporally specific, and integrate coral reef calcifi- 18% in spring (with the remaining represented by studies that
cation at the ecosystem scale without resolving individual or provided ‘annual’ estimates). The duration of these studies ranged
species scale processes11,33. Therefore, ecosystem-scale calcifica- from 1 to 58 days (x̄ ± SD = 6.5 ± 9.0 days), with the longest
tion investigations using hydrochemical methods are the basis for continuous study occurring over 28 consecutive days (One Tree
the present meta-analysis. Island, GBR43).
Potential influences on coral reef Gnet (e.g. depth, temperature, Gnet ranged from −90 to 667 mmol m−2 d−1, averaging
coral cover) have been identified in many case studies33–35, but 124.1 ± 106.6 (x̄ ± SD) across all studies. Pnet rates had a greater
there is currently no overarching consensus about the critical range than Gnet rates and averaged 65.1 ± 254.3 mmol m−2 d−1
drivers at the global scale. Manipulative mesocosm experiments (x̄ ± SD) (Table 1). Six out of the 116 studies compiled here
have quantified the relative importance of key factors such as light reported diel net ecosystem dissolution, and 34 investigations
availability, the aragonite saturation state (Ωar, as a proxy for determined the ecosystem to be net respiratory (i.e. 32% of
ocean acidification), and coral assemblages on metabolic studies reported negative Pnet rates).
rates36–38. However, mesocosms may not reflect in situ condi- Of all reefs studied, 25% were reported as degraded (n = 9)
tions because they cannot capture the rich natural complexity from either pollution, dredging, eutrophication, bleaching and/or
inherent in coral reef ecosystems39,40. Predicting Gnet as a func- recent cyclone events. 11% (n = 4 reefs) had combinations of
tion of environmental parameters is difficult, and relationships stressors (e.g. cyclone damage and bleaching from heat waves).
produced at local scales or in mesocosm experiments may not be Although reef state was not retained in the LMER (due to
accurate at broader spatial scales or over time9,29,41,42. Thus, a potentially confounding locational effects), degraded and reco-
meta-analyses approach can help to elucidate key drivers of global vering reefs had lower Gnet than healthy/recovered/unspecified
coral ecosystem calcification and understand how Gnet may reefs (x̄ degraded = 64.2 ± 10.5 mmol m−2 d−1 versus x̄ healthy =
respond to changing environmental conditions. 137.5 ± 11.7 mmol m−2 d−1). Globally, 67% of reefs were actively
2 COMMUNICATIONS EARTH & ENVIRONMENT | (2021)2:105 | https://doi.org/10.1038/s43247-021-00168-w | www.nature.com/commsenvCOMMUNICATIONS EARTH & ENVIRONMENT | https://doi.org/10.1038/s43247-021-00168-w ARTICLE
Fig. 1 Global distribution of coral reef ecosystem calcification from our literature review. a Gnet among 36 coral reefs representing 116 diel, in situ
hydrochemical-based metabolism investigations. Symbols vary in colour and size to represent varying Gnet for each study. Black points represent the
locations of all reported coral reefs globally47. b–d Most-studied regions magnified from colour-associated boxes on global map to demonstrate detail in
(b) Hawaii, (c) Japan, and (d) Australia. Citations are shown in Supplementary Data 1.
Table 1 Reported and calculated values of available quantitative auxiliary and metabolic data for 116 in situ hydrochemical coral
reef metabolism studies.
Variable Range x̄ SD n n* Reporting Error reporting
Ωar 2.1–4.5 3.44 0.5 65 20 17.4% 55.0%
Coral cover (%) 0.0–100 26 22 93 83 72.2% 24.1%
Depth (m) 0.2–10 1.94 1.7 98 70 60.9% –
NO3 (μM) 0.0–1.2 0.47 0.4 13 9 7.8% 88.9%
PO4 (μM) 0.0–0.6 0.22 0.2 16 10 8.7% 80.0%
Temperature (°C) 18–32 26 2.9 83 44 38.3% 52.3%
Gnet (mmol m−2 d−1) −90–670 124 109 116 73 63.5% 49.3%
Pnet (mmol m−2 d−1) −870–1240 65 254 105 66 57.4% 59.1%
Qualitative data were also included in the GLMM, see ‘Methods’ for details. n Denotes the total number of studies which information was reported or calculated. n* Denotes the number of studies which
actively report the data for each parameter. Error reporting indicates the percentage of studies in each category which state the parameter’s uncertainty. Ωar data not reported were calculated using
available data or sourced from other compilation tables24,41.
dissolving (Gnet ≤ 0) during the night. Studies reporting nighttime n = 79). Depth was a significant driver of calcification
dissolution have a significantly lower rate of diel-integrated Gnet (χ2 = 4.788, p = 0.029, n = 84), with the model predicting that for
(χ2 = 31.066, p < 0.001, n = 84). Hence, reefs that are only net every metre increase in depth, Gnet significantly decreased by
calcifying during the day are not calcifying at a rate to offset 14.8 ± 6.8 mmol m−2 d−1, assuming other parameters remain
nighttime dissolution (Fig. 2). The difference in nighttime constant. Calcifier cover also significantly influenced Gnet (χ2 =
production is not an effect of diel-averaged Ωar and there appears 15.723, p < 0.001, n = 84), with a 10% increase in the relative
to be no latitudinal, seasonal or decadal trends driving nighttime percentage of calcifier cover increasing Gnet by 4.1 ± 1.0 mmol
dissolution status. m−2 d−1 (Fig. 2, Supplementary Table 1). Calcification is most
impacted by changes in benthic communities in reefs withARTICLE COMMUNICATIONS EARTH & ENVIRONMENT | https://doi.org/10.1038/s43247-021-00168-w
Fig. 2 Predictors of coral reef ecosystem calcification. a–c Box and whisker plots indicating the predicted Gnet for reefs with categorical wave action,
seasonality, and nighttime productivity status. The grey boxes show interquartile range as well as the median. Lines outside of boxes indicate minimum and
maximum predicted values. Different letters represent statistical significance. d, e The predicted Gnet increase associated with increasing calcifier cover
(left) and depth (right) from the LMER, with shading representing 95% confidence intervals. All plots are based on the final LMER models (including any
outliers, denoted by circles).
the LMER (after the removal of five outliers), indicating that Discussion
summer–autumn seasons (S–A) have a higher average Gnet than Long-term trends in coral reef ecosystem calcification. Pre-
winter–spring seasons (W–S) (Fig. 2). When reefs are grouped dicting how metabolic rates of global coral communities will
into the most-studied geographical regions and latitudinal bins, change after stress events is difficult, but past and ongoing trends
warmer seasons (S–A) appeared to have higher Gnet for may give insight into future Gnet. Projecting the declining trend in
Australian, USA and Japanese reefs, but calcification rates in ecosystem calcification observed from this dataset obtained
French Polynesia are nearly identical regardless of the seasonal between 1971 and 2019 into the future implies that global Gnet
bin (Supplementary Fig. 1). Regional differences in Gnet may reach 0 around 2054 at the current rate of decline (Fig. 4).
seasonality do not appear to be a result of latitude (Supplemen- Our analysis, based on seawater chemistry overlying coral reefs
tary Fig. 1). Therefore, the importance of seasonality may vary builds on observations from sediment incubations. CO2 enrich-
ment experiments in sediment chambers imply that coral reef
among regions. Similarly, our model did not determine
sediments may become net-dissolving between 2031 and 208250.
temperature to be a driver of Gnet when all study sites were
Furthermore, persistent, long-term declines in calcification have
combined. been observed in most coral reef regions worldwide51–54 using
multiple lines of evidence. Skeletal records from the Great Barrier
Temporal trends in ecosystem metabolism. Temporal observa- Reef indicate the rate of decline has accelerated in the past two
tions at specific sites provide insight into how coral reefs globally decades, with calcification falling by up to 1.5% year−1 relative to
respond to changing environmental conditions. Repeat surveys of baseline values, as of the late 2000s55,56. Declines in Red Sea coral
Gnet and Pnet have, however, only been carried out at seven sites calcification of 30% in just one decade were associated with
(Fig. 4, n = 29 and 26 surveys, respectively). We compiled data increasing sea surface temperatures and extrapolating this dataset
from locations with multiple studies undertaken in the same to future warming scenarios resulted in the prediction of net-zero
season. This showed that organic productivity increased over time coral growth by 207054.
by 3.0 ± 0.8 mmol m−2 d−1 yr−1 since the 1970s (p < 0.001, The change in the calcification potential of reefs may be
Fig. 4). Calcification rates for repeat studies were lower than the associated with: (1) changes in the benthic calcifier abundance
original studies regardless of year, although half of the reefs were and community structure57,58 and (2) the declining ability of
considered healthy (i.e. no recent major stressors or were corals to calcify under stress59. As demonstrated by our model
reported to be ‘recovered’ during the most recent sampling). Out (Figs. 2, 4) and census-based studies53, the loss of coral cover due
of the four sites with at least three repeat surveys, three sites to stress events such as heat waves will decrease the calcification
showed a decrease in calcification (ΔGnet = −5.5 ± 3.9% yr−1), potential of global reefs. Here, reef calcification is declining at an
and one showed an overall increase (ΔGnet = +0.4% yr−1). Using average rate of 4.3 ± 1.9% yr−1 (Fig. 4) with a concurrent
the slope of the regression line combining all repeatedly-surveyed reduction in mean calcifier cover of 1.8% yr−1, suggesting that
sites over time, we estimate that Gnet is currently dropping at a loss of coral cover may not be the sole contributor of declining
rate of 1.8 ± 0.7 mmol m−2 d−1 yr−1 since the 1970s (p < 0.001, calcification. Stress events can impact metabolic processes, even
Fig. 4). If future change continues at the current rate of decline, without a net loss of benthic calcifiers. Corals tend to maximise
we can expect average global net-zero calcification around 2054. their chances of survival during stress events by temporarily
4 COMMUNICATIONS EARTH & ENVIRONMENT | (2021)2:105 | https://doi.org/10.1038/s43247-021-00168-w | www.nature.com/commsenvCOMMUNICATIONS EARTH & ENVIRONMENT | https://doi.org/10.1038/s43247-021-00168-w ARTICLE
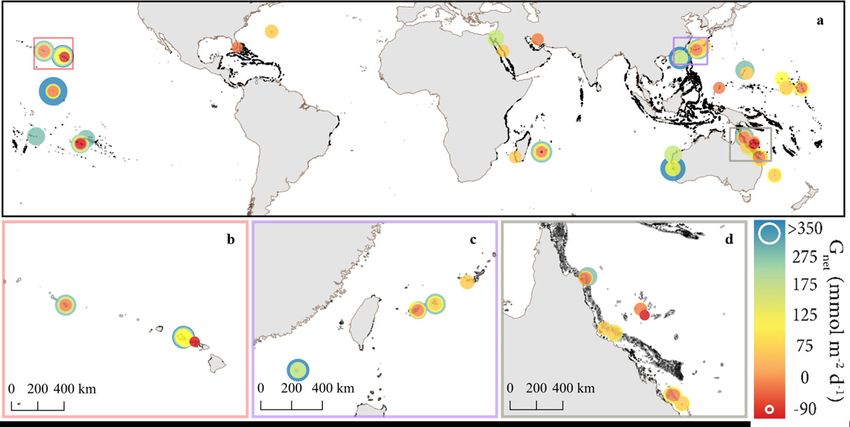
Fig. 3 Change in diel calcification (ΔGnet) versus seasonal change in
water temperature (ΔT). Data points are included from studies deriving
Gnet from the same site over different seasons (n = 26). The black line
represents a significant linear regression and grey shading represents the
95% confidence interval. The percent change in Gnet is calculated as the
warmer temperature Gnet divided by the cooler temperature Gnet. Because
major local stress events or reef degradation can mask the temperature–
Gnet relationship20, data from reefs classified as degraded were not
included. This prevents confounding effects of growing local-scale impacts
on a global-scale interpretation.
reducing calcification59,60. Recently, a transient coral bleaching Fig. 4 Long-term changes in coral reef ecosystem calcification (Gnet) and
event that resulted in no observable coral mortality resulted in productivity (Pnet) for well-studied reefs. Data were compiled from
ecosystem calcification rates which were 40% lower than post- observations which occurred using the same site and seasonal bin over
bleaching rates24. Shifting community structure can also alter different years (Supplementary Data 1). Black lines represent significant
metabolic estimates10,31. In times of stress, fast-growing, habitat- linear regressions and grey shading represents 95% confidence intervals.
forming coral groups are replaced with weedy coral and algal Symbol size reflects the duration of the study in the number of days.
species27. Horizontal dashed line represents net-zero calcification and vertical dashed
Our observation of decreasing Gnet with increasing Pnet at a line represents the when Gnet will approach net-zero. Sites affected by
global scale supports phase-shift theories. Phase shifting is groundwater discharge are excluded. Pnet excludes McMahon et al.16
observed in impacted reefs where lost coral cover is replaced by because it was sampled during a major bleaching event and was considered
marine algae61. Shifting dominance of coral ecosystem function- an outlier (Pnet = −868 mmol m−2 d−1). n = 29 for Gnet and n = 26 for Pnet.
ality to marine algae results in lower reef resilience14,62, Error bars are included when standard errors were reported or could be
biodiversity15,63 and provision of ecosystem services64. Although calculated from information presented in the paper.
high Pnet is not necessarily the cause for deteriorating reefs and
may exist in reefs with high Gnet9,65, increasing Pnet can indicate
prior ecological disturbances which trigger the establishment of on calcification estimates such as sampling strategy or study
marine algae. We show increasing Pnet over time indicating duration. We found no significant influence of latitude, reef state,
potentially reduced reef state and resilience against future Pnet, or Ωar on Gnet (Supplementary Note 1). However, calcifier
stressors even in reefs with ‘healthy’ Gnet rates (Fig. 4)62,64,65. cover and depth were significant drivers of Gnet, and seasonality,
The rate of Gnet decline presented here is likely to rise as stress temperature and wave action were influential (Figs. 2, 3, Sup-
events increase in frequency and intensity with climate plementary Table 1).
change6,7,66,67. For example, the most widespread mass-
bleaching event so far recorded on the GBR occurred in 202068,
suggesting that the rate of Gnet decline (Fig. 4) may underestimate Calcifier cover. The amount of coral and other calcifying
the magnitude of sudden Gnet drop related with bleaching events. organisms within an ecosystem is a key driver of its calcification
rates72. Indeed, calcifier cover was the most significant predictor
of Gnet in our model compiling all studies (Fig. 2, Supplementary
Global drivers of ecosystem calcification. Site-specific investi- Table 1). As the structural complexity and planar area of calcifiers
gations suggest that Gnet in coral reefs is driven by a complex reacting with the surrounding water increases, so does the cal-
combination of factors such as calcifier cover, hydrodynamics cification potential73. However, site-specific disparities between
(wave action and depth), temperature, light, organic productivity, Gnet and coral cover have been observed9,21,74–76. One hypothesis
nutrients and Ωar34,69–71. To test whether these local conclusions for local calcifier—Gnet non-linearity includes the introduction of
hold at the global scale, we developed a LMER using our com- unaccounted-for, external carbon that affects metabolic activity
piled dataset. We found no influence of methodological approach and calculations. Localised inputs of CO2-enriched groundwater
COMMUNICATIONS EARTH & ENVIRONMENT | (2021)2:105 | https://doi.org/10.1038/s43247-021-00168-w | www.nature.com/commsenv 5ARTICLE COMMUNICATIONS EARTH & ENVIRONMENT | https://doi.org/10.1038/s43247-021-00168-w
may explain some of the low Gnet in high calcifier cover reefs9, when bleaching events occur, which can decrease ecosystem
where acidified reef waters potentially drive skeletal or sediment calcification >100%16–18 due to coral mortality and sub-lethal
dissolution77. However, due to the complexity of coral reef eco- stress59. Declining calcification on lower-latitude reefs is likely
systems, it can be difficult to ascertain specific disparities between due to rising temperatures rather than ocean acidification91,
Gnet and calcifier cover74,78,79. Our result that increased calcifier indicating that ocean warming will have latitude- and magnitude-
cover enhanced Gnet on a global scale indicates that current and specific impacts on coral reefs.
future declines in coral cover due to stress events2,58,80 will affect
ecosystem calcification rates.
Research needs. Our meta-analysis reveals several knowledge gaps
with regard to monitoring and reporting of environmental para-
Reef hydrodynamics. Wave action and depth can drive ecosys-
meters (Table 1). Reporting essential auxiliary variables would
tem calcification (Fig. 2, Supplementary Table 1) through their
increase our understanding of the drivers of coral ecosystem
relationship with residence times, nutrient delivery and the
metabolism and the ability to build predictive models. The LMER
indirect effects on the equations used to calculate Gnet78. Wave
initiated with 46 out of 116 studies due to unavailable data (see
action influences Gnet from its associations with seawater chem-
Methods). Less than 10% (n = 10) of studies reported all key
istry and coral ecology, with higher coral diversity at wave-
numerical variables used in the model (Gnet, Pnet, depth, calcifier
exposed reefs30. In wave-exposed reefs, increasing wave heights
cover, temperature, and Ωar). More consistent reporting of uncer-
promote water circulation and calcification69,81,82. The modelled
tainties would likely minimise model prediction uncertainties.
relationship between wave action and Gnet (Fig. 2) might have
Clearer explanations of approaches and metabolic calculations
been stronger if wave action was in the form of a continuous
would also improve comparability among studies and contribute to
numerical variable (such as average or maximum wave heights or
a global understanding. Specifically, daytime and nighttime pro-
energy flux) rather than broad classifications based on reef type
ductivity rates, hours of sunlight, PAR, temperature and seawater
(‘exposed’, ‘moderate’ and ‘protected’) that can be retrieved from
carbon chemistry metrics would be useful to disentangle how ocean
the literature. However, wave heights or energy are challenging to
warming and acidification are affecting coral ecosystems.
measure and are rarely reported. Residence time could have a
Due to the logistical difficulties of nighttime sampling, many
significant influence on Gnet at a local scale37,78,83, but is not a
studies report calcification rates for the daytime only. Nighttime
relevant factor in all methodologies32, is associated with large
Gnet rates vary widely from positive to negative and, therefore,
errors16,20,84, and is rarely reported in a unit pertinent to our
have a variable effect on diel-integrated calcification rates.
study. Therefore, residence times were not included in our meta-
Information relating to nighttime calcification was only reported
analysis. Residence times also depend on water depth, which was
for 72% of studies. Since dissolution is more sensitive to ocean
found to be a significant predictor of Gnet (Fig. 2) and pH
acidification than calcification50,92,93, studies focusing exclusively
variability within a reef85. Potential explanations for how depth
on daytime Gnet may not capture the full story about how ocean
influences Gnet include depth-driven light attenuation, benthic
acidification may be affecting the ecosystem’s metabolism.
ecology or thermal stratification of the water column.
Additionally, the relative contribution of calcification and
Due to light attenuation, the benthos receives progressively less
dissolution in a reef can indicate changes in long-term ecosystem
light at increasing depths with corals at 6.5 m receiving only 5% of
health and future persistence94. Our result that reefs which
the light as those at 0.5 m86. However, corals growing in deeper
dissolve at night have significantly lower diel Gnet rates (Fig. 2)
water may be better adapted to utilise light87 or require less light
highlights the need for overnight observations.
for calcification88. Vertical stratification of the water column can
Certain locations and latitudes are underrepresented in efforts
result in colder temperatures, decreased boundary layer flow (and
to estimate Gnet. Equatorial coral reefs (COMMUNICATIONS EARTH & ENVIRONMENT | https://doi.org/10.1038/s43247-021-00168-w ARTICLE
decline, we can expect to observe net-zero calcification in coral approach to provide a framework for data interpretation that can be replicated
reefs around 2054. from our metadata and updated as more field data become available. By integrating
multiple quantitative and qualitative controls, the LMER model provides deeper
insight than conventional linear models99–101. Due to the frequent occurrence of
Methods missing values for explanatory variables throughout the dataset, we adopted a
Study selection from the literature. We conducted a systematic review on peer- backward-selection process in the LMER, which increased the number of data
reviewed coral reef ecosystem calcification studies to investigate trends in experi- points included in each subsequent model following the removal of a parameter.
mental designs and drivers of Gnet. The data collected to support a quantitative meta- The backward-selection process used Akaike Information Criterion and Bayesian
analysis were compiled from studies estimating Gnet via in situ hydrochemical Information Criterion as a guide102, whereby one variable was removed at a time
methods where observations occurred during the day and at night. Literature was between each subsequent model sequence until a final model was reached that
searched for on Google Scholar. Because the focus was to obtain relevant papers could not be improved by removing any further variables. After each model
pertaining to our meta-analysis criteria, we did not limit literature searches according sequence and the successive removal of a covariate, the data frame was reassigned
to predetermined Boolean structured statements. Searches used combinations of the so there were effectively more data points in subsequent models as covariates
terms ‘coral reef’, ‘metabolism’, ‘carbonate budgets’, ‘carbon budgets’, ‘calcification’, became fewer.
‘ecosystem’ and ‘productivity’, as well as searching references within relevant papers. We tested whether Gnet was significantly influenced by any of the explanatory
Studies were excluded if diel-integrated Gnet rates, or the information necessary to variables, including Pnet, latitude (degrees), wave action (exposed, moderate or
calculate these, were not available, or if major external carbon sources such as river or protected), duration of study (days), heat type of season (summer–autumn and
groundwater inputs were documented at the time of sampling. Calculation of winter–spring), study methodology, reef state, Ωar, temperature, calcifiers (%
metabolic rates and auxiliary information occurred where sufficient information was benthic cover) and depth (m). A random intercept term for location was included
given in the text, supporting information, or where original data was provided by the in the model to account for site-specific variability. Data on nutrients were
corresponding author (Supplementary Data 1). Studies were collected for analysis collected but not included in the LMER due to low reporting (n ≤ 10). Additionally,
until April 2020. Seven studies were not included due to lack of data, with no response due to the underreporting of variance in sampled Gnet, we were unable to include a
to our request for information from the corresponding author. Four studies were not weighting for Gnet in the model, such as following an inverse-variance method.
included due to the invalidation of sampling methodology assumptions (i.e. the Latitude (in decimal degrees) was converted to absolute values to represent relative
introduction of unaccounted for carbon into the system). distance from the equator. Reef state was reduced to a categorical factor with two
We compiled qualitative information from each publication on the study year, levels (i.e. healthy/unspecified or suffering a level of degradation), as reported in the
location, data collection duration (in days), wave action based on reef type (exposed, various publications. The coefficient of calcifiers was log-transformed because this
moderate or protected), season (placed into bins based on heat type: ‘H’ for provided a better correlation with Gnet (−0.95) than without transformation
summer–autumn and ‘C’ for winter–spring), methodology (slack water, flowing (−0.75). Default parameters were used in the lme4 package, with the full statistical
water, chamber, offshore TA anomaly and benthic gradient flux), nighttime model taking the form:
production status (net calcifying or dissolving) and coral reef state (degraded or yij ¼ β0 þ βPnet X Pnet þ βlat X lat
ij þ βwave X ij þ βduration X duration þ βheat X heat
wave
ij ij ij
healthy/unspecified). The ‘degraded’ category includes reefs originally described to
þ βΩar X Ωar
temp
experience major local impacts or to recover from pulse (e.g. cyclone or bleaching þ βmethod X method
ij þ βhealth X health
ij ij þ βtemp X ij
mortality) or press stressors (e.g. eutrophication, acidification). Study sites without a
depth
clear description about the level of degradation were classified as ‘healthy/unspecified’. þ βcalc log calcij þ βdepth X ij þ U j þ E ij
Exposed’ reef types included those described directly in the literature as being
exposed to wave action, or were described as on the ‘seaward edge’ of reef flats or U j N 0; σ 2U
reef crest sites. ‘Moderate’ wave action was denoted for those sites which were
described as such, as well as mid-reef flat and mid-fringing reef sites. ‘Protected’ E ij N 0; σ 2E
reef types from wave exposure included sites in back reef and lagoonal sites, as well
as sites described in original manuscripts as being protected from wave action. where yij is the predicted Gnet for the ith sample within location j. β0 is a fixed
The ‘flowing water’ methodology consisted of studies using Eulerian, intercept, with β regression coefficients for each of the fixed effects. U j is the
Lagrangian, or similar variants to collect samples and calculate water residence random effect of location j. E ij is the residual error for the ith sample within
times. The ‘chamber’ methodology group consisted of field experiments isolating location j.
the benthos and overlying water from natural circulation (incubation chamber and LMER was also used on refined datasets. To predict the change in Gnet as a
control volume studies). To be included, chamber studies were required to use function of seasonal change in temperature, the full dataset was reduced to studies
chambers including multiple benthos components (i.e. not encapsulating only a estimating ecosystem calcification at a specific location over two or more seasons.
single coral). The offshore TA anomaly methodology group consisted of studies Degraded reefs were not included to focus on the effect of temperature changes on
which compared reef water carbonate chemistry with offshore water carbonate ‘baseline’ Gnet. We also investigated long-term changes in Gnet and Pnet by
chemistry where the residence time was calculated separately. See Supplementary compiling the results of studies undertaken on the same reef over different years.
Data 1 for examples. To control for seasonal changes in temperature, only observations during the same
We also gathered quantitative data including diel-averaged aragonite saturation seasonal bins were included. The model structure was similar to the initial model in
state (Ωar), temperature, coral and coralline algal cover (combined to one ‘calcifier that a random intercept was included in the model to account repeated sampling at
cover’ term), depth, seawater nutrient concentrations (nitrate (NO3−) and the location level. Default model parameters with the lme4 package were also used,
orthophosphate (PO43−)), diel-integrated net organic and inorganic productivity (Pnet with no weightings for either Gnet or Pnet, due to an underreporting of sample
and Gnet), and any associated errors for each variable that was reported in the variance.
manuscript (standard deviations or standard errors as reported). Non-reported For the initial models, parameters were checked for collinearity and prioritised.
variables were left blank (Table 1). Light/PAR data were collected but was not analysed Prioritisation defined which variables were included in the model until the model
due to the many different methods of measuring and reporting units, of which many fully parameterised without overfitting. All models were assessed for model fit and
are not possible to convert to a standard unit. For publications where multiple seasons confirmed assumptions of homoscedasticity and linearity. A sensitivity analysis
or locations were studied, data were compiled for each sampling campaign and using Cooks distance was used to assess the influence of individual observations103,
included as separate lines of metadata in Supplementary Data 1. Pnet rates include leading to the removal of outliers when required. The only outliers (n = 5) detected
those gathered from studies which used either oxygen- or dissolved inorganic carbon- occurred in the ‘season’ variable. Model fit was assessed by visual inspection of
based (DIC) methodologies. These methodologies are similar as they each rely on the residual plots using the lattice package104. Homoscedasticity was also further
assumption that seawater chemistry is altered by primary productivity in the assessed through a Levene’s test using the car package105. Analysis of Deviance
ecosystem, and account for atmospheric exchange of CO2 and O2. Analyses of DIC to tables using Type II Wald Chi-square tests, from the ‘car’ package106 was used to
estimate Pnet was not widely used before the 2000s. Therefore, Pnet derived from both assess the significance of fixed-effect coefficients in the final model. Further
methodologies had to be included to incorporate Pnet as a variable in this model. pairwise comparisons using Tukey Contrasts in the ‘multcomp’107 package, using
The seawater chemistry investigations summarised here quantify calcification Bonferroni–Holm correction, were also used to examine within-factor groups for
on the ecosystem scale, but cannot resolve the specific taxa driving calcification. In variables in the final model.
addition to corals, there are several reef organisms such as molluscs and bryozoans
that calcify and therefore alter seawater carbon chemistry97. However, local scale
and census-based calcification investigations indicate that corals and calcifying Data availability
algae usually dominate Gnet in coral reef ecosystems30,31. The authors declare that the data supporting the findings of this study and its source data
are available within the paper and its Supplementary Information Files. The metadata is
also available on the SEANOE database at https://doi.org/10.17882/80022.
Statistical analysis. We conducted a series of LMER models with parameter
estimates using restricted maximum likelihood on the data of published literature
regarding in situ coral reef ecosystem calcification rates, in R98 using the lmer Code availability
function in the lme4 package (version 1.1-21)99. The LMER models included fixed The authors declare that the R code supporting the findings of this study are available
and random effects, and followed a standard and widely accepted statistical within the paper.
COMMUNICATIONS EARTH & ENVIRONMENT | (2021)2:105 | https://doi.org/10.1038/s43247-021-00168-w | www.nature.com/commsenv 7ARTICLE COMMUNICATIONS EARTH & ENVIRONMENT | https://doi.org/10.1038/s43247-021-00168-w
Received: 24 August 2020; Accepted: 13 April 2021; barrier ree flat (Moorea, French Polynesia). J. Exp. Mar. Biol. Ecol. 225,
269–283 (1998).
29. Bove, C. B., Umbanhowar, J. & Castillo, K. D. Meta-Analysis reveals reduced
coral calcification under projected ocean warming but not under acidification
across the Caribbean Sea. Front. Mar. Sci. 7, 127 (2020).
30. Brown, K. T. et al. Habitat-specific biogenic production and erosion influences
References net framework and sediment coral reef carbonate budgets. Limnol. Oceanogr.
1. Hughes, T. P. et al. Coral reefs in the anthropocene. Nature 546, 82–90 (2017). 9999, 1–17 (2020).
2. Hughes, T. P. et al. Global warming transforms coral reef assemblages. Nature 31. Lange, I. D., Perry, C. T. & Alvarez-Filip, L. Carbonate budgets as indicators of
556, 492–496 (2018). functional reef “health”: a critical review of data underpinning census-based
3. Shaw, E. C., Mcneil, B. I., Tilbrook, B., Matear, R. & Bates, M. L. methods and current knowledge gaps. Ecol. Indic. 110, 105857 (2020).
Anthropogenic changes to seawater buffer capacity combined with natural reef 32. Langdon, C., Gattuso, J.-P. & Andersson, A. Measurements of calcification
metabolism induce extreme future coral reef CO2 conditions. Glob. Change and dissolution of benthic organisms and communities. In Guide to best
Biol. 19, 1632–1641 (2013). practices in ocean acidification research and data reporting EUR 24872 EN,
4. Bates, N. R. Twenty years of marine carbon cycle observations at devils hole 213–228 (2011).
bermuda provide insights into seasonal hypoxia, coral reef calcification, and 33. Kinsey, D. W. Seasonal and zonation in coral reef productivity and
ocean acidification. Front. Mar. Sci. 4, 36 (2017). calcification. In Proc. Third Int. Coral Reef Symp. 2, 383–388 (ICRS, 1977).
5. Cyronak, T., Schulz, K. G., Santos, I. R. & Eyre, B. D. Enhanced acidification of 34. Silverman, J., Lazar, B. & Erez, J. Effect of aragonite saturation, temperature,
global coral reefs driven by regional biogeochemical feedbacks. Geophys. Res. and nutrients on the community calcification rate of a coral reef. J. Geophys.
Lett. 41, 2014GL060849 (2014). Res. 112, C05004 (2007).
6. Lough, J., Anderson, K. & Hughes, T. Increasing thermal stress for tropical 35. Gattuso, J.-P., Allemand, D. & Frankignoulle, M. Photosynthesis and
coral reefs: 1871–2017. Sci. Rep. 8, 6079 (2018). calcification at cellular, organismal and community levels in coral reefs: a
7. Skirving, W. et al. The relentless march of mass coral bleaching: a global review on interactions and control by carbonate chemistry. Am. Zool. 39,
perspective of changing heat stress. Coral Reefs 38, 547–557 (2019). 160–183 (1999).
8. Hughes, T. P. et al. Global warming and recurrent mass bleaching of corals. 36. Cohen, A. L. & Holcomb, M. Why corals care about ocean acidification:
Nature 543, 373 (2017). uncovering the mechanism. Oceanography 22, 118–127 (2009).
9. Davis, K. L. Fifty years of sporadic coral reef calcification estimates at One 37. Anthony, K. R. N., Kleypas, J. A. & Gattuso, J. P. Coral reefs modify their
Tree Island, Great Barrier Reef: is it enough to imply long term trends? Front. seawater carbon chemistry – implications for impacts of ocean acidification.
Mar. Sci. 6, 282 (2019). Glob. Change Biol. 17, 3667–3678 (2011).
10. Cyronak, T. et al. Taking the metabolic pulse of the world’s coral reefs. PloS 38. Jokiel, P. L., Jury, C. P. & Ku’ulei, S. R. Coral-algae metabolism and diurnal
ONE 13, e0190872 (2018). changes in the CO2-carbonate system of bulk sea water. PeerJ 2, e378 (2014).
11. Kinsey, D. W. Alkalinity changes and coral reef calcification. Limnol. 39. Falter, J. L., Atkinson, M. J. & Langdon, C. Production-respiration
Oceanogr. 23, 989–991 (1978). relationships at different timescales within the Biosphere 2 coral reef biome.
12. Perez, D. et al. Primary production and calcification rates of algae-dominated Limnol. Oceanogr. 46, 1653–1660 (2001).
reef flat and seagrass communities. J. Geophys. Res. Biogeosciences 123, 40. Stewart, R. I. et al. Mesocosm experiments as a tool for ecological
2362–2375 (2018). climatechange research. In Advances in Ecological Research (Elsevier, 2013).
13. Silverman, J. et al. Community calcification in Lizard Island, Great Barrier 41. Shamberger, K. E. F. et al. Calcification and organic production on a Hawaiian
Reef: a 33 year perspective. Geochim. Cosmochim. Acta 144, 72–81 (2014). coral reef. Mar. Chem. 127, 64–75 (2011).
14. Hoegh-Guldberg, O. et al. Coral reefs under rapid climate change and ocean 42. Jones, N. S., Ridgwell, A. & Hendy, E. J. Evaluation of coral reef carbonate
acidification. Science 318, 1737–1742 (2007). production models at a global scale. Biogeosciences 12, 1339–1356 (2015).
15. Hughes, T. P. et al. Phase shifts, herbivory, and the resilience of coral reefs to 43. Kwiatkowski, L. et al. Interannual stability of organic to inorganic carbon
climate change. Curr. Biol. 17, 360–365 (2007). production on a coral atoll. Geophys. Res. Lett. 43, 3880–3888 (2016).
16. McMahon, A. et al. Coral reef calcification and production after the 2016 44. Pisapia, C., Hochberg, E. J. & Carpenter, R. Multi-decadal change in reef-scale
bleaching event at Lizard Island, Great Barrier Reef. J. Geophys. Res. Oceans production and calcification associated with recent disturbances on a Lizard
124, 4003–4016 (2019). Island reef flat. Front. Mar. Sci. 6, 575 (2019).
17. Kayanne, H. et al. Seasonal and bleaching-induced changes in coral reef 45. Watanabe, A. et al. Analysis of the seawater CO2 system in the barrier
metabolism and CO2 flux. Glob. Biogeochemical Cycles 19, GB3015 (2005). reef–lagoon system of Palau using total alkalinity-dissolved inorganic carbon
18. Courtney, T. et al. Recovery of reef-scale calcification following a bleaching diagrams. Limnol. Oceanogr. 51, 1614–1628 (2006).
event in Kāne’ohe Bay, Hawai’i. Limnol. Oceanogr. Lett. 3, 1–9 (2017). 46. McMahon, A., Santos, I. R., Schulz, K. G., Cyronak, T. & Maher, D. T.
19. Silverman, J. et al. Carbon turnover rates in the One Tree Island reef: a 40-year Determining coral reef calcification and primary production using automated
perspective. J. Geophys. Res. Biogeosciences 117, G03023 (2012). alkalinity, pH and pCO2 measurements at high temporal resolution. Estuar.
20. Davis, K. L., McMahon, A., Correa, R. E. & Santos, I. R. Calcification and Coast. Shelf Sci. 209, 80–88 (2018).
organic productivity at the world’s southernmost coral reef. Mar. Chem. 227, 47. Reefs. RAGISfC. Reefs location. http://www.reefbase.org/gis_maps/datasets.
103870 (2020). aspx (2020).
21. Conand, C. The carbonate budget of a fringing reef in La Reunion Island 48. Wernberg, T. et al. Impacts of climate change in a global hotspot for
(Indian Ocean); sea urchin and fish bioerosion and net calcification. In temperate marine biodiversity and ocean warming. J. Exp. Mar. Biol. Ecol.
Proceedings of the 8th International Coral Reef Symposium) Vol. 1, pp. 400, 7–16 (2011).
953–958 (ICRS, 1997). 49. Figueira, W. F. & Booth, D. J. Increasing ocean temperatures allow tropical
22. Falter, J. L., Lowe, R. J., Atkinson, M. J. & Cuet, P. Seasonal coupling and fishes to survive overwinter in temperate waters. Glob. Change Biol. 16,
decoupling of net calcification rates from coral reef metabolism and carbonate 506–516 (2010).
chemistry at Ningaloo Reef, Western Australia. J. Geophys. Res. Oceans 117, 50. Eyre, B. D. et al. Coral reefs will transition to net dissolving before end of
C05003 (2012). century. Science 359, 908–911 (2018).
23. Silverman, J., Lazar, B. & Erez, J. Community metabolism of a coral reef 51. D’Olivo, J., McCulloch, M. & Judd, K. Long-term records of coral calcification
exposed to naturally varying dissolved inorganic nutrient loads. across the central Great Barrier Reef: assessing the impacts of river runoff and
Biogeochemistry 84, 67–82 (2007). climate change. Coral Reefs 32, 999–1012 (2013).
24. DeCarlo, T. M. et al. Community production modulates coral reef pH and the 52. Tanzil, J. T. et al. Regional decline in growth rates of massive Porites corals in
sensitivity of ecosystem calcification to ocean acidification. J. Geophys. Res. Southeast Asia. Glob. Change Biol. 19, 3011–3023 (2013).
Oceans 122, 745–761 (2017). 53. Perry, C. T. et al. Caribbean-wide decline in carbonate production threatens
25. Gattuso, J. P., Payri, C. E., Pichon, M., Delesalle, B. & Frankignoulle, M. coral reef growth. Nat. Commun. 4, 1402 (2013).
Primary production, calcification, and air-sea CO2 fluxes of a 54. Cantin, N. E., Cohen, A. L., Karnauskas, K. B., Tarrant, A. M. & McCorkle, D.
macroalgaldominated coral reef community (moorea, french polynesia). J. C. Ocean warming slows coral growth in the central Red Sea. Science 329,
Phycol. 33, 729–738 (1997). 322–325 (2010).
26. Doo, S. S., Edmunds, P. J. & Carpenter, R. C. Ocean acidification effects on 55. De’ath, G., Lough, J. M. & Fabricius, K. E. Declining coral calcification on the
in situ coral reef metabolism. Sci. Rep. 9, 1–8 (2019). Great Barrier Reef. Science 323, 116–119 (2009).
27. Courtney, T. A. et al. Disturbances drive changes in coral community 56. Cooper, T. F., De’Ath, G., Fabricius, K. E. & Lough, J. M. Declining coral
assemblages and coral calcification capacity. Ecosphere 11, e03066 (2020). calcification in massive Porites in two nearshore regions of the northern Great
28. Boucher, G., Clavier, J., Hily, C. & Gattuso, J. P. Contribution of soft bottoms Barrier Reef. Glob. Change Biol. 14, 529–538 (2008).
to the community metabolism (primary production and calcification) of a
8 COMMUNICATIONS EARTH & ENVIRONMENT | (2021)2:105 | https://doi.org/10.1038/s43247-021-00168-w | www.nature.com/commsenvCOMMUNICATIONS EARTH & ENVIRONMENT | https://doi.org/10.1038/s43247-021-00168-w ARTICLE
57. Shaw, E. C., Hamylton, S. M. & Phinn, S. R. Incorporating benthic community 85. Cyronak, T. et al. Diel temperature and pH variability scale with depth across
changes into hydrochemical-based projections of coral reef calcium carbonate diverse coral reef habitats. Limnol. Oceanogr. Lett. 5, 193–203 (2020).
production under ocean acidification. Coral Reefs 35, 739–750 (2016). 86. Marubini, F., Barnett, H., Langdon, C. & Atkinson, M. Dependence of
58. Perry, C. T., Morgan, K. M. & Yarlett, R. T. Reef habitat type and spatial calcification on light and carbonate ion concentration for the hermatypic coral
extent as interacting controls on platform-scale carbonate budgets. Front. Porites compressa. Mar. Ecol. Prog. Ser. 220, 153–162 (2001).
Mar. Sci. 4, 185 (2017). 87. Dubinsky, Z. & Falkowski, P. Light as a source of information and energy in
59. D’Olivo, J. & McCulloch, M. Response of coral calcification and calcifying zooxanthellate corals. In Coral Reefs: an Ecosystem in Transition, 107–118
fluid composition to thermally induced bleaching stress. Sci. Rep. 7, 2207 (Springer, 2011).
(2017). 88. Dubinsky, Z. & Jokiel, P. L. Ratio of energy and nutrient fluxes regulates
60. Schoepf, V. et al. Annual coral bleaching and the long-term recovery capacity symbiosis between zooxanthellae and corals. Pac. Sci. 48, 313–324 (1994).
of coral. Proc. R. Soc. B Biol. Sci. 282, 1887 (2015). 89. Teneva, L., Dunbar, R., Mucciarone, D., Dunckley, J. & Koseff, J.
61. McManus, J. W. & Polsenberg, J. F. Coral-algal phase shifts on coral reefs: Highresolution carbon budgets on a Palau back-reef modulated by
Ecological and environmental aspects. Prog. Oceanogr. 60, 263–279 (2004). interactions between hydrodynamics and reef metabolism. Limnol. Oceanogr.
62. Bozec, Y.-M., Doropoulos, C., Roff, G. & Mumby, P. J. Transient grazing and 58, 1851–1870 (2013).
the dynamics of an unanticipated coral-algal phase shift. Ecosystems 22, 90. Courtney, T. A. et al. Comparing chemistry and census-based estimates of net
296–311 (2019). ecosystem calcification on a rim reef in Bermuda. Front. Mar. Sci. 3, 181 (2016).
63. Benkwitt, C. E., Wilson, S. K. & Graham, N. A. Biodiversity increases 91. Cooper, T. F., O’Leary, R. A. & Lough, J. M. Growth of Western Australian
ecosystem functions despite multiple stressors on coral reefs. Nat. Ecol. Evol. 4, corals in the Anthropocene. Science 335, 593–596 (2012).
919–926 (2020). 92. Andersson, A. J. et al. Net Loss of CaCO3 from a subtropical calcifying
64. Ainsworth, C. H. & Mumby, P. J. Coral-algal phase shifts alter fish community due to seawater acidification: mesocosm-scale experimental
communities and reduce fisheries production. Glob. Change Biol. 21, 165–172 evidence. Biogeosciences 6, 1811–1823 (2009).
(2015). 93. Chou, W.-C., Liu, P.-J., Chen, Y.-H. & Huang, W.-J. Contrasting changes in
65. Albright, R., Langdon, C. & Anthony, K. Dynamics of seawater carbonate diel variations of net community calcification support that carbonate
chemistry, production, and calcification of a coral reef flat, central Great dissolution can be more sensitive to ocean acidification than coral
Barrier Reef. Biogeosciences 10, 6747 (2013). calcification. Front. Mar. Sci. 7, 3 (2020).
66. Hughes, T. P. et al. Global warming and recurrent mass bleaching of corals. 94. Eyre, B. D., Andersson, A. J. & Cyronak, T. Benthic coral reef calcium
Nature 543, 373–377 (2017). carbonate dissolution in an acidifying ocean. Nat. Clim. Change 4, 969–976
67. Edmunds, P. J. & Putnam, H. M. Science-based approach to using growth rate (2014).
to assess coral performance and restoration outcomes. Biol. Lett. 16, 20200227 95. Cinner, J. E. et al. Bright spots among the world’s coral reefs. Nature 535,
(2020). 416–419 (2016).
68. Hughes, T. & Pratchett, M. We just spent two weeks surveying the Great 96. Asaad, I., Lundquist, C. J., Erdmann, M. V. & Costello, M. J. Delineating
Barrier Reef. What we saw was an utter tragedy. The Conversation. April 7, priority areas for marine biodiversity conservation in the Coral Triangle. Biol.
2020. https://theconversation.com/we-just-spent-two-weeks-surveying- Conserv. 222, 198–211 (2018).
thegreat-barrier-reef-what-we-saw-was-an-utter-tragedy-135197. 97. Ries, J. B., Ghazaleh, M. N., Connolly, B., Westfield, I. & Castillo, K. D.
69. Falter, J. L., Lowe, R. J., Zhang, Z. & McCulloch, M. Physical and biological Impacts of seawater saturation state (Ωar = 0.4-4.6) and temperature (10, 25
controls on the carbonate chemistry of coral reef waters: effects of metabolism, C) on the dissolution kinetics of whole-shell biogenic carbonates. Geochim.
wave forcing, sea level, and geomorphology. PLoS ONE 8, e53303 (2013). Cosmochim. Acta 192, 318–337 (2016).
70. Gattuso, J.-P., Pichon, M., Delesalle, B., Canon, C. & Frankignoulle, M. 98. Team, R. C. R: a language and environment for statistical computing.) (R
Carbon fluxes in coral reefs. I. Lagrangian measurement of community foundation for statistical computing, Vienna, Austria, 2019).
metabolism and resulting air-sea CO2 disequilibrium. Mar. Ecol. Prog. Ser. 99. Bates, D., Mächler, M., Bolker, B. & Walker, S. Fitting linear mixed-effects
145, 109–121 (1996). models using lme4. arXiv preprint https://arxiv.org/abs/1406.5823 (2014).
71. McMahon, A., Santos, I. R., Cyronak, T. & Eyre, B. D. Hysteresis between 100. Gałecki, A. & Burzykowski, T. Linear mixed-effects model. In Linear Mixed-
coral reef calcification and the seawater aragonite saturation state. Geophys. Effects Models Using R (Springer, 2013).
Res. Lett. 40, 4675–4679 (2013). 101. Sanchez-Pinto, L. N., Venable, L. R., Fahrenbach, J. & Churpek, M. M.
72. Gattuso, J. P., Frankignoulle, M. & Wollast, R. Carbon and carbonate metabolism Comparison of variable selection methods for clinical predictive modeling. Int.
in coastal aquatic ecosystems. Annu. Rev. Ecol. Syst. 29, 405–434 (1998). J. Med. Inform. 116, 10–17 (2018).
73. Long, M. H., Berg, P., de Beer, D. & Zieman, J. C. In situ coral reef oxygen 102. Zuur, A. F., Ieno, E. N., Walker, N. J., Saveliev, A. A. & Smith, G. M. Mixed
metabolism: an eddy correlation study. PloS ONE 8, e58581 (2013). effects modelling for nested data. In Mixed Effects Models and Extensions in
74. Page, H. N., Courtney, T. A., Collins, A., De Carlo, E. H. & Andersson, A. J. Ecology with R (Springer, 2009).
Net community metabolism and seawater carbonate chemistry scale 103. Nieuwenhuis, R., Te Grotenhuis, H. & Pelzer, B. Influence. ME: tools for
nonintuitively with coral cover. Front. Mar. Sci. 4, 161 (2017). detecting influential data in mixed effects models. The R-Journal 4, 38–47
75. Shamberger, K. E., Lentz, S. J. & Cohen, A. L. Low and variable ecosystem (2012).
calcification in a coral reef lagoon under natural acidification. Limnol. 104. Sarkar, D. Lattice: Multivariate Data Visualization with R (Springer Science &
Oceanogr. 63, 714–730 (2018). Business Media, 2008).
76. Yates, K. K. & Halley, R. B. Diurnal variation in rates of calcification and 105. Fox, J. & Weisberg, S. Using car and effects Functions in Other Functions.
carbonate sediment dissolution in Florida Bay. Estuar. Coasts 29, 24–39 http://cran.pau.edu.tr/web/packages/car/vignettes/embedding.pdf (2020).
(2006). 106. Fox, J. & Weisberg, S. An R companion to applied regression, second edn
77. Cyronak, T., Santos, I. R. & Eyre, B. D. Permeable coral reef sediment (Sage publications, 2018).
dissolution driven by elevated pCO2 and pore water advection. Geophys. Res. 107. Hothorn, T., Bretz, F. & Westfall, P. Simultaneous inference in general
Lett. 40, 4876–4881 (2013). parametric models. Biom. J. 50, 346–363 (2008).
78. Courtney, T. & Andersson, A. Evaluating measurements of coral reef net
ecosystem calcification rates. Coral Reefs 38, 997–1006 (2019).
79. Page, H. N. et al. Spatiotemporal variability in seawater carbon chemistry for a Acknowledgements
coral reef flat in Kāne ‘ohe Bay, Hawai ‘i. Limnol. Oceanogr. 64, 913–934 (2019). We thank Drs Ashly McMahon, Emily Shaw, Tom DeCarlo and Steve Doo for supplying
80. Bruno, J. F. & Selig, E. R. Regional decline of coral cover in the Indo-Pacific: raw data for metabolic and auxiliary calculations. This project was supported by The
timing, extent, and subregional comparisons. PLoS ONE 2, e711 (2007). Australian Research Council and the Australian Academy of Sciences.
81. Lowe, R. J., Falter, J. L., Monismith, S. G. & Atkinson, M. J. A numerical study
of circulation in a coastal reef-lagoon system. J. Geophys. Res. Oceans 114,
C06022 (2009). Author contributions
82. Zhang, Z., Falter, J., Lowe, R. & Ivey, G. The combined influence of K.D. and I.S. conceived the idea and wrote the paper. K.D. calculated and compiled the
hydrodynamic forcing and calcification on the spatial distribution of alkalinity metadata and undertook preliminary analyses. K.D., A.C., I.S. and B.K. contributed to the
in a coral reef system. J. Geophys. Res. Oceans 117, C04034 (2012). study design and data interpretation. A.C. wrote the R code and performed statistical
83. Demicco, R. V. & Hardie, L. A. The “carbonate factory” revisited: a analyses. A.C. and J.T. assisted with mapping and graphical interpretations with input
reexamination of sediment production functions used to model deposition on from K.D. and I.S. All authors were involved in paper editing.
carbonate platforms. J. Sediment Res. 72, 849–857 (2002).
84. Venti, A., Kadko, D., Andersson, A., Langdon, C. & Bates, N. A multi-tracer
model approach to estimate reef water residence times. Limnol. Oceanogr. Competing interests
Methods 10, 1078–1095 (2012). The authors declare no competing interests.
COMMUNICATIONS EARTH & ENVIRONMENT | (2021)2:105 | https://doi.org/10.1038/s43247-021-00168-w | www.nature.com/commsenv 9You can also read