Vulnerability of the Great Barrier Reef to climate change and local pressures
←
→
Page content transcription
If your browser does not render page correctly, please read the page content below
Received: 1 September 2017     |   Revised: 23 October 2017   |    Accepted: 20 December 2017

DOI: 10.1111/gcb.14043

PRIMARY RESEARCH ARTICLE

Vulnerability of the Great Barrier Reef to climate change and
local pressures

Nicholas H. Wolff1,2                        | Peter J. Mumby1,3                     | Michelle Devlin4,5                 | Kenneth R.
                    6
N. Anthony

1
 Marine Spatial Ecology Lab, School of
Biological Sciences, The University of              Abstract
Queensland, St Lucia, QLD, Australia                Australia’s Great Barrier Reef (GBR) is under pressure from a suite of stressors
2
 Global Science, The Nature Conservancy,
                                                    including cyclones, crown-of-thorns starfish (COTS), nutrients from river run-off and
Brunswick, ME, USA
3
 ARC Centre of Excellence for Coral Reef            warming events that drive mass coral bleaching. Two key questions are: how vulner-
Studies, The University of Queensland, St           able will the GBR be to future environmental scenarios, and to what extent can
Lucia, QLD, Australia
4
                                                    local management actions lower vulnerability in the face of climate change? To
 Centre for Environment, Fisheries and
Aquaculture Science, Lowestoft                      address these questions, we use a simple empirical and mechanistic coral model to
Laboratory, Lowestoft, Suffolk, UK
                                                    explore six scenarios that represent plausible combinations of climate change pro-
5
 Catchment to Reef Research Group,
Centre for Tropical Water and Aquatic
                                                    jections (from four Representative Concentration Pathways, RCPs), cyclones and
Ecosystem Research, James Cook                      local stressors. Projections (2017–2050) indicate significant potential for coral recov-
University, Douglas, QLD, Australia
6
                                                    ery in the near-term, relative to current state, followed by climate-driven decline.
 Australian Institute of Marine Science,
PMB3, Townsville, QLD, Australia                    Under a scenario of unmitigated emissions (RCP8.5) and business-as-usual manage-
                                                    ment of local stressors, mean coral cover on the GBR is predicted to recover over
Correspondence
Peter J. Mumby, Marine Spatial Ecology Lab,         the next decade and then rapidly decline to only 3% by year 2050. In contrast, a
School of Biological Sciences, The University       scenario of strong carbon mitigation (RCP2.6) and improved water quality, predicts
of Queensland, St Lucia, QLD, Australia.
Email: p.j.mumby@uq.edu.au                          significant coral recovery over the next two decades, followed by a relatively mod-
and                                                 est climate-driven decline that sustained coral cover above 26% by 2050. In an anal-
Kenneth R.N. Anthony, Australian Institute
of Marine Science, PMB3, Townsville, QLD,           ysis of the impacts of cumulative stressors on coral cover relative to potential coral
Australia.                                          cover in the absence of such impacts, we found that GBR-wide reef performance
Email: k.anthony@aims.gov.au
                                                    will decline 27%–74% depending on the scenario. Up to 66% of performance loss is
Funding information                                 attributable to local stressors. The potential for management to reduce vulnerability,
National Environmental Research
Programme, Australia                                measured here as the mean number of years coral cover can be kept above 30%, is
                                                    spatially variable. Management strategies that alleviate cumulative impacts have the
                                                    potential to reduce the vulnerability of some midshelf reefs in the central GBR by
                                                    83%, but only if combined with strong mitigation of carbon emissions.

                                                    KEYWORDS
                                                    Acropora, bleaching, coral reefs, cumulative stressors, Paris climate accord, vulnerability, water
                                                    quality

1 | INTRODUCTION                                                                     pollution, storms, overfishing and invasive pests (Alvarez-Filip, Dulvy,
                                                                                            ^ te
                                                                                     Gill, Co  , & Watkinson, 2009; Bellwood, Hughes, Folke, & Nystro
                                                                                                                                                     €m,
Coral reefs worldwide are facing impacts from multiple local, regional               2004; Hoegh-Guldberg et al., 2007) (Figure 1). During the 2015/
and global pressures including ocean warming and acidification,                                ~ o, Australia’s Great Barrier Reef (GBR), the world’s
                                                                                     2016 El Nin

Glob Change Biol. 2018;1–14.                                      wileyonlinelibrary.com/journal/gcb                      © 2018 John Wiley & Sons Ltd   |   1
2   |                                                                                                                               WOLFF   ET AL.

largest and most intensively managed coral reef ecosystem, experi-       (a)
enced its third and worst coral bleaching event in history, with over    Climate change          GLOBAL               Cyclones
90% of reefs affected (Hughes et al., 2017). Mass bleaching events
are projected to increase pan-tropically for all RCP projections,
including the most optimistic (Frieler et al., 2013; Ortiz, Bozec,
Wolff, Doropoulos, & Mumby, 2014). Furthermore, ocean acidifica-
tion is projected to lower the scope for coral reefs to calcify and
sustain processes that underpin resilience (Anthony et al., 2011;
Kleypas et al., 1999). Together, these global stressors contribute
uncertainty about the future resilience of the GBR (Hughes, Day, &
Brodie, 2015) and the scope for regional management actions to
sustain coral reefs.
                                                                                                     Reef
    In response to growing national and international concerns about
the GBR (Brodie et al., 2013; Douvere & Badman, 2012), Australia
recently released a long-term GBR sustainability plan (Reef 2050,
Reef 2050 Long-Term Sustainability Plan 2015) for the years 2016–
2050. A central tenet of Reef 2050 is that alleviation of local stres-
sors, mainly through improvements in water quality and effective
COTS control, will enhance reef resilience in the face of climate
                                                                           Nutrient runoff         LOCAL              COTS
change. Specifically, the plan aims for a minimum of 50% reduction
of baseline (2009) riverine nutrient loads by 2018, extending to 80%      (b)
reduction by 2025. These targets have been informed by scientific
                                                                                                                              Vulnerability
syntheses and consensus statements (Brodie et al., 2012, 2013),
which in turn have been informed by multiple individual studies
                                                                                                                              COTS
reviewed in Brodie et al. (2012). While it is well established that
coral reefs are sensitive to nutrient enrichment (Fabricius, 2005),
most of the documented impacts of land-based pollutants on the
                                                                                                                              Nutrient runoff
GBR are restricted to inshore reefs (Roff et al., 2012). However, two
lines of evidence suggest nutrient run-off may indirectly affect reefs                                                        Cyclones
further offshore. First is correlative evidence for a link between
nutrient enrichment, phytoplankton blooms, survival of larval COTS
                                                                                                                              Thermal stress
and consequent GBR-wide outbreaks (Birkeland, 1982; Fabricius,
Okaji, & De’ath, 2010), providing a basis for establishing the 50%–
80% targets for nutrients (Brodie et al., 2013; Kroon, Thorburn,
Schaffelke, & Whitten, 2016). Second is evidence linking nutrient
exposure with greater thermal stress sensitivity (bleaching) through     F I G U R E 1 (a) Schematic of the primary global (cyclones and
complex physiological processes (Wiedenmann et al., 2013; Wool-          climate change) and local (COTS and nutrient run-off) stressors
                                                                         currently affecting GBR coral health. Direct impacts (solid black)
dridge, 2013) which also indicates a 50%–80% nutrient reduction is
                                                                         include damage from cyclones, bleaching from global warming,
necessary (Wooldridge, Brodie, Kroon, & Turner, 2015).                   reduced thermal tolerance from nutrient run-off and predation from
    The stated expectation in Reef 2050 is that management efforts       COTS. Interactions between stressors (solid colours) include local
will lead to improved coral condition each successive decade through     reductions in thermal stress due to cyclone induced water cooling
2050. While improvements in water quality and mitigating COTS            (blue), and increased thermal sensitivity to nutrient run-off due to
                                                                         global warming (red). Indirect interactions (dotted grey) include
outbreaks will benefit GBR ecosystems in general (Brodie & Pearson,
                                                                         potential climate change influence on cyclone frequency and/or
2016), outcomes of Reef 2050 for reef corals are less clear. Two
                                                                         magnitude and on weather patterns (e.g. flooding from more intense
pertinent questions for the GBR are: (1) how vulnerable will the sys-    rain events). In addition, nutrient run-off is indirectly linked to COTS
tem be to different climate change scenarios? and (2) to what extent     outbreak frequency due to enhanced larval survival. (b) Dynamic
can the management of local- and regional-scale pressures compen-        exposure to these stressors is captured using spatially explicit
sate for the effects of climate change into the future?                  probability layers, which are then integrated using a coral trajectory
                                                                         model. The model is parameterized to represent the impacts of the
    Here, we use a simple model of coral cover dynamics to examine
                                                                         different disturbances (including interactions) on coral cover
the extent to which water quality improvements and effective COTS        (mortality). Multiple simulations are used to capture stochasticity and
control can help sustain or increase coral cover on the GBR in a         uncertainty (see Methods for details). Symbols (a) are from Tracey
warming world. Firstly, we evaluate possible GBR futures under six       Saxby, Integration and Application Network, University of Maryland
different scenarios capturing plausible combinations of global and       Center for Environmental Science (ian.umces.edu/imagelibrary/)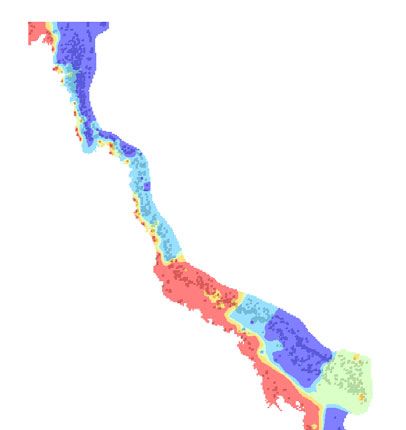
WOLFF   ET AL.                                                                                                                                        |   3

local stressors. Secondly, we estimate the relative impacts of these           business-as-usual levels of management of local stressors across
scenarios on patterns of GBR coral vulnerability in space and time.            each of the four Representative Concentration Pathways (RCPs)
Thirdly, we identify areas where reductions of manageable stressors            adopted by the IPCC for its Fifth Assessment Report (AR5) (van
appear to achieve greater utility in sustaining coral cover. To achieve        Vuuren et al., 2011). In addition, we also explored a worst-case sce-
this, the model integrates spatially explicit exposure layers of thermal       nario (S1) which combined minimal carbon mitigation (RCP 8.5)
stress, cyclones, river run-off (as a proxy for poor water quality inun-       resulting in accelerated warming, with increased nutrient run-off due
dation) and COTS (Figure 1). We fitted a logistic growth model to              to land clearing and suboptimal land-use practices within GBR catch-
historical trajectories of Acropora coral cover on the GBR and then            ments (Brodie & Pearson, 2016; Kroon et al., 2016). Finally, we used
parameterized estimates of coral mortality caused by bleaching,                a scenario (S6) that combines a low-emission pathway (RCP 2.6),
cyclone damage and COTS predation. We also include scenarios                   consistent with the Paris climate accord’s ambitions of limiting
where the sensitivity of coral to thermal stress is possibly height-           warming to 1.5°C, with the reduction targets for nutrient run-off set
ened under poor water quality associated with river plumes (Wool-              in the Reef 2050 Plan (Table 1). We assume COTS outbreak fre-
dridge, 2009; Wooldridge & Done, 2009; Wooldridge et al., 2017).               quency will increase under S1, driven by increased nutrient run-off
We note that the model is likely to underestimate cumulative                   and survival of COTS larvae (Brodie, Devlin, & Lewis, 2017; Fabricius
impacts by not accounting for ocean acidification and by disregard-            et al., 2010). Conversely, under S6 we assume COTS outbreak fre-
ing direct impacts of reduced water quality on coral growth and sur-           quency will decrease due to land-use improvements and lower nutri-
vival. The model is evaluated annually at 1,312 reef locations,                ent exposure (Table 1). Cyclones were treated conservatively as a
between years 2017 and 2050. We then analysed the relative                     background disturbance and were thus modelled consistently across
importance of global and local stressors in driving trajectories of            all six scenarios using reef-scale impact probabilities based on GBR
coral cover under different climate scenarios and examined to what             observations (Wolff et al., 2016).
extent different management regimes can counteract the vulnerabil-
ity caused by climate change.
                                                                               2.2 | Disturbance probability layers

2 | MATERIALS AND METHODS                                                      2.2.1 | Cyclones
                                                                               Although climate change may explain the recent spate of intense
2.1 | Scenario development
                                                                               GBR cyclones (Cheal, Macneil, Emslie, & Sweatman, 2017), natural
We used six environmental scenarios (S1–S6) as input layers for the            temporal clustering is another plausible explanation for this pattern
model to examine a range of possible outcomes for GBR coral cover              (Wolff et al., 2016). Observations indicate that cyclone patterns in
between 2017 and 2050 (Table 1). Four scenarios (S2–S5) represent              the South Pacific have not responded to warmer seas, unlike in

T A B L E 1 Description of the six different scenarios used here to capture plausible combinations of global and local stressors. Ocean
warming projections were based on each of four AR5 RCPs. Each of these RCPs was combined with business-as-usual (BaU) local management
which assumed observed nutrient run-off effects on water quality and observed COTS outbreak frequency would remain unchanged (scenarios
2–5). The worst-case scenario (S1) assumes emissions will increase unabated (RCP 8.5) and continued land clearing and catchment
development will lead to higher probability of nutrient run-off impacts and more frequent COTS outbreaks. The best-case scenario (S6)
assumes both the emissions mitigation ambitions of the Paris climate accord (RCP 2.6) and the management goals of the Reef 2050 plan are
successfully implemented, reducing warming impacts, nutrient run-off and COTS outbreak frequency. Cyclone impacts are modelled
consistently, based on observed probabilities, across all scenarios. Details of scenario development and implementation can be found in the
Materials and Methods
 Scenario        Warming       Nutrient    COTS fre-
 (name)          (RCP)         run-off     quency (years)   Description
 S1 (Worst       High (8.5)    Further     10               Business-as-usual emissions and continued land clearing leads to high warming, greater
  case)                         degraded                     probability of poor water quality impacts and higher frequency of COTS outbreaks
 S2 (BaU,        High (8.5)    Business    15               Business-as-usual emissions and water quality/COTS management
  RCP8.5)                       as usual
 S3 (BaU,        Moderate      Business    15               Moderate emissions mitigation and business-as-usual water quality/COTS management
  RCP6.0)         high (6.0)    as usual
 S4 (BaU,        Moderate      Business    15               Moderately strong emissions mitigation and business-as-usual water quality/COTS
  RCP4.5)         low (4.5)     as usual                     management
 S5 (BaU,        Low (2.6)     Business    15               Strong emissions mitigation and business-as-usual water quality/COTS management
  RCP2.6)                       as usual
 S6 (Best        Low (2.6)     Improved    20               Strong emissions mitigation and successful implementation of Reef 2050 goals results in
  case)                                                      relatively minor warming and lower probability of water quality/COTS impacts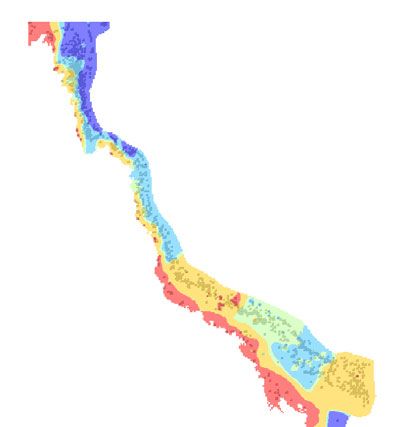
4   |                                                                                                                                WOLFF   ET AL.

other ocean basins (Elsner, Kossin, & Jagger, 2008), and that future      locations (pixels) for the 11 years (1982, 1986, 1987, 1992, 1998,
effects are uncertain (Knutson et al., 2010). Therefore, we here use      2002, 2010, 2011, 2015, 2016 and 2017) where significant thermal
past cyclone patterns as a surrogate for the future threat. Specifi-      stress occurred—defined as years with >50% of all reef pixels expe-
cally, we used reef-scale probabilities of cyclone impacts, integrating   riencing DHW >0. For these 11 bleaching years, reef pixels were
100 years of GBR cyclone observations with a library of over 7,000        then ranked, using a standardized scale between 100 (highest DHW)
synthetic cyclone tracks (Emanuel, Sundararajan, & Williams, 2008).       and 0 (lowest DHW). The mean and standard deviation (SD) of the
Probabilities capture GBR-wide observed distributions in storm            percentiles were then calculated for each reef (Figure S2).
intensity, with spatial variability in cyclone frequency and temporal        Relative percentile rankings were also calculated for the annual
clustering, a previously overlooked characteristic with ecological sig-   future DHM estimates from the four RCP projections. Finally, to dis-
nificance. In general, storms are more frequent and more regularly        tribute future DHM estimates spatially, three steps were used for
timed in the central GBR and less frequent and clustered in both the      each year (2017–2050): Firstly, at each reef location, a “random”
northern and southern GBR (Wolff et al., 2016).                           ranking was generated from a Gaussian distribution using the mean
                                                                          and standard deviation of the CoRTAD/CRW percentile ranking
                                                                          associated with each reef. Secondly, this percentile ranking was used
2.2.2 | Thermal stress
                                                                          to find the RCP model pixel with the closest matching ranking per-
Projections of sea surface temperature (SST) were derived from the        centile. The DHM associated with the selected RCP pixel was then
UK Hadley Centre Global Environmental Model HadGEM2-ES using              used to assign a DHM value for that particular reef and year.
the four greenhouse gas trajectories adopted by the IPCC for its
fifth Assessment Report (IPCC, 2014): RCPs 8.5, 6.0, 4.5 and 2.6
                                                                          2.2.3 | Water quality
predict global mean temperatures of ~3.7°C, ~2.2°C, ~1.8°C and
~1°C by year 2100 respectively. Coral bleaching events under these        Previous studies have demonstrated strong correlations between
RCPs were modelled following the approach of Wolff et al. (2015).         wet season river run-off, plume development and water quality gra-
Briefly, an observed SST climatology was created using Hadley Cen-        dients (Brodie et al., 2012; Devlin, Schroeder, et al., 2012; Devlin,
tre Sea Ice and Sea Surface Temperature data set (HadISST) for the        et al., 2015) which in turn expose coral reefs to nutrients and other
period 1985–1993 (the climatological period used by NOAA Coral            contaminants (Fabricius, Logan, Weeks, & Brodie, 2014; Petus, Da
Reef Watch). Future monthly anomalies >1°C above the maximum
                                                                          Silva, Devlin, Wenger, & Alvarez-Romero, 2014; Petus et al., 2016;
monthly mean from the climatology were accumulated within a               Wenger et al., 2016). Although effects of terrestrial run-off on coral
3 month window to calculate degree heating months (DHMs). Then,           biology and ecology are varied (McCook, 1999), we focus here on
for each of the 33 (0.5° resolution) pixels that intersected the GBR,     impacts that extend beyond the nearshore environment and those
the maximum DHM for each year was extracted.                              that correlate with nutrient exposure, specifically coral thermal sensi-
    The IPCC global circulation climate models (GCM), including the       tivity (Wooldridge, 2013) and COTS outbreaks (Fabricius et al.,
HadGEM2-ES used here, are designed to represent broad-scale vari-         2010).
ability and climate trends and are not meant to capture regional spa-        Elevated nutrient concentrations, driven primarily by river run-off
tial patterns at finer scales (Kwiatkowski, Halloran, Mumby, &            from altered catchments, has been proposed to reduce the thermal
Stephenson, 2013). Recent efforts to use statistical downscaling          tolerance of corals by 1–2°C, leading to greater bleaching suscepti-
techniques to provide local-scale projections show promise (van           bility (Wiedenmann et al., 2013; Wooldridge, 2009, 2013; Wool-
Hooidonk et al., 2016), but we were concerned that GCM deviation          dridge & Done, 2009). The potential effect of nutrient exposure on
from observed warming patterns (Kwiatkowski et al., 2013) remains         bleaching was captured here by combining the probabilities of expo-
an issue. Here, we use a hybrid approach that relied on fine-scale        sures to nutrient-rich plume waters with projected thermal anoma-
historical thermal stress patterns to drive spatial distributions, and    lies. Probability of exposure to plume waters was calculated for each
RCP output to represent the magnitude and variability in future           reef based on 15 years (2000–2014) of remote sensing observations
stress. Implicit in this approach is the assumption that spatial pat-     (Devlin, Mckinna, et al., 2012) (Figure S3). Projected DHM in nutri-
terns of future warming will follow recent observed patterns.             ent-enriched plume waters was calculated as above, except anoma-
    We characterized historical thermal stress patterns (1982–2017)       lies >0°C were used (instead of >1°C), assuming a decreased
using a degree heating weeks (DHW) metric. Specifically we used           threshold of 1°C. The acronym NDHM, for degree heating months
version 5 (1982–2012), a 4 km product, of the Coral Reef Tempera-         in nutrient-enriched plume waters is used to distinguish it from the
ture Anomaly Database (CoRTAD) (Selig, Casey, & Bruno, 2010) and          standard DHM estimates.
version 3 (2013–2017) of the NOAA Coral Reef Watch (CRW) 5 km                We recognize there are other river pollution impacts on coral,
product (Liu et al., 2014). Weekly DHW, similar to DHM, was               beyond nutrient exposure effects on thermal sensitivity (and COTS
extracted from each dataset using the methods adopted by NOAA             outbreak frequency), that we do not capture here. Coral growth, sur-
Coral Reef Watch which accumulates any anomaly >1°C over a                vival, reproduction and recruitment can be directly affected by vari-
12 week window (Strong, Liu, Skirving, & Eakin, 2011). The maxi-          ous run-off constituents (nutrients, turbidity and light reduction,
mum annual DHW was extracted for each of the 1,312 reef                   sedimentation, pollutants) and coral ecology can be indirectly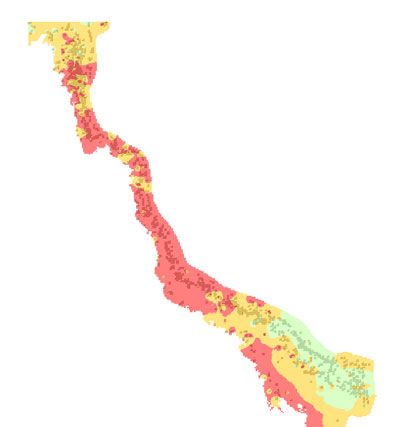
WOLFF   ET AL.                                                                                                                                 |   5

impacted by the influence these constituents have on coral competi-        high growth (recovery) rates (Osborne et al., 2011). However, we
tors, pests and pathogens (Fabricius, 2005). We focus here on ther-        recognize that GBR coral reef dynamics are far more complex than
mal sensitivity to nutrients because of the clear links with climate       our model can capture. Therefore, it is important to state up front
warming (allowing us to explore variability across scenarios) and the      that our coral trajectories are meant to indicate a relative difference
relative ease of parameterizing the relationship between exposure          between future scenarios, not an absolute prediction of future coral
(to plume waters) and effect (increased sensitivity to bleaching).         cover.
                                                                              The impacts of the four disturbance types were captured within
                                                                           the model through parameterization of observed mortality estimates
2.2.4 | Crown-of-thorns starfish (COTS)
                                                                           from several independent GBR studies (Table S1). This included mor-
The temporal and spatial characteristics of COTS outbreak densities        tality associated with cyclone damage, which varied by cyclone
along the GBR was captured using 31 years (1983–2014) of moni-             severity (categories 1–5), bleaching mortality during periods of sev-
toring data from the Australian Institute of Marine Science (AIMS).        ere thermal stress (DHM >2) and coral mortality from COTS preda-
Outbreaks have occurred at intervals of approximately 15 years and         tion during outbreaks. In cases where a reef experienced a cyclone
all following flood years (Fabricius et al., 2010). Primary outbreaks      in a given year, it was assumed that the cooling effect of the cyclone
form in the northern GBR in an area between Cairns and Cooktown            was sufficient to negate any thermal stress for that year (Carrigan &
(Figure 4a) and then progress southward at a rate of ~1° of latitude       Puotinen, 2014). Nutrient-enriched water triggered bleaching mortal-
every 3 years (and northward at slower, less consistent rate) via lar-     ity when plumes impinged on reefs that were also exposed to ther-
val dispersal (Pratchett, Caballes, Riveraposada, & Sweatman, 2014).       mal stress (NDHM >2). Disturbances affected coral trajectories
Outbreak density is geographically variable, but particularly persis-      through the magnitude of mortality and through the frequency with
tent (~6–8 years) along the central GBR (Pratchett et al., 2014).          which they occurred.
Reef-scale outbreak probabilities were modelled here such that they           Reef-scale coral cover was estimated for each of the six environ-
reflect the historical outbreak frequency, regional-scale patterns of      mental scenarios (Table 1) by running the ecological model at 1,312
outbreak progression and persistence, and regional estimates of            reefs (Figure S1) across the GBR for the years 2017–2050. For each
annual reef-scale outbreak probability.                                    reef, at each annual time-step, disturbance risks were a function of the
                                                                           disturbance probability of each disturbance type. This was repeated
                                                                           for 100 simulations to introduce stochasticity in outcomes (details in
2.3 | Ecological model and disturbance impacts
                                                                           Supporting Information). Each simulation represents a single realiza-
We estimated Acropora coral dynamics by fitting a logistic function        tion of the different impact probabilities across space and time.
to observed Acropora recovery trajectories of the GBR (Halford,               The simple but empirically grounded coral model used here is
Cheal, Ryan, & Williams, 2004). The Halford et al. (2004) study is         meant to represent broad ecological impacts of spatially explicit dis-
particularly well suited for establishing recovery rates because it pro-   turbances. Our aim is to contrast the relative effects of different
vides a time series (1984–1996) encompassing a major disturbance           actions and stressors on the overall system to identify possible
(COTS), which reduced coral cover from >80% to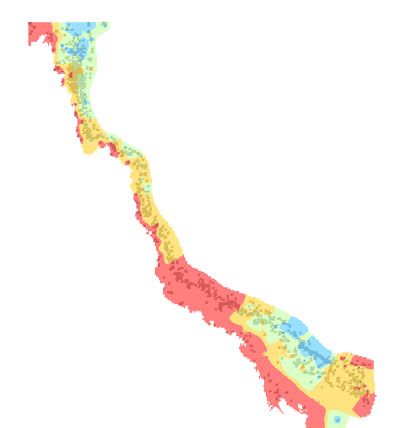
6   |                                                                                                                                WOLFF      ET AL.

    The relative response of GBR coral cover under different distur-      depauperate on many nearshore reefs, particularly in coastal areas of
bances and across scenarios is quantified using a metric of reef per-     the Wet Tropics, roughly between Townsville and Cooktown (Clark
formance (Mumby & Anthony, 2015). This metric represents the              et al., 2017; Done, 1982; Roff et al., 2012). Whether reduction tar-
ratio of mean coral cover (2017–2050) from model runs that include        gets for pollutant run-off set in the Reef 2050 Plan can lead to a
anthropogenic stressors (global warming, COTS, nutrient run-off) to       return of Acropora to the nearshore reefs it once dominated (Clark
mean coral cover under model runs that represent natural, pristine,       et al., 2017; Roff et al., 2012) is beyond the scope of this study.
conditions (cyclones only). For example, if a reef under only cyclones
had a mean coral cover over the time series of 60% and under the
addition of global warming had a mean cover of 40% and under all          3 | RESULTS
stressors had a mean of 30%, the reef performance under climate
change would be 0.67 and under all stressors would be 0.5. In other       Qualitatively, predicted coral cover followed similar trajectories for
words, the reef is performing at only 67% of its potential (if climate    all six scenarios, with marked increase during the beginning of the
change was abated) under climate change and at only 50% of its            time series followed by a protracted period of decline (Figure 2). The
potential if all anthropogenic stressors were abated. In this example,    predicted rate of recovery from the estimated GBR-wide mean coral
we can calculate that 66% of the reef’s performance loss is attributa-    cover in 2016 (13%) was highest for the best-case (Figure 2f) and
ble to climate change and 44% to local stressors. Estimating the          lowest for the worst-case management scenarios (Figure 2a). Coral
GBR-wide performance metrics required two steps. First, the mean          cover reached peak values and started declining approximately
ratios (across simulations) are calculated for each reef. Next, the       8 years earlier for RCP 8.5 (Figure 2a,b) than for RCP 2.6 (Figure 2e,
GBR-wide mean and standard deviations are calculated (across              f). Best-case management practices (all local stressors removed)
reefs). For each scenario, a performance metric is reported for condi-    under RCP 2.6 can potentially facilitate a peak coral cover of around
tions where all stressors are included and for conditions where only      56% by 2030, declining to 33% by year 2050. While a peak of 50%
global warming (local stressors excluded) is considered.                  coral cover was predicted to be possible before 2030 for RCP 8.5
    To explore the spatial variability of disturbance impacts in more     under best-case management (top of red trajectory in Figure 2b), the
detail, we used a metric of vulnerability that measured mean propor-      climate-driven decline is much more severe than under RCP 2.6,
tion of years (across simulations), relative to the 34 year time series   resulting in 5% coral cover by 2050. As expected, coral trajectories
(2017–2050), that coral cover on each reef remained below a 30%           under RCP 6.0 and 4.5 (Figure 2c,d) fell between RCP 8.5 and 2.6
threshold. This threshold was chosen because it represents the his-       outcomes.
torical mean coral cover when the GBR was inscribed as a World               The shapes of the mean trajectories in coral cover are driven pri-
Heritage Area in 1981 (Great Barrier Reef Marine Park Authority,          marily by climate change projections (Figure 2); after reaching peaks
2014). Spatially explicit results were mapped for scenarios 2 (busi-      during the late 2020s to early 2030s, coral trajectories slipped into
ness-as-usual management and high [RCP 8.5] emissions) and 5              net decline, with the mean rate of decline determined predominantly
(business-as-usual management and low [RCP 2.6] emissions). For           by the carbon emission pathway. Under high emissions (RCP 8.5),
each scenario, vulnerability results are shown under all stressors and    global warming alone drove declines such that mean GBR perfor-
under only global stressors (cyclones and global warming). In addi-       mance was only 0.57 of its potential (Figure 2; Table 2). Perfor-
tion, management potential, the decrease in vulnerability if local        mance under low emissions (RCP 2.6) was markedly higher at 0.85,
stressors were fully abated, is also shown. Management potential          representing an improvement relative to RCP 8.5 of nearly 50%
was calculated as the inverse of vulnerability, or the proportion of      (Table 2). Reef performance under moderately low emissions (RCP
the total number of years (34) coral cover remained equal to or           4.5) was nearly 18% worse at 0.70 than under RCP 2.6. This differ-
above the 30% threshold. For reference, a management potential of         ence between RCP 4.5 and 2.6 is worth noting because these two
0.5 translates to an extra 17 years coral cover could exceed (or          pathways represent Paris climate accord goals (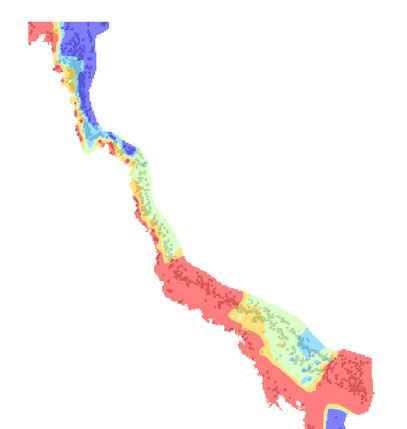
WOLFF ET AL. | 7
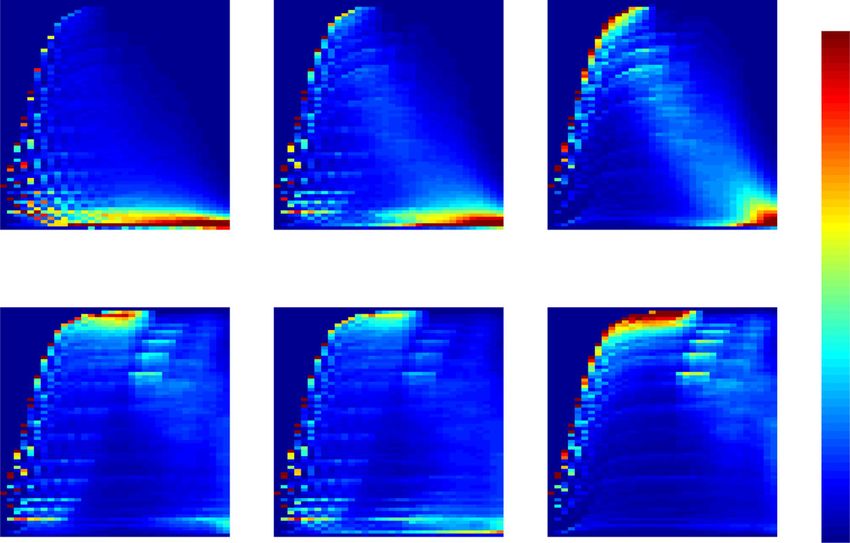
S1. Worst-case, RCP 8.5 S2. BaU, RCP 8.5 S3. BaU, RCP 6.0
70
(a) (b) (c)
60
Mean coral cover (%)
50
40
30
20
10
0
S4. BaU, RCP 4.5 S5. BaU, RCP 2.6 S6. Best-case, RCP 2.6
70
(d) (e) (f)
60
Mean coral cover (%)
50
40
30
Climate change
20
COTS
10 Water quality
0
2020 2030 2040 2050 2020 2030 2040 2050 2020 2030 2040 2050
Year Year Year
F I G U R E 2 Modelled trajectories of mean coral cover on the GBR based on each of the six scenarios (Table 1) encompassing different
combinations of local stressors (worst case, business as usual [BaU], best case) with four climate projections (RCPs). Within each scenario, coral
trajectories are shown for four model runs: Pristine condition which only includes cyclone disturbance (top of blue trajectory); the addition of
climate change impacts (top of red trajectory); the addition of COTS (top of green trajectory); and the addition of nutrient run-off (thick black
line). The blue area represents loss due to global warming (bleaching), the red area the loss due to COTS, the green area the loss due to
nutrient-induced bleaching and the bottom trajectory represents coral cover when all disturbances are present. The top of the red trajectory
represents management potential if all local stressors were removed (best-case management)
T A B L E 2 GBR-wide mean (SD) reef performance results for each of the six scenarios. Reef performance scores are shown for model runs
with all stressors considered, and for just climate change. The causes for the overall total performance loss (climate change vs. local stressors)
are shown as per cent attribution. The contribution of COTS vs. river runoff (RR) to the local component of performance loss is also shown.
Reef performance metric is calculated as the mean ratio of coral cover under pristine conditions (cyclones only) vs. coral cover under stressor
conditions (Mumby & Anthony, 2015)
Local loss attribu-
Reef performance Total loss attribution (%) tion (%)
Scenario All stressors Climate change Climate change Local stressors COTS RR
1. Worst case 0.26 (0.15) 0.57 (0.06) 58 42 44 56
2. BaU, RCP8.5 0.41 (0.13) 0.57 (0.06) 72 28 65 35
3. BaU, RCP6.0 0.54 (0.17) 0.75 (0.06) 54 46 64 36
4. BaU, RCP4.5 0.49 (0.17) 0.70 (0.09) 60 40 65 35
5. BaU, RCP2.6 0.62 (0.20) 0.85 (0.05) 39 66 63 37
6. Best case 0.73 (0.12) 0.85 (0.05) 54 46 76 24
BaU Mean 0.52 0.72 56 44 64 36
8              |                                                                                                                                   WOLFF   ET AL.

                                     All stressors                      All stressors                         Global stressors
                       (a)                                   (b)                                   (c)
                                    worst-case (S1)                      BaU (S2)                             RCP 8.5 (S1&2)
                      70
                      60                                                                                                                            0.1
    Coral cover (%)

                      50
                                                                                                                                                    0.09
                      40
                      30                                                                                                                            0.08
                      20
                                                                                                                                                    0.07
                      10
                       0                                                                                                                            0.06

                                                                                                                                                            Probability
                                 All stressors                         All stressors                         Global stressors
                       (d)                                   (e)                                   (f)
                                best-case (S6)                          BaU (S5)                             RCP 2.6 (S5&6)                         0.05
                      70
                      60                                                                                                                            0.04
    Coral cover (%)

                      50
                                                                                                                                                    0.03
                      40
                      30                                                                                                                            0.02
                      20
                                                                                                                                                    0.01
                      10
                       0                                                                                                                            0
                             2020     2030     2040   2050      2020     2030      2040     2050         2020     2030     2040      2050
                                        Year                                Year                                    Year

F I G U R E 3 Probability matrices of coral cover for all 1,312 reefs across all 100 simulations of coral cover trajectories. Each cell represents
the probability that a coral state (y-axis) was observed at a given year (x-axis). Four scenarios are shown, two from RCP 8.5 (high emission) and
two from RCP 2.6 (low emission). The top panels show worst-case scenario (a) and business-as-usual management scenario (b) results for all
stressors under RCP 8.5. Panel (c) shows results for just global stressors (local stressors removed). The bottom panels show best-case (d) and a
business-as-usual management scenario (e) and results for just global stressors (f) under RCP 2.6. Solid blacklines represent mean of the
trajectories

impacts themselves (Figure 2; Table 2). However, for all the scenar-                    RCP 2.6 indicated that approximately one-third of GBR reefs could
ios, particularly the RCPs 8.5, 6.0 and 4.5, the relative magnitude of                  have coral cover exceeding 60% through 2035 under business-as-
impacts from local stressors declined with time. This can be seen in                    usual management regimes (Figure 3e), increasing to nearly one-half
Figure 2 as a gradual thinning of the relative contribution of local                    of reefs if local stressors are reduced (Figure 3d) and to two-thirds if
stressors (red and green area) as the relative contribution of climate                  local stressors are removed (Figure 3f). In contrast, the probability of
change (blue area) increases. The reason for this relative decline is                   high cover (>60%) under RCP 8.5 scenarios is much lower. Under
twofold. First, as the magnitude of thermal anomalies increases due                     the business-as-usual management scenario (Figure 3b), the probabil-
to global warming, the higher thermal sensitivity of reefs within                       ity peaks at only 0.2, falling to less than 0.01 by 2036. Under the
plume waters matters less. Second, as bleaching mortality drives the                    worst-case scenario, probability of high cover never exceeds 0.09
coral cover of more reefs to low states, the opportunity for COTS                       and falls to less than 0.01 by 2033 (Figure 3a). Even the potential
infestation decrease.                                                                   for high cover under RCP 8.5 if local stressors were removed is lim-
                  The high degree of variability in the trajectories of coral cover     ited, peaking at 0.44 and dropping to less than 0.01 by 2043 (Fig-
(Figure 3) is a function of geographical differences in disturbance                     ure 3c). This divergence in potential for high coral cover between
probability (Figures S2 and S3) and sheer size (and number of reefs)                    RCPs further separates as bleaching stress increases. By 2050, none
of the GBR. Yet, embedded within this uncertainty are several inter-                    of the reef trajectories exceed 60% coral cover for the RCP 8.5 sce-
esting differences among management scenarios and stressors that                        narios, while for RCP 2.6, 4%–9% of reefs still maintain high coral
are not revealed by the mean trajectories alone. For example, under                     cover, depending on the level of stress from nutrients and/or COTS.
RCP 2.6, there is a greater chance that individual reef trajectories                       In addition to reducing the probability that reefs will have high
will approach carrying capacity (fitted at 68% from the logistic equa-                  cover, local stressors also increase the probability that reefs will be
tion) than under RCP 8.5 (Figure 3). Here, analyses of results for                      pushed to a degraded state with low cover (Figure 3). Across the
WOLFF ET AL. | 9
(a) (b) (c)
–10°
All stressors Global stressors Management
North
RCP8.5 RCP8.5 potential
RCP8.5
–15° Cooktown Center North
Cairns
Center South
Townsville
South
–20°
Mackay
Gladstone
–25°
(d) (e) (f)
–10°
All stressors Global stressors Management
RCP2.6 RCP2.6 potential
RCP2.6
–15°
–20°
–25°
145° 150° 145° 150° 145° 150°
0.16 0.39 0.54 0.64 0.78 1.0 0.14 0.24 0.31 0.46 0.55 0.73 0.01 0.06 0.12 0.16 0.35 0.83
Vulnerability Vulnerability Vulnerability improvement
F I G U R E 4 Reef-scale vulnerability and management potential to improve vulnerability for business-as-usual scenarios 2 (high emissions, top
panels) and 5 (low emissions, bottom panels). Vulnerability (proportion of the 34 years (2017–2050) that reefs are below 30% coral cover
threshold) is shown for all stressors (a, d) and for just climate change and cyclones (b, e). Management potential (c, f) represents the
vulnerability improvement (net proportion of years above 30% coral cover) that could be gained if local stressors were eliminated. Also shown
are geographical boundaries of the four GBR management zones. Note that each column of panels is scaled independently to highlight
geographical patterns and differences between RCP outcomes
time series, a mean of 40% of the trajectories in the business-as- as a descending band of higher probability in RCP 8.5, reefs that are
usual management scenarios fell below 10% coral cover under RCP also impacted by local stressors spend an increasing amount of time
8.5 (Figure 3b). This is nearly two times greater than if local stres- in low coral states.
sors were absent (Figure 3c). Results were similar for RCP 2.6, with Contributing to the high variability in GBR-wide reef trajectories
a mean of 21% of the trajectories below 10% for business-as-usual (Figure 3) are some important spatial patterns driven by geographical
management (Figure 3e), compared with 5% of trajectories in the differences in global warming, cyclones, water quality and COTS
absence of local stressors (Figure 3f). In addition, climate change and (Figure 4). We focused here on the business-as-usual management
local stressors interact, such that the likelihood of a reef being in a scenarios 2 (RCP 8.5) and 5 (RCP 2.6), contrasting the effects of
low coral state increases with time. As bleaching frequency pushes alternative emission pathways. Analyses indicated that coral vulnera-
trajectories towards lower and lower peak cover, seen most clearly bility varied dramatically when all stressors were included (Figure 4a,10 | WOLFF ET AL.
d), ranging from always vulnerable (100% of the time), to rarely vul- Wolanski, Andutta, Deleersnijder, Li, & Thomas, 2017). The implica-
nerable (16% of the time). Clear geographical patterns emerged with tion is that if near-term conditions return to background impact
the northern quarter and parts of the southern GBR less vulnerable probabilities, reefs will have time to recover. For example, temporal
than the rest of the GBR. The southern half of the GBR, particularly clustering of storms along the GBR (Wolff et al., 2016) suggests that
regions adjacent to Townsville and Mackay, had the highest vulnera- the period of elevated cyclone activity during the past decade could
bility (Figure 4a,d). Under RCP 2.6, over 40% of the reefs were clas- be followed by relative cyclone quiescence.
sified as low vulnerability (dark blue) (Figure 4d) while under RCP On the other hand, any single disturbance, as illustrated by the
8.5 (Figure 4a), no reefs were in this category. Much of the differ- 2016/2017 bleaching event, can significantly alter GBR outcomes
ence in vulnerability between scenarios was driven by climate and shorten the opportunity for coral recovery in the coming dec-
change (Figure 4b,e). Under RCP 8.5, bleaching stress was sufficient ades. Furthermore, even our best-case scenario (6), which involves
to drive over 42% of the reefs into a highly vulnerable category (red) significant restoration of water quality conditions as prescribed by
(Figure 4b), a category that was absent under RCP 2.6 (Figure 4e). Australia’s long-term sustainability plan for the GBR (Reef 2050),
Under both scenario 2 and 5, potential management benefits are halving of the COTS outbreak frequency, and significant reductions
geographically variable, with both the southern half, and nearshore in carbon emissions, predicts a 27% decline in reef performance
reefs most amendable to local and regional interventions (Figure 4c, compared with its potential if climate change did not occur. And the
f). While management potential is significant in both scenarios, least optimistic scenario (S1), which captures the high-emission tra-
nearly 31% of GBR reefs fall within the high improvement category jectory (RCP 8.5) the world is currently following (Sanford, Frumhoff,
(red) under RCP 2.6 (Figure 4f) compared with only 9% under RCP Luers, & Gulledge, 2014), possibly even exceeding (Wagner, Ross,
8.5 (Figure 4c). The distribution within this category is skewed Foster, & Hankamer, 2016), and assumes increases in local stressors
towards the RCP 2.6 results: 9% of reefs (114) have a management due to rampant watershed land clearing (Kroon et al., 2016), predicts
potential exceeding 0.5 under RCP 2.6 compared with less than 1% that GBR performance will only be at 26% of its potential through
reefs (7) under RCP 8.5. For context, a vulnerability improvement of 2050. In short, the magnitude and duration of any potential recovery
0.5 translates to a potential for management actions to lift coral will be constrained by the combined effects of global warming and
cover over 30% for an extra 17 years. local stressors.
It is important to reiterate that we only capture two, increased
thermal sensitivity and COTS outbreak frequency, of the many
4 | DISCUSSION mechanisms by which river pollution can impact coral. Other docu-
mented effects of river pollution include smothering and rapid mor-
First, we recognize that our model, based solely on the coral genus tality from terrestrial mud, reduced growth from less light
Acropora, is a coarse simplification of the ecological dynamics of cor- penetration, lower recruitment and survival due to enhanced sub-
als on the GBR. Therefore, predictions of future coral cover in this strate competition from macroalgae and greater pathogen-related
study are indicative only. However, our analyses comparing reef tra- mortality (Fabricius, 2005). Evidence suggests the cumulative impacts
jectories among scenarios and over time have relative value and of river pollution has led to the relative lack of coral diversity on
offer insights into the GBR’s future that is not possible with expo- inshore reefs (De’ath & Fabricius, 2010), including on some reefs,
sure layers alone. While prior work has examined GBR exposure to the near or complete extirpation of Acropora from its once historical
disturbances (Maynard et al., 2016), this study captures disturbance dominance (Clark et al., 2017; Roff et al., 2012). From a modelling
impact (sensitivity) and recovery and provides the first reef-scale vul- perspective, it remains challenging to parameterize water quality
nerability assessment for coral cover on the GBR. impacts given the paucity of information regarding specific river pol-
Our results predict that the GBR has substantial scope for coral lution exposure thresholds that trigger specific negative (or positive)
recovery over the next three decades, but with large spatial variabil- coral response (Brodie, Lewis, Wooldridge, Bainbridge, & Water-
ity in the potential for local- and regional-scale management actions house, 2014). Furthermore, the impacts we do include are likely
to support resilience and sustain moderate to high coral cover. This more complex than their treatment in this study implies. For exam-
spatial pattern in management potential is driven by the scope for ple, there remains a need to better quantify how solar irradiance,
alleviating the cumulative, and in part interactive, effects of cyclones, temperature and nutrient exposure interact to affect coral–algae
warming, COTS and nutrient run-off. Yet, even under the worst-case symbiosis and bleaching risk (Wooldridge, 2013). Also, larval connec-
scenario (S1), with further water quality degradation, more frequent tivity likely drives greater reef-scale variability in COTS outbreak
COTS outbreaks, and no global action on emissions, the GBR shows likelihood than we capture here (Hock, Wolff, Condie, Anthony, &
some near-term (one to two decades) capacity to recover from its Mumby, 2014; Hock et al., 2017). In summary, future impacts of
present and historical lows. This suggests that the recent coral decli- river pollution, including any management-related improvements, will
nes on the GBR were driven by an anomalous alignment of distur- likely be more temporally and spatially variable than our projections
bance events, including a series of unusually severe cyclones imply.
(Puotinen, Maynard, Beeden, Radford, & Williams, 2016) followed by Our results are consistent with global analyses predicting that
~ o ever observed (Hughes et al., 2017;
the most intense El Nin the frequency, areal extent and severity of bleaching events willWOLFF ET AL. | 11
increase for all four RCPs (Logan, Dunne, Eakin, & Donner, 2014; sustained in the coming decades. Any factors that either reduce
van Hooidonk, Maynard, & Planes, 2013). To date, major global and recovery or enhance mortality would likely result in less optimistic
regional GBR bleaching events have been driven primarily by intense reef outcomes than we present here (Figure S6). On the other hand,
~ o events (Eakin et al., 2016; Hughes et al., 2017) (although
El Nin because our models assume no adaptation our results could also be
severe GBR bleaching in 2002 was during an ENSO neutral year), pessimistic, but by how much is currently uncertain and a major
with more frequent, but less severe bleaching occurring during less research question (Mumby, 2017).
~ o (Eakin, Lough, & Heron, 2009). This general pattern
intense El Nin In conclusion, coral cover on the GBR could recover substantially
is predicted to hold over the next 10–20 years, but with some from its current historical lows, but the path towards long-term sus-
uncertainty over the frequency and severity of intense thermal stress tainability of corals will require a two-pronged strategy including
events (Ainsworth et al., 2016; Stevenson, 2012; Wang et al., 2017). intensive and up-scaled management of water quality and COTS,
However, as global sea surface warming is predicted to continue, and meeting the ambitions (12 | WOLFF ET AL.
Biological Sciences, 276, 3019–3025. https://doi.org/10.1098/rspb.
Devlin, M. J., Mckinna, L. W., Alvarez-Romero, J. G., Petus, C., Abott, B.,
2009.0339 Harkness, P., & Brodie, J. (2012). Mapping the pollutants in surface
Anthony, K. R. N. (2016). Coral reefs under climate change and ocean riverine flood plume waters in the Great Barrier Reef, Australia. Mar-
acidification: Challenges and opportunities for management and pol- ine Pollution Bulletin, 65, 224–235. https://doi.org/10.1016/j.marpolb
icy. Annual Review of Environment and Resources, 41, 59–81. https://d ul.2012.03.001
oi.org/10.1146/annurev-environ-110615-085610 Devlin, M. J., Petus, C., Da Silva, E., Tracey, D., Wolff, N. H., Waterhouse,
Anthony, K. R. N., Kline, D. I., Diaz-Pulido, G., Dove, S., & Hoegh-Guld- J., & Brodie, J. (2015). Water quality and river plume monitoring in
berg, O. (2008). Ocean acidification causes bleaching and productivity the Great Barrier Reef: An overview of methods based on ocean col-
loss in coral reef builders. Proceedings of the National Academy of our satellite data. Remote Sensing, 7, 12909–12941. https://doi.org/
Sciences USA, 105, 17442–17446. https://doi.org/10.1073/pnas. 10.3390/rs71012909
0804478105 Devlin, M., Schroeder, T., Mckinna, L., Brodie, J., Brando, V., & Dekker, A.
Anthony, K. R. N., Maynard, J. A., Diaz-Pulido, G., Mumby, P. J., Mar- (2012). Monitoring and mapping of flood plumes in the Great Barrier
shall, P. A., Cao, L., & Hoegh-Guldberg, O. (2011). Ocean acidifica- Reef based on in situ and remote sensing observations. In N. B.
tion and warming will lower coral reef resilience. Global Change Chang (Ed.), Environmental remote sensing and systems analysis (pp.
Biology, 17, 1798–1808. https://doi.org/10.1111/j.1365-2486.2010. 147–188). Boca Raton, FL: CRC Press.
02364.x Done, T. J. (1982). Patterns in the distribution of coral communities
Bellwood, D. R., Hughes, T. P., Folke, C., & Nystro € m, M. (2004). Con- across the central Great Barrier Reef. Coral Reefs, 1, 95–107.
fronting the coral reef crisis. Nature, 429, 827–833. https://doi.org/ https://doi.org/10.1007/BF00301691
10.1038/nature02691 Doropoulos, C., Ward, S., Diaz-Pulido, G., Hoegh-Guldberg, O., & Mumby,
Birkeland, C. (1982). Terrestrial runoff as a cause of outbreaks of Acan- P. J. (2012). Ocean acidification reduces coral recruitment by disrupt-
thaster planci (Echinodermata: Asteroidea). Marine Biology, 69, 175– ing intimate larval-algal settlement interactions. Ecology Letters, 15,
185. https://doi.org/10.1007/BF00396897 338–346. https://doi.org/10.1111/j.1461-0248.2012.01743.x
Brodie, J., Devlin, M., & Lewis, S. (2017). Potential enhanced survivorship Douvere, F., & Badman, T. (2012). Mission report: Reactive monitoring mis-
of crown of thorns starfish larvae due to near-annual nutrient enrich- sion to Great Barrier Reef, Australia, 6th to 14th March 2012. Paris,
ment during secondary outbreaks on the central mid-shelf of the France: UNESCO World Heritage Centre.
Great Barrier Reef, Australia. Diversity, 9, 17. https://doi.org/10. Eakin, C. M., Liu, G., Gomez, A. M., De La Cour, J. L., Heron, S. F., Skirv-
3390/d9010017 ing, W. J., . . . Strong, A. E. (2016). Global coral bleaching 2014–2017:
Brodie, J. E., Kroon, F. J., Schaffelke, B., Wolanski, E. C., Lewis, S. E., Status and an appeal for observations. Reef Encounter, 31, 20–26.
Devlin, M. J., . . . Davis, A. M. (2012). Terrestrial pollutant runoff to Eakin, C. M., Lough, J. M., & Heron, S. F. (2009). Climate variability and
the Great Barrier Reef: An update of issues, priorities and manage- change: Monitoring data and evidence for increased coral bleaching
ment responses. Marine Pollution Bulletin, 65, 81–100. https://doi. stress. In M. J. H. Oppen & J. M. Lough (Eds.), Coral bleaching (pp.
org/10.1016/j.marpolbul.2011.12.012 41–67). Berlin, Heidelberg, Germany: Springer Berlin Heidelberg.
Brodie, J., Lewis, S., Wooldridge, S., Bainbridge, Z., & Waterhouse, J. https://doi.org/10.1007/978-3-540-69775-6
(2014). Ecologically relevant targets for pollutant discharge from the Elsner, J. B., Kossin, J. P., & Jagger, T. H. (2008). The increasing intensity
drainage basins of the Wet Tropics Region, Great Barrier Reef. Towns- of the strongest tropical cyclones. Nature, 455, 92–95. https://doi.
ville, QLD: Centre for Tropical Water & Aquatic Ecosystem Research org/10.1038/nature07234
(TropWATER), James Cook University. Emanuel, K., Sundararajan, R., & Williams, J. (2008). Hurricanes and global
Brodie, J., & Pearson, R. G. (2016). Ecosystem health of the Great Barrier warming: Results from downscaling IPCC AR4 simulations. Bulletin of
Reef: Time for effective management action based on evidence. Estu- the American Meteorological Society, 89, 347–367. https://doi.org/10.
arine, Coastal and Shelf Science, 183, 438–451. https://doi.org/10. 1175/BAMS-89-3-347
1016/j.ecss.2016.05.008 Fabricius, K. E. (2005). Effects of terrestrial runoff on the ecology of cor-
Brodie, J., Waterhouse, J., Schaffelke, B., Kroon, F., Thorburn, P., Rolfe, als and coral reefs: Review and synthesis. Marine Pollution Bulletin,
J., . . . Mckenzie, L. (2013). 2013 Scientific consensus statement: Land 50, 125–146. https://doi.org/10.1016/j.marpolbul.2004.11.028
use impacts on Great Barrier Reef water quality and ecosystem condi- Fabricius, K. E., Logan, M., Weeks, S., & Brodie, J. (2014). The effects of
tion. Brisbane, QLD: The State of Queensland. river run-off on water clarity across the central Great Barrier Reef.
Carrigan, A. D., & Puotinen, M. (2014). Tropical cyclone cooling combats Marine Pollution Bulletin, 84, 191–200. https://doi.org/10.1016/j.mar
region-wide coral bleaching. Global Change Biology, 20, 1604–1613. polbul.2014.05.012
https://doi.org/10.1111/gcb.12541 Fabricius, K. E., Okaji, K., & De’ath, G. (2010). Three lines of evidence to
Cheal, A. J., Macneil, M. A., Emslie, M. J., & Sweatman, H. (2017). The link outbreaks of the crown-of-thorns seastar Acanthaster planci to
threat to coral reefs from more intense cyclones under climate the release of larval food limitation. Coral Reefs, 29, 593–605.
change. Global Change Biology, 23, 1511–1524. https://doi.org/10. https://doi.org/10.1007/s00338-010-0628-z
1111/gcb.13593 Frieler, K., Meinshausen, M., Golly, A., Mengel, M., Lebek, K., Donner, S.
Clark, T. R., Roff, G., Zhao, J.-X., Feng, Y.-X., Done, T. J., McCook, L. J., & D., & Hoegh-Guldberg, O. (2013). Limiting global warming to 2°C is
Pandolfi, J. M. (2017). U-Th dating reveals regional-scale decline of unlikely to save most coral reefs. Nature Climate Change, 3, 165–170.
branching Acropora corals on the Great Barrier Reef over the past https://doi.org/10.1038/nclimate1674
century. Proceedings of the National Academy of Sciences USA, 114, Gardner, T. A., Cote, I. M., Gill, J. A., Grant, A., & Watkinson, A. R.
10350–10355. https://doi.org/10.1073/pnas.1705351114 (2003). Long-term region-wide declines in Caribbean corals. Science,
De’ath, G., & Fabricius, K. (2010). Water quality as a regional driver of 301, 958–960. https://doi.org/10.1126/science.1086050
coral biodiversity and macroalgae on the Great Barrier Reef. Ecologi- Great Barrier Reef Marine Park Authority (2014). Great barrier reef out-
cal Applications, 20, 840–850. https://doi.org/10.1890/08-2023.1 look report 2014. Townsville, Qld: GBRMPA.
De’ath, G., Fabricius, K. E., Sweatman, H., & Puotinen, M. (2012). The Halford, A., Cheal, A. J., Ryan, D., & Williams, D. M. (2004). Resilience to
27–year decline of coral cover on the Great Barrier Reef and its large-scale disturbance in coral and fish assemblages on the Great
causes. Proceedings of the National Academy of Sciences USA, 109, Barrier Reef. Ecology, 85, 1892–1905. https://doi.org/10.1890/03-
17995–17999. https://doi.org/10.1073/pnas.1208909109 4017WOLFF ET AL. | 13
Hock, K., Wolff, N. H., Condie, S. A., Anthony, K. R. N., & Mumby, P. J. to climatic stress. Current Biology, 24, R413–R423. https://doi.org/10.
(2014). Connectivity networks reveal the risks of crown-of-thorns 1016/j.cub.2014.04.029
starfish outbreaks on the Great Barrier Reef. Journal of Applied Ecol- Ortiz, J. C., Bozec, Y.-M., Wolff, N. H., Doropoulos, C., & Mumby, P. J.
ogy, 51, 1188–1196. https://doi.org/10.1111/1365-2664.12320 (2014). Global disparity in the ecological benefits of reducing carbon
Hock, K., Wolff, N. H., Ortiz, J. C., Condie, S. A., Anthony, K. R. N., Black- emissions for coral reefs. Nature Climate Change, 4, 1090–1094.
well, P. G., & Mumby, P. J. (2017). Connectivity and systemic resili- https://doi.org/10.1038/nclimate2439
ence of the Great Barrier Reef. PLOS Biology, 15, e2003355. Osborne, K., Dolman, A. M., Burgess, S. C., & Johns, K. A. (2011). Distur-
https://doi.org/10.1371/journal.pbio.2003355 bance and the dynamics of coral cover on the Great Barrier Reef
Hoegh-Guldberg, O., Mumby, P. J., Hooten, A. J., Steneck, R. S., Green- (1995–2009). PLoS ONE, 6, e17516. https://doi.org/10.1371/journal.
field, P., Gomez, E., . . . Knowlton, N. (2007). Coral reefs under rapid pone.0017516
climate change and ocean acidification. Science, 318, 1737–1742. Osborne, K., Thompson, A. A., Cheal, A. J., Emslie, M. J., Johns, K. A.,
https://doi.org/10.1126/science.1152509 Jonker, M. J., . . . Sweatman, H. (2017). Delayed coral recovery in a
Hughes, T. P., Day, J. C., & Brodie, J. (2015). Securing the future of the warming ocean. Global Change Biology, 23, 3869–3881. https://doi.
Great Barrier Reef. Nature Climate Change, 5, 508–511. https://doi. org/10.1111/gcb.13707
org/10.1038/nclimate2604
Petus, C., Da Silva, E. T., Devlin, M., Wenger, A. S., & Alvarez-Romero, J.
Hughes, T. P., Kerry, J. T., Alvarez-Noriega,
M., Alvarez-Romero, J. G., G. (2014). Using MODIS data for mapping of water types within river
Anderson, K. D., Baird, A. H., . . . Bridge, T. C. (2017). Global warming plumes in the Great Barrier Reef, Australia: Towards the production
and recurrent mass bleaching of corals. Nature, 543, 373–377. of river plume risk maps for reef and seagrass ecosystems. Journal of
https://doi.org/10.1038/nature21707 Environmental Management, 137, 163–177. https://doi.org/10.1016/
IPCC (2014). Climate change 2013: The physical science basis: Working j.jenvman.2013.11.050
Group I contribution to the Fifth assessment report of the Intergovern- Petus, C., Devlin, M., Thompson, A., McKenzie, L., Teixeira da Silva, E.,
mental Panel on Climate Change. Cambridge, UK: Cambridge Univer- Collier, C., . . . Martin, K. (2016). Estimating the exposure of coral
sity Press. reefs and seagrass meadows to land-sourced contaminants in river
Kleypas, J. A., Buddemeier, R. W., Archer, D., Gattuso, J.-P., Langdon, C., flood plumes of the Great Barrier Reef: Validating a simple satellite
& Opdyke, B. N. (1999). Geochemical consequences of increased risk framework with environmental data. Remote Sensing, 8, 210.
atmospheric carbon dioxide on coral reefs. Science, 284, 118–120. https://doi.org/10.3390/rs8030210
https://doi.org/10.1126/science.284.5411.118 Pratchett, M. S., Caballes, C. F., Riveraposada, J. A., & Sweatman, H. P. A.
Knutson, T. R., Mcbride, J. L., Chan, J., Emanuel, K., Holland, G., Landsea, (2014). Limits to understanding and managing outbreaks of crown-of-
C., . . . Sugi, M. (2010). Tropical cyclones and climate change. Nature thorns starfish (Acanthaster spp.). Oceanography and Marine Biology:
Geoscience, 3, 157–163. https://doi.org/10.1038/ngeo779 An Annual Review, 52, 133–200.
Kroon, F. J., Thorburn, P., Schaffelke, B., & Whitten, S. (2016). Towards Puotinen, M., Maynard, J. A., Beeden, R., Radford, B., & Williams, G. J.
protecting the Great Barrier Reef from land-based pollution. Global (2016). A robust operational model for predicting where tropical
Change Biology, 22, 1985–2002. https://doi.org/10.1111/gcb.13262 cyclone waves damage coral reefs. Scientific Reports, 6, 26009.
Kwiatkowski, L., Halloran, P. R., Mumby, P. J., & Stephenson, D. B. https://doi.org/10.1038/srep26009
(2013). What spatial scales are believable for climate model projec- Reef 2050 Long-Term Sustainability Plan. (2015). Commonwealth of Aus-
tions of sea surface temperature? Climate Dynamics, 43, 1483–1496. tralia 2015. Retrieved from http://www.environment.gov.au/system/
Liu, G., Heron, S. F., Eakin, C. M., Muller-Karger, F. E., Vega-Rodriguez, files/resources/d98b3e53-146b-4b9c-a84a-2a22454b9a83/files/
M., Guild, L. S., . . . Strong, A. E. (2014). Reef-scale thermal stress reef-2050-long-term-sustainability-plan.pdf
monitoring of coral ecosystems: New 5-km global products from Roff, G., Clark, T. R., Reymond, C. E., Zhao, J. X., Feng, Y., McCook, L. J., . . .
NOAA coral reef watch. Remote Sensing, 6, 11579–11606. https://d Pandolfi, J. M. (2012). Palaeoecological evidence of a historical collapse
oi.org/10.3390/rs61111579 of corals at Pelorus Island, inshore Great Barrier Reef, following Euro-
Logan, C. A., Dunne, J. P., Eakin, C. M., & Donner, S. D. (2014). Incorpo- pean settlement. Proceedings of the Royal Society of London B: Biological
rating adaptive responses into future projections of coral bleaching. Sciences, 280, 20122100. https://doi.org/10.1098/rspb.2012.2100
Global Change Biology, 20, 125–139. https://doi.org/10.1111/gcb. Sanford, T., Frumhoff, P. C., Luers, A., & Gulledge, J. (2014). The climate
12390 policy narrative for a dangerously warming world. Nature Climate
Marshall, P. A., & Baird, A. H. (2000). Bleaching of corals on the Great Change, 4, 164–166. https://doi.org/10.1038/nclimate2148
Barrier Reef: Differential susceptibilities among taxa. Coral Reefs, 19, Schleussner, C. F., Lissner, T. K., Fischer, E. M., Wohland, J., Perrette, M.,
155–163. https://doi.org/10.1007/s003380000086 Golly, A., . . . Mengel, M. (2016). Differential climate impacts for pol-
Maynard, J. A., Beeden, R., Puotinen, M., Johnson, J. E., Marshall, P., van icy-relevant limits to global warming: The case of 1.5°C and 2°C.
Hooidonk, R., . . . Ban, N. (2016). Great Barrier Reef no-take areas Earth System Dynamics, 7, 327–351. https://doi.org/10.5194/esd-7-
include a range of disturbance regimes. Conservation Letters, 9, 191– 327-2016
199. https://doi.org/10.1111/conl.12198 Schleussner, C.-F., Rogelj, J., Schaeffer, M., Lissner, T., Licker, R., Fischer,
McCook, L. J. (1999). Macroalgae, nutrients and phase shifts on coral E. M., . . . Hare, W. (2016). Science and policy characteristics of the
reefs: Scientific issues and management consequences for the Great Paris Agreement temperature goal. Nature Climate Change, 6, 827–
Barrier Reef. Coral Reefs, 18, 357–367. https://doi.org/10.1007/ 835. https://doi.org/10.1038/nclimate3096
s003380050213 Selig, E. R., Casey, K. S., & Bruno, J. F. (2010). New insights into global
Mumby, P. J. (2017). Trends and frontiers for the science and manage- patterns of ocean temperature anomalies: Implications for coral reef
ment of the oceans. Current Biology, 27, R431–R434. https://doi.org/ health and management. Global Ecology and Biogeography, 19, 397–
10.1016/j.cub.2017.04.049 411. https://doi.org/10.1111/j.1466-8238.2009.00522.x
Mumby, P. J., & Anthony, K. R. N. (2015). Resilience metrics to inform Stevenson, S. L. (2012). Significant changes to ENSO strength and
ecosystem management under global change with application to coral impacts in the twenty-first century: Results from CMIP5. Geophysical
reefs. Methods in Ecology and Evolution, 6, 1088–1096. https://doi. Research Letters, 39, L17703.
org/10.1111/2041-210X.12380 Strong, A. E., Liu, G., Skirving, W., & Eakin, C. M. (2011). NOAA’s coral
Mumby , P. J., & van Woesik, R. (2014). Consequences of ecological, reef watch program from satellite observations. Annals of GIS, 17,
evolutionary and biogeochemical uncertainty for coral reef responses 83–92. https://doi.org/10.1080/19475683.2011.576266You can also read


