FLEXPART v10.1 simulation of source contributions to Arctic black carbon - Atmos. Chem. Phys
←
→
Page content transcription
If your browser does not render page correctly, please read the page content below
Atmos. Chem. Phys., 20, 1641–1656, 2020
https://doi.org/10.5194/acp-20-1641-2020
© Author(s) 2020. This work is distributed under
the Creative Commons Attribution 4.0 License.

FLEXPART v10.1 simulation of source
contributions to Arctic black carbon
Chunmao Zhu1 , Yugo Kanaya1 , Masayuki Takigawa1 , Kohei Ikeda2 , Hiroshi Tanimoto2 , Fumikazu Taketani1 ,
Takuma Miyakawa1 , Hideki Kobayashi1 , and Ignacio Pisso3
1 Research  Institute for Global Change, Japan Agency for Marine–Earth Science and Technology (JAMSTEC),
Yokohama 2360001, Japan
2 National Institute for Environmental Studies, Tsukuba 3058506, Japan
3 NILU – Norwegian Institute for Air Research, Kjeller 2027, Norway

Correspondence: Chunmao Zhu (chmzhu@jamstec.go.jp)

Received: 20 June 2019 – Discussion started: 24 September 2019
Revised: 7 January 2020 – Accepted: 18 January 2020 – Published: 10 February 2020

Abstract. The Arctic environment is undergoing rapid              72 % (57 %) of Arctic BC at the surface and high altitudes,
changes such as faster warming than the global average            respectively. A large fraction (40 %) of BC in the Arctic at
and exceptional melting of glaciers in Greenland. Black car-      high altitudes comes from anthropogenic emissions in East
bon (BC) particles, which are a short-lived climate pollutant,    Asia, which suggests that the rapidly growing economies of
are one cause of Arctic warming and glacier melting. How-         developing countries could have a non-negligible effect on
ever, the sources of BC particles are still uncertain. We sim-    the Arctic. To our knowledge, this is the first year-round eval-
ulated the potential emission sensitivity of atmospheric BC       uation of Arctic BC sources that has been performed using
present over the Arctic (north of 66◦ N) using the FLEX-          the new wet deposition scheme in FLEXPART. The study
PART (FLEXible PARTicle) Lagrangian transport model               provides a scientific basis for actions to mitigate the rapidly
(version 10.1). This version includes a new aerosol wet re-       changing Arctic environment.
moval scheme, which better represents particle-scavenging
processes than older versions did. Arctic BC at the surface
(0–500 m) and high altitudes (4750–5250 m) is sensitive to
                                                                  1   Introduction
emissions in high latitude (north of 60◦ N) and mid-latitude
(30–60◦ N) regions, respectively. Geospatial sources of Arc-      The Arctic region has experienced warming at a rate twice
tic BC were quantified, with a focus on emissions from an-        that of the global average in recent decades (Cohen et al.,
thropogenic activities (including domestic biofuel burning)       2014). The Arctic cryosphere has been undergoing unprece-
and open biomass burning (including agricultural burning          dented changes since the mid-1800s (Trusel et al., 2018).
in the open field) in 2010. We found that anthropogenic           Glacier cover in Greenland reached its historically lowest
sources contributed 82 % and 83 % of annual Arctic BC at          level in summer 2012 (Tilling et al., 2015). Evidence indi-
the surface and high altitudes, respectively. Arctic surface BC   cates that the emissions and transport of greenhouse gases
comes predominantly from anthropogenic emissions in Rus-          and aerosols to the Arctic region are contributing to such
sia (56 %), with gas flaring from the Yamalo-Nenets Au-           warming and melting of snow and ice (Keegan et al., 2014;
tonomous Okrug and Komi Republic being the main source            Najafi et al., 2015). Short-lived climate pollutants such as
(31 % of Arctic surface BC). These results highlight the need     black carbon (BC) particles (e.g., Sand et al., 2016; Yang
for regulations to control BC emissions from gas flaring to       et al., 2019), sulfate aerosol (Yang et al., 2018), tropospheric
mitigate the rapid changes in the Arctic environment. In sum-     ozone, and methane greatly affect the Arctic climate (AMAP,
mer, combined open biomass burning in Siberia, Alaska, and        2015; Quinn et al., 2008).
Canada contributes 56 %–85 % (75 % on average) and 40 %–

Published by Copernicus Publications on behalf of the European Geosciences Union.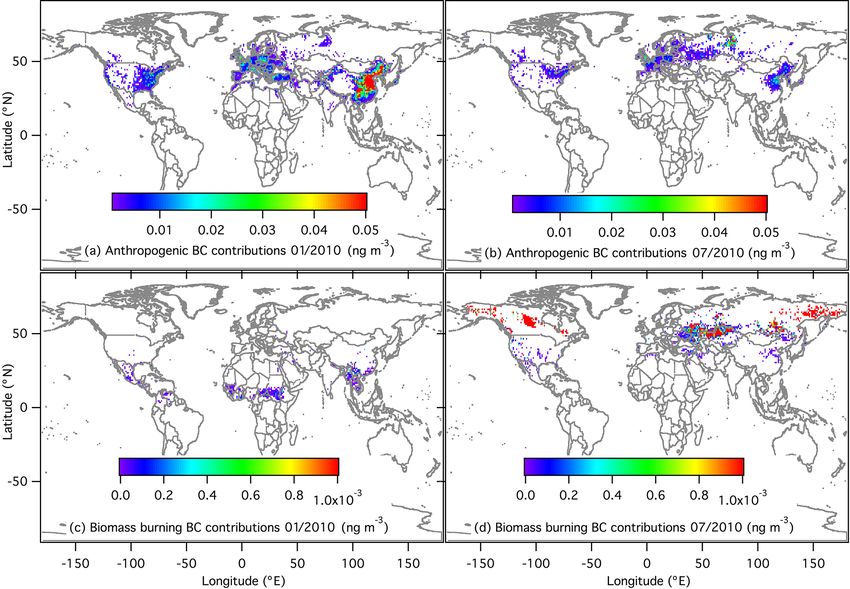
1642                           C. Zhu et al.: FLEXPART v10.1 simulation of source contributions to Arctic black carbon

   BC particles are emitted during incomplete combustion           of wet-scavenging parameterizations is a key factor affecting
of fossil fuels, biofuels, and biomass. BC warms the atmo-         the model performance, which determines the uncertainties
sphere by direct absorption of solar radiation. The deposi-        related to BC particle removal (Kipling et al., 2013; Schacht
tion of BC on snow and ice surfaces accelerates their melt-        et al., 2019; Q. Wang et al., 2014). The use of emission inven-
ing through decreasing albedo, which contributes to the rapid      tories is another important factor that affects the simulation
loss of glaciers. In the Arctic region, ground-based observa-      results (Dong et al., 2019). The observations of BC that are
tions have indicated that BC shows clear seasonal variations,      used for model comparisons may be biased by a factor of 2
with elevated mass concentrations in winter and spring (the        depending on the method used (Sinha et al., 2017; Sharma
so-called Arctic haze) and low values in summer (Law and           et al., 2017). There are still large uncertainties regarding the
Stohl, 2007). Such seasonal variations are explained by in-        sources of BC in the Arctic with respect to emission sec-
creased transport from lower latitudes in the cold season and      tors (anthropogenic sources and open biomass burning) and
increased wet scavenging in the warm season (Shaw, 1995;           geospatial contributions (Eckhardt et al., 2015).
Garrett et al., 2011; Shen et al., 2017).                             The FLEXible PARTicle dispersion model (FLEXPART)
   The presence of BC particles in the Arctic is mainly at-        had been used to investigate the transport pathways and
tributed to emissions in high-latitude regions outside the Arc-    source contributions of BC in the Arctic (Stohl et al., 1998,
tic, such as northern Europe and Russia (Stohl, 2006; Brock        2013; Stohl, 2006). For the FLEXPART model up to ver-
et al., 2011). This is partly caused by the polar dome (Stohl,     sion 9, wet removal was treated considering below-cloud
2006), which is formed because of the presence of con-             and within-cloud scavenging processes (Hertel et al., 1995;
stant potential temperature near the surface. The emissions        McMahon and Denison, 1979), which depend on cloud
in high-latitude regions are transported to the Arctic region      liquid-water content, precipitation rate, and the depth of the
and trapped in the dome, which increases the surface con-          cloud. However, clouds were parameterized based on relative
centration. Recently, Schmale et al. (2018) suggested that lo-     humidity with unrealistic precipitation, clouds frequently ex-
cal emissions from within the Arctic are another important         tended to the surface, and at times no clouds could be found
source, and these are expected to increase in the future.          in grid cells (Grythe et al., 2017). Recently, version 10 of
   Although numerous studies have been performed, results          FLEXPART has been developed in which cloud is differenti-
regarding regional contributions of BC sources in the Arc-         ated into liquid, solid, and mixed phase, and the cloud distri-
tic are still inconclusive. For example, ground-based obser-       bution is more consistent with the precipitation data (Grythe
vations and Lagrangian transport model results reported by         et al., 2017). This improvement in the cloud distribution and
Winiger et al. (2016) showed that BC in Arctic Scandinavia is      phase leads to a more realistic distribution of below-cloud
predominantly linked to emissions in Europe. Over the whole        and in-cloud scavenging events. In this study, we quantified
Arctic region (north of 66◦ N), Russia contributes 62 % to         region-separated sources of BC in the Arctic in 2010 by using
surface BC in terms of the annual mean (Ikeda et al., 2017).       FLEXPART v10.1. We first evaluated the model performance
Gas flaring in Russia has been identified as a major (42 %)        by comparing the results with those based on observations
source of BC at the Arctic surface (Stohl et al., 2013). Xu et     at surface sites. The source contributions of emission sectors
al. (2017) found that anthropogenic emissions from northern        and geospatial contributions were evaluated by incorporating
Asia contribute 40 %–45 % of Arctic surface BC in winter           the Arctic BC footprint into the emission inventories.
and spring. However, the results of some other studies have
suggested that Russia, Europe, and southern Asia each con-
tribute 20 %–25 % of BC to the low-altitude springtime Arc-        2     Materials and methods
tic haze (Koch and Hansen, 2005). Sand et al. (2016) found
that the surface temperature in the Arctic is most sensitive       2.1    Transport model
to emissions in Arctic countries, and Asian countries con-
tribute greatly to Arctic warming because of the large ab-         The FLEXPART model (version 10.1) was run in backward
solute amount of emissions. With these large disagreements         mode to simulate BC footprints in the Arctic region. The
among studies, it is thus necessary to unveil BC sources in        calculation of wet deposition was improved compared with
the Arctic with high-precision simulations.                        those in previous versions because in-cloud scavenging and
   Various models have been used to investigate BC sources         below-cloud scavenging of particles were separately calcu-
in the Arctic. Depending on the simulation method, these           lated (Grythe et al., 2017). In previous versions of FLEX-
models are generally categorized as Lagrangian transport           PART, in the in-cloud scavenging scheme, the aerosol scav-
models (Hirdman et al., 2010; Liu et al., 2015; Stohl et al.,      enging coefficient depended on the cloud water content,
2013; Stohl, 2006), chemical transport models (CTMs; Ikeda         which was calculated according to an empirical relationship
et al., 2017, 2020; Qi et al., 2017; Shindell et al., 2008; Wang   with precipitation rate, in which all aerosols had the same nu-
et al., 2011; Xu et al., 2017), and global climate models          cleation efficiency (Hertel et al., 1995; Stohl et al., 2005). In
(GCMs; Ma et al., 2013; Koch and Hansen, 2005; Schacht             the new version, the in-cloud scavenging scheme depends on
et al., 2019; H. Wang et al., 2014) (Table 1). The treatment       the cloud water phase (liquid, ice, or mixed phase). Aerosols

Atmos. Chem. Phys., 20, 1641–1656, 2020                                             www.atmos-chem-phys.net/20/1641/2020/
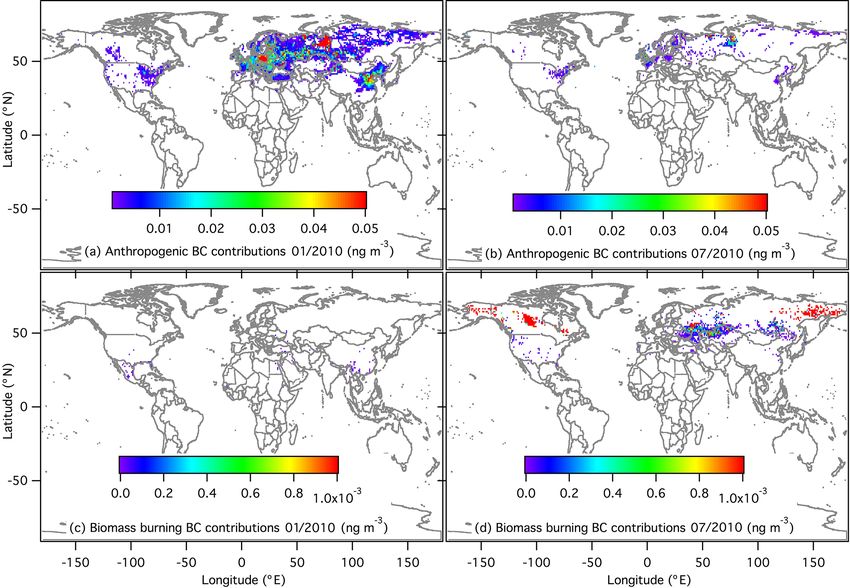
Table 1. Comparison of BC source contributions in the Arctic surface.
Model and Model Wet Grid Meteorology Emissions Domain or sites Year or season Major source Reference
versions type deposition resolution regions or sectors
FLEXPART- Lagrangian Stohl et al. Unspecified WRF forecast ECLIPSE, FINN Continental spring 2013 Asian Liu et al.
WRF 6.2 (2005) Norway and anthropogenic (2015)
Svalbard
FLEXPART Lagrangian Stohl et al. 1◦ × 1◦ ECMWF Unspecified (BC Alert, Utqiaġvik, 1989–2009 Northern Eurasia Hirdman
6.2 (2005) operational sensitivities were Zeppelin et al.
calculated) (2010)
FLEXPART Lagrangian Stohl et al. 1◦ × 1◦ ECMWF ECLIPSE4(GAINS), Arctic (north 2008–2010 Flaring (42 %), Stohl et al.
6.2 (2005) operational GFED3 of 66◦ N) residential (2013)
(> 20 %)
www.atmos-chem-phys.net/20/1641/2020/
FLEXPART Lagrangian Stohl et al. 1◦ × 1◦ ECMWF ECLIPSE5(GAINS), Arctic (north 2011–2015 Residential and Winiger et
9.2 (2005) operational GFED4.1 of 66.7◦ N) open burning al. (2019)
(39 %)
FLEXPART Lagrangian Grythe et 1◦ × 1◦ ECMWF HTAP2, GFED3, Arctic (north 2010 Flaring (36 %), Current
10.1 al. (2017) operational Huang et al. (2015) of 66◦ N) open burning study
for Russia flaring (18 %), residential
(15 %), others
(31 %)
GEOS- CTM Wang et 2◦ × 2.5◦ GEOS-5 HTAP2, GFED3, Arctic (north 2007–2011 Russia (62 %) Ikeda et
Chem 9.02 al. (2011) Huang et al. (2015) of 66◦ N) al. (2017)
for Russia flaring
GEOS- CTM Wang et 2◦ × 2.5◦ GEOS-5 Bond et al. (2004), Alert, Utqiaġvik, April 2008 Asian Qi et al.
Chem al. (2011) Zhang et al. (2009), Zeppelin anthropogenic (2017)
GFED3 (35 %–45 %),
Siberian biomass
burning (46 %–64 %)
GEOS- CTM Wang et 2◦ × 2.5◦ GEOS-5 Bond et al. (2007), North America April 2008 Open fire (50 %) Wang et
C. Zhu et al.: FLEXPART v10.1 simulation of source contributions to Arctic black carbon
Chem al. (2011) FLAMBE Arctic al. (2011)
GEOS- CTM Wang et 2◦ × 2.5◦ GEOS-5 HTAP2, ECLIPSE5, Alert, Utqiaġvik, 2009–2011 Northern Asia Xu et al.
Chem10.01 al. (2011) GFED4 Zeppelin, anthropogenic (2017)
Arctic (north (40 %–45 %) in
of 66.5◦ N) winter–spring
CAM5 GCM Wang et 1.9◦ × 2.5◦ MERRA IPCC AR5 Arctic (north 1996–2005 Northern Europe Wang et
al. (2013) of 66.5◦ N) in winter, al. (2014)
Northern Asia
in summer
Atmos. Chem. Phys., 20, 1641–1656, 2020
1643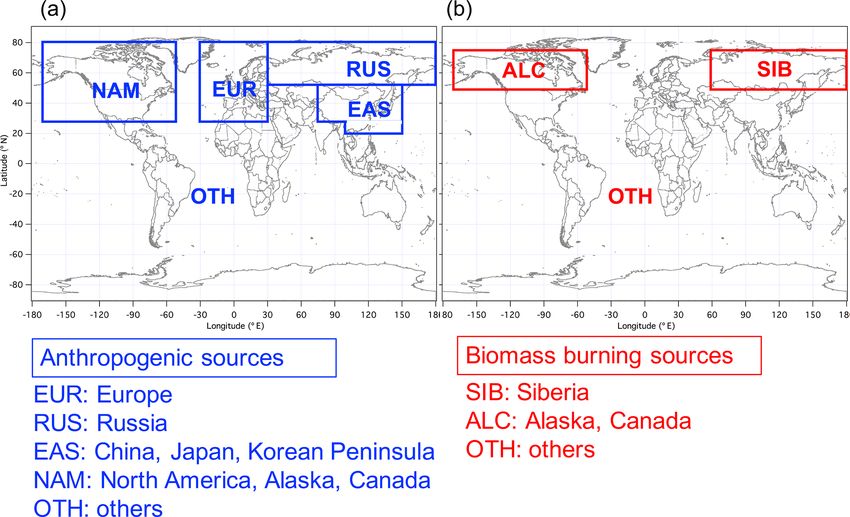
1644 C. Zhu et al.: FLEXPART v10.1 simulation of source contributions to Arctic black carbon
were set as ice nuclei for ice clouds and as cloud condensa-
Table 1. Continued.
ModelE
GISS
HAM
ECHAM-
CAM5
versions
Model and
tion nuclei for liquid-water clouds. For mixed-phase clouds,
it was assumed that 10 % of aerosols are ice nuclei and 90 %
are cloud condensation nuclei, because BC is much more ef-
ficiently removed in liquid-water clouds than in ice clouds
GCM
GCM
GCM
type
Model
(Cozic et al., 2007; Grythe et al., 2017). The below-cloud
scavenging scheme can parameterize below-cloud removal
as a function of aerosol particle size, precipitation type (snow
(2006)
Koch et al.
al. (2012)
Zhang et
al. (2013)
Wang et
deposition
Wet
or rain), and intensity. The biases produced in simulations
using the new scheme are therefore smaller than those in the
old scheme for wet deposition of aerosols, especially at high
latitudes (Grythe et al., 2017).
The Arctic region is defined as areas north of 66◦ N.
4◦ × 5◦
1.8◦ × 1.8◦
1.9◦ × 2.5◦
resolution
Grid
The potential BC emission sensitivities at two heights in
the Arctic region, i.e., the surface (0–500 m) and high alti-
tudes (4750–5250 m), were simulated. The FLEXPART out-
puts were set as gridded retention times. We performed tests
Internal
ERA-Interim
Interim
CAM5, ERA-
Free running
Meteorology
at 500, 2000, and 5000 m, and chose 500 m as the upper
boundary height of the model output. The model was driven
with operational analytical data from the European Centre
for Medium-Range Weather Forecasts (ECMWF) at a spa-
tial resolution of 1◦ × 1◦ with 61 vertical levels. Temporally,
(1996)
Cooke and Wilson
Bond et al. (2004),
ACCMIP
comparison with
(default), GFES, and
BC in Russia
for anthropogenic
Huang et al. (2015)
ECLIPSE5, and
POLARCAT-POLMIP
Emissions
ECMWF has a resolution of 3 h, with 6 h analysis and 3 h
forecast time steps. The simulation period was set at 60 d
backward starting from each month in 2010. The maximum
lifetime of BC was set at 20 d, because its suspension time in
the upper atmosphere during long-range transport is longer
than that at the surface level (Stohl et al., 2013). We imple-
mented the wet deposition scheme in the backward calcula-
tions, but it was not represented in the default setting (FLEX-
of ∼ 60◦ N)
Arctic (north
of 60◦ N)
Arctic (north
campaigns,
and aircraft
Various sites
of ∼ 66◦ N)
Arctic (north
Domain or sites
PART v10.1, https://www.flexpart.eu/downloads, last access:
10 April 2017).
The chemistry and microphysics could not be resolved by
FLEXPART. The model therefore ignores hydrophobic to hy-
drophilic state changes and size changes of BC, and it as-
sumes that all BC particles are aged hydrophilic particles.
general
Annual
2005–2015
2008
Winter
Year or season
This may lead to an overestimation of BC removal and hence
force underestimation of simulated BC concentration, espe-
cially of fossil fuel combustion sources where BC could be
in the hydrophobic state for a few days. A logarithmic size
distribution of BC with a mean diameter of 0.16 µm and a
South Asia
emission)
(with default
flaring region
Russian gas
Northern Europe,
Northern Asia,
Asia
regions or sectors
Major source
standard deviation of 1.96, in accordance with our ship ob-
servations in the Arctic, was used (Taketani et al., 2016). The
particle density was assumed to be 2000 kg m−3 , and 1 mil-
lion computational particles were randomly generated in the
Arctic region for the backward runs.
Four ground-based observations made during the pe-
(2005)
Hansen
Koch and
al. (2019)
Schacht et
(2013)
Ma et al.
Reference
riod 2007–2011 were used to validate the model per-
formance. The potential BC emission sensitivity at 0–
500 m a.g.l. (above ground level) from a 0.1◦ grid centered
at each site was simulated. Other model parameterizations
were consistent with those for the Arctic region, except that
200 000 computational particles were released.
Atmos. Chem. Phys., 20, 1641–1656, 2020 www.atmos-chem-phys.net/20/1641/2020/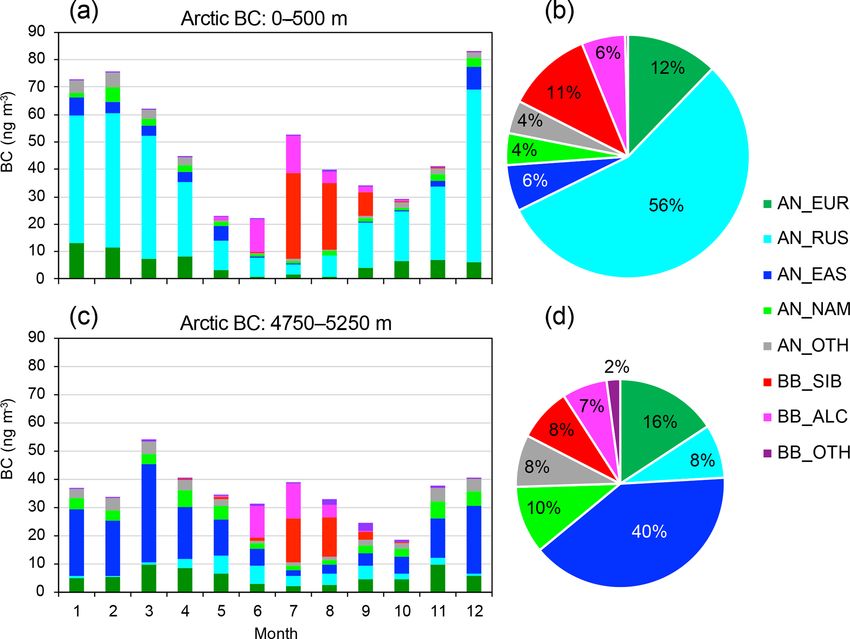
C. Zhu et al.: FLEXPART v10.1 simulation of source contributions to Arctic black carbon                                      1645

2.2   Emission inventories                                         efficiency of 10 m2 g−1 . The equivalent BC at Tiksi, which
                                                                   was determined with an Aethalometer, was obtained directly.
We focused on BC sources from anthropogenic emissions              These measurement data were obtained from the European
and open biomass burning. The Hemispheric Transport of             Monitoring and Evaluation Programme and the World Data
Air Pollution version 2 inventory (HTAP2) for 2010 was             Centre for Aerosols database (http://ebas.nilu.no, last access:
used for monthly anthropogenic BC emissions (Janssens-             1 December 2017) (Tørseth et al., 2012).
Maenhout et al., 2015), which include sectors from energy,             It is worth noting that uncertainties could be introduced
industry, residential and transport. It is worth noting that the   by using different BC measurement techniques. An evalua-
residential sector includes not only combustions of fossil fu-     tion of three methods for measuring BC at Alert, Canada,
els but also biofuels. However, as it has been reported that       indicated that an average of the refractory BC determined
BC emissions in Russia were underestimated in HTAP2, we            with a single-particle soot photometer (SP2) and elemental
used the BC emissions reported by Huang et al. (2015) for          carbon (EC) determined from filter samples give the best es-
Russia, in which the annual BC emissions were 224 Gg yr−1 .        timate of BC mass (Sharma et al., 2017). Xu et al. (2017)
For open biomass burning, we used the monthly BC emis-             reported that the equivalent BC determined with a PSAP was
sions from the Global Fire Emissions Database version 3            close to the average of the values for refractory BC and EC at
inventory (GFED3) (van der Werf et al., 2010) for the pur-         Alert. In this study, we consider that the equivalent BC values
poses of intercomparison with other studies, as this version       determined with a PSAP at Utqiaġvik, Alert, and Zeppelin to
is widely used. The term “open biomass burning” here indi-         be the best estimate. There may be uncertainties in the equiv-
cates burning of biomass in the open field as is determined        alent BC observations performed with an Aethalometer at
by the remote sensing measurement basis, including forest,         Tiksi because of co-existing particles such as light-absorbing
agricultural waste, peat fires, grassland and savanna, wood-       organic aerosols, scattering particles, and dusts (Kirchstetter
land, deforestation, and degradation, where biofuel burning        et al., 2004; Lack and Langridge, 2013). Interference by the
for residential use is not included. Geospatial distributions      filter and uncertainties in the mass absorption cross section
of emissions from anthropogenic sources and open biomass           could also contribute to the bias observed in measurements
burning in January and July are shown in Fig. S1 in the Sup-       made with an Aethalometer at Tiksi.
plement.

2.3   Calculation of Arctic BC source contributions                3     Results and discussion

The source contributions to Arctic BC were derived by in-          3.1    Comparisons of simulations with BC observations
corporating the gridded retention time into the column emis-              at Arctic surface sites
sion flux, which was derived from the emission inventories in
each grid. Calculations for anthropogenic sources and open         FLEXPART generally reproduced the seasonal varia-
biomass burning were performed separately and the sum was          tions in BC at four Arctic sites well (Pearson correla-
used. For anthropogenic sources, the regions were separated        tion coefficient, R = 0.53–0.80, and root-mean-square er-
into North America and Canada (25–80◦ N, 50–170◦ W), Eu-           ror, RMSE = 15.1–56.8 ng m−3 ) (Fig. 2). Winter maxima
rope (30–80◦ N, 0–30◦ E), Russia (53–80◦ N, 30–180◦ E),            were observed for the four sites, while a secondary elevation
East Asia (35–53◦ N, 75–150◦ E and 20–35◦ N, 100–150◦ E),          was observed for Alert and Tiksi. At Utqiaġvik, the observed
and others (the rest) (Fig. 1a). For open biomass burning          high values of BC were unintentionally excluded during data
sources, the regions were separated into Alaska and Canada         screening in the forest fire season in summer (Stohl et al.,
(50–75◦ N, 50–170◦ W), Siberia (50–75◦ N, 60–180◦ E), and          2013); the original observed BC is supposed to be higher as
others (Fig. 1b).                                                  was reflected by the simulation. This seasonality is probably
                                                                   related to relatively stronger transport to the Arctic region in
2.4   Observations                                                 winter, accompanied by lower BC aging and inefficient re-
                                                                   moval, as simulated by older versions of FLEXPART (Eck-
BC levels simulated by FLEXPART were compared with                 hardt et al., 2015; Stohl et al., 2013).
those based on surface observations at four sites: Utqiaġvik,        From January to May at Utqiaġvik and Alert, the mean BC
USA (formerly Barrow) (71.3◦ N, 156.6◦ W; 11 m a.s.l.);            values simulated by FLEXPART v10.1 were 32.2 and
Alert, Canada (82.5◦ N, 62.3◦ W; 210 m a.s.l.); Zeppelin,          31.2 ng m−3 , respectively, which were 46 % lower than the
Norway (78.9◦ N, 11.9◦ E; 478 m a.s.l.); and Tiksi, Rus-           observations (59.3 and 58.2 ng m−3 , respectively). This is
sia (71.6◦ N, 128.9◦ E; 8 m a.s.l.). Aerosol light absorption      probably related to the inadequate BC emission in the in-
was determined by using particle soot absorption photome-          ventory, although seasonal variations in residential heating
ters (PSAPs) at Utqiaġvik, Alert, and Zeppelin, and an            are included in HTAP2, which would reduce the simulation
Aethalometer at Tiksi. For PSAP measurements, the equiv-           bias (Xu et al., 2017). Simulations by GEOS-Chem using the
alent BC values were derived by using a mass absorption            same emission inventories also underestimated BC levels at

www.atmos-chem-phys.net/20/1641/2020/                                               Atmos. Chem. Phys., 20, 1641–1656, 2020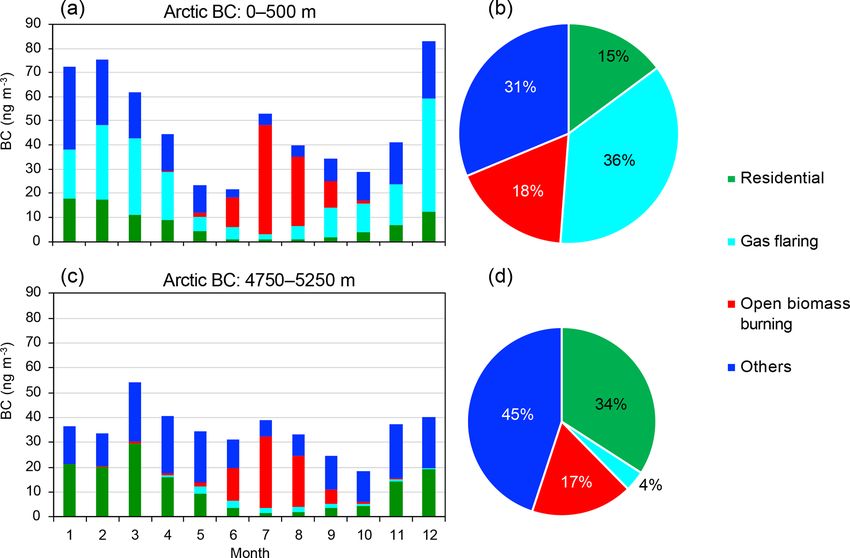
1646 C. Zhu et al.: FLEXPART v10.1 simulation of source contributions to Arctic black carbon
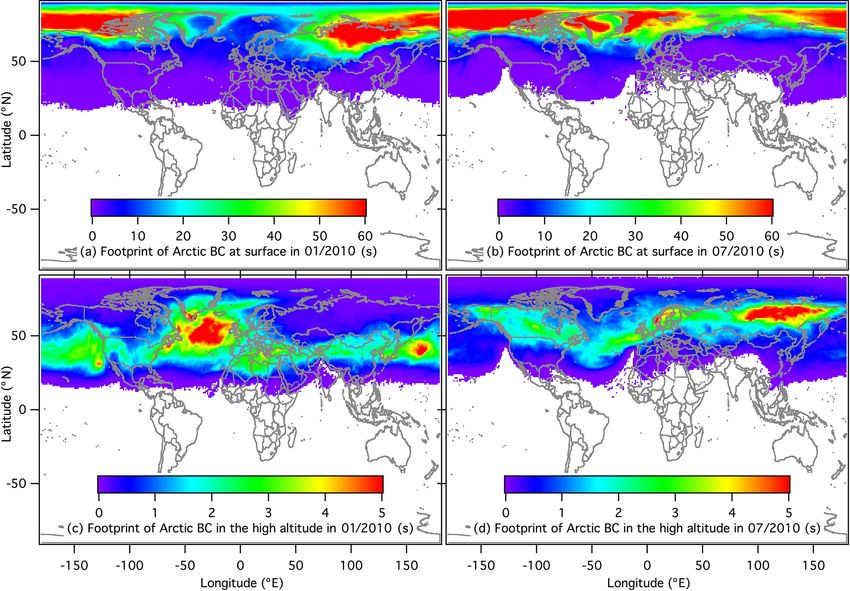
Figure 1. Regional separation for quantification of BC in the Arctic from (a) anthropogenic and (b) open biomass burning sources.
Figure 2. Observed (filled circles) and modeled (bars) seasonal variations in BC mass concentrations at Arctic sites. Contributions from
anthropogenic sources (blue) and open biomass burning (red) in each month are shown. Monthly averages of observed (filled circles) and
simulated (bars) BC were conducted for 2007–2011 at Alert, Canada (82.5◦ N, 62.3◦ W), and Zeppelin, Norway (78.9◦ N, 11.9◦ E); for 2009
at Utqiaġvik, USA (71.3◦ N, 156.6◦ W); and for 2010–2014 at Tiksi, Russia (128.9◦ E, 71.6◦ Ñ). R and RMSE indicate correlation coefficient
and root-mean-square error (ng mm−3 ), respectively.
Utqiaġvik and Alert (Ikeda et al., 2017; Xu et al., 2017). The responding uncertainties are larger in winter months, when
underestimation by FLEXPART could also be partly con- there are more sources from fossil fuel combustion.
tributed by the assumption that all particles are hydrophilic, At Zeppelin, the FLEXPART-simulated BC (39.1 ng m−3
where the BC scavenging could be overestimated. The cor- for annual mean) was 85 % higher than the observed value
(21.1 ng m−3 for annual mean), especially in winter (112 %
Atmos. Chem. Phys., 20, 1641–1656, 2020 www.atmos-chem-phys.net/20/1641/2020/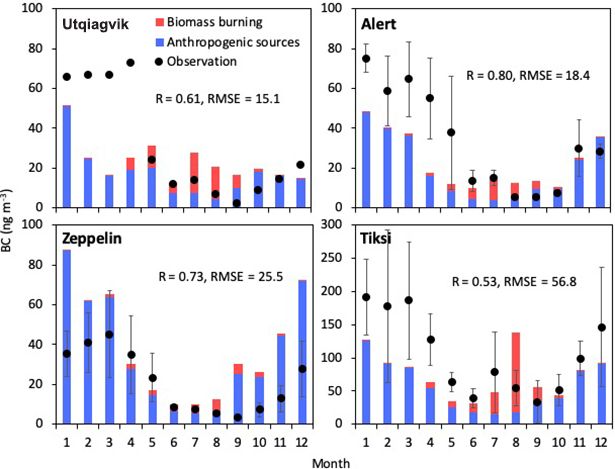
C. Zhu et al.: FLEXPART v10.1 simulation of source contributions to Arctic black carbon                                     1647

higher). It has been reported that riming in mixed-phase              BC at high altitudes in the Arctic is more sensitive to mid-
clouds occurs frequently at Zeppelin (Qi et al., 2017). Dur-       latitude (30–60◦ N) emissions, especially in wintertime. In
ing the riming process, BC particles act as ice particles and      January, air masses hovered over the Bering Sea and the
collide with the relatively numerous water drops, which form       North Atlantic Ocean before arriving at the Arctic (Fig. 3c).
frozen cloud droplets, and then snow is precipitated. This re-     A notable corridor at 30–50◦ N covering Eurasia and the US
sults in relatively efficient BC scavenging (Hegg et al., 2011).   was the sensitive region that affected BC at high altitudes in
Such a process could not be dealt with by the model. At            the Arctic in January. These results indicate that mid-latitude
Tiksi, FLEXPART underestimated BC (74.4 ng m−3 for an-             emissions, especially those with relatively large strengths
nual mean) in comparison with observation (104.2 ng m−3            from East Asia, eastern America, and Europe, could alter the
for annual mean). Other than the hydrophilic BC assump-            atmospheric constituents at high altitudes in the Arctic. Cen-
tion and underestimated BC emission in the simulation as in        tral to east Siberia was the most sensitive region for BC at
the cases for Utqiaġvik and Alert, the observations at Tiksi      high altitudes in the Arctic in July (Fig. 3d). These results
by an Aethalometer could contain light-absorbing particles         suggest that pollutants from frequent and extensive wildfires
other than BC, resulting in higher observed concentrations if      in Siberia in summer are readily transported to high altitudes
compared with those obtained by SP2, EC, or PSAP.                  in the Arctic. Boreal fires are expected to occur more fre-
   Anthropogenic emissions are the main sources of BC at           quently and over larger burning areas under future warming
the four Arctic sites from late autumn to spring, whereas          (Veira et al., 2016); therefore, the atmospheric constituents
open biomass burning emissions make large contributions            and climate in the Arctic could undergo more rapid changes.
in summer. From October to April, anthropogenic emissions
accounted for 87 %–100 % of BC sources at all the obser-           3.3   Seasonal variations and sources of Arctic
vation sites. At Utqiaġvik, open biomass burning accounted              surface BC
for 35 %–78 % of BC in June–September (Fig. 2). There
are large interannual variations in both observed and simu-        Arctic surface BC showed clear seasonal variations, with
lated BC (Fig. S2). In June–August 2010, the mean contri-          a primary peak in winter–spring (December–March, 61.8–
butions of open biomass burning to BC were 6.3, 2.4, and           82.8 ng m−3 ) and a secondary peak in summer (July,
8.6 times those from anthropogenic sources at Alert, Zep-          52.7 ng m−3 ). BC levels were relatively low in May–
pelin, and Tiksi, respectively. In this study, we focused on BC    June (21.8–23.1 ng m−3 ) and September–November (34.1–
in the Arctic region in 2010.                                      40.9 ng m−3 ) (Fig. 4a). This seasonality agrees with observa-
                                                                   tions and simulations at Alert, Tiksi, and Utqiaġvik if con-
3.2   Potential emission sensitivity of Arctic BC                  sidering the unintentional data exclusion (Stohl et al., 2013),
                                                                   and previous studies targeting the whole Arctic (Ikeda et al.,
The potential emission sensitivities (footprint) of Arctic BC      2017; Xu et al., 2017). Compared with the study reported by
showed different patterns with respect to altitude. The Arctic     Stohl et al. (2013), the current work using the new scheme
surface is sensitive to emissions at high latitudes (> 60◦ N).     produced smaller discrepancies between the simulated data
Air masses stayed for over 60 s in each of the 1◦ grids from       and observations. Although the simulation periods (monthly
the eastern part of northern Eurasia and the Arctic Ocean          means for 2007–2011 in this study and for 2008–2010 in
before being transported to the Arctic surface in the winter,      the old scheme) and the anthropogenic emission inventories
represented by January (Fig. 3a). In comparison, during the        (HTAP2 in this study and ECLIPSE4 in the previous study)
summer, represented by July, BC at the Arctic surface was          are different, the new scheme shows potential for better rep-
mainly affected by air masses that originated from the Arctic      resenting BC transport and removal processes in the Arctic.
Ocean and the Norwegian Sea (Fig. 3b). These results imply            The annual mean Arctic BC at the surface was estimated
that local BC emissions within the Arctic regions, although        to be 48.2 ng m−3 . From October to April, anthropogenic
relatively weak compared with those from the mid-latitude          sources accounted for 96 %–100 % of total BC at the Arc-
regions, could strongly affect Arctic air pollution. Local BC      tic surface. Specifically, anthropogenic emissions from Rus-
emissions are important in the wintertime because the rela-        sia accounted for 61 %–76 % of total BC in October–May
tively stable boundary layer does not favor pollution disper-      (56 % annually), and these were the dominant sources of
sion. Recent increases in anthropogenic emissions in the Arc-      Arctic BC at the surface. From an isentropic perspective, the
tic region, which have been caused by the petroleum indus-         meteorological conditions in winter favored the transport of
try and development of the Northern Sea Route, are expected        pollutants from northern Eurasia to the lower Arctic, along
to cause deterioration of air quality in the Arctic. Socioeco-     with diabatic cooling and strong inversions (Klonecki et al.,
nomic developments in the Arctic region would increase lo-         2003). In comparison, open biomass burning from boreal re-
cal BC emissions, and this will be a non-negligible issue in       gions accounted for 56 %–85 % (75 % on average) of Arc-
the future (Roiger et al., 2015; Schmale et al., 2018).            tic BC at the surface in summer; open biomass burning emis-
                                                                   sions from North America and Canada accounted for 54 %
                                                                   of total Arctic surface BC in June, and those from Siberia

www.atmos-chem-phys.net/20/1641/2020/                                               Atmos. Chem. Phys., 20, 1641–1656, 2020
1648 C. Zhu et al.: FLEXPART v10.1 simulation of source contributions to Arctic black carbon Figure 3. Footprints of Arctic BC shown as retention time(s) of (a) BC at surface (0–500 m) in January 2010, (b) BC at surface in July 2010, (c) BC at high altitudes (4750–5250 m) in January 2010, and (d) BC at high altitudes in July 2010. Figure 4. Contributions of anthropogenic sources (prefixed “AN_” in the legend) and open biomass burning (“BB_”) from each region to (a) seasonal variations in Arctic surface BC, (b) annual mean Arctic surface BC, (c) seasonal variations in Arctic BC at high altitudes, and (d) annual mean of Arctic BC at high altitudes. Atmos. Chem. Phys., 20, 1641–1656, 2020 www.atmos-chem-phys.net/20/1641/2020/
C. Zhu et al.: FLEXPART v10.1 simulation of source contributions to Arctic black carbon                                     1649

accounted for 59 %–61 % in July–August. Wildfires in the           also identified as a strong anthropogenic emitter contributing
boreal forests in summer had a major effect on air quality in      to Arctic surface BC. These gas-flaring industrial regions in
the Arctic.                                                        Russia (58–69◦ N, 68–81◦ E) together contributed 33 % and
   On an annual basis, anthropogenic sources and open              31 % of Arctic surface BC for January and the annual mean,
biomass burning emissions accounted for 82 % and 18 %,             respectively. Recently, Dong et al. (2019) evaluated BC emis-
respectively, of total Arctic surface BC. In which, gas flar-      sion inventories using GEOS-Chem and proposed that using
ing and residential burning (including burning of fossil fu-       the inventory compiled by Huang et al. (2015) for Russia,
els and biofuels) are accounting for 36 % (28 %–57 % in            in which gas flaring accounted for 36 % of anthropogenic
October–March) and 15 % (13 %–25 % in October–March),              emissions, had no prominent impact on the simulation per-
respectively (Fig. 5a and b). Our results support Stohl et         formance in Russia or the Arctic. They suggested that the
al. (2013) such that residential combustion emissions, es-         use of a new global inventory for BC emissions from natural
pecially in winter, are important sources of Arctic BC (Ta-        gas flaring would improve the model performance (Huang
ble 1). We estimated a contribution of gas flaring to Arctic       and Fu, 2016). These results suggest that inclusion of BC
surface BC of 17.5 ng m−3 (36 % of total). In comparison, the      emissions from gas flaring on the global scale is necessary
value was estimated as 11.8 ng m−3 using an average Arc-           for further BC simulations.
tic surface BC of 28 ng m−3 and a fraction from gas flaring           In Europe, a relatively high contribution of anthropogenic
of 42 % evaluated by earlier versions of FLEXPART (Stohl           emissions to Arctic surface BC in January was made by
et al., 2013; Winiger et al., 2019). The different contribu-       Poland (50–55◦ N, 15–24◦ E; contributing 4 % of Arctic sur-
tion could be partly attributed to the difference in gas flaring   face BC) because of relatively large emission fluxes in the
emission inventory. BC emission from gas flaring in Russia         region (Fig. S1a). Anthropogenic emissions from eastern
by Huang et al. (2015) was used in the current study, where        China, especially those north of ∼ 33◦ N (33–43◦ N, 109–
total BC emission from gas flaring in Russia in 2010 was           126◦ E), contributed perceptibly (5 %) to Arctic surface BC.
ca. 81.1 kt, which was larger than the estimate of ca. 64.9 kt        In July, contributions from anthropogenic sources shrank
by the GAINS inventory (Klimont et al., 2017) used by Stohl        to those from Yamalo-Nenets Autonomous Okrug and Komi
et al. (2013). Moreover, adopting the ECLIPSEv5 inventory          Republic in Russia, and contributed a lower fraction (3 %
as was used by Winiger et al. (2019), we estimated that gas        of Arctic surface BC) (Fig. 6b). Few open biomass burning
flaring was contributing 14.4 ng m−3 to Arctic surface BC          sources contributed in January (Fig. 6c), but contributions
using FLEXPART v10.1, a value 22 % higher than those ob-           from open biomass burning to Arctic surface BC in July can
tained using FLEXPART v9. This difference could be at-             be clearly seen, mainly from the far east of Russia, Canada,
tributed to the improvement of the wet-scavenging scheme           and Alaska (Fig. 6d). Open biomass burning emissions from
by FLEXPART v10.1.                                                 Kazakhstan, southwest Russia, southern Siberia, and north-
   A recent study based on isotope observations at the Arctic      east China also contributed to Arctic surface BC, although
sites and FLEXPART v9.2 simulation suggested that open             at relatively low strengths (Figs. 5d and S1d). However, the
biomass burning, including open field burning and residen-         contributions from open biomass burning could be higher, as
tial biofuel burning, contributed 39 % to annual BC in 2011–       the MODIS burned area, the basis of GFED emission inven-
2015 (Winiger et al., 2019) (Table 1). In comparison, we es-       tories, was underestimated for northern Eurasia by 16 % (Zhu
timated that residential burning and open biomass burning          et al., 2017). Evangeliou et al. (2016) estimated a relatively
together account for 33 % of total Arctic surface BC. As the       high transport efficiency of BC from open biomass burning
residential burning in our study includes burning of both bio-     emissions to the Arctic, which led to a high contribution,
fuels and fossil fuels, our results indicated that biomass burn-   i.e., 60 %, from such sources to BC deposition in the Arctic
ing has a relatively smaller contribution. Other than the dif-     in 2010. A recent study suggested that open fires that burned
ferences in BC removal treatment between different versions        in western Greenland in summer (31 July to 21 August 2017)
of the model, the contribution difference could also be at-        could potentially alter the Arctic air composition and foster
tributed to the different emission inventories and years (2010     glacier melting (Evangeliou et al., 2019). Although the foot-
versus 2011–2015).                                                 print of Arctic surface BC showed a relatively weak sensitiv-
   The geospatial contributions of anthropogenic sources and       ity to areas such as forests and tundra, in the boreal regions
open biomass burning emissions can be further illustrated          pollutants from boreal wildfires could have greater effects on
by taking January and July as examples. In January, high           the Arctic air composition in summer under future warming
levels of anthropogenic emissions from Russia (contribut-          scenarios (Veira et al., 2016).
ing 64 % of Arctic surface BC), Europe (18 %), and East
Asia (9 %) were identified (Fig. 6a). Specifically, Yamalo-        3.4   Sources of Arctic BC at high altitudes
Nenets Autonomous Okrug in Russia, which has the largest
reserves of Russia’s natural gas and oil (Filimonova et al.,       Arctic BC levels at high altitudes showed the highest levels in
2018), was the most notable emission hotspot, which sug-           spring (March–April, 40.5–53.9 ng m−3 ), followed by those
gests gas-flaring sources. The Komi Republic in Russia was         in late autumn to early winter (November–January, 36.5–

www.atmos-chem-phys.net/20/1641/2020/                                               Atmos. Chem. Phys., 20, 1641–1656, 2020
1650                              C. Zhu et al.: FLEXPART v10.1 simulation of source contributions to Arctic black carbon

Figure 5. Sectorial contributions from residential combustion (including fossil fuel and biofuel combustions), gas flaring, open biomass
burning and others (energy other than gas flaring, industry, and transport) to (a) seasonal variations in Arctic surface BC, (b) annual mean
Arctic surface BC, (c) seasonal variations in Arctic BC at high altitudes, and (d) annual mean of Arctic BC at high altitudes.

Figure 6. Spatial distributions of contributions to Arctic BC at surface for (a) anthropogenic contributions in January 2010, (b) anthropogenic
contributions in July 2010, (c) open biomass burning contributions in January 2010, and (d) open biomass burning contributions in July 2010.

Atmos. Chem. Phys., 20, 1641–1656, 2020                                                      www.atmos-chem-phys.net/20/1641/2020/
C. Zhu et al.: FLEXPART v10.1 simulation of source contributions to Arctic black carbon                                               1651

Figure 7. Spatial distributions of contributions to Arctic BC at high altitudes for (a) anthropogenic contributions in January 2010, (b) an-
thropogenic contributions in July 2010, (c) open biomass burning contributions in January 2010, and (d) open biomass burning contributions
in July 2010.

40.0 ng m−3 ), and summer (July–August, 33.0–39.0 ng m−3 )                 Further investigations of geospatial contributions to Arc-
(Fig. 4c). The annual mean Arctic BC at high altitudes was              tic BC at high altitudes in January and July provided more
estimated to be 35.2 ng m−3 , which is ca. 73 % of those at             details regarding BC sources. In January, the main anthro-
the surface. Such a vertical profile is in accordance with those        pogenic BC source in East Asia covered a wide range in
based on aircraft measurements over the Canadian High Arc-              China (Fig. 7a). Not only east and northeast China but also
tic (Schulz et al., 2019). Similarly to the case for the surface,       southwest China (Sichuan and Guizhou provinces) were the
anthropogenic sources dominated by the residential, trans-              major anthropogenic sources of Arctic BC at high altitudes.
port, industry, and energy sectors (excluding gas flaring) ac-          In July, anthropogenic sources made a relatively weak con-
counted for 94 %–100 % of Arctic BC at high altitudes in                tribution to Arctic BC at high altitudes. The regions that
October–May (Figs. 4c and 5c). East Asia accounted for                  were sources of open biomass burning contributions to Arc-
34 %–65 % of the total BC in October–May (40 % annually).               tic BC at high altitudes were mainly the far east of Siberia,
In comparison, using the Community Atmosphere Model                     Kazakhstan, central Canada, and Alaska, i.e., similar to the
version 5 driven by the NASA Modern Era Retrospective-                  sources of Arctic surface BC. Unlike Arctic surface BC, for
Analysis for Research and Applications (MERRA) reanaly-                 which the dominant source regions are at high latitudes in
sis data and the IPCC AR5 year 2000 BC emission inven-                  both winter and summer, Arctic BC at high altitudes mainly
tory, H. Wang et al. (2014) found that East Asia accounted              originates from mid-latitude regions (Figs. 6 and 7). In terms
for 23 % of BC burden in the Arctic for 1995–2005. In sum-              of transport pathways, air masses could be uplifted at low-
mer, open biomass burning in the boreal regions accounted               to-mid latitudes and transported to the Arctic (Stohl, 2006).
for 40 %–72 % (57 % on average) of Arctic BC at high al-                Further investigations are needed to obtain more details of
titudes, similar to the source contributions to Arctic sur-             the transport processes.
face BC. Specifically, open biomass burning sources from
Siberia accounted for 40 %–42 % of Arctic BC at high alti-              3.5    Comparison of FLEXPART and GEOS-Chem
tudes in July–August. Annually, anthropogenic sources and                      simulations of BC sources
open biomass burning accounted for 83 % (in which residen-
tial sources accounted for 34 %) and 17 %, respectively, of             Data for BC sources simulated with FLEXPART were com-
total Arctic BC at high altitudes (Figs. 4d and 5d).                    pared with those obtained with GEOS-Chem (Ikeda et al.,

www.atmos-chem-phys.net/20/1641/2020/                                                      Atmos. Chem. Phys., 20, 1641–1656, 2020
1652                          C. Zhu et al.: FLEXPART v10.1 simulation of source contributions to Arctic black carbon

2017), which is an Eulerian atmospheric transport model, us-    of BC source contributions indicates improved reliability of
ing the same emission inventories. The simulated seasonal       evaluated source contributions to Arctic BC.
variations in Arctic BC levels and source contributions ob-
tained with FLEXPART agreed well with those obtained with
GEOS-Chem (Fig. S3). The annual mean BC levels at the           4   Conclusions
Arctic surface obtained by FLEXPART and GEOS-Chem
                                                                The source contributions to Arctic BC were investigated by
simulations were 48 and 70 ng m−3 , respectively; the high-
                                                                using a FLEXPART (version 10.1) transport model that in-
altitude values simulated by FLEXPART and GEOS-Chem
                                                                corporated emission inventories. FLEXPART-simulated BC
were 35 and 38 ng m−3 , respectively. The magnitude dif-
                                                                data agreed well with observations at Arctic sites, i.e.,
ference between the BC levels at the Arctic surface could
                                                                Utqiaġvik, Alert, Zeppelin, and Tiksi. The source regions and
be related to meteorology. ECMWF ERA-Interim data were
                                                                source sectors of BC at the surface and high altitudes over
used as the input for the FLEXPART simulation, whereas
                                                                a wide region in the Arctic north of 66◦ N were simulated.
the GEOS-Chem simulation was driven by assimilated me-
                                                                BC at the Arctic surface was sensitive to local emissions and
teorological data from the Goddard Earth Observation Sys-
                                                                those from nearby Nordic countries (> 60◦ N). These results
tem (GEOS-5).
                                                                emphasize the role of anthropogenic emissions such as gas
   The treatments of the BC removal processes could also
                                                                flaring and development of the Northern Sea Route in af-
lead to different simulation results, depending on the model.
                                                                fecting air quality and climate change in the Arctic. Anthro-
In terms of BC loss processes, dry and wet depositions were
                                                                pogenic emissions in the northern regions of Russia were the
the removal pathways, depending on the particle size and
                                                                main source (56 %) of Arctic surface BC annually. In con-
density, in FLEXPART. The treatment of meteorology, es-
                                                                trast, BC in the Arctic at high altitudes was sensitive to mid-
pecially cloud water and precipitation, would therefore af-
                                                                latitude emissions (30–60◦ N). Although they are geospa-
fect the uncertainties of the simulations. In FLEXPART ver-
                                                                tially far from the Arctic, anthropogenic emissions in East
sion 10.1, BC particles are separately parameterized as ice
                                                                Asia made a notable (40 %) contribution to BC in the Arctic
nuclei for ice clouds, cloud condensation nuclei for liquid-
                                                                at high altitudes annually. Open biomass burning emissions,
water clouds, and 90 % as cloud condensation nuclei for
                                                                which were mainly from Siberia, Alaska, and Canada, were
mixed-phase clouds. The separation of mixed-phase clouds is
                                                                important in summer, contributing 56 %–85 % of BC at the
realistic, as 77 % of in-cloud scavenging processes occurred
                                                                Arctic surface and 40 %–72 % at Arctic high altitudes. Fu-
in the mixed phase over a 90 d period starting from Decem-
                                                                ture increases in wildfires as a result of global warming could
ber 2006 (Grythe et al., 2017).
                                                                therefore increase the air pollution level during the Arctic
   In GEOS-Chem simulations, the BC aging was parame-
                                                                summer. This study clarifies the source regions and sectors
terized based on the number concentration of OH radicals
                                                                of BC in the Arctic. This information is fundamental for un-
(Liu et al., 2011). The BC was assumed to be hydrophilic
                                                                derstanding and tackling air pollution and climate change in
in liquid clouds (T ≥ 258 K) and hydrophobic when serving
                                                                the region.
as ice nuclei in ice clouds (T < 258 K) (Wang et al., 2011),
with modifications because the scavenging rate of hydropho-
bic BC was reduced to 5 % of water-soluble aerosols for liq-    Data availability. The data set for simulated footprint and
uid clouds (Bourgeois and Bey, 2011). Such a treatment is       BC source contributions is available upon request to the correspond-
expected to improve the simulation accuracy (Ikeda et al.,      ing author.
2017).
   In Lagrangian models, the trajectories of particles are
computed by following the movement of air masses with           Supplement. The supplement related to this article is available on-
no numerical diffusion, although some artificial numerical      line at: https://doi.org/10.5194/acp-20-1641-2020-supplement.
errors could be generated from stochastic differential equa-
tions (Ramli and Esler, 2016). As a result, long-range trans-
port processes can be well simulated (Stohl, 2006; Stohl et     Author contributions. CZ and YK designed the study. CZ, MT, and
al., 2013). In comparison, Eulerian chemical transport mod-     IP optimized the FLEXPART model. CZ performed FLEXPART
els such as GEOS-Chem have the advantage of simulat-            model simulations, conducted analyses, and wrote the paper. KI and
ing nonlinear processes on the global scale, which enables      HT provided data for GEOS-Chem simulations and site observa-
treatment of the BC aging processes (coating with soluble       tions. All authors made comments that improved the paper.
components) (Bey et al., 2001; Eastham et al., 2018). How-
ever, with GEOS-Chem, the capture of intercontinental pol-
                                                                Competing interests. The authors declare that they have no conflict
lution plumes is difficult because of numerical plume dis-
                                                                of interest.
sipation (Rastigejev et al., 2010). Nevertheless, the agree-
ment between the FLEXPART and GEO-Chem simulations

Atmos. Chem. Phys., 20, 1641–1656, 2020                                           www.atmos-chem-phys.net/20/1641/2020/
C. Zhu et al.: FLEXPART v10.1 simulation of source contributions to Arctic black carbon 1653
Acknowledgements. We acknowledge staff from the following uni- tic Climate (ARCPAC) Project, Atmos. Chem. Phys., 11, 2423–
versities and agencies for BC observational data: Utqiaġvik and 2453, https://doi.org/10.5194/acp-11-2423-2011, 2011.
Tiksi sites are operated by the National Oceanic and Atmo- Cohen, J., Screen, J. A., Furtado, J. C., Barlow, M., Whittle-
spheric Administration; the Zeppelin site is operated by Stock- ston, D., Coumou, D., Francis, J., Dethloff, K., Entekhabi,
holm University; and the Alert site is operated by Environ- D., Overland, J., and Jones, J.: Recent Arctic amplification
ment and Climate Change Canada. We are grateful to Chan- and extreme mid-latitude weather, Nat. Geosci., 7, 627–637,
dra Mouli Pavuluri (Tianjin University) and an anonymous re- https://doi.org/10.1038/Ngeo2234, 2014.
viewer for the comments. We thank Helen McPherson, PhD, Cooke, W. F. and Wilson, J. J. N.: A global black carbon aerosol
from Edanz Group (https://en-author-services.edanzgroup.com/ model, J. Geophys. Res.-Atmos., 101, 19395–19409, 1996.
?utm_source=ack&utm_medium=journal, last access: 10 Febru- Cozic, J., Verheggen, B., Mertes, S., Connolly, P., Bower, K.,
ary 2020) for editing a draft of this paper. Petzold, A., Baltensperger, U., and Weingartner, E.: Scav-
enging of black carbon in mixed phase clouds at the high
alpine site Jungfraujoch, Atmos. Chem. Phys., 7, 1797–1807,
Financial support. This research has been supported by the En- https://doi.org/10.5194/acp-7-1797-2007, 2007.
vironmental Research and Technology Development Fund, MOEJ Dong, X., Zhu, Q., Fu, J. S., Huang, K., Tan, J., and Tipton, M.:
(grant no. 2-1505). Evaluating recent updated black carbon emissions and revisiting
the direct radiative forcing in Arctic, Geophys. Res. Lett., 46,
3560–3570, https://doi.org/10.1029/2018GL081242, 2019.
Review statement. This paper was edited by Hailong Wang and re- Eastham, S. D., Long, M. S., Keller, C. A., Lundgren, E., Yan-
viewed by Chandra Mouli Pavuluri and one anonymous referee. tosca, R. M., Zhuang, J. W., Li, C., Lee, C. J., Yannetti, M., Auer,
B. M., Clune, T. L., Kouatchou, J., Putman, W. M., Thompson,
M. A., Trayanov, A. L., Molod, A. M., Martin, R. V., and Ja-
cob, D. J.: GEOS-Chem High Performance (GCHP v11-02c):
References a next-generation implementation of the GEOS-Chem chemi-
cal transport model for massively parallel applications, Geosci.
AMAP Assessment 2015: Black carbon and ozone as Arc- Model Dev., 11, 2941–2953, https://doi.org/10.5194/gmd-11-
tic climate forcers, Arctic Monitoring and Assessment Pro- 2941-2018, 2018.
gramme (AMAP), Oslo, Norway, 2015. Eckhardt, S., Quennehen, B., Olivie, D. J. L., Berntsen, T. K.,
Bey, I., Jacob, D. J., Yantosca, R. M., Logan, J. A., Field, Cherian, R., Christensen, J. H., Collins, W., Crepinsek, S.,
B. D., Fiore, A. M., Li, Q. B., Liu, H. G. Y., Mickley, Daskalakis, N., Flanner, M., Herber, A., Heyes, C., Hodnebrog,
L. J., and Schultz, M. G.: Global modeling of tropospheric O., Huang, L., Kanakidou, M., Klimont, Z., Langner, J., Law,
chemistry with assimilated meteorology: Model description K. S., Lund, M. T., Mahmood, R., Massling, A., Myriokefali-
and evaluation, J. Geophys. Res.-Atmos., 106, 23073–23095, takis, S., Nielsen, I. E., Nojgaard, J. K., Quaas, J., Quinn, P. K.,
https://doi.org/10.1029/2001jd000807, 2001. Raut, J. C., Rumbold, S. T., Schulz, M., Sharma, S., Skeie, R. B.,
Bond, T. C., Streets, D. G., Yarber, K. F., Nelson, S. M., Woo, J. H., Skov, H., Uttal, T., von Salzen, K., and Stohl, A.: Current model
and Klimont, Z.: A technology-based global inventory of black capabilities for simulating black carbon and sulfate concentra-
and organic carbon emissions from combustion, J. Geophys. tions in the Arctic atmosphere: a multi-model evaluation using a
Res., 109, D14203, https://doi.org/10.1029/2003JD003697, comprehensive measurement data set, Atmos. Chem. Phys., 15,
2004. 9413–9433, https://doi.org/10.5194/acp-15-9413-2015, 2015.
Bond, T. C., Bhardwaj, E., Dong, R., Jogani, R., Jung, S. K., Ro- Evangeliou, N., Balkanski, Y., Hao, W. M., Petkov, A., Silverstein,
den, C., Streets, D. G., and Trautmann, N. M.: Historical emis- R. P., Corley, R., Nordgren, B. L., Urbanski, S. P., Eckhardt, S.,
sions of black and organic carbon aerosol from energy-related Stohl, A., Tunved, P., Crepinsek, S., Jefferson, A., Sharma, S.,
combustion, 1850–2000, Global Biogeochem. Cy., 21, Gb2018, Nojgaard, J. K., and Skov, H.: Wildfires in northern Eurasia af-
https://doi.org/10.1029/2006GB002840, 2007. fect the budget of black carbon in the Arctic – a 12-year retro-
Bourgeois, Q. and Bey, I.: Pollution transport efficiency spective synopsis (2002–2013), Atmos. Chem. Phys., 16, 7587–
toward the Arctic: sensitivity to aerosol scavenging 7604, https://doi.org/10.5194/acp-16-7587-2016, 2016.
and source regions, J. Geophys. Res., 116, D08213, Evangeliou, N., Kylling, A., Eckhardt, S., Myroniuk, V., Stebel, K.,
https://doi.org/10.1029/2010JD015096, 2011. Paugam, R., Zibtsev, S., and Stohl, A.: Open fires in Greenland in
Brock, C. A., Cozic, J., Bahreini, R., Froyd, K. D., Middlebrook, summer 2017: transport, deposition and radiative effects of BC,
A. M., McComiskey, A., Brioude, J., Cooper, O. R., Stohl, A., OC and BrC emissions, Atmos. Chem. Phys., 19, 1393–1411,
Aikin, K. C., de Gouw, J. A., Fahey, D. W., Ferrare, R. A., https://doi.org/10.5194/acp-19-1393-2019, 2019.
Gao, R. S., Gore, W., Holloway, J. S., Hubler, G., Jefferson, Filimonova, I. V., Komarova, A. V., Eder, L. V., and Provornaya,
A., Lack, D. A., Lance, S., Moore, R. H., Murphy, D. M., I. V.: State instruments for the development stimulation of Arc-
Nenes, A., Novelli, P. C., Nowak, J. B., Ogren, J. A., Peis- tic resources regions, IOP Conf. Ser.: Earth Environ. Sci., 193,
chl, J., Pierce, R. B., Pilewskie, P., Quinn, P. K., Ryerson, T. 012069, https://doi.org/10.1088/1755-1315/193/1/012069, 2018.
B., Schmidt, K. S., Schwarz, J. P., Sodemann, H., Spackman, Garrett, T. J., Brattstrom, S., Sharma, S., Worthy, D. E. J., and Nov-
J. R., Stark, H., Thomson, D. S., Thornberry, T., Veres, P., elli, P.: The role of scavenging in the seasonal transport of black
Watts, L. A., Warneke, C., and Wollny, A. G.: Characteristics, carbon and sulfate to the Arctic, Geophys. Res. Lett., 38, L16805,
sources, and transport of aerosols measured in spring 2008 dur- https://doi.org/10.1029/2011gl048221, 2011.
ing the aerosol, radiation, and cloud processes affecting Arc-
www.atmos-chem-phys.net/20/1641/2020/ Atmos. Chem. Phys., 20, 1641–1656, 20201654 C. Zhu et al.: FLEXPART v10.1 simulation of source contributions to Arctic black carbon
Grythe, H., Kristiansen, N. I., Zwaaftink, C. D. G., Eckhardt, by organic carbon, J. Geophys. Res.-Atmos., 109, D21208,
S., Strom, J., Tunved, P., Krejci, R., and Stohl, A.: A https://doi.org/10.1029/2004jd004999, 2004.
new aerosol wet removal scheme for the Lagrangian particle Klimont, Z., Kupiainen, K., Heyes, C., Purohit, P., Cofala, J., Rafaj,
model FLEXPART v10, Geosci. Model Dev., 10, 1447–1466, P., Borken-Kleefeld, J., and Schöpp, W.: Global anthropogenic
https://doi.org/10.5194/gmd-10-1447-2017, 2017. emissions of particulate matter including black carbon, Atmos.
Hegg, D. A., Clarke, A. D., Doherty, S. J., and Ström, J.: Mea- Chem. Phys., 17, 8681–8723, https://doi.org/10.5194/acp-17-
surements of black carbon aerosol washout ratio on Sval- 8681-2017, 2017.
bard, Tellus B, 63, 891–900, https://doi.org/10.1111/j.1600- Klonecki, A., Hess, P., Emmons, L., Smith, L., Orlando, J., and
0889.2011.00577.x, 2011. Blake, D.: Seasonal changes in the transport of pollutants into the
Hertel, O., Christensen, J. Runge, E. H., Asman, W. A. H., Berkow- Arctic troposphere-model study, J. Geophys. Res.-Atmos., 108,
icz, R., Hovmand, M. F., and Hov, O.: Development and testing 8367, https://doi.org/10.1029/2002jd002199, 2003.
of a new variable scale air pollution model – ACDEP, Atmos. Koch, D. and Hansen, J.: Distant origins of Arctic black
Environ., 29, 1267–1290, 1995. carbon: A Goddard Institute for Space Studies Mod-
Hirdman, D., Burkhart, J. F., Sodemann, H., Eckhardt, S., Jefferson, elE experiment, J. Geophys. Res.-Atmos., 110, D04204,
A., Quinn, P. K., Sharma, S., Strom, J., and Stohl, A.: Long-term https://doi.org/10.1029/2004jd005296, 2005.
trends of black carbon and sulphate aerosol in the Arctic: changes Koch, D., Schmidt, G. A., and Field, C. V.: Sulfur, sea salt, and
in atmospheric transport and source region emissions, Atmos. radionuclide aerosols in GISS ModelE, J. Geophys. Res., 111,
Chem. Phys., 10, 9351–9368, https://doi.org/10.5194/acp-10- D06206, https://doi.org/10.1029/2004jd005550, 2006.
9351-2010, 2010. Lack, D. A. and Langridge, J. M.: On the attribution
Huang, K. and Fu, J. S.: A global gas flaring black carbon emis- of black and brown carbon light absorption using the
sion rate dataset from 1994 to 2012, Scient. Data, 3, 160104, Angstrom exponent, Atmos. Chem. Phys., 13, 10535–10543,
https://doi.org/10.1038/sdata.2016.104, 2016. https://doi.org/10.5194/acp-13-10535-2013, 2013.
Huang, K., Fu, J. S., Prikhodko, V. Y., Storey, J. M., Ro- Law, K. S. and Stohl, A.: Arctic air pollution:
manov, A., Hodson, E. L., Cresko, J., Morozova, I., Ig- Origins and impacts, Science, 315, 1537–1540,
natieva, Y., and Cabaniss, J.: Russian anthropogenic black https://doi.org/10.1126/science.1137695, 2007.
carbon: Emission reconstruction and Arctic black carbon Liu, D., Quennehen, B., Darbyshire, E., Allan, J. D., Williams, P.
simulation, J. Geophys. Res.-Atmos., 120, 11306–11333, I., Taylor, J. W., Bauguitte, S. J. B., Flynn, M. J., Lowe, D., Gal-
https://doi.org/10.1002/2015jd023358, 2015. lagher, M. W., Bower, K. N., Choularton, T. W., and Coe, H.: The
Ikeda, K., Tanimoto, H., Sugita, T., Akiyoshi, H., Kanaya, importance of Asia as a source of black carbon to the European
Y., Zhu, C. M., and Taketani, F.: Tagged tracer simulations Arctic during springtime 2013, Atmos. Chem. Phys., 15, 11537–
of black carbon in the Arctic: transport, source contribu- 11555, https://doi.org/10.5194/acp-15-11537-2015, 2015.
tions, and budget, Atmos. Chem. Phys., 17, 10515–10533, Liu, J., Fan, S., Horowitz, L. W., and Levy II, H.: Eval-
https://doi.org/10.5194/acp-17-10515-2017, 2017. uation of factors controlling long-range transport of black
Ikeda, K., Tanimoto, H., Sugita, T., Akiyoshi, H., Clerbaux, C., and carbon to the Arctic, J. Geophys. Res., 116, D00A14,
Coheur, P. F.: Model and satellite analysis of transport of Asian https://doi.org/10.1029/2010JD015145, 2011.
anthropogenic pollution to the Arctic: Siberian and Pacific path- Ma, P.-L., Gattiker, J. R., Liu, X., and Rasch, P. J.: A
ways, and their meteorological controls, J. Geophys. Res., in re- novel approach for determining source-receptor relationships
view, 2020. in model simulations: a case study of black carbon transport
Janssens-Maenhout, G., Crippa, M., Guizzardi, D., Dentener, F., in northern hemisphere winter, Environ. Res. Lett., 8, 024042,
Muntean, M., Pouliot, G., Keating, T., Zhang, Q., Kurokawa, https://doi.org/10.1088/1748-9326/8/2/024042, 2013.
J., Wankmüller, R., Denier van der Gon, H., Kuenen, J. J. McMahon, T. A. and Denison, P. J.: Empirical atmospheric de-
P., Klimont, Z., Frost, G., Darras, S., Koffi, B., and Li, position parameters – a survey, Atmos. Environ., 13, 571–585,
M.: HTAP_v2.2: a mosaic of regional and global emission https://doi.org/10.1016/0004-6981(79)90186-0, 1979.
grid maps for 2008 and 2010 to study hemispheric trans- Najafi, M. R., Zwiers, F. W., and Gillett, N. P.: Attri-
port of air pollution, Atmos. Chem. Phys., 15, 11411–11432, bution of Arctic temperature change to greenhouse-gas
https://doi.org/10.5194/acp-15-11411-2015, 2015. and aerosol influences, Nat. Clim. Change, 5, 246-249,
Keegan, K. M., Albert, M. R., McConnell, J. R., and Baker, I.: https://doi.org/10.1038/Nclimate2524, 2015.
Climate change and forest fires synergistically drive widespread Qi, L., Li, Q. B., Henze, D. K., Tseng, H. L., and He, C. L.:
melt events of the Greenland Ice Sheet, P. Natl. Acad. Sci. USA, Sources of springtime surface black carbon in the Arctic: an ad-
111, 7964–7967, https://doi.org/10.1073/pnas.1405397111, joint analysis for April 2008, Atmos. Chem. Phys., 17, 9697–
2014. 9716, https://doi.org/10.5194/acp-17-9697-2017, 2017.
Kipling, Z., Stier, P., Schwarz, J. P., Perring, A. E., Spackman, J. Quinn, P. K., Bates, T. S., Baum, E., Doubleday, N., Fiore,
R., Mann, G. W., Johnson, C. E., and Telford, P. J.: Constraints A. M., Flanner, M., Fridlind, A., Garrett, T. J., Koch, D.,
on aerosol processes in climate models from vertically-resolved Menon, S., Shindell, D., Stohl, A., and Warren, S. G.: Short-
aircraft observations of black carbon, Atmos. Chem. Phys., 13, lived pollutants in the Arctic: their climate impact and possi-
5969–5986, https://doi.org/10.5194/acp-13-5969-2013, 2013. ble mitigation strategies, Atmos. Chem. Phys., 8, 1723–1735,
Kirchstetter, T. W., Novakov, T., and Hobbs, P. V.: Evidence that the https://doi.org/10.5194/acp-8-1723-2008, 2008.
spectral dependence of light absorption by aerosols is affected Ramli, H. M. and Esler, J. G.: Quantitative evaluation of numerical
integration schemes for Lagrangian particle dispersion models,
Atmos. Chem. Phys., 20, 1641–1656, 2020 www.atmos-chem-phys.net/20/1641/2020/You can also read


