Temperature and volatile organic compound concentrations as controlling factors for chemical composition of α-pinene-derived secondary organic aerosol
←
→
Page content transcription
If your browser does not render page correctly, please read the page content below
Atmos. Chem. Phys., 21, 11545–11562, 2021
https://doi.org/10.5194/acp-21-11545-2021
© Author(s) 2021. This work is distributed under
the Creative Commons Attribution 4.0 License.

Temperature and volatile organic compound concentrations as
controlling factors for chemical composition of α-pinene-derived
secondary organic aerosol
Louise N. Jensen1 , Manjula R. Canagaratna2 , Kasper Kristensen1,3 , Lauriane L. J. Quéléver4 , Bernadette Rosati1,5 ,
Ricky Teiwes5 , Marianne Glasius1 , Henrik B. Pedersen5 , Mikael Ehn4 , and Merete Bilde1
1 Department    of Chemistry, Aarhus University, Aarhus C, Denmark
2 Aerodyne    Research, Inc., Billerica, MA, USA
3 Department of Biological and Chemical Engineering, Aarhus University, Aarhus C, Denmark
4 Institute for Atmospheric and Earth System Research – INAR/Physics,

University of Helsinki, Helsinki, Finland
5 Department of Physics and Astronomy, Aarhus University, Aarhus C, Denmark

Correspondence: Merete Bilde (bilde@chem.au.dk)

Received: 4 February 2020 – Discussion started: 26 February 2020
Revised: 14 February 2021 – Accepted: 9 March 2021 – Published: 3 August 2021

Abstract. This work investigates the individual and com-         ture during particle formation result in only minor changes in
bined effects of temperature and volatile organic compound       the elemental composition of the particles. Thus, the temper-
precursor concentrations on the chemical composition of par-     ature at which aerosol particle formation is induced seems to
ticles formed in the dark ozonolysis of α-pinene. All ex-        be a critical parameter for the particle elemental composition.
periments were conducted in a 5 m3 Teflon chamber at an             Comparison of the HR-ToF-AMS-derived estimates of the
initial ozone concentration of 100 ppb and initial α-pinene      content of organic acids in the particles based on m/z 44
concentrations of 10 and 50 ppb, respectively; at constant       in the mass spectra show good agreement with results from
temperatures of 20, 0, or −15 ◦ C; and at changing temper-       off-line molecular analysis of particle filter samples collected
atures (ramps) from −15 to 20 and from 20 to −15 ◦ C.            from the same experiments. Higher temperatures are associ-
The chemical composition of the particles was probed us-         ated with a decrease in the absolute mass concentrations of
ing a high-resolution time-of-flight aerosol mass spectrome-     organic acids (R-COOH) and organic acid functionalities (-
ter (HR-ToF-AMS).                                                COOH), while the organic acid functionalities account for an
   A four-factor solution of a positive matrix factoriza-        increasing fraction of the measured particle mass.
tion (PMF) analysis of the combined HR-ToF-AMS data is
presented. The PMF analysis and the elemental composi-
tion analysis of individual experiments show that secondary
organic aerosol particles with the highest oxidation level       1   Introduction
are formed from the lowest initial α-pinene concentration
(10 ppb) and at the highest temperature (20 ◦ C). A higher       Atmospheric aerosol particles can alter air quality (WHO,
initial α-pinene concentration (50 ppb) and/or lower temper-     2016) and visibility (Wang et al., 2009) on a regional scale.
ature (0 or −15 ◦ C) results in a lower oxidation level of the   On a global scale, particles affect cloud formation, the radia-
molecules contained in the particles. With respect to the car-   tive balance, and thus climate (IPCC, 2013).
bon oxidation state, particles formed at 0 ◦ C are more com-        Atmospheric particles are chemically diverse entities, of-
parable to particles formed at −15 ◦ C than to those formed at   ten with a significant mass fraction of organic compounds
20 ◦ C. A remarkable observation is that changes in tempera-     (Zhang et al., 2007; Jimenez et al., 2009). Secondary organic
                                                                 aerosol (SOA) is formed from the condensation of oxida-

Published by Copernicus Publications on behalf of the European Geosciences Union.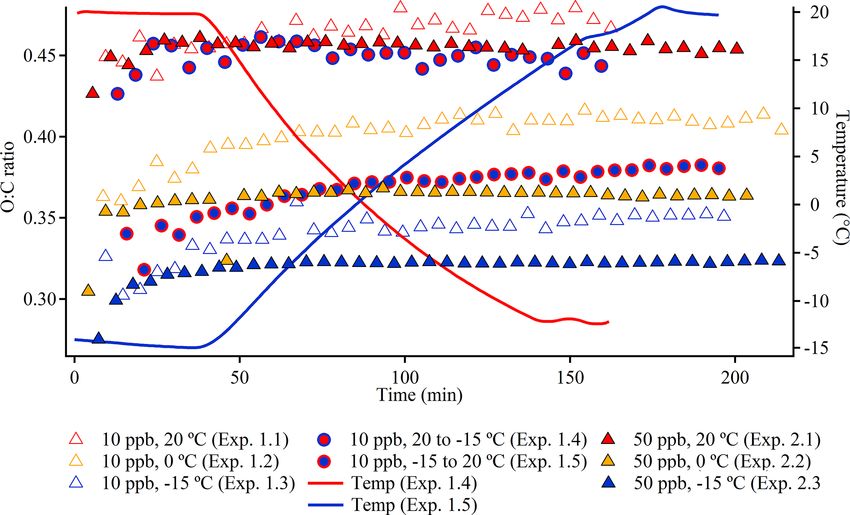
11546       L. N. Jensen et al.: Impact of temperature and VOCs on the chemical composition of α-pinene-derived SOA

tion products of volatile organic compounds (VOCs) emitted         creased the temperature from 22 ◦ C to a maximum of 40 ◦ C
from both anthropogenic and biogenic sources (Sindelarova          and then decreased the temperature back to 22 ◦ C in some
et al., 2014; Seinfeld and Pandis, 2016). α-pinene is a bio-       experiments. During heating, they observed a decrease in
genic VOC emitted from sources such as the foliage of conif-       SOA size, which is an indication of evaporation, and dur-
erous trees (Rasmussen, 1972), and it has been identified          ing cooling, they observed an increase in SOA size, which is
as the most common monoterpene in boreal forests all year          an indication of condensation. In experiments by Warren et
round (Hakola et al., 2003). In the atmosphere, α-pinene is        al. (2009), where the temperature was cycled in the ranges
oxidized primarily by ozone (O3 ), hydroxyl radicals (OH q),       of 5 to 27 and 27 to 45, respectively, heating was associated
and nitrate radicals (NO3 q). Due to their low vapor pressures,    with a decrease in particle mass, and cooling was associated
some of the gas-phase oxidation products may partition onto        with an increase in particle mass. In a recent study by Zhao et
already existing particles by condensation or reactive uptake      al. (2019), where the temperature was cycled between 5 and
and contribute to particle growth (Hallquist et al., 2009). In     35 ◦ C (RH varied between 10 % and 80 %), it was suggested
addition, some low-vapor-pressure oxidation products of α-         that condensation during cooling is lower than predicted by
pinene are able to nucleate (Kirkby et al., 2016) and likely       equilibrium partitioning.
play an important role in the initial growth of new particles in      The chemical composition of the gas and particle phases
the atmosphere (O’Dowd et al., 2002; Riipinen et al., 2012;        in α-pinene ozonolysis experiments is determined by a com-
Ehn et al., 2014; Tröstl et al., 2016).                            bination of thermodynamic and kinetic aspects (Zhang et al.,
   It is well established that the particle mass available for     2015; Kristensen et al., 2017). However, the effect of temper-
the condensation of gases affects the partitioning of or-          atures below room temperature (∼ 20 ◦ C), in particular be-
ganic species between the gas phase and the particle phase         low 0 ◦ C, on gas-phase oxidation products, nucleation, SOA
(Pankow, 1994a, b), although the traditional partitioning the-     growth, and particle chemical composition remains a largely
ory is limited in relation to non-liquid, more viscous parti-      unexplored area (Kristensen et al., 2017; Simon et al., 2020).
cles, such as α-pinene-derived SOA formed at low relative          As low temperatures are of high atmospheric relevance (e.g.,
humidity (Renbaum-Wolff et al., 2013), because of slow dif-        low temperatures prevail at the latitudes of the boreal forests
fusion (Cappa and Wilson, 2011; Pöschl, 2011).                     and at higher elevation), it is important to quantify SOA for-
   The fraction (F ) of a given semi-volatile species in the       mation and properties under cold conditions. Furthermore,
particle phase at a given temperature has been formulated in       vertical transport can lead to changes in temperature within
an absorptive equilibrium partitioning framework as                short time frames, affecting reaction kinetics, condensation
         1                                                         processes, and properties relevant for the climate effect of
F=             ,                                            (1)    particles (Topping et al., 2013; Murphy et al., 2015).
     1 + c∗ /M
                                                                      The lack of knowledge on how the chemical composi-
where c∗ is the gas-phase mass concentration at saturation,        tion of both the gas phase and particle phase vary with tem-
and M is the mass concentration of absorbing material (Kroll       perature was the motivation behind the Aarhus Chamber
and Seinfeld, 2008). Thus, the chemical composition of a           Campaign on Highly Oxygenated Organic Molecules and
particle that is in equilibrium with the surrounding gas phase     Aerosols (ACCHA) introduced in Kristensen et al. (2020).
is affected by both c∗ and M. The c∗ of a gaseous com-             The ACCHA campaign focuses on temperatures from 20
pound is generally inversely related to its level of oxida-        to −15 ◦ C, corresponding to conditions relevant in the bo-
tion (Jimenez et al., 2009). The particle composition can be       real forest regions (Portillo-Estrada et al., 2013). As in most
shifted towards species with higher c∗ values (i.e., less ox-      chamber experiments, VOC concentrations in the ACCHA
idized, more volatile species) by increasing the mass con-         campaign (10–50 ppb) were 1–2 orders of magnitude higher
centration of preexisting particles, i.e., the value of M; con-    than typical ambient conditions (Kourtchev et al., 2016).
versely, lower M values result in particle-phase composi-          These conditions were chosen to speed up aerosol forma-
tions that are dominated by species with lower c∗ values (i.e.,    tion in the experiments, and we believe that the data provide
more oxidized, less volatile species). This has been experi-       valuable and atmospherically relevant information that is ap-
mentally confirmed by studies such as Shilling et al. (2009),      plicable to regions such as the boreal forest.
who showed that the oxidation level of SOA from α-pinene              The impact of temperature on the yield of highly oxy-
ozonolysis decreases with increasing particle mass loadings.       genated organic molecules (HOMs) is presented in Quéléver
   The equilibrium partitioning of a gas with a given c∗           et al. (2019), and more details on VOCs are presented in
(volatility) also depends on temperature, as demonstrated by       Rosati et al. (2019).
Pathak et al. (2007), Saathoff et al. (2009), and Warren et           The goal of the current paper is to investigate and quan-
al. (2009), based on chamber studies of α-pinene-derived           tify the individual and combined effects of α-pinene precur-
particles at different constant temperatures between −30 and       sor concentrations and temperature on the SOA mass con-
45 ◦ C. Partitioning has also been addressed in chamber stud-      centration and chemical composition. For this purpose, we
ies where the temperature was ramped after the initial (con-       describe and discuss a subset of the data collected during
stant temperature) formation of SOA. Stanier et al. (2007) in-     the ACCHA campaign, focusing on results obtained from

Atmos. Chem. Phys., 21, 11545–11562, 2021                                          https://doi.org/10.5194/acp-21-11545-2021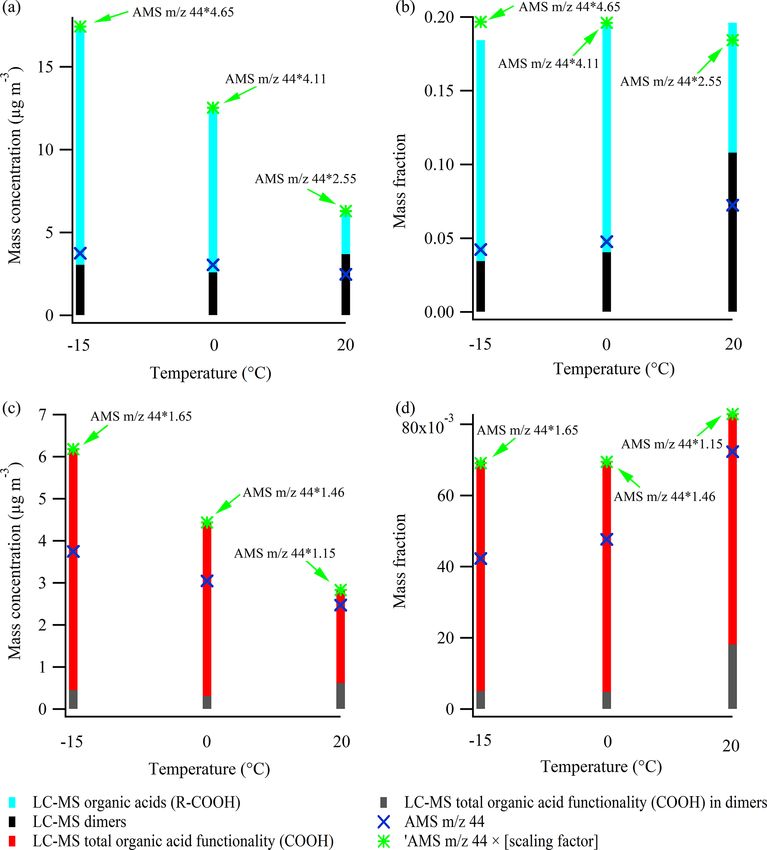
L. N. Jensen et al.: Impact of temperature and VOCs on the chemical composition of α-pinene-derived SOA 11547
a high-resolution time-of-flight aerosol mass spectrometer
Table 1. Overview of experimental details for the ACCHA experiments included in this work. The experiments are constant temperature (const. temp.) experiments and/or temperature
a Temperature and relative humidity probe failure after 59 min and the rest of the constant temperature experiment. b Temperature and relative humidity probe failure after 42 min. ∗ Averages of temperature and relative humidity are based on data
Density
1.25
1.20
1.16
1.23
1.17
1.23
1.15
1.12
1.21
1.14
1.13
(g cm−3)
(HR-ToF-AMS).
from the time of α -pinene injection to filter sampling and might differ slightly from the values reported in Kristensen et al. (2020). Densities are 30 min averages obtained by the end of the experiments (1.1–1.5 and 3.1–3.3). NA denotes not
2 Methods
Ramp
start-to-end RH
(%)
NA
11.7 to 1.7
2.1 Experimental
This work is based on experiments conducted in the Aarhus
University Research on Aerosol (AURA) smog chamber: a
∼ 5 m3 bag made of 125 µm fluorinated ethylene propylene
Ramp
start-to-end temp.
(◦ C)
19.8 to −12.0
−14.0 to 19.6
Teflon film located in an enclosure, where the temperature
is controllable between −16 and 26 ◦ C. The AURA chamber
has been described in detail by Kristensen et al. (2017).
The experiments were conducted as part of the ACCHA
campaign and focus on SOA formed in dark ozonolysis of α-
pinene at various temperatures. An overview of the campaign
RH avg. at const. temp.
(%)
0.5 (±0.7) [0.0–2.1]
6.0 (±2.9) [2.8–12.7]
10.3 (±2.1) [8.0–15.0]
0.8 (±0.9) [0.0–3.0]
7.0a (±0.2) [6.9–7.5]
24.7 (±3.6) [19.3–31.7]
1.7 (±1.6) [0.0–4.6]
8.9b (±0.1) [8.6–9.1]
14.5 (±3.8) [11.1–23.0]
(± SD) [start to end]c
is provided in Kristensen et al. (2020); therefore, only a short
summary of the ACCHA campaign is given here. A modified
version of the overview table of the experiments from Kris-
tensen et al. (2020) is also presented in Table 1, where the
focus is on the parameters relevant in this work. At a con-
stant respective temperature of 20, 0, or −15 ◦ C, ozone was
injected into the chamber to a concentration of ∼ 100 ppb,
followed by the injection of either 10 ppb (low concentra-
Temp. avg. at const. temp.
(◦ C)
20.2 (±0.0)
0.0 (±0.2)
−15.1 (±0.3)
20.0 (±0.2)
−0.3a (±0.1)
−15.0 (±0.2)
20.0 (±0.2)
0.0b (±0.1)
−15.4 (±0.6)
tion) or 50 ppb (high concentration) α-pinene. The chamber (±SD)c
was operated at atmospheric pressure, and neither seed parti-
cles nor OH scavengers were introduced.
Three series of constant temperature experiments, all con-
sisting of an experiment at 20, 0, and −15 ◦ C, were con-
ducted. In one of the series, 10 ppb α-pinene was injected
into the chamber (experiments 1.1–1.3), while two similar
series of experiments were performed at 50 ppb α-pinene
α-pinene
(ppb)
10
10
10
10
10
50
50
50
50
50
50
(experiments 2.1–2.3 and 3.1–3.3). Additionally, the series of
10 ppb α-pinene experiments includes two temperature ramp
experiments, where the temperature was decreased from 20
to −15 ◦ C (experiment 1.4) and increased from −15 to 20 ◦ C
(ppb)
104
105
106
103
113
105
107
113
100
105
105
O3
(experiment 1.5) ∼ 35 min after α-pinene injection, which
corresponds to the period during SOA formation and before
Temp. ramp (20 to −15 ◦ C)
Temp. ramp (−15 to 20 ◦ C)
mass peak.
In this work, we present data from a subset of instruments
Const. temp. (−15 ◦ C)
Const. temp. (−15 ◦ C)
Const. temp. (−15 ◦ C)
Const. temp. (20 ◦ C)
Const. temp. (20 ◦ C)
Const. temp. (20 ◦ C)
involved in the ACCHA campaign: a temperature and humid-
Const. temp. (0 ◦ C)
Const. temp. (0 ◦ C)
Const. temp. (0 ◦ C)
ity sensor (HC02-04) attached to a HygroFlex HF320 trans-
mitter (Rotronic AG) placed in the center of the chamber;
Experiment
a scanning mobility particle sizer (SMPS), consisting of a
differential mobility analyzer (DMA; TSI 3082) and a nano
type
water-based condensation particle counter (CPC; TSI 3788);
ramp (temp. ramp) experiments.
and a high-resolution time-of-flight aerosol mass spectrom-
Experiment
eter (HR-ToF-AMS; Aerodyne Research Inc.) (Jayne et al.,
20161202
20161208
20161207
20161209
20161220
20161212
20161219
20161221
20170112
20170116
20170113
2000; DeCarlo et al., 2006; Canagaratna et al., 2007). In the
following, the HR-ToF-AMS will be referred to as AMS.
ID
Both the SMPS and AMS were placed at room temperature
Experiment
next to the chamber outlets, and the connecting tubing was
temperature insulated.
available.
no.
1.1
1.2
1.3
1.4
1.5
2.1
2.2
2.3
3.1
3.2
3.3
https://doi.org/10.5194/acp-21-11545-2021 Atmos. Chem. Phys., 21, 11545–11562, 2021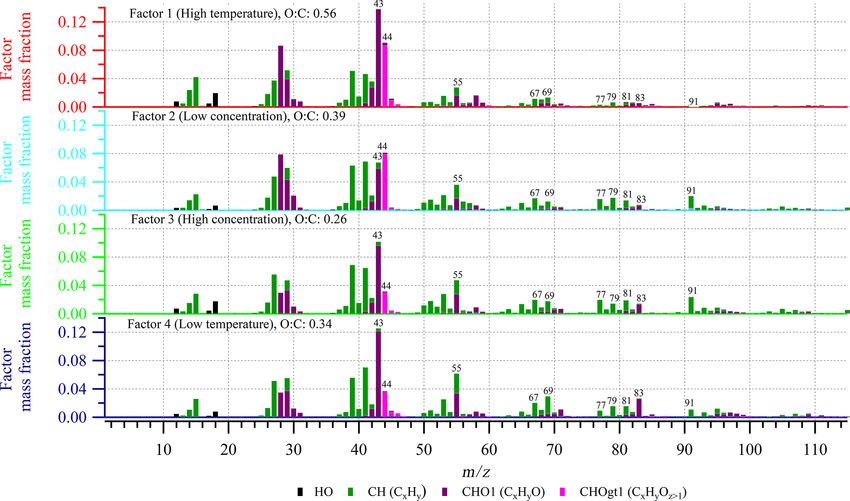
11548       L. N. Jensen et al.: Impact of temperature and VOCs on the chemical composition of α-pinene-derived SOA

   By the end of each experiment, a particle sample               al., 2009). The estimation of standard deviations was per-
was collected on a Teflon filter (0.45 µm pore size;              formed as outlined in Ulbrich et al. (2009) with “weak” ions
CHROMAFIL). Particle samples were extracted and ana-              (i.e., ions with signal/noise (S/N ) < 2) being down-weighted
lyzed by an ultrahigh-performance liquid chromatograph–           by a factor of 2, and “bad” ions (i.e., ions with S/N < 0.2)
electrospray ionization quadrupole time-of-flight mass spec-      being down-weighted by a factor of 10. Additional sources
trometer (UHPLC–ESI-qTOF-MS; Bruker Daltonics), as de-            of uncertainty that are not accounted for in the PMF analysis
scribed in Kristensen et al. (2020), where the analytical         of high-resolution mass spectra are uncertainties related to
method and results are also presented in detail. Herein,          high-resolution fitting, including errors in peak shape, and
we compare the findings from the UHPLC–ESI-qTOF-MS,               m/z calibrations (Cubison and Jimenez, 2015). The num-
hereafter referred to as LC-MS, to the AMS measurements.          ber of factors (p) is chosen based on a combination of the
                                                                  evaluation of residuals, Q values, and a priori knowledge
2.2   Data analysis                                               about the dataset (Lanz et al., 2007; Ulbrich et al., 2009).
                                                                  In the result section, a four-factor solution of the PMF anal-
Positive matrix factorization (PMF) (Paatero and Tapper,          ysis of high-resolution AMS data is presented. Although
1994; Paatero, 1997) has traditionally been used to investi-      the five-factor solution and six-factor solution have lower
gate contributions of different sources to ambient particles,     Q/Qexpected (Qexpected ≈ m × n, i.e., the number of points in
and the application of PMF to AMS data from chamber ex-           the data matrix, Ulbrich et al., 2009) compared with the four-
periments was first demonstrated by Craven et al. (2012). In      factor solution, a larger number of factors is not selected be-
the present work, PMF analysis is applied to chemical com-        cause it does not provide any more interpretable information
position data from SOA particles that are produced in the         about the particle composition. The background for choosing
ozonolysis of α-pinene but are formed and aged under dif-         the four-factor solution over the five- and six-factor solutions
ferent temperatures and precursor concentrations and, con-        is explained in more detailed in the Supplement (Figs. S1–
sequently, different particle loadings. High-resolution AMS       S11).
mass spectra of SOA particles from the various experimen-            As previous laboratory experiments show that the collec-
tal conditions were analyzed in one matrix, allowing for the      tion efficiency (CE) and relative ionization efficiency (RIE)
spectral and elemental chemical composition changes that          of laboratory SOA are variable (Docherty et al., 2013), the
occur to be monitored as conditions change. The PET tool          mass concentrations presented in the PMF analyses are es-
(V 2.09A) was used to perform the PMF analysis on high-           timated from the total SOA mass concentration, as obtained
resolution AMS mass spectra, according to the principles de-      from integrated SMPS size distributions, assuming spherical
scribed in detail by Ulbrich et al. (2009).                       particles and densities calculated from the AMS-derived ele-
   PMF is a model that can be used to express measured mass       mental ratios (Kuwata et al., 2011). Densities are derived as
spectra as a linear combination of factors that are the prod-     averages based on AMS data from the last 30 min of each ex-
ucts of constant mass spectra and related time profiles as fol-   periment. Uncertainties related to the density calculation are
lows:                                                             described in Kuwata et al. (2011).
      X
xij =     gip fpj + eij .                                   (2)      Mass spectra of the factors from the PMF analysis are
        p                                                         compared using the methods described by Wan et al. (2002)
                                                                  and Ulbrich et al. (2009), respectively. The comparisons fo-
The measured mass spectral data are the matrix X, an m × n
                                                                  cus on both the entire high-resolution mass spectra, m/z 12
matrix with n ion masses measured at m different time points,
                                                                  to m/z 115, and the range of m/z > 44 to prevent an impact
and xij is an element of this matrix. p is the number of fac-
                                                                  from the most intense peaks, especially m/z 43 and m/z 44,
tors chosen for the solution, gip is an element of the matrix
                                                                  which are the ions associated with the largest variation be-
G containing time series of the factors, and fpj is an ele-
                                                                  tween the factors.
ment of the matrix F of constant factor mass spectral profiles.
                                                                     Low SOA concentrations at the beginning of the experi-
The matrix elements eij correspond to the error matrix, E, of
                                                                  ments increase the uncertainty of the AMS measurements.
residuals not explained by the model (Paatero, 1997; Ulbrich
                                                                  Therefore, the first 4 to 16 min of the experiments (longest in
et al., 2009). Equation (2) is solved using the PMF2 algo-
                                                                  the 10 ppb α-pinene experiments) are omitted from the ele-
rithm (Paatero, 1997), which uses linear least-squares fitting
                                                                  mental analysis of the AMS data.
and the constraints that the values of matrix F and G have to
be nonnegative. The solution is found by minimizing the fit
parameter Q:
                                                                  3   Results and discussion
        m X  n
                 eij 2
       X
Q=                     ,                                    (3)   To provide an overview of the course of a typical experiment,
       i=1 j =1
                 σij
                                                                  Fig. 1a shows the evolution of the particle mass concentration
where σij is an element of a matrix containing the standard       and the elemental composition, illustrated by the oxygen-to-
deviations for each element of X (Paatero, 1997; Ulbrich et       carbon (O : C) ratio in experiment 2.3 which is conducted at

Atmos. Chem. Phys., 21, 11545–11562, 2021                                         https://doi.org/10.5194/acp-21-11545-2021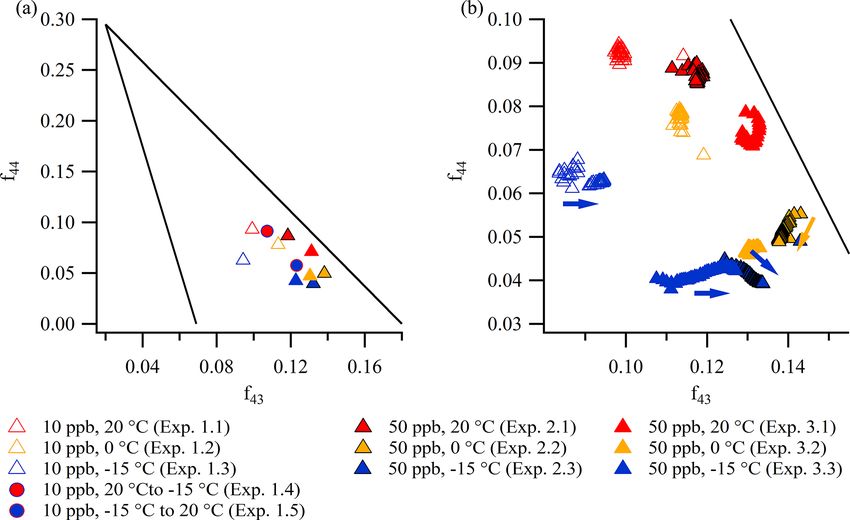
L. N. Jensen et al.: Impact of temperature and VOCs on the chemical composition of α-pinene-derived SOA                        11549

Figure 1. (a) Evolution of the SOA mass (density corrected) and the O : C ratio during a typical experiment (50 ppb α-pinene, −15 ◦ C,
experiment 2.3) and (b) the mass spectra of the experiment obtained at the mass peak (5 min average). gt denotes greater than.

−15 ◦ C with an initial α-pinene concentration of 50 ppb. At         of particles formed in dark ozonolysis of α-pinene in other
the beginning of the experiment, both the mass concentration         chambers (Bahreini et al., 2005; Song et al., 2007; Shilling
and O : C ratio increase significantly, but the O : C ratio tends    et al., 2009; Chhabra et al., 2010).
to stabilize after ∼ 50 min, whereas the particle mass concen-
tration continues to increase and peaks after ∼ 175 min (not         3.1   PMF analysis of aerosol mass spectra
corrected for wall loss). The reported particle mass concen-
tration is obtained using a density of 1.12 g cm−3 . Accord-
                                                                     While PMF analysis is traditionally utilized to identify dis-
ing to Table 1 and Supplement Fig. S12, the AMS-derived
                                                                     tinct sources in ambient measurements and the factors are
SOA densities are of the order of 1.1–1.3 g cm−3 by the end
                                                                     named according to what they are (e.g., oxygenated organic
of the experiments. There are indications of a slight increase
                                                                     aerosol – OOA), here PMF analysis of the combined dataset
in density with higher experimental temperature as well as
                                                                     of α-pinene SOA experiments provides a tool to identify sub-
a slightly higher density for the particles formed at a low
                                                                     tle changes in the measured mass spectra across the different
α-pinene concentration (10 ppb) compared with a high α-
                                                                     experimental conditions and the factors are named accord-
pinene concentration (50 ppb). For reproducibility with re-
                                                                     ing to the conditions under which they dominate. The analy-
spect to SOA formation (mass concentration) as well as loss
                                                                     sis was performed on a combined dataset representing eight
rates of α-pinene and ozone, see Kristensen et al. (2020).
                                                                     different experimental conditions: three constant temperature
   Figure 1b is a mass spectrum of experiment 2.3 obtained
                                                                     conditions (20, 0, and −15 ◦ C) with two initial α-pinene con-
from the high-resolution AMS data at the highest particle
                                                                     centrations (10 and 50 ppb) – experiments 1.1, 1.2, 1.3, 3.1,
mass concentration (not corrected for wall loss). It shows
                                                                     3.2, and 3.3 – and two temperature ramps (from 20 to −15
that fragments, which belong to the so-called hydrocarbon
                                                                     and from −15 to 20 ◦ C), both with an initial α-pinene con-
family (CH), are distributed throughout the mass spectrum,
                                                                     centration of 10 ppb – experiments 1.4 and 1.5.
with some of the most prominent peaks (and ions) being
                                                                        The result of the four-factor solution from the PMF analy-
m/z 39 (C3 H+                +                 +
                3 ), 41 (C3 H5 ), and 55 (C4 H7 ). The oxidized      sis is presented in Fig. 2 (and Fig. S7), showing the changes
compounds, which belong to the CHO1 and CHOgt1 (gt
                                                                     in mass concentration of the factors as a function of time in
means greater than) families, dominate at m/z 28 (estimated
                                                                     each experiment, and in Fig. 3, showing the high-resolution
from CO+   2 according to Aiken et al., 2008), 29 (CHO ),
                                                              +
             +                +      +               +               mass spectra of the four factors (i.e., factor profiles). The
43 (C2 H3 O ), 44 (C2 H4 O , CO2 ), 55 (C3 H3 O ), and 83
                                                                     mass spectra are colored according to contributions from the
(C5 H7 O+ ). m/z 43 is the most significant peak and also
                                                                     various types of elemental compositions (i.e., ion families)
has the highest contribution of the CHO1 family, whereas
                                                                     that appear at each ion signal. As expected from the com-
the more oxidized CHOgt1 family dominates in m/z 44.
                                                                     parison of the mass spectra from the individual experiments
Previous studies have shown that these two peaks provide
                                                                     (Supplement Figs. S13–S23), the factor profiles show a high
useful information about particle oxidation level (Ng et al.,
                                                                     degree of similarity (Figs. 3 and S24) with small differences
2011). The patterns described above are also observed in the
                                                                     in the relative intensities of ions. Using the method described
mass spectra of the other experiments, which are generally
                                                                     by Ulbrich et al. (2009), on a scale from 0 to 1, with 1 in-
highly comparable across experimental conditions (Supple-
                                                                     dicating highest similarity, the similarity is calculated to be
ment Figs. S13–S23) as well as comparable to mass spectra
                                                                     between 0.86 and 0.97 across all factors in the m/z range

https://doi.org/10.5194/acp-21-11545-2021                                           Atmos. Chem. Phys., 21, 11545–11562, 2021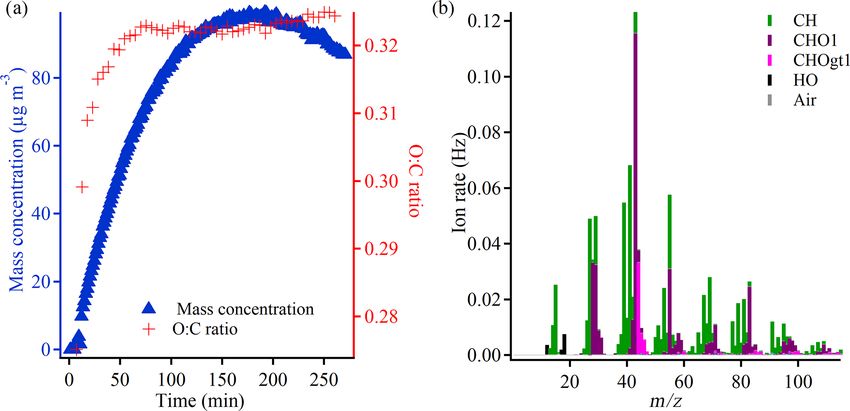
11550       L. N. Jensen et al.: Impact of temperature and VOCs on the chemical composition of α-pinene-derived SOA

from 12 to 115 with Factor 3 and Factor 4 being the most           tributions from hydrocarbons (CH family) such as m/z 39,
similar and Factor 1 and 3 being least similar. By focusing        41, 55, 67, 69, 79, 81, and 91 (Fig. 3).
only on the m/z > 44, similarities between 0.85 and 0.97 are          Factor 3 makes up a significant fraction of the particle
obtained, and Factor 2 and Factor 3 are the most similar and       mass formed in the 50 ppb α-pinene experiments at all tem-
Factor 1 and Factor 2 are least similar. Figure S24 also shows     peratures. It plays a less important role in the 10 ppb α-
the corresponding results of a comparison using the method         pinene experiments conducted at both 0 and −15 ◦ C, whereas
described by Wan et al. (2002).                                    at 20 ◦ C, where the lowest particle mass is formed, Factor 3
   Table 2 summarizes how the four factors differ with re-         is practically nonexistent (Fig. 2). Based on this appearance,
spect to the oxygen-to-carbon (O : C) ratio; the hydrogen-         Factor 3 will be referred to as a “high concentration factor”.
to-carbon (H : C) ratio; the average carbon oxidation state        Looking into the profile of Factor 3 (high α-pinene concen-
(OSC ; Kroll et al., 2011); the ratios between the absolute in-    tration), it has relatively high contributions from the CHO1
tensities of the fragment ions at m/z 43 (C3 H+               +
                                                   7 , C2 H3 O )   family at m/z 55 and m/z 83, and among all factors, it has the
                       +      +
and m/z 44 (C2 H4 O , CO2 ), respectively; and the corre-          highest contribution of m/z 91 from the CH family, which
sponding total organic ion intensity (f43 and f44 , respec-        has been used as a tracer of biogenic emissions in ambient
tively). Variations in these parameters can help explain the       measurements (Lee et al., 2016) (Fig. 3). Factor 3 also has
relative contribution of each factor to the SOA mass under         the lowest f44 (3 %), O : C (0.26), and OSC (−1.08) among
different experimental conditions, i.e., temperatures and α-       all factors, i.e., it represents the least oxidized material (Ta-
pinene concentrations (particle mass loadings).                    ble 2).
   As shown in Fig. 2, the SOA observed under each exper-             Factor 4 (low temperature) appears at low temperature in
imental condition does not correspond to a single PMF fac-         SOA formed in both 10 and 50 ppb α-pinene experiments
tor. The SOA values obtained under different experimental          (Fig. 2). It has around the same level of f43 (13 %) as Factor
conditions are represented by a linear combination of mul-         1 and relatively high intensities of m/z 55 and m/z 83, which
tiple factors instead. However, the factors are clearly distin-    are the fragment ions larger than m/z 43 that are most intense
guished from each other by consistent trends in their relative     in the CHO1 ion family (Fig. 3). On the other hand, Factor 4
mass contributions to the SOA observed under the different         is almost as low as Factor 3 in the more oxidized f44 (4 %)
experimental conditions. These trends are used in the inter-       and also in O : C ratio (0.34) and OSC (−1.03) (Table 2).
pretation and naming of the factors. According to their ap-           It is generally seen that the factors related to temperature
pearance and relative contribution to total SOA mass, factors      variation (factors 1 and 4) show a larger difference in the
1 and 4 will be referred to as “temperature factors” in the        oxidation level than the factors related to the α-pinene con-
following discussion, and factors 2 and 3 will be referred to      centration, i.e., particle mass loading (factors 2 and 3). This
as “concentration factors”. For example, according to Fig. 2,      suggests that, within the investigated conditions, differences
Factor 1 makes up a significant fraction of the particle mass      in temperature (20 to −15 ◦ C) have a larger effect on the par-
in the 20 ◦ C experiments at both α-pinene concentrations, but     ticle chemical composition than the VOC concentration (10
it plays a minor role in the colder experiments. Therefore,        and 50 ppb α-pinene, respectively).
Factor 1 will be referred to as “high temperature factor”. The        Overall, the four PMF factors represent different main
significant contribution of Factor 1 to the SOA mass at high       characteristics of the particle chemical composition associ-
temperature is in agreement with the fact that this factor is      ated with temperature and VOC precursor concentrations,
mostly dominated by ions from oxidized species (i.e., high         and they provide a useful framework for discussing the ef-
intensity of CHO1 and CHOgt1 ion groups at m/z 28, 29, 43,         fects of temperature and VOC concentration on SOA forma-
44, 55, and 83) (Fig. 3). Among all factors, Factor 1 has the      tion and properties in chamber experiments. Figures 2 and
highest O : C ratio (0.56), OSC (−0.53), f43 (14 %), and f44       S7 show that, within each experiment, the relative contribu-
(9 %) (Table 2); therefore, the chemical species represented       tion of the factors changes with time. These changes in rela-
by Factor 1 (i.e., related to high temperature) are likely the     tive ratios likely reflect the changes in the SOA composition
most oxidized entities present in the SOA.                         from nucleation (beginning of experiment), condensational
   Factor 2 is dominant in all 10 ppb α-pinene experiments,        growth (increase in mass concentration), and wall loss (de-
but it is almost nonexistent in the 50 ppb α-pinene experi-        crease in mass concentration towards the end of the experi-
ments. Therefore, it will be referred to as a “low concen-         ment). In addition, ongoing gas-phase chemistry may also af-
tration factor” (Fig. 2). Among all factors, Factor 2 (low α-      fect observed trends in composition (Kristensen et al., 2020).
pinene concentration) has the second highest contribution of       Furthermore, recent studies (Pospisilova et al., 2020) have
oxidized ions (CHO1 and CHOgt1 family) (Fig. 3) as well as         shown that particle-phase processing continues after conden-
the second highest O : C ratio (0.39), OSC (−0.81), and f44        sation, but more work is needed to understand the extent and
(8 %) (Table 2). With f43 (7 %) being of a similar magnitude       mechanisms of such processes; therefore, we cannot con-
as f44 , it has the highest relative ratio of f44 to f43 among     clude on such effects.
the four factors. Furthermore, Factor 2 also has strong con-          In each chamber experiment, the correlation between the
                                                                   relative contribution of each factor and the SOA mass con-

Atmos. Chem. Phys., 21, 11545–11562, 2021                                          https://doi.org/10.5194/acp-21-11545-2021
L. N. Jensen et al.: Impact of temperature and VOCs on the chemical composition of α-pinene-derived SOA 11551
Figure 2. Mass evolution (µg m−3 ) of the four factors from the PMF analysis of the combined AMS dataset including six constant temperature
experiments with an initial α-pinene concentration of 10 or 50 ppb, conducted at 20 ◦ C (experiments 1.1 and 3.1), 0 ◦ C (experiments 1.2 and
3.2), and −15 ◦ C (experiments 1.3 and 3.3), and two temperature ramp experiments with an initial α-pinene concentration of 10 ppb where
the temperature was changed from 20 to −15 ◦ C (experiment 1.4) and from −15 to 20 ◦ C (experiment 1.5). Graphs in the left and middle
columns depict 10 ppb α-pinene experiments, and 50 ppb α-pinene experiments are shown in the right column. Each row of graphs represents
different initial temperatures. The reason for the bump/shoulder around 50 min in experiment 3.3. is unclear.
Table 2. Characteristics of the four factors obtained from PMF analysis of experiments (1.1, 1.2, 1.3, 1.4, 1.5, 3.1, 3.2, and 3.3) according to
Fig. 2. For each factor, the fraction of m/z 43 (f43 ) and m/z 44 (f44 ) relative to the total mass spectra is given as a percentage.
Factor Dominating appearance Characteristics f43 f44 O : C ratio H : C ratio OSC
Factor 1 High temperature Fraction decrease with decreasing tem- 14 9 0.56 1.65 −0.53
perature at both α-pinene concentra-
tions
Factor 2 10 ppb (low) α-pinene High fraction in all 10 ppb experiments; 7 8 0.39 1.59 −0.81
concentration, low par- almost nonexistent in 50 ppb experi-
ticle mass loading ments
Factor 3 50 ppb (high) α-pinene High fraction in all 50 ppb experiments; 10 3 0.26 1.60 −1.08
concentration, high par- appears only slightly in 10 ppb experi-
ticle mass loading ments
Factor 4 Low temperature Fraction decrease with increasing tem- 13 4 0.34 1.71 −1.03
perature at both α-pinene concentra-
tions
https://doi.org/10.5194/acp-21-11545-2021 Atmos. Chem. Phys., 21, 11545–11562, 202111552 L. N. Jensen et al.: Impact of temperature and VOCs on the chemical composition of α-pinene-derived SOA Figure 3. Mass spectra of the four factors from the PMF analysis (see also Fig. 2 and Table 2) of the combined dataset of experiments 1.1–1.5 and 3.1–3.3. gt denotes greater than. centration can be utilized to infer information about the rel- chamber experiments to ambient studies. Here, the analysis ative volatilities of the species in each factor. For example, presented by Lee et al. (2016) is relevant, as they used PMF Figs. 2 and S7 show that the relative mass concentration ratio analysis to explore the SOA sources in a coniferous forest of Factor 2 to Factor 1 is largest at lower SOA mass concen- mountain region in British Columbia, where SOA concen- trations within experiments 1.1 and 1.2. This suggests that trations reached up to 5 µg m−3 and the temperature varied the volatility of species related to Factor 2 is lower than Fac- from ∼ 5 to ∼ 25 ◦ C, corresponding to the temperature in tor 1 species, which is interesting as Factor 1 is more oxi- the upper range of the experiments presented in this paper. dized than Factor 2 (Table 2). For experiments 3.2 and 3.3, PMF factors obtained from the ambient AMS data showed a Figs. 2 and S7 show that the trend in the relative mass con- background source and two biogenic SOA sources: BSOA1 centration ratio of Factor 3 to Factor 4 is largest at time peri- from terpene oxidized by ozone and nitrate radical during ods in the experiments with lower SOA mass concentrations. nighttime, and BSOA2 from terpene oxidized by ozone and This indicates that the volatility of Factor 3 species is lower OH radical during daytime. Especially the BSOA1 O : C ra- than Factor 4 species. The relative volatilities of Factor 1 and tio (0.56), the H : C ratio (1.56), and the overall distribution Factor 3 can be assessed by examining the time trends in ex- of peaks (particularly with respect to the relative ratios of periments 3.1 and 3.2, where the fraction of Factor 1 is higher m/z 58 to m/z 55 and to the ions above m/z 60) in the mass at low mass loading. This, along with the fact that the relative spectrum are comparable to Factor 1 (high temperature). As ratio of Factor 3 to Factor 1 is higher at lower temperatures, both ozone and OH radicals are present in the ACCHA cam- suggests that Factor 3 is more volatile than Factor 1. Taken paign experiments as discussed by Quéléver et al. (2019), together, these results suggest that the volatility (c∗ ) of the is it interesting that the comparability to the Lee et al. (2016) four factors increases in the following way: Factor 2 < Fac- BSOA1 factor representing ozone and nitrate radical at night- tor 1 < Factor 3 < Factor 4. time is higher than the comparability to the BSOA2 factor While we do not see any systematic indications of a spe- representing terpene oxidized by ozone and OH radical at cific factor being coupled to relative humidity in our experi- daytime. This may be related to a larger fraction of SOA ments, we cannot rule out that the changes in relative humid- being formed from ozonolysis rather than OH oxidation in ity during the experiments might have some impact on SOA the ACCHA campaign experiments (Quéléver et al., 2019). composition. Moreover, it suggests that (BSOA1) ozonolysis might have As PMF analysis is traditionally used on ambient AMS been the major SOA formation pathway in Lee et al. (2016) data, it is relevant to compare the findings from the AURA during nighttime. Atmos. Chem. Phys., 21, 11545–11562, 2021 https://doi.org/10.5194/acp-21-11545-2021
L. N. Jensen et al.: Impact of temperature and VOCs on the chemical composition of α-pinene-derived SOA                    11553

   The comparison and similarity between PMF factors from         sition of α-pinene-derived SOA particles is, to a large ex-
laboratory and ambient observations indicates that the PMF        tent, controlled by the temperature at which they are initially
analysis of chamber SOA chemical composition, obtained            formed and that subsequent changes in temperature, even as
under different temperature and loading conditions, can be        dramatic as 35 ◦ C during 100–130 min, only affect the parti-
useful for the interpretation and understanding of ambient        cle chemical composition to a minor extent. Even though the
SOA composition and vice versa.                                   newly formed particles are exposed to this change in temper-
                                                                  ature (∼ 35 min after the start of the experiment and ∼ 1 h
3.2     Trends in chemical composition                            before SOA mass peak; Fig. 2), only slight changes in the
                                                                  chemical composition are observed (Fig. 4).
3.2.1    Elemental analysis                                          It is also relevant to investigate the corresponding evolu-
                                                                  tion of the O : C ratio and the H : C ratio derived from the
Studying the evolution of the elemental composition of SOA        AMS data based on the so-called Van Krevelen plot (Van
can provide insight into the chemical changes occurring dur-      Krevelen, 1950) (Aiken et al., 2007, 2008; Canagaratna et al.,
ing chemical and physical processes. Figure 4 illustrates the     2015). Van Krevelen plots of the constant temperature exper-
evolution of the O : C ratio during constant temperature ex-      iments (1.1–1.3, 2.1–2.3, and 3.1–3.3) are shown in Fig. 5
periments and temperature ramps (standard errors are shown        (the standard errors of O : C ratios and H : C ratios can be
in Fig. S25). The time series of the O : C ratio in both 10 ppb   found in Figs. S25 and S26, respectively). The differences
α-pinene experiments (1.1–1.5) and 50 ppb α-pinene exper-         between the 50 ppb α-pinene experiments conducted at simi-
iments (2.1–2.3 and 3.1–3.3) are shown. In accordance with        lar temperature might be a result of experimental uncertainty.
expectations based on the absorptive equilibrium framework        The figures reveal interesting tendencies, both in relation to
(Eq. 1), previous work (Shilling et al., 2009), and obser-        elemental composition at particle mass peak (Fig. 5a) and
vations from the PMF analysis, SOA formed from a low              to evolution during the experiments (Fig. 5b). For compari-
α-pinene concentration (10 ppb) and at higher temperature         son, the O : C ratio and H : C ratio of the four factors from
are associated with higher O : C ratios, compared with SOA        the PMF analysis, which were obtained from the combined
formed from a high α-pinene concentration (50 ppb) at lower       dataset of several experiments, are also shown in Fig. 5a and
temperatures. In all experiments, an initial increase in the      b. The O : C ratios and H : C ratios of the factors encompass
O : C ratios, which subsequently level off, is observed – most    the data from the individual experiments, illustrating how the
significantly in the 50 ppb α-pinene experiments (2.1–2.3),       factors from the PMF analysis capture and define the ex-
which is probably due to the higher reaction rate in these ex-    tremes in the diversity of the chemical composition of par-
periments. Although the aging of oxidized organic particles       ticles from the individual experiments, as a result of different
in ambient measurements is associated with an increase in         experimental conditions. The largest differences in elemen-
the O : C ratio (Ng et al., 2011) at higher particle mass con-    tal ratios are observed between the SOA particles produced
centrations, the O : C ratio is usually observed to decrease      under different temperatures.
during particle aging (Shilling et al., 2009; Chhabra et al.,        Figure 5b shows that the O : C ratio and the H : C ratio
2010; Denjean et al., 2015b) due to the increased partition-      are almost constant during all constant temperature 10 ppb
ing of less oxidized semi-volatile compounds into the particle    α-pinene experiments. Interestingly, in the 50 ppb α-pinene
phase.                                                            experiments conducted at lower temperatures (0 and −15 ◦ C;
   In the 10 ppb α-pinene experiment (experiment 1.4),            experiments 2.2, 2.3, 3.2, and 3.3), the H : C and O : C ra-
where the temperature is lowered 36 min after the start of the    tios increase simultaneously during the experiment. As this
experiment, the temperature change from 20 to −15 ◦ C is as-      is not a commonly reported trend, neither in ambient mea-
sociated with a small decrease in the O : C ratio, which corre-   surements (Ng et al., 2011; Lee et al., 2016) nor in chamber
sponds to condensation of less oxidized (i.e., more volatile)     experiments focusing on α-pinene-derived SOA (Chhabra et
species (Fig. 4). Conversely, heating the particles from −15      al., 2011), it demonstrates the importance of investigating
to 20 ◦ C at 34 min after the start of the experiment (exper-     SOA particles at low, atmospheric relevant, temperatures.
iment 1.5) results in a slight increase in the O : C ratio as     Several mechanisms could potentially explain the observed
more volatile, less oxidized species evaporate and increase       evolution of the SOA elemental composition in the Van Krev-
the O : C ratio of the remaining particle mass. For compar-       elen plot, and it could in fact be due to a combination of
ison, Denjean et al. (2015a) also observed a slight increase      different simultaneous mechanisms, such as oxidation and
in the O : C ratio when increasing the temperature by 6 ◦ C in    oligomerization. As no OH scavenger is added in our experi-
the room temperature range.                                       ments, one explanation could be related to OH chemistry. Qi
   An important outcome of Fig. 4 is that the O : C ratios        et al. (2012) demonstrated that the exposure of ozonolysis-
at the end of the temperature ramps are closer to the O : C       generated α-pinene SOA to OH radicals increases the O : C
ratios of the particles in the experiments conducted at the       ratio and also leads to higher H : C ratio, due to OH addition
temperature where the ramps start than at the temperatures        to the unsaturated VOC. However, modeling suggests that
where they end. This observation suggests that the compo-         the OH oxidation is not more pronounced at low temperature

https://doi.org/10.5194/acp-21-11545-2021                                       Atmos. Chem. Phys., 21, 11545–11562, 2021
11554 L. N. Jensen et al.: Impact of temperature and VOCs on the chemical composition of α-pinene-derived SOA Figure 4. Time series of the O : C ratio in 10 ppb α-pinene experiments (1.1–1.5) and 50 ppb α-pinene experiments (2.1–2.3). Every fifth data point is shown. Standard errors are shown in Fig. S25. (0 ◦ C), compared with high temperature (20 ◦ C) (Quéléver et increase in OSC is observed. For both the 10 and 50 ppb α- al., 2019), which makes this a less likely explanation for the pinene experiments, the OSC is linearly correlated with the continuous increase in the O : C ratio and H : C ratio in the SOA density (Fig. S27). cold experiments. More specifically, the ratio of VOC oxi- dized by ozone relative to that oxidized by OH radicals was 3.2.2 Oxidized organic tracer ions ∼ 2 : 1, independent of precursor concentration and temper- ature (Quéléver et al., 2019). As described in relation to the mass spectra obtained from While the simultaneous increase in the H : C ratio and the PMF analysis (Fig. 3), differences in VOC precursor con- O : C ratio could also be associated with hydration reactions centrations (i.e., particle mass loading) and temperature pri- (Heald et al., 2010) of carbonyls (Axson et al., 2010), the marily result in intensity differences in the dominant oxygen- condensation of water does not influence the elemental ra- containing ions, m/z 43 and m/z 44. m/z 43 (dominated tios derived from the AMS spectra, as the calculation does by C2 H3 O+ (CHO1 family)) likely derives from organic not directly utilize measured H2 O-related ion signals, be- compounds containing non-acid oxygen (Ng et al., 2010), cause they typically have large interferences from gas-phase whereas the signal at m/z 44 (primary CO+ 2 (CHOgt1 fam- H2 O in air (Canagaratna et al., 2015). It should be mentioned ily)) arises from carboxylic acids (Alfarra, 2004). Both the that the observed increase in the H : C ratio could poten- number of acid groups and the length and functionalization tially be due to impurities condensing to the particle phase of the carbon chain in the compounds affect the intensity of in the cold experiments, although this seems highly unlikely, the signal at m/z 44 (Alfarra et al., 2004; Canagaratna et al., as the chamber was cleaned thoroughly before each experi- 2015). ment (see Kristensen et al., 2020), and the observed changes Figure 6a and b are “triangle plots” (Ng et al., 2010), in the H : C ratios would need an excessive amount of im- showing f44 (the fraction of m/z 44 relative to the total mass purities because the particle mass is high (see Table 1, and in the spectra) as a function of f43 (the fraction of m/z 43 rel- Fig. 2). ative to the total mass in the spectra), obtained from unit mass The combined effect of the evolution of the O : C ratio and resolution data from the AMS. Figure 6a shows the values H : C ratio is shown in Fig. 5c, depicting the average carbon at the peak of mass concentration (five-data-point average) oxidation state OSC (Kroll et al., 2011) during the experi- of constant temperature experiments (1.1–1.3, 2.1–2.3, and ments. At all temperatures the 50 ppb α-pinene experiments 3.1–3.3) and temperature ramp experiments (1.4 and 1.5), reach a relatively stable OSC within ∼ 15 min. This suggests whereas Fig. 6b shows the evolution through the constant that the observed increase in the H : C ratio during the cold temperature experiments. As observed in the Van Krevelen 50 ppb α-pinene experiments (Fig. 5b) only has a small effect plots (Fig. 5a, b), data from the repeated 50 ppb α-pinene on the oxidation state of the particles. Throughout the 10 ppb experiments (2.1–2.3 and 3.1–3.3) conducted at similar tem- α-pinene experiments conducted at constant temperature (ex- peratures show overall reproducibility, although they are not periments 1.1–1.3) and during heating (1.5), a slight gradual identical. Atmos. Chem. Phys., 21, 11545–11562, 2021 https://doi.org/10.5194/acp-21-11545-2021
L. N. Jensen et al.: Impact of temperature and VOCs on the chemical composition of α-pinene-derived SOA 11555
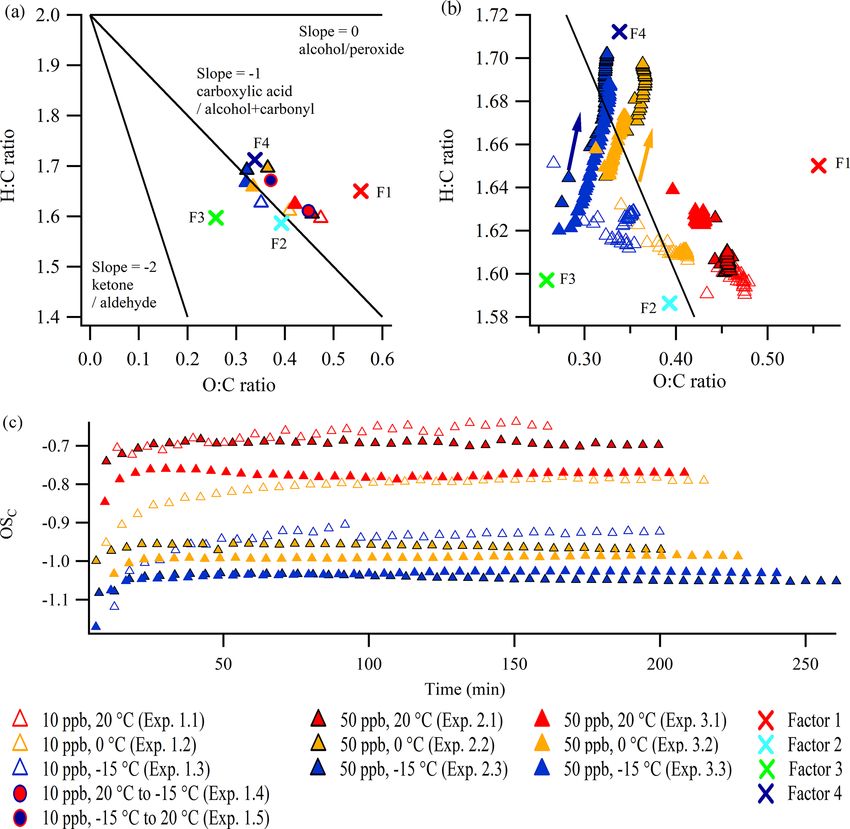
Figure 5. Van Krevelen plots (H : C ratio vs. O : C ratio) at (a) the SOA mass peak (five-data-point average) and in the expansion (b) during
the constant temperature experiments in this work (arrows indicate the direction of time). (c) The OSC during the experiments. The lines in
the Van Krevelen plots are based on Heald et al. (2010) and Ng et al. (2011). Note the different scales of the axes in panels (a) and (b). The
positions of the four factors obtained from the PMF analysis are indicated by crosses: F1 denotes Factor 1 (high temperature), F2 denotes
Factor 2 (low concentration), F3 denotes Factor 3 (high concentration), and F4 denotes Factor 4 (low temperature). Panels (b) and (c) show
every fifth data point. Standard errors are shown in Figs. S25 and S26.
The triangle plots show that particles formed at higher al., 2017) and at −15 ◦ C (Kristensen et al., 2017). The slight
temperature have a higher f44 (i.e., CO+ 2 , acid-derived func- continuous increase in f43 (Fig. 6b) in the experiments con-
tionalities) than particles formed at lower temperature. No ducted at −15 ◦ C (experiments 1.3, 2.3, and 3.3) is in agree-
clear trends with temperature are observed for f43 (i.e., ment with observations by Kristensen et al. (2017) from ex-
C2 H3 O+ , non-acid-derived functionalities). Particles formed periments performed at −15 ◦ C at identical α-pinene con-
at a lower α-pinene concentration (10 ppb) have higher f44 centrations. Moreover, the non-evolving f43 at 20 ◦ C is also
and a lower f43 than particles formed at a higher α-pinene in agreement with the literature exploring α-pinene SOA at
concentration (50 ppb). This suggests that acid-derived func- comparable concentrations and room temperature (Chhabra
tionalities are more prevalent in α-pinene SOA formed at et al., 2011; Kristensen et al., 2017). As the increase in f43
a low precursor concentration (and thus low particle mass is only observed in the cold experiments, especially −15 ◦ C,
loading), which is consistent with less partitioning of the this suggests that the formation of species that give rise to
more volatile, less oxidized material to the particle phase. high f43 values is highly temperature dependent.
In all experiments, f44 values are between 0.04 and 0.1, and
f43 values are between 0.08 and 0.15. These levels are com- 3.2.3 Estimated particle content of organic acids
parable to values reported in the literature from chamber ex-
periments conducted at comparable α-pinene concentrations, In AMS mass spectra, m/z 44 has been shown to be a good
both at room temperature (Chhabra et al., 2011; Kristensen et tracer for the content of organic acids in SOA (Canagaratna et
al., 2015; Yatavelli et al., 2015). Yatavelli et al. (2015) inves-
https://doi.org/10.5194/acp-21-11545-2021 Atmos. Chem. Phys., 21, 11545–11562, 202111556 L. N. Jensen et al.: Impact of temperature and VOCs on the chemical composition of α-pinene-derived SOA Figure 6. The elemental composition of particles formed in experiments 1.1–1.3, 2.1–2.3, and 3.1–3.3 depicted in triangle plots (f44 vs. f43 ) (a) at the mass peak (five-data-point average) and in the expansion (b) during the experiments (∼ 5 min time resolution, arrows indicate the direction of time). Note the different scales of the axes in panels (a) and (b). In the triangle plots, the lines (y = −6.0204x + 0.4154 and y = −1.8438x + 0.3319, where 0.069 ≤ x ≤ 0.18 and y ≤ 0.295) define the common composition of oxygenated organic aerosol (Ng et al., 2010). tigated how the mass concentration of molecules (R-COOH) and 4.65 at 20, 0, and −15 ◦ C, respectively. In the following, containing one or more acid functionalities, can be related to these numbers will be referred to as scaling factors. For com- the AMS-derived mass concentration of m/z 44 multiplied parison, Yatavelli et al. (2015) reported that the m/z 44 AMS by scaling factors. Yatavelli et al. (2015) estimated that 10 % signal was a factor of ∼ 2.32 lower than the mass concentra- to 50 % of the organic particle mass in the Northern Hemi- tion of organic acids in SOA during summertime in a forest sphere can be attributed to molecules containing the car- area dominated by pine trees near Colorado Springs, USA. boxylic acid functionality. Inspired by Yatavelli et al. (2015), Their result is in very good agreement with the scaling factor we explore how the intensity of m/z 44 in the AMS mass obtained in the experiment conducted at 20 ◦ C, which sup- spectra compares to the mass concentration of organic acids ports the hypothesis that the most important organic acids (R-COOH) and organic acid functionalities (-COOH) based in α-pinene SOA are determined by the LC-MS method. on results from the off-line LC-MS analysis of filter samples The variation in scaling factors at the different temperatures obtained by the end of the AURA chamber experiments. As likely reflects that organic acids with different numbers of described in detail in Kristensen et al. (2020), LC-MS anal- acid functionality (-COOH) and/or different multifunctional ysis was performed to identify and quantify 10 carboxylic moieties exhibit different degrees of thermal decomposition acids formed in the dark ozonolysis of α-pinene (constitut- to the m/z 44 signal in the AMS (Canagaratna et al., 2015; ing 18 %–38 % of the SOA mass concentration in the current Yatavelli et al., 2015). The similarity of the scaling factors experiments), as well as 30 dimer esters (constituting in total obtained in the 0 ◦ C (4.11) and −15 ◦ C (4.65) experiments is 4 %–11 % of the total SOA mass concentration in the current consistent with the fact that the SOA chemical composition experiments). at those temperatures have a higher degree of comparability For the 50 ppb α-pinene experiments 3.1, 3.2, and 3.3, relative to the 20 ◦ C experiment, where a lower scaling factor conducted at 20, 0, and −15 ◦ C, respectively, Fig. 7a shows (2.55) is obtained (recall Figs. 4 and 6). the mass concentration of organic acids (R-COOH) identi- As lower SOA mass is produced at the higher tempera- fied from LC-MS analysis (Kristensen et al., 2020), and the tures, it is also relevant to investigate how the mass fractions mass concentration of the m/z 44 signal in the AMS mass of organic acids vary with temperature (Fig. 7b). The mass spectra, scaled to the SMPS mass concentration and cor- fractions are obtained by dividing the LC-MS and AMS re- rected for density, as previously described. For both tech- sults presented in Fig. 7a by the total SOA mass concen- niques (AMS and LC-MS), the mass concentration of or- tration measured in the chamber, prior to the filter sam- ganic acids is lower at higher temperatures. The AMS m/z 44 pling, and corrected as described previously. By applica- mass concentrations are lower than the organic acid concen- tion of the scaling factors found above, the two techniques trations obtained from the LC-MS by factors of 2.55, 4.11, are in good agreement, although slight differences appear Atmos. Chem. Phys., 21, 11545–11562, 2021 https://doi.org/10.5194/acp-21-11545-2021
L. N. Jensen et al.: Impact of temperature and VOCs on the chemical composition of α-pinene-derived SOA                              11557

Figure 7. LC-MS-derived organic acid (R-COOH) mass concentration (a) and organic acid mass fraction (b) at −15, 0, and 20 ◦ C. The
organic acid functionality (-COOH) mass concentration and mass concentration at the three temperatures are shown in panels (c) and (d),
respectively. Additionally, the corresponding results related to dimers are shown. The panels also show m/z 44 – a tracer of organic acids –
from the AMS mass spectra and the scaling factors to be applied to reach the level of organic acid (functionality) measured by the LC-MS.
The particle filter samples analyzed by the LC-MS are obtained by the end of the experiments (see Table 1), whereas the AMS results are
obtained right before the filter sampling (10 min average). The figure is based on data from experiments 3.1–3.3.

at 20 and −15 ◦ C. While the mass concentration of organic              organic acid functionalities (-COOH) are obtained at higher
acids (R-COOH) obtained from the LC-MS decreased sig-                   temperatures, and the scaling factors of 1.15, 1.46, and 1.70
nificantly with higher temperature (Fig. 7a), no trend was ob-          applied to the m/z 44 AMS signal at 20, 0, and −15 ◦ C, re-
served in organic acid mass fractions (Fig. 7b). Interestingly,         spectively (Fig. 7c), are lower and less variable with temper-
for m/z 44 from the AMS mass spectra, the temperature-                  ature than those for the mass concentrations of organic acids
dependent trend changes from decreasing with higher tem-                (R-COOH; Fig. 7a). The difference between the scaling fac-
perature (Fig. 7a) to increasing when focusing on the mass              tors, related to the mass concentration of organic acids (R-
fraction of m/z 44 to total SOA mass concentration (Fig. 7b).           COOH; Fig. 7a) and organic acid functionalities (-COOH;
   Some of the organic acids as well as the dimers observed             Fig. 7c) at the same temperatures, reflects the mass of the
from the LC-MS data (Fig. 7a, b) contain multiple acid func-            organic acid backbone (i.e., R in R-COOH). The observed
tionalities (-COOH) (Kristensen et al., 2020). Therefore, it            trends in Fig. 7a and c suggest that organic acids with heav-
is also relevant to investigate how the mass concentration              ier backbones are formed at temperatures below 20 ◦ C.
and mass fraction of acid functionalities (from the suggested              Figure 7d shows that carboxylic acid functionalities (-
molecular structures; Kristensen et al., 2020) relate to the            COOH) account for a greater fraction of the observed SOA
m/z 44 signal obtained from the AMS. Lower masses of                    mass concentration at higher temperatures, consistent with

https://doi.org/10.5194/acp-21-11545-2021                                               Atmos. Chem. Phys., 21, 11545–11562, 2021
You can also read


