Big Data Contribution in Desktop and Mobile Devices Comparison, Regarding Airlines' Digital Brand Name Effect - MDPI
←
→
Page content transcription
If your browser does not render page correctly, please read the page content below
big data and
               cognitive computing

Article
Big Data Contribution in Desktop and Mobile Devices
Comparison, Regarding Airlines’ Digital Brand Name Effect
Damianos P. Sakas and Nikolaos Th. Giannakopoulos *

                                          Department of Agribusiness and Supply Chain Management, School of Applied Economics and Social Sciences,
                                          Agricultural University of Athens, 118 55 Athina, Greece; d.sakas@aua.com
                                          * Correspondence: ngiannakopoulos2@aua.gr; Tel.: +30-694-001-3673

                                          Abstract: Rising demand for optimized digital marketing strategies has led firms in a hunt to harvest
                                          every possible aspect indicating users’ experience and preference. People visit, regularly through
                                          the day, numerous websites using both desktop and mobile devices. For businesses to acknowledge
                                          device’s usage rates is extremely important. Thus, this research is focused on analyzing each device’s
                                          usage and their effect on airline firms’ digital brand name. In the first phase of the research, we
                                          gathered web data from 10 airline firms during an observation period of 180 days. We then proceeded
                                          in developing an exploratory model using Fuzzy Cognitive Mapping, as well as a predictive and
                                          simulation model using Agent-Based Modeling. We inferred that various factors of airlines’ digital
                                          brand name are affected by both desktop and mobile usage, with mobile usage having a slightly
                                          bigger impact on most of them, with gradually rising values. Desktop device usage also appeared
                                          to be quite significant, especially in traffic coming from referral sources. The paper’s contribution
                                          has been to provide a handful of time-accurate insights for marketeers, regarding airlines’ digital
                                marketing strategies.


Citation: Sakas, D.P.;                    Keywords: desktop; mobile; usage; Big Data; web analytics; SEO; airlines; web traffic; digital
Giannakopoulos, N.T. Big Data
                                          marketing; digital brand name; regression; FCM; agent-based modelling
Contribution in Desktop and Mobile
Devices Comparison, Regarding
Airlines’ Digital Brand Name Effect.
Big Data Cogn. Comput. 2021, 5, 48.
                                          1. Introduction
https://doi.org/10.3390/bdcc5040048
                                               Today more than ever, the percentage of visitors’ mobile application experience is
Academic Editor: Min Chen                 higher than desktops. This can be explained by various factors, with rising usage of mobile
                                          devices being the most forcible. Present technological plethora, helpful for better customer
Received: 24 August 2021                  targeting in emerging and existing markets, are a priceless tool for marketeers. Since the
Accepted: 22 September 2021               user’s needs can be satisfied by technology, value is created, with users continuing to exploit
Published: 26 September 2021              technology [1]. Devices are becoming more personalized than ever before, containing more
                                          details about an individual than any other piece of equipment. Businesses are aiming to
Publisher’s Note: MDPI stays neutral      predict users’ experience and behavioral patterns through their websites, translating it into
with regard to jurisdictional claims in   successful website evaluation and, as a consequence, search results.
published maps and institutional affil-        The current business technological ecosystem provides a monetization potential for
iations.                                  companies, especially since the Big Data environment design offers a holistic implemen-
                                          tation for organizations pursuing transformations and being completely data-driven [2].
                                          In a highly connected world, a wide range of data channels such as social media, mobile
                                          devices, and even the Internet of Things (IoT) create a significant amount of data that
Copyright: © 2021 by the authors.         changes fast. Among the most commonly used progress in the area of web usage mining is
Licensee MDPI, Basel, Switzerland.        web analytics [3]. Key Performance Indicators (KPIs) in web analytics are essential metrics
This article is an open access article    often used to assess websites and applications pages versus goals [3].
distributed under the terms and                Enhanced search results can be related to optimize a firm’s digital brand name, which
conditions of the Creative Commons        can then be related to profitability. In the Big Data era, Search Engine Optimization’s (SEO)
Attribution (CC BY) license (https://
                                          role can be seen as one of the most crucial roles in optimizing firm’s search results and
creativecommons.org/licenses/by/
                                          thus, digital brand name. Its purpose is to supply web developers and content creators
4.0/).

Big Data Cogn. Comput. 2021, 5, 48. https://doi.org/10.3390/bdcc5040048                                     https://www.mdpi.com/journal/bdcc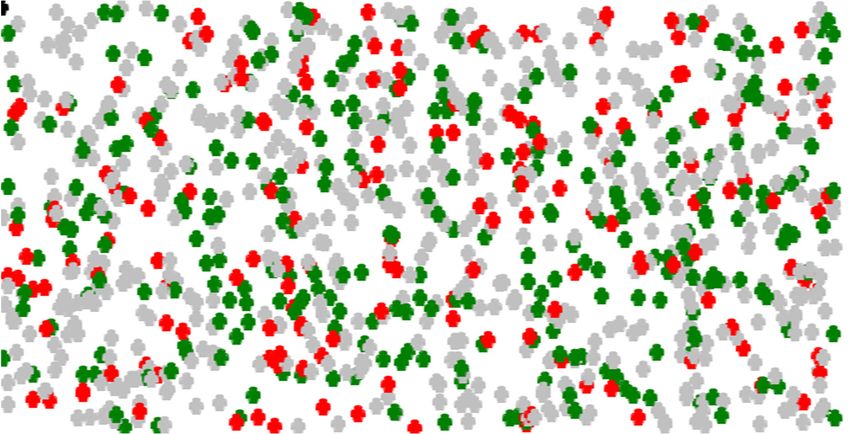
Big Data Cogn. Comput. 2021, 5, 48                                                                                           2 of 22

                                     with necessary tools for developing websites, that score higher rankings in search engine
                                     results, leading to remarkable rise in website’ organic traffic [4]. Website traffic can be
                                     increased, apart from desktop visits, by mobile (smartphones) device usage, when a firm
                                     has developed its unique app. It is practically mandatory for firms to develop a template
                                     designed for mobile devices, for the reason that visitors may convert at a lower rate on
                                     websites that are not optimized for mobile viewing [5].
                                           Regarding desktop usage, visitors experience personal workspaces across the Internet,
                                     which gives them direct access to a cloud-based workspace at any place, whether the device
                                     is a desktop or a smartphone [6]. In recent years, opposed to the past, the majority of
                                     website designs are mobile-friendly with increased responsiveness, driving their usage at
                                     higher levels. Since 2011, the shipment of mobile devices has overrun those of desktop
                                     devices. The mobile-growing audience has increased mobile transactions, irrespective of
                                     time and space of usage [7]. The rise of mobile device usage has been highly related with
                                     the rapid increase of marketplace applications. Marketing through mobile devices appears
                                     to attract more customers than desktops, mostly due to incentives offering cashback offers,
                                     discounts, etc. [8].
                                           In our research, we focused on the airline sector by trying to estimate the effect that
                                     device usage has over their digital brand name. More specifically, we aim to examine
                                     whether desktop and mobile usage can lead to higher levels of web traffic, providing
                                     information over the preferable visitors’ device. In order to represent an airline firm’s
                                     digital brand name, we examined web traffic sources as organic, direct, and referral,
                                     which can efficiently indicate the level of impact airline firms have on people visiting their
                                     websites. Extensively, apart from organic, direct, and referral airline website traffic, we
                                     deploy web metrics of total and unique visits, as well as pages per visit of desktop and
                                     mobile devices, so as to calculate the variable of device usage.

                                     1.1. Big Data, Mobile and Desktop Usage Background
                                     1.1.1. Big Data and Web Analytics Connection with Device Usage
                                            As the terminology indicates, Big Data refers to massive amounts of data that are
                                     difficult to handle using traditional software or web-based solutions. As technology
                                     development encompasses many aspects of human, environmental, and socioeconomic
                                     variables, Big Data storage, mining, analysis, and associated research are required to fully
                                     grasp the dense tendencies in vast data [9]. Nearly every single research field, whether
                                     it is in commerce or university, obtains and assesses large amounts of data for a variety
                                     of purposes. Web analytics approaches and technologies have been shown to be highly
                                     efficient in analyzing how internet users utilize websites, as well as refining and enhancing
                                     websites and digital content. The above has been shown in a variety of domains and
                                     activities, such as e-commerce [10] and digital marketing [11].
                                            As long as Internet users are concerned, device preference is quite a subjective matter
                                     and lies to users’ characteristics and choices such as convenience, etc. When it comes to
                                     firms’ perspective, knowledge over most preferred device with the highest usage levels can
                                     be proven critical in decision-making process. That drives firms to spend time and resources
                                     in understanding key differences between the devices. According to Maurer et al. [12],
                                     groups of people voted in favor of the desktop version of websites, thinking it was more
                                     informative, while both those who voted in favor of desktop or mobile thought their
                                     platform provided better clarity. The newest mobile variables such as apps with a task-
                                     specific nature, limited usability and bandwidth, location-awareness, high personal device
                                     nature, etc., were not as important to pertain people to desktop device usage [13].
                                            Marketeers need to comprehend how some emerging aspects affect user acceptance,
                                     usage, and implications of mobile apps. Foregoing factors have a direct impact on the
                                     interpretation of mediated environments’ perceived user engagement. Factors of simplicity
                                     and clarity promote mobile usage over desktop usage, while higher speed rates are in
                                     favor of desktop usage [12]. Furthermore, people’s subjective customs appear as one of
                                     the key factors for continuance of using services through a particular device and not the
Big Data Cogn. Comput. 2021, 5, 48                                                                                             3 of 22

                                     device’s satisfaction degree [14]. According to Law et al. [15], when it comes to sales
                                     promotion tactics, visual merchandising can be proven effective in increasing transactions
                                     and combining it with an optimized website can convert more visitors to customers,
                                     especially over mobile devices where conversion rates are lower [5].

                                     1.1.2. Determination of Usage in Mobile and Desktop Devices
                                           In what way can we determine the usage of devices? It can be seen as a combination
                                     of users’ metrics that set its measurement over each device. Mobile and desktop devices
                                     appear to have some peculiarities. Social media access through mobile devices is signif-
                                     icantly more frequent than through other devices, giving additional information about
                                     the preferred social media sites. One of the most obvious differences between mobile
                                     and desktop usage deals with User Experience (UX), which consists of components as
                                     content organization, form filling, etc., differentiating mobile usage from desktop usage.
                                     UX reflects on the mobile usage for navigating over search engines, thus increasing web
                                     traffic. The user’s perceived value has positive impact on satisfaction and loyalty over
                                     mobile usage [16], Kim et al. [17] stated that a higher perceived value fortifies mobile
                                     engagement, given that mobile device usage for shopping activities may lead to notable
                                     perceived value and experience of the user [18].
                                           Users on mobile devices tend to return frequently to the website and desktop users
                                     stay on the website for a longer period of time. So, mobile users visit websites frequently
                                     and for short time periods [13]. In this respect, Racherla et al. [13], found that the average
                                     time spent on a website cannot influence a site’s conversion rates and other metrics such
                                     as frequent returns to the site (visits and unique visits) can be more important. Website
                                     visits differ from unique visits, due to cookies recognizing the same IP address reentering
                                     the website in a small period of time (e.g., a couple of days). So, through a selected period,
                                     unique visits count as the same visit (cookies remembering the IP address) and visits are
                                     general IP addresses website visit, in more than 2-days’ time.
                                           Device perceived usefulness and by extension usage is positively affected by mo-
                                     bile devices’ ubiquitous character, making further positive impact on visitors’ perceived
                                     value [19]. Jang et al. [20], highlighted the importance of comprehending mobile utilization
                                     for the purpose of customer participation and usage increase. Ubiquity could pose an
                                     important role in the online retail industry, because of mobiles’ universal connectivity and
                                     customer targeting [21]. For usage to be calculated, statistics and metrics defining the
                                     growth of mobile users through the web are important, with the need of close relation with
                                     the time spent on site from mobiles [22]. More than half of the web traffic worldwide comes
                                     from mobiles, which is predicted to rise up to 80% [23]. In our research, we combined total
                                     visits, unique visits, and pages per visit to obtain the variable of usage in each device.

                                     1.2. Related Background in Mobile and Desktop Usage and Firms’ Digital Brand Name
                                     1.2.1. Connection of Firms’ Traffic Sources with Their Digital Brand Name
                                          As regards airlines’ brand name, factors affecting it should be analyzed and taken
                                     into consideration over its estimation. In order to get a clear view of digital brand name
                                     variables, we use three web traffic sources of organic, referral, and direct traffic, which
                                     indicate the variations of a digital brand name. Organic traffic, in particular, is traffic that
                                     ends to a website through unpaid searches in search engines (e.g., Google, Bing, etc.),
                                     whose role in business’ success is vast. Search Engine Optimization (SEO) projects are
                                     based on organic traffic results for website ranking improvement, since it represents over
                                     60% of a website’s total traffic [24]. Furthermore, organic traffic has many benefits for
                                     businesses, such as small number of investments, trust, credibility and inbound marketing,
                                     as well as providing long lasting results over Pay Per Click (PPC) campaigns [25].
                                          Increased traffic from search engines, which means higher website ranking, can lead
                                     to higher conversion rates. So, the higher the organic traffic the higher the conversion
                                     rates [24]. An important objective for digital marketeers is to increase traffic and lower the
                                     bounce rate by using practical and appealing templates [8]. In this respect, if firms want to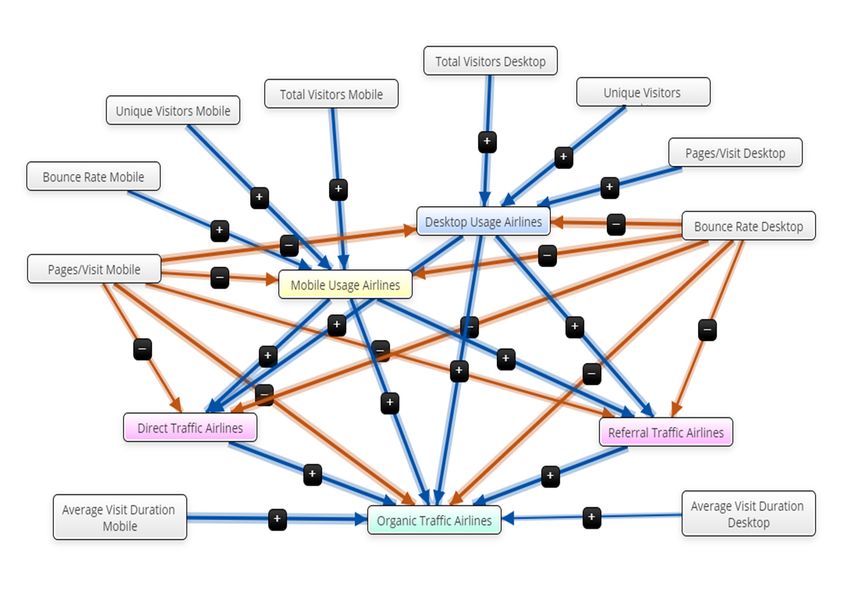
Big Data Cogn. Comput. 2021, 5, 48                                                                                                      4 of 22

                                     raise their sales, they need to create a reliable online presence for their customers to locate
                                     a firms’ services and products [24]. Apart from organic traffic, there is high connection
                                     between direct traffic and firms’ digital brand name visibility [25]. This means that an
                                     increasing amount of web users typing an URL to their browser (direct traffic), indicate
                                     a strong brand name [26]. Referral traffic also has multiple benefits over digital brand
                                     awareness and recognition, because visitors coming to a firm’s website, through trustful
                                     websites, increase the possibility of them becoming customers and the visibility of a firm’s
                                     online products [27]. The web metrics tracking proposed in this paper are presented in the
                                     table below (Table 1).

                                            Table 1. Description of the examined web metrics.

     Web Analytics Metrics                                              Description of the WA Metrics
                                      The term Organic traffic talks about visitors that visit a website as a result of unpaid search results.
          Organic Traffic             Organic traffic is measured by the appearance of the site in the results of a search that potential
                                        users perform in search engines and this traffic is not “referred” by any other website [28].
                                       Referral traffic is a way of reporting when someone visits a site, who either came from another
                                      website or a web page. This involves blogs, directories, industry related forums, etc. When sites
          Referral Traffic
                                      of those types or other pages on the web makes a link to another site, sending traffic to that site, it
                                                                           is called referral traffic [27].
                                      Direct access (direct traffic) to a website occurs when a visitor arrives directly at a website without
           Direct Traffic             having clicked on a link on another site. Direct Traffic can be measured from visitors entering the
                                       exact URL to the browser bar, by clicking on bookmarked saved URLs and by links on emails.
                                      A website visit can be defined and counted as lines of page requests from an IP address within a
              Visitors
                                                           time of 30 minutes between each request or 2 days [29].
                                        Unique visitors are identified as visitors that have never entered the site before, by having a
          Unique Visitors              persistent or session cookie on their browser or device remembering the IP address previously
                                                                            visited the website [29].
                                       A page view is a record about how many times a page has been accessed on a website or by a
          Pages per Visit             specific audience during a given time span [29]. All page views are registered, regardless of how
                                                    many times a user visits the website during the specified time span.
                                      Bounce rate is the ratio of extremely short-termed sessions established by direct traffic (user types
                                        firm’s URL into browser), by referral traffic (hyperlink-clicking), etc., and its correspondent
           Bounce Rate
                                       landing [30]. The bounce rate of a website ascribes a webpage’s efficiency, since lower bounce
                                                               rates mean that users are intrigued by its content.

                                     1.2.2. Impact of Mobile and Desktop Usage on Digital Brand Name’s Factors
                                           Having defined a digital brand name’s factors connected with web traffic sources, we
                                     seek to examine its relationships with desktop and mobile usage. Mobile devices offer a
                                     dynamic medium to website visitors for online shopping, granting a satisfying experience
                                     which keeps shoppers’ using mobile apps [31]. In a related manner, McLean et al. [32]
                                     demonstrated that a meaningful and satisfying user experience will expand consumers’
                                     mobile usage. Consumers tend to search on desktop devices more than mobile ones.
                                     Despite the fact that mobiles are used for a wide variety of services, current mobile adoption
                                     rates are lower than anticipated [33]. Mobile searches account for almost one-quarter of
                                     all searches.
                                           In mobile devices, deal proneness increases mobile usage, revealing that consumers
                                     tend to switch to mobile devices in order to benefit from personalized promotion deals [34].
                                     Mobile usage is also affected by loading times, as 53% of mobile users tend to abandon
                                     the websites they visit when loading time is above 3 minutes [35]. This highlights the
                                     importance of page loadings to user experience and mobile usage, sending a direct message
                                     to web developers. A recent study found that 50.48% of web traffic originates from mobile
                                     devices, while desktop traffic accounts for 46.51% of total web traffic [36]. According to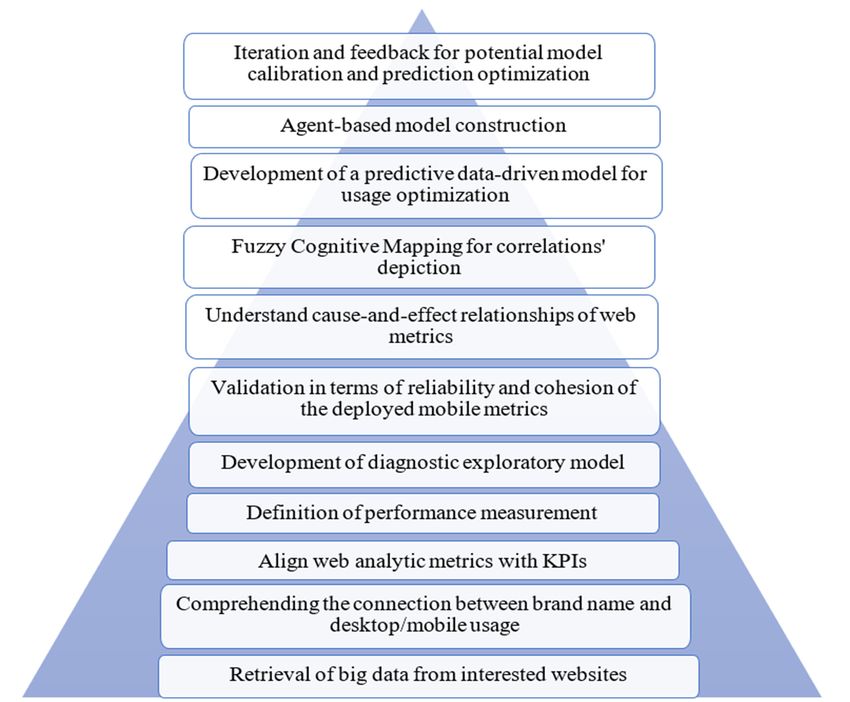
Big Data Cogn. Comput. 2021, 5, 48                                                                                                   5 of 22

                                     Merchant Savvy [37], 58% of total online sales occur from mobile devices, where users
                                     prefer mobiles’ convenience and accessibility over desktops bigger screens.
                                          As mentioned by Bouchrika [38], 58% of Google searches are done from mobile
                                     devices, which means that worldwide over half of all search queries originated from
                                     mobiles, proving their high usage preference. In comparison of desktops and mobile-
                                     optimized websites, mobile devices have higher engagement rates and around 100–300%
                                     higher conversion rates [39]. It clearly shows us that mobile apps are winning over
                                     mobile-optimized websites in user engagement and conversion, with these mobile metrics
                                     varying at regional levels, depending on factors such as mobile-only population and market
                                     maturity [40]. We can clearly see strong correlations between mobile and desktop usage
                                     with firms’ digital brand name and its different variables.

                                     1.2.3. Key Performance Indicators of Mobile/Desktop Usage and Digital Brand Name
                                          Nowadays, almost all people and transactions have gone online, which means that
                                     the usage of devices enabling browsing and transactions to happen has risen exponentially.
                                     Performing forethoughts concerning devices uses that lead to the completion of transactions
                                     opens up portals for a firms’ digital brand name advantages. Before defining the exact
                                     indicators for estimating a firms’ digital brand name performance and benefits, we should
                                     consider the definition of performance indicators. A key performance indicator (KPI) is
                                     a category of performance measurement [41], that assesses a firm’s progress in certain
                                     activities it is taking over.
                                          Accounting for the deficiency of web metrics and the large number of digital marketing
                                     strategies, it becomes more difficult for KPIs to meet necessary requirements [42]. It lies on
                                     marketeers to optimize and align the propriate metrics to the correct KPIs [43]. Keeping in
                                     mind that, the more usage a device has, the more trust and user engagement it acquires [13],
                                     we define the exact metrics and KPIs we seek to estimate in our paper, in terms of usage
                                     and digital brand name factors. For the paper’s purposes, we seek to examine the KPIs of
                                     Table 2. KPIs utilization should be compared on a daily basis for an accurate depiction of
                                     firms’ efficiency.

                              Table 2. Reference of paper’s suggested KPIs and Performance Measurement.

                KPIs                                                     Performance Measurement
                                      Forms one of the most valuable tools for digital marketing strategy and promotion planning and
       Organic Traffic/day             auditing [44]. It is also known as SEO traffic and shows how firms can attract more visitors to
                                                  their website through their strategy, usually over past-time periods [45].
                                       In our study, we suggest the daily measurement and observation of a firm’s website direct and
       Referral Traffic/day            referral traffic, as they provide measurement, classification, and comparison benefits for a daily
                                                                   period, between website’s traffic sources [44].
                                      Similar to the above, measuring the daily rate visitors arrive directly on a website, without having
        Direct Traffic/day             clicked on a link on another site, can supply a firms’ digital strategy with important data form
                                                                           building up a credible KPI.
                                        Visitors are measured by each visitors’ IP address count, through a cookie on their browser,
              Visitors                 which can be useful for understanding and analyzing web traffic over time [46]. After a 2-day
                                        period, the cookie “deletes” itself and starts counting the same IP address as another visit.
                                         In this way firms will be able to analyze spikes and lags in their unique visitor numbers to
          Unique Visitors
                                                                         determine the cause of them
                                      The number of pages visitors see in each session indicate the amount of content they consume. So,
          Pages per Visit              the more content they consume, the more likely they are to see more ads, thus increasing the
                                                                     probability of clicking on ads [47].
                                       The bounce rate explains the percentage of single-page site visits, meaning that, this important
           Bounce Rate                       website KPI, states how often visitors on the website stay on the same page they
                                                                           initially entered [46].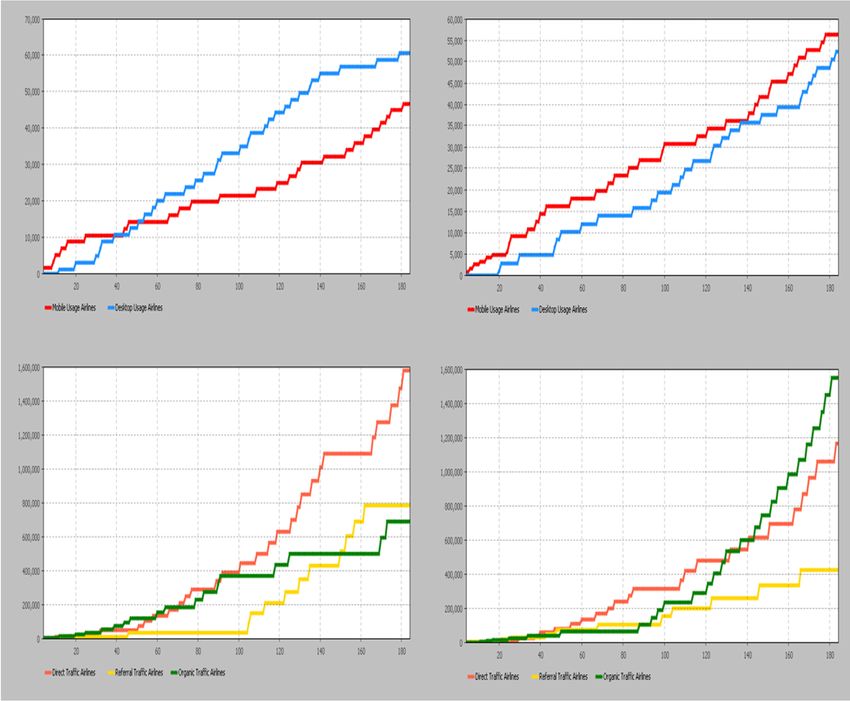
Big Data Cogn. Comput. 2021, 5, 48                                                                                                6 of 22

                                     1.3. Research Hypotheses, Problem Formulation
                                           Rising competition and technology enhancement applications tend to increase com-
                                     panies’ efforts for efficiency in digital marketing campaigns. Brand name improvement,
                                     strongly connected with firms’ digital marketing efficiency, can be displayed by the in-
                                     creased organic, direct and referral web traffic. Airline companies seek to comprehend the
                                     usage of their desktop and mobile devices, so as to organize and maximize their website
                                     efficiency and effectiveness. Since companies enabled access for visitors to their websites
                                     through desktop and mobile devices, they need to grasp the opportunity of knowing which
                                     mean of usage affects the important traffic sources more. Furthermore, by understanding
                                     how the mobile and desktop usage affects their digital brand name and which one has a
                                     higher effect on it, airline firms might be in a positive position to increase digital marketing
                                     benefits. The results of the data collected from the airline companies’ desktop and mobile
                                     device activity give valuable feedback, including:
                                     •    To strategists to easily comprehend the exact web metrics impacting their digital brand
                                          name and the various means of traffic sources attracted to their website.
                                     •    To marketeers to get a clear picture of the most user-preferred device (mobile-desktop)
                                          in favor of brand name optimization.
                                     •    To the organization itself, so as to benefit from user preferred device, especially for
                                          SEO development, based on the specific visitor usage metrics, such as pages per
                                          visit. In this way, the organization will be able to leverage desktop and mobile usage
                                          metrics, such as unique visitors, pages per visit, etc., in favor of their digital marketing
                                          optimization and improve website’s visibility and firm’s digital brand name.
                                           Therefore, we settle six research hypotheses, aiming to extend the practical knowledge
                                     over the significance and impact of desktop usage versus mobile usage on a firm’s digital
                                     brand name.
                                           The first purpose of this paper is to acknowledge whether desktop usage impacts
                                     airlines’ direct and referral traffic and to verify that amount (Hypothesis 1). By knowing
                                     whether potential visitors used the desktop device to visit an airlines’ website provides valu-
                                     able information and potential benefits for those firms, meaning it important to look into.
                                     Hypothesis 1 (H1). Do Airline Direct and Referral Traffic get affected by Usage of Desktop Devices?
                                           Having estimated desktop’s usage effect on referral and direct traffic, we then proceed
                                     to estimate mobile’s usage impact on airlines’ direct and referral traffic (Hypothesis 2).
                                     Again, the examination of the important of the impact caused by website’s referral and di-
                                     rect traffic by mobile usage can help airline firms make decisions about a mobile application
                                     and its requirement.
                                     Hypothesis 2 (H2). Do Airline Referral and Referral Traffic get affected by Usage of Mobile Devices?
                                          After examining the repercussions of mobile and desktop usage to airlines direct
                                     and referral traffic, we continue estimating desktop and mobile usage impact to airlines’
                                     organic traffic (Hypotheses 3 and 4). On the same route, a much more important metric
                                     than referral and direct traffic, is the organic traffic, with airline firms having a bigger
                                     interest in estimating and predicting it. Thus, knowing the significance of desktop and
                                     mobile usage’s impact on airlines organic traffic are two of the most important research
                                     hypotheses of our paper.
                                     Hypothesis 3 (H3). To what extent does Airline Organic Traffic gets affected by the choice of
                                     Desktop Devices?
                                     Hypothesis 4 (H4). To what extent does Airline Organic Traffic gets affected by the choice of
                                     Mobile Devices?
                                         Next on, we focus on comparing the impact of each usage mean, aiming to perceive
                                     which device affects airlines’ direct traffic more (Hypothesis 5). In other words, insights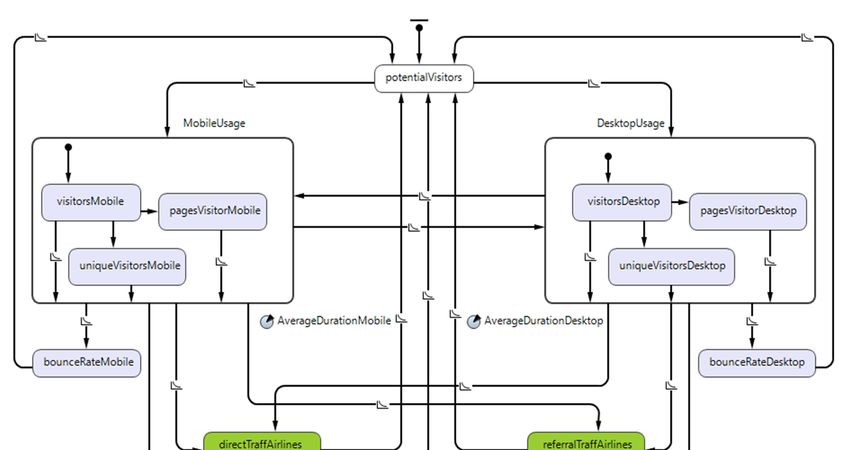
Big Data Cogn. Comput. 2021, 5, 48                                                                                           7 of 22

                                     regarding which device brings the most direct visitors, induces multiple benefits for airline
                                     companies concerning costs linked to device choice, development of mobile app, etc.
                                     Hypothesis 5 (H5). Which Device Usage affects more Airline Direct Traffic, Mobile or Desktop?
                                         For the last hypothesis and retaining the comparison touch, we seek to estimate
                                     whether the average visit duration of mobile devices affect airlines organic traffic more,
                                     than desktop average visit duration does (Hypothesis 6). Insight of that kind seek to
                                     compare the preference of visitors in terms of average visit duration, and acknowledging
                                     which device has the strongest impact to airlines organic traffic is useful.
                                     Hypothesis 6 (H6). Which Average Visit Duration affects more Organic Traffic, those generated
                                     at Mobile or Desktop Devices?

                                     2. Materials and Methods
                                         The purpose of this paper has been the proposal of an innovative methodology for
                                    deploying an efficient framework for understanding the preferred visitors’ device, namely
                                    desktop or mobile, through their web metrics, providing valuable insights for airline firms’
Big Data Cogn. Comput. 2021, 5, x FOR PEER REVIEW                                                                       8 of 24
                                    digital marketing strategy. In this way, we incorporate the above aims to the presented
                                    research stages (Figure 1).

       Figure 1. Overall representation of the proposed methodology, step-by-step, reflecting the stages for comparing desktop
      Figure 1. Overall representation of the proposed methodology, step-by-step, reflecting the stages for comparing desktop
       and mobile usage with websites’ traffic.
      and mobile usage with websites’ traffic.

                                     1.
                                     1.   Big
                                          Big Data
                                              Data retrieval from airlines’
                                                   retrieval from  airlines’ websites
                                                                              websites through
                                                                                       through web
                                                                                               web analytics
                                                                                                    analytics tools
                                                                                                               tools (SEMrush),
                                                                                                                     (SEMrush), for
                                                                                                                                 for
                                          discovering  possible  connections    between   them and  airlines’ traffic, in alignment
                                          discovering possible connections between them and airlines’ traffic, in alignment with
                                          with KPIs. From the data gathered, we distinguish that both desktop and mobile us-
                                          age highly affect airlines’ traffic sources and especially organic traffic;
                                     2.   Developing a Diagnostic Exploratory Model, for existing strong correlations estima-
                                          tion of the chosen web analytics metrics, based on integrity, veracity, and credibility,
                                          by the deployment of Fuzzy Cognitive Mapping [48], linear regression, and correla-
                                          tion analysis;
Big Data Cogn. Comput. 2021, 5, 48                                                                                             8 of 22

                                          KPIs. From the data gathered, we distinguish that both desktop and mobile usage
                                          highly affect airlines’ traffic sources and especially organic traffic;
                                     2.   Developing a Diagnostic Exploratory Model, for existing strong correlations esti-
                                          mation of the chosen web analytics metrics, based on integrity, veracity, and credi-
                                          bility, by the deployment of Fuzzy Cognitive Mapping [48], linear regression, and
                                          correlation analysis;
                                     3.   Lastly, we develop a predictive and simulation model (Agent-Based Modelling) in
                                          combination with regression analysis outputs, for examining the extent of desktop and
                                          mobile usage and average visit duration impact on airlines’ traffic sources and their
                                          joint impact, for estimating which has the strongest effect on the chosen traffic sources.
                                           At the first stage of the methodology, after underlining the reflection of digital market-
                                     ing topics, such as SEO, in our approach, we aim to give a handful of insights to marketeers
                                     regarding web page data. In this stage, interested web metrics collection and alignment
                                     with the selected KPIs is a compulsory part of the process (e.g., high usage of mobile
                                     devices may indicate a rise in direct and referral traffic to airlines’ website, giving stimulus
                                     for harnessing that device in favor of digital marketing strategy). Web metrics collection
                                     took place by utilizing SEMrush tools (www.semrush.com, accessed on 22 September 2021),
                                     which is a website that helps businesses improve their website’s visibility and discovering
                                     marketing insights. Its tools gather web data, such as visitors, bounce rate, organic traffic,
                                     etc., and sorts them in historical order.
                                           At the second stage, after having extracted the parameters and means that impact the
                                     organization’s traffic the most, marketeers and strategists will be in a better position than
                                     before. The use of quantitative statistical analysis escorts the above process, with variations
                                     of mobile and desktop usage causing a variation in organic, direct, and referral airline traffic.
                                     So, after having checked the correlations of selected metrics of both devices, such as total
                                     and unique visitors, bounce rates, average visit duration, we run linear regression models
                                     for the significant variables, offering more accurate decision-making info for marketeers.
                                           At the last stage, the remaining action is to incorporate the metrics correlations and
                                     outputs of the regression analysis to a predictive and simulation model. This can give more
                                     accurate and temporal prediction results. According to Giabbanelli et al. [49], through
                                     simulation and prediction model development we can reach out to both micro and macro
                                     level approaches, combined with decision-making originated in data-driven philosophy.
                                     Thus, we aim to connect the users that interact with airline websites with the results of
                                     the proposed and extracted model. In this path, the aid of eye tracking and emotions
                                     application and software could provide valuable data for model development.

                                     2.1. Sample Selection, Data Retrieval, and KPIs’ Alignment
                                           For the purpose of this paper, we retrieved data from some of the most known airline
                                     companies in the world. Those firms were chosen according to travelers’ opinions and
                                     ratings for 2019 [50], based namely on their personal criteria. So, based on consumers’
                                     opinion and ratings for the airline sector, an analysis of their website visibility accompanied
                                     with visitors’ website behavior is gaining ground. The airline companies included in our
                                     research are the top 10 on the above list, Qatar Airways, Singapore Airlines, ANA All
                                     Nippon Airways, Cathay Pacific Airways, Emirates, EVA Air, Hainan Airlines, Qantas
                                     Airways, Lufthansa, and Thai Airways. For the above airline firms, data were collected
                                     from desktop and mobile devices, concerning their websites’ organic, direct and referral
                                     traffic, as well as their total visitors’ and unique visitors’ number, the pages per visit and
                                     the websites’ bounce rate. The vast amount of web data can lead to promising results
                                     regarding the usage of mobile and desktop devices.
                                           Data were collected on a daily basis from the firms’ websites, for the purpose of
                                     more accurate examination and comprehension of web metrics’ variance. The testing
                                     period extended to 180 observation days, which is limited to specific dates due to data
                                     availability and COVID-19 transportation restrictions from approximately March 2020
                                     to June 2020, Thus, testing period starts from 1 August 2020 and ends 1 January 2021,
Big Data Cogn. Comput. 2021, 5, 48 9 of 22
with data differing from day-to-day and visitor-to-visitor, leading to big fluctuation of the
web metrics. Moreover, in order to align the need of marketeers to reduce the amount of
tracking data, we suggest tracking total visitors and unique visitors’ number and pages
per visit, organic, direct, and referral traffic, so as to better handle and understand Big Data
from websites in favor of their digital marketing optimization.
2.2. Development of Diagnostic and Exploratory Model
In diagnostic and exploratory model development, we aim to capitalize web analytics
data from the selected airline firms, so as the model output to:
1. Emphasize on the strong correlations of the selected metrics;
2. Include the valuable veracity and credibility, enabling digital marketing strategy’s
potential model implementation.
Starting with the first stage, we implemented statistical analysis for ensuring linearity
and normality of the selected metrics from the chosen airline websites. The insurance of
the normality and linearity in the 180 observation days was enabled through appropriate
statistical tests, i.e., Scatter plots, histograms, etc. Psychometric properties of scales were
performed via Cronbach’s alpha [51] and Kaiser-Meyer-Olkin’s [52] tests on the selected
variables. The tests above aim to provide the combined variables with the required cohesion
and tolerance. For the deployment of the diagnostic exploratory model, we performed
linear regression modelling to metrics with the strongest correlations.
Results of the regression analysis, present significant relationships for mobile and
desktop usage with the organic, direct and referral traffic of airlines’ websites. Namely, for
the 10 airlines’ websites used, mobile and desktop usage appear to have strong positive
correlations with organic, direct, and referral traffic, while having strong negative corre-
lations with mobile pages per traffic and desktop bounce rate. Thus, we aim to provide
additional insights to marketing strategists over the impact of mobile and desktop usage to
airlines’ digital brand name and answer the most valuable and important device for each
brand name’s factor, in favor of their digital marketing strategy.
Therefore, we deployed a Fuzzy Cognitive Mapping (FCM), which will implement
selected web metrics of both airline devices depicting the relationships, so as to get a
more adaptive model for process assessment. Fuzzy cognitive mapping deploys a de-
scriptive and consolidated stochastic classification methodology, mainly used to represent
the correlations between airlines’ web metrics. Blue and red arrows in Figure 2 illustrate
variables with positive and negative relations accordingly. Development of the FCM has
been conducted via the Mental Modeler cloud-based application.
The Fuzzy Cognitive Map provides proper illustration of agents’ relationships, which
is used in our paper for recognition of important relationships, putting in use arithmetic
clouts. As Salmeron [48] states, the implementation of Exploratory Modelling in digital
marketing decision-making is broad and very practical. FCM deployment enables firms to
reflect on a macro-level approach their digital marketing strategy plan, based on factors’
relationships [53]. As we see in Figure 2, mobile and desktop usage is affected by the most
known web analytics and thus, affecting organic, referral and direct traffic. In this way,
we illustrate the macro-level depiction of related digital marketing strategy (e.g., SEO,
SEM) and promotion factors, while giving the propriate optimizing tools, which in our
case means reviewing the effects of mobile and desktop usage on airlines’ traffic sources.
Besides FCM, we need to develop at the same time a micro-level analysis for a more
complete depiction of a firm’s market situation. Agent-Based Modeling can provide that
needed analysis, since it depicts the dynamic variations of selected factors, atomically or
amongst them, producing the necessary predictive and simulation model [49]. In our case,
mobile and desktop usage can affect various airline traffic sources such as organic, referral,
or direct. Agent-Based Modelling (ABM) offers the possibility of calculating the impact
of mobile and desktop usage to the above traffic sources, rendering it essential for the
predictive and simulation analysis, at the examined 180 observation days.Therefore, we deployed a Fuzzy Cognitive Mapping (FCM), which will implement
selected web metrics of both airline devices depicting the relationships, so as to get a more
adaptive model for process assessment. Fuzzy cognitive mapping deploys a descriptive
and consolidated stochastic classification methodology, mainly used to represent the cor-
Big Data Cogn. Comput. 2021, 5, 48 relations between airlines’ web metrics. Blue and red arrows in Figure 2 illustrate 10 varia-
of 22
bles with positive and negative relations accordingly. Development of the FCM has been
conducted via the Mental Modeler cloud-based application.
Figure 2.
Figure 2. Fuzzy Cognitive Mapping
Fuzzy Cognitive Mapping depiction
depiction of
of aa macro-level
macro-level approach.
approach.
The Fuzzy of
2.3. Development Cognitive
PredictiveMap provides Model
and Simulation proper illustration of agents’ relationships,
which is used in our paper for recognition of important relationships, putting in use arith-
An agent-based models concept, consists of different characteristics and behavior
metic clouts. As Salmeron [48] states, the implementation of Exploratory Modelling in
agents that interact with each other via a variety of operators, giving us a suitable designed
digital marketing decision-making is broad and very practical. FCM deployment enables
system portrayal of the containing units. The benefits of agent-based modelling (ABM)
firms to reflect
in digital on a macro-level
marketing are highly approach
obvious, their digital
meaning itsmarketing strategy
incorporation plan, basedand
in prediction on
factors’ relationships [53]. As we see in Figure 2, mobile and desktop usage is affected
simulation model development is substantial. This makes decision making on a managerial by
the
levelmost
more known web
feasible. So,analytics and thus, affecting
digital marketing organic,
topics such as SEO,referral and direct
etc., could traffic. In
take advantage
of the implementation of web metrics, combined with mobile and desktop usage, to
traffic source analysis, creating benefits for a firms’ digital brand name. Through ABM, a
calculative and heuristic process is developed by capitalizing large scale Big Data, domain
competence and factors’ relationships. Study [54] highlighted the offerings of micro-level
modelling picture of real-time problems and decision-making configuration, while in the
meantime it can provide further benefits to marketing strategist, such as:
1. Full data range exploitation of mobile and desktop usage, with the business being able
to determine the most profitable device. Up to that point, a clear depiction of a firms’
best choice for harnessing device data in favor of their digital marketing strategy.
2. Acknowledgment of visitors’ micro-level modelling in favor of simulation, keeping
the cost at a low level. Lower costs concerning mobile and desktop strategy can help
airlines design digital marketing campaigns and SEO more efficiently. Thus, whether
a desktop or a mobile device is mostly preferred has the potential to affect a firm’s
organic traffic and consequently the firm’s digital brand name.
3. Alignment of the prediction model, through making it more adaptable with contin-
uous supply of necessary analysis tools. For the above purposes, we deployed the
Agent Based Model, for its precise predictive and simulation capabilities in terms of
web metrics, since the dynamic type it has fits the challenging digital marketing sector.Big Data Cogn. Comput. 2021, 5, 48 11 of 22
3. Results
In this section, we present the results generated from the chosen statistical approach
after being collected from the selected airlines’ websites. Table 3 depicts the chosen
descriptive statistics such as mean, min, max, and standard deviation for each of the
involved web metrics. The results shown in Tables 3–10, refer to data gathering between
1 August 2020 and 1 January 2021.
Table 3. Descriptive statistics of the 10 airline companies’ websites, during a 6-month period.
Mean Min Max Std. Deviation
Organic Traffic 35,289,452.67 30,961,243 39,774,650 3,695,764.1
Direct Traffic 38,924,488.5 35,687,277 41,250,310 2,108,197.7
Referral Traffic 12,175,116.3 11,082,821 13,385,878 857,789.4
Desktop Usage 33,846,947.3 31,972,409.4 36,016,553.63 1,617,726.9
Mobile Usage 80,066,235.9 72,394,957.9 85,753,144.45 4,972,747.7
Desktop Bounce Rate 0.2597 0.2885 0.2306 0.02292
Mobile Bounce Rate 0.3503 0.3622 0.3398 0.00768
Desktop Average Duration 608.12 562.7 639.9 27.73
Mobile Average Duration 435.85 416.1 472.8 22.51
N = 180 observation days for 10 airline companies’ websites
Table 4. Consistency of combined variables.
Kaiser-Meyer–Olkin Factor % of Total Variance
Cronbach’s Alpha
Adequacy Explained
Desktop Usage (Desktop Visitors +
Desktop Unique Visitors + 0.653 0.761 90.318
Desktop Pages Visit)
Mobile Usage (Mobile Visitors +
Mobile Unique Visitors + 0.627 0.647 88.803
Mobile Pages Visit)
Table 5. Impact of desktop usage to direct and referral traffic.
Variable Standardized Coefficient R2 F p Value
Dependent (Direct Traffic) −1,695,452.1
0.848 22.326 0.009 **
Desktop Usage 0.921
Dependent (Referral Traffic) −5,154,225
0.932 55.119 0.002 **
Desktop Usage 0.966
** indicate statistical significance at the 99% level.
Table 6. Impact of mobile usage to direct and referral traffic.
Variable Standardized Coefficient R2 F p Value
Dependent (Direct Traffic) 4,994,900.4
0.999 4674.54 0.000 **
Mobile Usage 1.000
Dependent (Referral Traffic) −1,015,869.8
0.912 41.555 0.003 **
Mobile Usage 0.955
** indicate statistical significance at the 99% level.
Table 7. Impact of mobile and desktop usage to organic traffic.
Variable Standardized Coefficient R2 F p Value
Dependent (Organic Traffic) −37,089,741.3
0.876 28.303 0.006 **
Desktop Usage 0.936Big Data Cogn. Comput. 2021, 5, 48 12 of 22
Table 7. Cont.
Variable Standardized Coefficient R2 F p Value
Dependent (Organic Traffic) −21,058,580.2
0.897 34.719 0.004 **
Mobile Usage 0.947
** indicate statistical significance at the 99% level.
Table 8. Concurrent impact of mobile and desktop usage to direct traffic.
Variable Standardized Coefficient R2 F p Value
Dependent (Direct Traffic) 4,991,692.6 0.000 **
Desktop Usage 0.000 0.999 1752.972 0.996
Mobile Usage 0.999 0.000 **
** indicate statistical significance at the 99% level.
Table 9. Impact of mobile and desktop average visit duration to organic traffic.
Variable Standardized Coefficient R2 F p Value
Dependent (Organic Traffic) −19,815,360.7 0.074
Desktop Average Duration −0.219 0.824 7.010 0.516
Mobile Average Duration 1.019 0.042 *
* indicate statistical significance at the 95% level.
Table 10. Comparison between desktop and mobile usage affecting airlines organic, direct, and referral traffic.
Desktop Usage Leading to Higher Airlines’ Traffic Mobile Usage Leading to Higher Airlines’ Traffic
Web Analytics
Constant Values % of Increase Final Values Constant Values % of Increase Final Values
Metrics
Organic Traffic −37,089,741.3 93.6% −2,373,843.4 −21,058,580.2 94.7% −1,116,104.7
Direct Traffic −1,695,452.1 92.1% −133,940.7 4,994,900.4 100% 9,989,800.8
Referral Traffic −5,154,225 96.6% −175,243.6 −1,015,869.8 95.5% −45,714
As we can see in Table 4, the items consisting of the used variables, produce results
near the required levels of tolerance and item coherence. With KMO and Cronbach’s
alpha values higher than 0.7 [51,52], items are proper for statistical analysis. Our proposed
variables of desktop and mobile usage have almost 0.7 results in the above tests, so they
can be considered appropriate for the upcoming regression analysis.
Tables 5–10, present the results of the multiple linear regressions, performed for the
10 airlines’ websites comparing device usage with traffic sources. In Tables 5 and 6, we see
that both regression models are statistically significant with p values below 5%, verifying
the first and second research hypotheses. The significant regressions of desktop usage
equations had p = 0.009 and 0.002, R2 = 0.848 and 0.932, potential variation of 0.921 for
direct and 0.966 for referral traffic, respectively. With every 1% increase of desktop usage,
airlines’ direct traffic increases by 92.1% and referral by 96.6%. The same applies for mobile
usage, which had p = 0.000 and 0.003, R2 = 0.999 and 0.912, and potential variation of 100
for direct and 0.955 for referral traffic. Every 1% increase of mobile usage, airlines’ direct
traffic increases by 100% and referral by 95.5%.
Next, in Table 7 we have two other statistically significant regressions models with
p = 0.006 and 0.004, R2 = 0.876 and 0.897 and potential variation of 93.6 and 94.7 of organic
traffic caused by desktop and mobile usage, respectively. For every 1% increase of desktop
usage the organic traffic is increased by 93.6%, while for every 1% of mobile usage increase
organic traffic is increased by 94.7%. In this way the third and fourth hypotheses are verified
as both desktop and mobile usage have statistically significant regressions with organic
traffic. In Table 8, we have statistically significant regression for airlines’ direct traffic with
mobile and desktop usage, with p = 0.000, total R2 of 0.999 and potential variation of 0.999Big Data Cogn. Comput. 2021, 5, 48 13 of 22
for mobile usage, while desktop usage appears to have no significant impact on direct
traffic. So, with every 1% rise in mobile usage, direct traffic increases by 99.9%. At last, in
Table 9, an airlines’ organic traffic gets statistically significant impact from mobile usage,
with p = 0.042, total R2 of 0.824 and potential variation of 1.019, while it appears to have
no statistically significant connection with desktop usage. If mobile average duration is
increased by 1%, an airlines’ organic traffic will be increased by 101.9%. In this way, our
sixth hypothesis is verified also with deployment of statistically significant coefficient for
organic traffic and mobile average duration, but not for desktop average duration.
The results above, indicate that desktop usage in comparison with mobile usage
produces greater percentage impact. Nevertheless, the statistical significance of mobile’s
impact in organic and direct traffic is stronger (p-levels of significance have lower score)
meaning that mobile usage’s impact is bigger than desktop’s usage. For referral traffic,
the opposite is applied with desktop usage having slightly bigger impact that mobile
usage. When it comes to visit duration, mobile average visit duration has a higher impact
to airlines’ organic traffic than desktop duration, which appears to have no statistically
significant impact to it at all. From Table 10, we can see that both mobile and desktop
device usage increase an airlines’ digital brand name by increasing their traffic sources,
specifically organic traffic. In order to calculate the exact effect device usage has on an
airlines’ traffic, we should examine how the individual metrics form usage variable, and
of course how they interact between them. In this way, we can have a clearer picture of
the impact each device’s usage has. There is great opportunity of exploiting mobile or
desktop devices’ usage in favor of airlines’ digital brand name through organic, direct, and
referral traffic.
Development of Agent-Based Model
Using regression analysis we exploit the significant results in favor of ABM develop-
ment, for deploying a simulation and prediction model. ABM and regression analysis usage,
assists in information gathering of concerned agents’ behavioral pattern, thus leading to
better understanding of ways to optimize digital marketing strategy, through analyzing
variables’ correlations and event-occurring probabilities. Based on Davis et al. [55] method-
ology, we developed an agent-based model relying on data-driven and decision-making
activities. In this respect, ABM’s implementation in digital marketing can create many
opportunities for digital marketing promotion and strategy planning, such as, in our case,
the prediction of preferred user device (mobile or desktop) in the airline sector.
Type of Data: Information on quantitative data collected by regression and statistical
analysis are incorporated into the AMB. By being represented numerically, they reveal the
relationships between variables that are required for model deployment.
Data measurement repetition: For analysis purpose, we implement one-time snapshot
dataset process to retrieve data concerning definite date range. In this way, we supply the
ABM with real-time web metrics data, something that can be proven to be highly important
for a firm’s digital marketing strategy deployment.
Agents’ involvement: During the last stage, we analyze the steps of applying and
estimating the Agent-Based Model through the gathered data. By implementing the
results of a Fuzzy Cognitive Model, which will provide the connection of the macro-level
modelling, we execute the regression statistics results to every individual agent. Namely,
we do so by referring to the individual-level of ABM, while also introducing the Poisson
probability distribution with lambda values (λ) around mean value of total Potential
Visitors. Implications of Poisson probability function [56] in our research, can lead to:
• More accurate time window determination for optimized execution of the predictive
model (research use of 180 observation days);
• Feasible expression by the constant descriptive statistics of the ten involved airline
websites during the 180 observation days;
• Singularity definition of performance in digital brand name, in terms of organic, direct,
and referral traffic of the selected airline websites.Big Data Cogn. Comput. 2021, 5, 48 14 of 22
In Figure 3, the Agent-Based Model is introduced, aiming to give practical and handful
knowledge regarding the impact of crowdsourcing web traffic to a firm’s gross profit and
the later impact on their web traffic/keywords. Insights of this kind help marketeers to
Big Data Cogn. Comput. 2021, 5, x FOR PEER REVIEW
optimize airline firm’s digital marketing strategy. The calculative ABM deployment15can
of 24
be
observed at the JAVA coding output in Table A1 (see Appendix A).
Figure
Figure 3.
3. Agent-based
Agent-based predictive
predictive model
model development
development for
for the
the potential
potential influence
influence prediction of desktop
prediction of desktop and
and mobile
mobile devices
devices
on airlines’ organic, direct, and referral traffic.
on airlines’ organic, direct, and referral traffic.
The
The model’s
model’s start
start is
is the
the Potential
Potential Visitors
Visitors inin the
the first
first state chart, setting
state chart, setting thethe pace
pace for
for
Agent Based Modelling creation procedure. The analogy of mobile
Agent Based Modelling creation procedure. The analogy of mobile visitors to desktop visitors to desktop vis-
itors is bigger,
visitors so so
is bigger, a larger
a larger part
partofof
Potential
PotentialVisitors
Visitorsend
endup upininthe
theMobile
MobileUsage
Usage state
state chart
chart
and
and aa smaller
smallerpart
partininDesktop
DesktopUsage.Usage.Potential
Potential Visitors
Visitorsfollow
follow thethe
Poisson
Poisson distribution,
distribution,so
Visitors, Unique
so Visitors, Visitors
Unique and Pages
Visitors per Visitors
and Pages of Mobile
per Visitors and Desktop
of Mobile Usage are
and Desktop affected
Usage are
by the allocation
affected rate of the
by the allocation distribution.
rate Due to high
of the distribution. Dueortolowhighlevels
or low of Mobile
levels ofand Desktop
Mobile and
Bounce Rate, a number of visitors using mobile and desktop devices
Desktop Bounce Rate, a number of visitors using mobile and desktop devices leave the leave the website and
affect
website the
andoverall
affectresults.
the overallIn the meantime,
results. with everywith
In the meantime, device’s
everywebsite
device’svisit, an Average
website visit, an
Visit
AverageDuration of mobile
Visit Duration of or desktop
mobile mean is
or desktop calculated.
mean EveryEvery
is calculated. variation in Mobile
variation and
in Mobile
Desktop
and DesktopUsage as well
Usage as as
wellBounce Rate affect
as Bounce Rate Airlines’ Organic,
affect Airlines’ Direct,Direct,
Organic, and Referral Traffic
and Referral
according to the regression’s
Traffic according coefficients
to the regression’s and variables’
coefficients relationships.
and variables’ In thisIn
relationships. model simu-
this model
simulation,
lation, we represent
we represent the path
the path that that Mobile
Mobile andand Desktop
Desktop Users
Users follow
follow to provoke
to provoke change
change in
in airlines’ Organic, Direct, and Referral Traffic. ABM’s procedure
airlines’ Organic, Direct, and Referral Traffic. ABM’s procedure outcome generates outcome generates an
agent population
population allocation
allocation(Figure
(Figure4)4)and
anda atime-graph
time-graph (Figure
(Figure 5) 5)
that display
that displaythethe
variation
varia-
of airlines’
tion Organic,
of airlines’ Direct,
Organic, andand
Direct, Referral Traffic,
Referral caused
Traffic, causedby higher
by higher Mobile
Mobile and Desktop
and Desk-
Usage,
top while
Usage, alsoalso
while giving information
giving informationabout the comparison
about the comparison of device usageusage
of device effecteffect
on their
on
traffictraffic
their sources.
sources.Big Data Cogn. Comput. 2021, 5, 48 15 of 22
Big Data Cogn. Comput. 2021, 5, x FOR PEER REVIEW 16 of 24
(a)
(b)
(c)
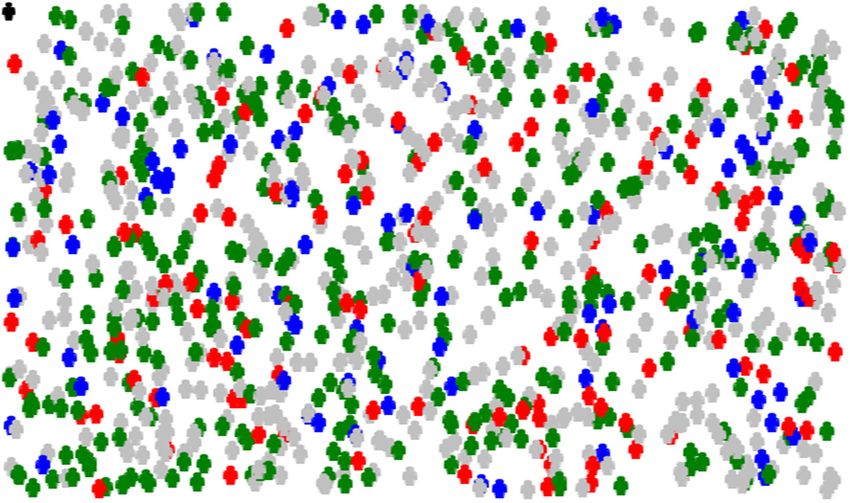
Figure 4. Population distribution in an experiment with 1000 agents. The silver color represents
potential airline visitors, red the analogy of airline mobile device usage, and blue the desktop
usage, with green color showing the analogy of affected direct, referral, and organic traffic (dig-
ital brand name). (a) shows the contribution of desktop usage to airlines’ digital brand name,
(b) the contribution of mobile usage, and (c) the allocation of both devices’ usage and their contribu-
tion to airlines’ digital brand name.In Figure 4, we see the dispersion of 1000 agents in a period of 180 observation-days.
It involves potential airline visitors, mobile and desktop visitors/users and organic, direct
and referral visitors summing the organic, direct, and referral traffic. The model begins
with 100 airlines’ website potential visitors (silver) and those visitors are split to mobile
Big Data Cogn. Comput. 2021, 5, 48 users (red) and desktop users (blue). Then, we get the number of visitors from mobile and
16 of 22
desktop devices ending up in organic, direct, and referral airline traffic, summing up their
digital brand name variable (green).
Figure 5. Depiction of Airline companies’ desktop and mobile usage, impacting their organic, direct, and referral traffic.
Figure 5. Depiction of Airline companies’ desktop and mobile usage, impacting their organic, direct, and referral traffic. On
On the left side, desktop usage is higher than mobile usage, while on the right side, mobile usage is higher.
the left side, desktop usage is higher than mobile usage, while on the right side, mobile usage is higher.
On both vertical
In Figure 4, we seeaxis,
thewe observe of
dispersion the1000
number
agentsofinvisitors
a periodthatof use
180 either device and
observation-days.
end up increasing an airlines’ traffic, while on the horizontal axis we
It involves potential airline visitors, mobile and desktop visitors/users and organic,see those devices
direct
and traffic sources. The simulation date range counts 180 sequential observation
and referral visitors summing the organic, direct, and referral traffic. The model begins days for
the 10 chosen airlines’ websites. From the simulation model, we extract the following
with 100 airlines’ website potential visitors (silver) and those visitors are split to mobile re-
sults.
users Mobile
(red) anddevice usage
desktop attracts
users more
(blue). airline
Then, website
we get visitorsofthan
the number desktop
visitors fromdevices. Di-
mobile and
rect traffic is affected more by mobile usage than desktop usage, while referral
desktop devices ending up in organic, direct, and referral airline traffic, summing up their traffic is
digital brand name variable (green).
On both vertical axis, we observe the number of visitors that use either device and
end up increasing an airlines’ traffic, while on the horizontal axis we see those devices and
traffic sources. The simulation date range counts 180 sequential observation days for the
10 chosen airlines’ websites. From the simulation model, we extract the following results.
Mobile device usage attracts more airline website visitors than desktop devices. Direct
traffic is affected more by mobile usage than desktop usage, while referral traffic is highly
affected by desktop usage rather than mobile usage. Finally, we can also see that an airlines’
organic traffic follows the variation of desktop usage and mobile usage, with mobile usage
appearing to have a bigger impact to organic traffic than desktop usage.
4. Discussion
The purpose of this paper has been the development of a precise methodology, con-
taining pioneering context, aiming to provide useful insights concerning digital marketingYou can also read