Impact Assessment Analysis of Sea Level Rise in Denmark: A Case Study of Falster Island, Guldborgsund
←
→
Page content transcription
If your browser does not render page correctly, please read the page content below
sustainability

Article
Impact Assessment Analysis of Sea Level Rise in Denmark: A
Case Study of Falster Island, Guldborgsund
Alexander Boest-Petersen, Piotr Michalak and Jamal Jokar Arsanjani *

                                          Department of Planning, Geography and Surveying, Aalborg University Copenhagen, A. C. Meyers Vænge 15,
                                          2450 Copenhagen, Denmark; aboest20@student.aau.dk (A.B.-P.); pmicha19@student.aau.dk (P.M.)
                                          * Correspondence: jja@plan.aau.dk

                                          Abstract: Anthropogenically-induced climate change is expected to be the contributing cause of
                                          sea level rise and severe storm events in the immediate future. While Danish authorities have
                                          downscaled the future oscillation of sea level rise across Danish coast lines in order to empower
                                          the coastal municipalities, there is a need to project the local cascading effects on different sectors.
                                          Using geospatial analysis and climate change projection data, we developed a proposed workflow
                                          to analyze the impacts of sea level rise in the coastal municipalities of Guldborgsund, located in
                                          Southeastern Denmark as a case study. With current estimates of sea level rise and storm surge events,
                                          the island of Falster can expect to have up to 19% of its landmass inundated, with approximately 39%
                                          of the population experiencing sea level rise directly. Developing an analytical workflow can allow
                                          stakeholders to understand the extent of expected sea level rise and consider alternative methods of
                                          prevention at the national and local levels. The proposed approach along with the choice of data and
                                          open source tools can empower other communities at risk of sea level rise to plan their adaptation.

                                   Keywords: sea level rise; geographic information systems; climate change; open source software;
Citation: Boest-Petersen, A.;             sustainable development
Michalak, P.; Jokar Arsanjani, J.
Impact Assessment Analysis of Sea
Level Rise in Denmark: A Case Study
of Falster Island, Guldborgsund.          1. Introduction
Sustainability 2021, 13, 7503. https://
                                                Studies have shown that sea level rise (SLR) serves as one of the most extreme climate
doi.org/10.3390/su13137503
                                          change impacts, allowing rising waters to threaten global coastlines and coastal societies.
                                          The need for taking actions against SLR is even more urgent in low-lying regions such
Academic Editor: Andrzej Wał˛ega
                                          as Denmark with over 7000 km of coastline, straddling the North and Baltic Sea. There
                                          are numerous factors that can threaten such a foundation and lead to SLR and flooding,
Received: 10 June 2021
Accepted: 30 June 2021
                                          such as climate change and human activities. In 2018, the Intergovernmental Panel on
Published: 6 July 2021
                                          Climate Change (IPCC) concluded that climate change is accelerated by anthropogenic
                                          means [1]. Greenhouse gas emissions have been rising for over a century, with Carbon
Publisher’s Note: MDPI stays neutral
                                          Dioxide (CO2 ) emissions escalating significantly since the 1950s. A higher concentration
with regard to jurisdictional claims in
                                          of CO2 in the atmosphere has resulted in an increase of the Earth’s average atmospheric
published maps and institutional affil-   temperature. Consequently, new weather and climate phenomena have become observ-
iations.                                  able in the form of more aggressive heat waves, droughts, floods, rising sea levels and
                                          destabilizing ecosystems [1].
                                                According to the IPCC, the global mean SLR is projected to be around 0.1 m lower with
                                          global warming of 1.5 ◦ C compared to 2 ◦ C, by 2100, highlighting the need for immediate
Copyright: © 2021 by the authors.
                                          reduction of greenhouse gas producing activities. The magnitude and rate of SLR depends
Licensee MDPI, Basel, Switzerland.
                                          on the future representative greenhouse gas concentration pathway scenario (RCP) for a
This article is an open access article
                                          particular study area [1]. At the Conference of the Parties in 2015, the 196 member states of
distributed under the terms and           the United Nations Framework Convention on Climate Change signed a legally binding
conditions of the Creative Commons        climate agreement: The Paris Agreement. Countries taking part in this agreement are
Attribution (CC BY) license (https://     obligated to contribute to reducing national greenhouse gas emissions by 40% in 2030
creativecommons.org/licenses/by/          compared to 1990 emission levels with the purpose to limit future temperature rise to
4.0/).                                    1.5 ◦ C instead of the expected 2 ◦ C [2]. Rising temperatures further exacerbates sea levels

Sustainability 2021, 13, 7503. https://doi.org/10.3390/su13137503                                   https://www.mdpi.com/journal/sustainability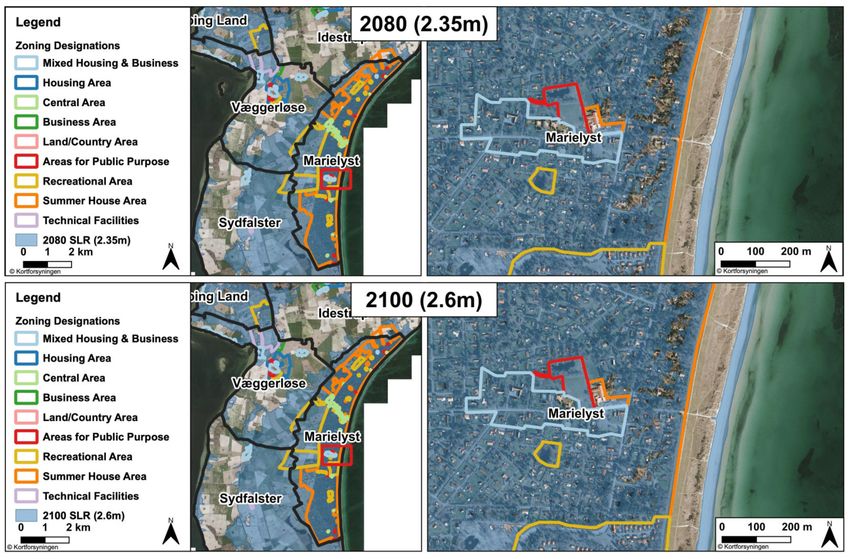
Sustainability 2021, 13, 7503                                                                                          2 of 26

                                as thermal expansion causes water to fill a larger volume and move further inland [3].
                                Temperature increases leads to depletion of ice, glaciers, and other stored water sources,
                                releasing substantial amounts of water to the oceans, and ultimately lead to the risk
                                of flooding. If anthropogenic emissions of CO2 continue at current observable rates,
                                global temperatures will continue to increase, leading to major impacts on human living
                                conditions, many of which to be caused by SLR [1].
                                      The IPCC believes a slower rate of SLR enables greater opportunities for adaptation
                                in the human and ecological system of small islands and low-lying coastal areas [1]. Adap-
                                tation due to SLR is necessary as urbanization has resulted in populations moving closer to
                                water, with overall economic development taking place in coastal regions worldwide. For
                                example, over 30% of Denmark’s tourism revenue originating from coastal-based activities
                                in 2019 [4]. This compression of coastal areas being transformed into urban areas can lead
                                to increased risk of exposure to hazardous natural events, such as coastal erosion, storm
                                surges, coastal inundation, salination of fresh water supplies and so forth. Another impact
                                of urbanization is how surrounding areas of rivers or coastlines have been developed, in-
                                creasing the chances of flooding due to impervious cover. Drains and sewers are funneling
                                runoff water directly to these environments, preventing natural land cover from absorbing
                                water under normal circumstances [5].
                                      A recent study found that municipalities across Denmark are aware that sea levels
                                are rising and that they are likely to have a significant impact on their municipality,
                                but how they are going to be impacted exactly remains unknown [6]. Thus, there is an
                                urgent need for thorough spatial analysis of the down-scaled SLR at a local level within
                                a practical analytical workflow in order to identify the vulnerable areas, population at
                                risk, and business sectors in a given case study. Doing so will allow key stakeholders and
                                local authorities to visualize and understand how they will be affected in various future
                                SLR scenarios.
                                      Hence, the main objective of this study is to illustrate the impacts of future SLR
                                scenarios on an exemplary rich-data case study of Falster, located in the Guldborgsund
                                municipality of Southeastern Denmark as shown in Figure 1. Estimating impacted pop-
                                ulation, land cover types, as well as potential public health and economic impacts can
                                allow stakeholders to more easily and effectively grasp the scale and severity of future SLR
                                for their respective regions. Such analysis can prove critical for the Eastern portion of the
                                municipality as it is a large island that is dependent upon tourism and overnight rentals of
                                summer cottages, many of which reside near coastlines that are prone to the effects of SLR.
                                This study aims at answering the following research question: How can we analyze the
                                publicly available open data in order to gain insights on the extent of SLR for the island of
                                Falster so that the municipality is aware of the impacts of future SLR?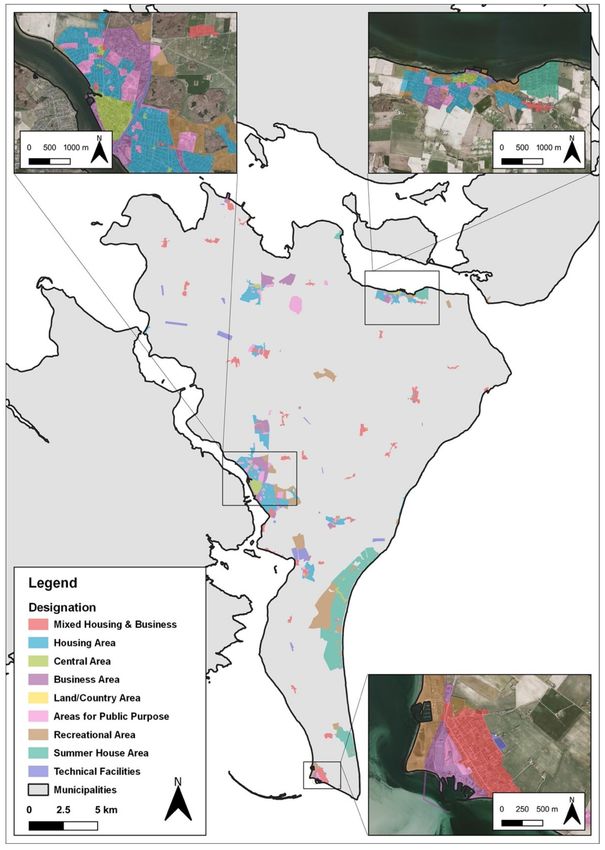
Sustainability 2021, 13, 7503                                                                                           3 of 26

                                Figure 1. Location of the island of Falster and it is local areas.

                                2. Materials and Methods
                                     Climate change and temperature increase due to the emission of greenhouse gases
                                are expected to be the driving forces behind SLR [1]. Official predicted levels for future
                                SLR scenarios for the country of Denmark are produced and provided by the Danish
                                Meteorological Institute (DMI). These estimations are guided by the IPCC’s RCPs for
                                future atmospheric concentrations of greenhouse gas emissions and land use given current
                                trends [1].
                                     To conduct a thorough analysis of the potential impacts of SLR for the island of Falster,
                                a proposed workflow was designed to organize and formulate the steps and data required
                                to conduct such a study as seen in Figure 2. Our proposed workflow incorporates large
                                geospatial datasets combined with future SLR scenarios to derive consumable and action-
                                able statistics to deliver to municipalities, authorities, and other stakeholders. Analysis of
                                potential data sources concluded that Denmark has many rich spatial datasets available for
                                download and consumption by the public.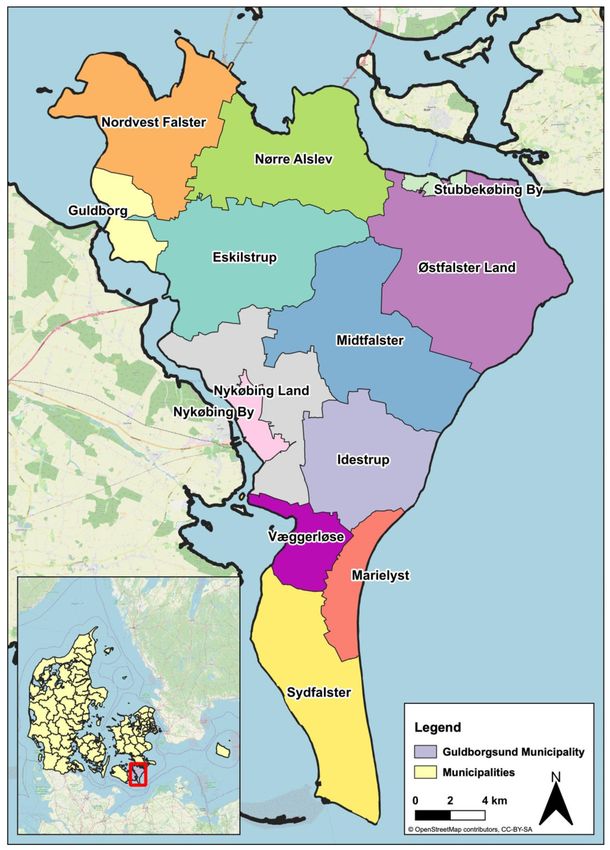
Sustainability 2021, 13, 7503                                                                                             4 of 26

                                Figure 2. Proposed workflow to derive statistics for various SLR scenarios.

                                          First, a general overview of each SLR scenario was conducted, focusing on the number
                                    of structures and parcels of land impacted, length of road network under water, and
                                    area of land flooded. Allowing stakeholders to obtain, at a quick glance, the severity
                                    of SLR. Next, potential shoreline change and movement was calculated for the study
                                    area to highlight areas where erosion of the island’s coastline could further worsen SLR
                                    conditions. Following this step, economic ramifications in the form of estimated property
                                    costs, industries and businesses impacted for each scenario was collected, assigning an
                                    economic value to the spatial event of SLR. Protected areas of land where then analyzed to
                                    determine the scale of protected area loss within the study area of Falster island. Critical
                                    infrastructure, such as waterworks and boreholes, are studied to derive the extent of
                                    inundation of infrastructure that is vital to the public. Land cover types were assessed
                                    highlighting further economic and public health issues that can arise from the loss of
                                    agricultural and urban land cover. Finally, followed by population estimates to highlight
                                    the severity of each event on the regions of the island. Such a comprehensive analysis of
                                    the island allows the opportunity for stakeholders, and the public, to see exactly where and
                                    how SLR can impact themselves and the areas around them. Municipalities and national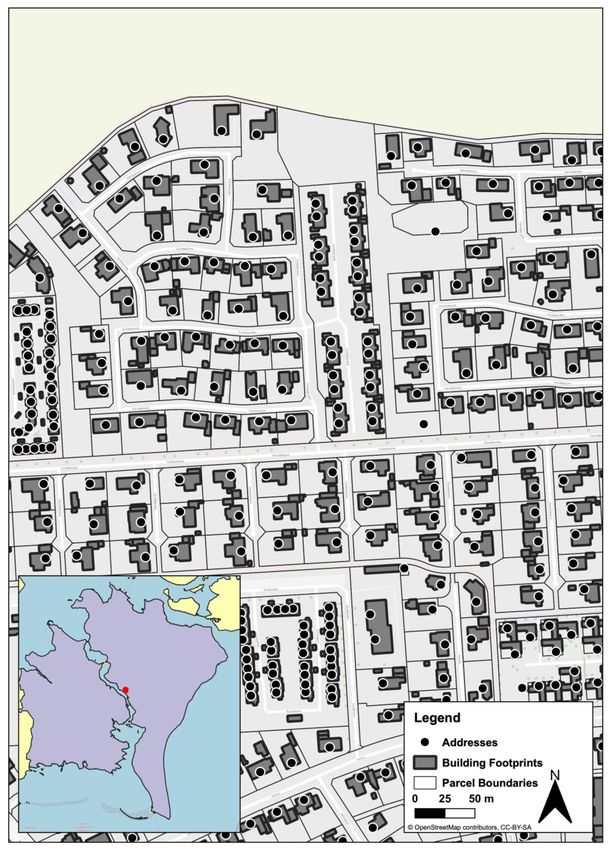
Sustainability 2021, 13, 7503                                                                                                  5 of 26

                                governments can then see which areas are less impacted and study as to why that may be
                                the case in order to combat the issue of SLR in neighboring municipalities.
                                      Visualizations and data creation for potential SLR scenarios in Denmark has been
                                calculated and made available by DMI, as seen in Figure 3, using Denmark’s high resolution
                                digital elevation model (DEM) allowing for robust and detailed modeling of inundated
                                areas in each scenario. Elevation data were collected via LiDAR scanning with an average
                                point density of 4 to 5 points per square meter for all of Denmark resulting in a DEM
                                raster with a spatial resolution of 40 cm per pixel [8]. Pre-processed polygons, in the
                                form of shapefiles (.shp) for each scenario were employed for this study to reduce data
                                processing times and computational workloads. Using pre-processed data allows for quick
                                and efficient implementation of data, where elevation rasters require specialized software
                                in order to visualize and process elevation surfaces. Water level shapefiles accounted
                                for local features, such as dikes and embankments, when calculating area under water.
                                Meaning that if an area behind a dike was at a lower elevation than the water level during
                                a SLR event, it would not be shown as flooded unless the SLR overwhelms the dike, or
                                is widespread enough to circumvent the protective measures and flood the area from
                                alternative avenues. With the Agency for Data Supply and Efficiency’s (SDFE) sea level
                                modeling, an area of land must have access to the sea in order to be flooded, and it does not
                                account for how long it will take for the area to flood [8]. Sea level data are fundamental to
                                this study and used in all subsequent steps to derive impacted figures and statistics. Rapid
                                access to sea level polygons allows for quick implementation and turnaround.

                                Figure 3. The absolute mean water level at Denmark in meters for 1900–2100, in relation to the mean
                                water level in the reference period 1986–2005. The gray shadow for 1900–2012 shows the observed
                                average mean water level by Danish water level gauges, corrected for land uplift. The blue line for
                                2012–2100 shows the IPCC’s best estimate of the mean sea level in the North Sea for the RCP4.5
                                scenario, and the shadow indicates the uncertainty for this scenario. The dotted line indicates the
                                DMI’s estimate of an upper limit for water level rises for use in uncertainty calculations. The right
                                side of the figure shows the mean and uncertainties for the four IPCC scenarios [7]. Figure provided
                                by DMI.

                                     Calculations for shoreline erosion and accretion were performed using the Digital
                                Shoreline Analysis System (DSAS) made available by the United States Geological Survey
                                (USGS) for the island in the form of a freely available plugin for ArcGIS, a subscription-
                                based GIS developed by ESRI (Environmental Systems Research Institute). Conducting
                                End Point Rate (EPR) analysis requires a user to have access to ArcGIS. However, free
                                alternatives are being developed in the form of the EPR4Q tool for QGIS, a free and
                                open-sourced (FOSS) GIS, developed by QGIS users [9].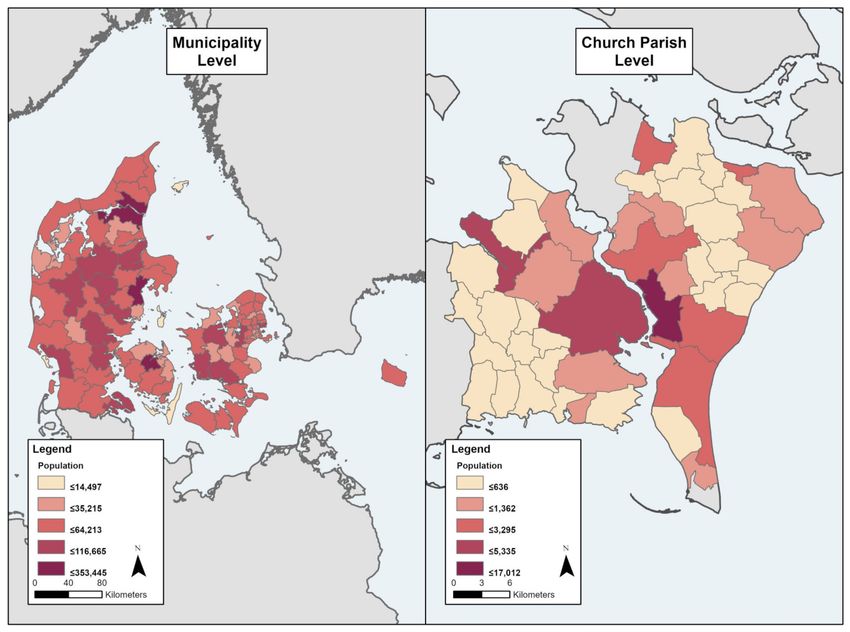
Sustainability 2021, 13, 7503                                                                                            6 of 26

                                      To facilitate rapid deployment and applicability among other potential areas of SLR,
                                OpenStreetMap (OSM) was considered to be an option for obtaining road networks as well
                                as building footprints to determine the frequency of flooded structures in SLR event. To
                                conduct a more rigorous analysis, the European Union (EU) led Infrastructure for Spatial
                                Information in Europe (INSPIRE) program was employed for the purposes of this study. A
                                structure that meets INSPIRE data standards is defined as “constructions above and/or
                                underground which are intended or used for the shelter of humans, animals, things, the
                                production of economic goods or the delivery of services and that refer to any structure
                                permanently constructed or erected on its site” [10]. These footprints are supplied by the
                                Central Register of Buildings and Dwellings (BBR), which is formatted to the INSPIRE
                                data initiative. In the case of Falster island, OSM reported that there are 40,249 structures
                                as of November 2020, compared to the 66,166 structures provided by BBR (with OSM
                                only reporting 61% of footprints reported by BBR). Due to the difference in data richness,
                                BBR structure footprint data were employed for analysis in this study in order to gain
                                better insight as to the severity of SLR and which areas would be vulnerable given the
                                current building density on the island. Polygons representing building footprints were
                                used to determine the number of structures would intersect with SLR data and therefore
                                be impacted in each scenario. These footprints will also have population estimates per
                                footprint spatially joined to them in order to estimate impacted population in later steps.
                                OSM can be a good alternative to official building data as it is continuously updated
                                and easy to access outside of specialized GIS software environments, such as in freely
                                available Python environments. Whereas official data and statistics can be difficult to
                                obtain, slow to update, and unwieldly to manipulate depending on the area and use case.
                                Open source data provides a quick alternative, providing large amounts of data that is
                                otherwise inaccessible or in a specialized format.
                                      OSM can also be beneficial for analyzing potential impact on roadway networks.
                                Using such data would allow the end user to see exactly where and to what extent that
                                their thoroughfare infrastructure would be impacted or lost due to SLR. Due to ease of
                                access of freely available road network line features from SDFE, official road network
                                data were used to calculate transportation network estimates. This was calculated by
                                intersecting road network data with SLR predictions in order to determine a figure. In the
                                case of this study, the impacted road statistics only includes overall road kilometers, not
                                individual lane kilometers, for the island.
                                      Deriving estimated population impacts for an SLR scenario can be challenging de-
                                pending of the end users’ access to controlled data. Due to privacy concerns, detailed
                                population data that is made available to the public is aggregated up to an administrative
                                level of church parishes in Denmark, versus a per structure statistic, a resolution that is too
                                coarse to determine a realistic estimation for impacted population in a dynamic event such
                                as SLR. As such, considerations had to be made when deriving population estimates so
                                that the resulting statistics would provide a meaningful and accessible figure to provide
                                stakeholders and interested parties a representative estimation for their respective areas.
                                      To obtain an estimation concerning the potential number of individuals that could be
                                at risk, tabular data from Statistics Denmark (DST) detailing aggregated population was
                                spatially joined with administrative boundaries from SDFE. Address points from SDFE
                                were then used to determine an average population per address in each region, followed
                                by using these detailed address points to locate primary structures and assign a population
                                per inhabited structure for each administrative area to determine which, and how many,
                                structures and individuals were at risk in a SLR event. An individual was defined to be at
                                risk if their structure (building footprint), or any part of their structure, had been overcome
                                by the rising sea level.
                                      Address data were downloaded from SDFE in the form of points. The points lay
                                inside of the building footprint that they were assigned to and thus were used to determine
                                inhabited residential structures on the island to determine population estimates. If address
                                points had not been used to determine the “primary” structure of the parcel, the average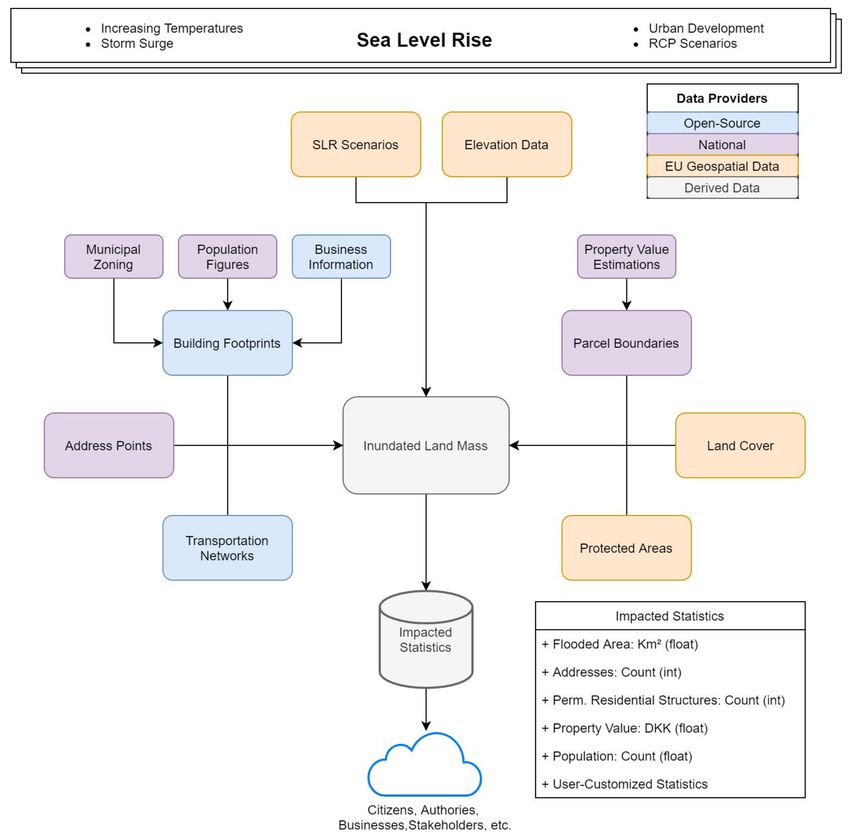
Sustainability 2021, 13, 7503                                                                                               7 of 26

                                population of an area would be skewed too high due to the abundance of structures (sheds,
                                garages, etc.). Using address points allows one to narrow down which structures to focus
                                on in the case of an SLR event. To put this into perspective, there were 93,234 building
                                footprints located in Guldborgsund Municipality, while there are only 40,546 registered
                                address points for the same area as of November 2020.
                                      Building data often contained multiple structures per parcel, as can be seen in Figure 4,
                                increasing difficulty when assigning an average population figure per structure as with
                                multiple structures located on a single property parcel would overestimate the number of
                                individuals per household that are impacted in an SLR scenario. To overcome this issue,
                                address points were used to assign population figures to a building footprint as it was
                                assumed that each single family residential parcel would only have one address point even
                                if the parcel contained multiple structures. These primary structures were then placed
                                in a new dataset to be used for population predictions. Extraneous structures did not
                                have a population assigned to them as to not negatively impact population predictions.
                                Combining building footprints data with address points to aid with population predictions
                                allows for a more representative statistic, as not all address points have a structure (parks,
                                fields, etc.) and not all building footprints have people residing within them.

                                Figure 4. Map of parcels on Falster, Denmark. Many residential parcels contain multiple structures
                                (sheds, garages, etc.) per address point.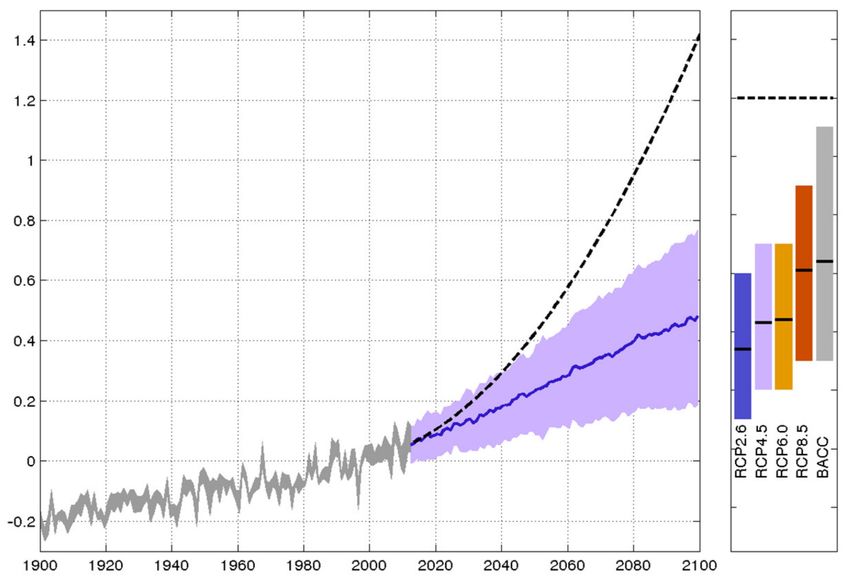
Sustainability 2021, 13, 7503                                                                                                   8 of 26

                                       The most granular official population data that is made available and readily acces-
                                  sible for public consumption in Denmark is aggregated up to the level of a “sogne”, or
                                  church parish as seen in Figure 5. In a church parish, tabular statistics are reported as the
                                  population registered and population not registered to the area’s church. These figures
                                  were used as the steppingstone to derive building population statistics. Church parish
                                  shapefiles were obtained from SDFE and population tables were provided by DST using
                                  the ‘SOGN10—Population by Parish’ table [11]. This table was then spatially joined to
                                  their corresponding parish polygons to be used in assigned population per address point
                                  later on. Data in such a coarse resolution would not allow for the accurate calculation of
                                  potential impacted population. However, in the case of our study, being able to obtain
                                  more granular data allows the stakeholders to visualize how their respective areas will be
                                  impacted, and the formulation and design of more focused measures to counteract and
                                  combat the effects of SLR.

      Figure 5. Comparison of the granularity of population datasets provided from DST. The figure on the left shows population
      of municipalities across Denmark. The figure on the right shows the population reported at the church parish level that was
      used for impacted population calculations.

                                       It is important to note that the estimated population is based on current data (as of
                                  November 2020) and not future projections. Future projections are available in coarse
                                  (1 km) resolution raster datasets and are therefore not suitable for detailed population
                                  estimates. Current data were used due to the granularity of available datasets.
                                       Planning data are download via SDFE in the form of polygons stored in a shapefile.
                                  Such plans are made by each municipality to designate which areas of land are allowed to
                                  have certain types of structures or land uses associated with them, such as residential or
                                  industrial, for example. This dataset is labeled as “Kommuneplanrammer alle Vedtaget”, or
                                  Municipal Planning Framework, has been adopted by the municipality as seen in Figure 6.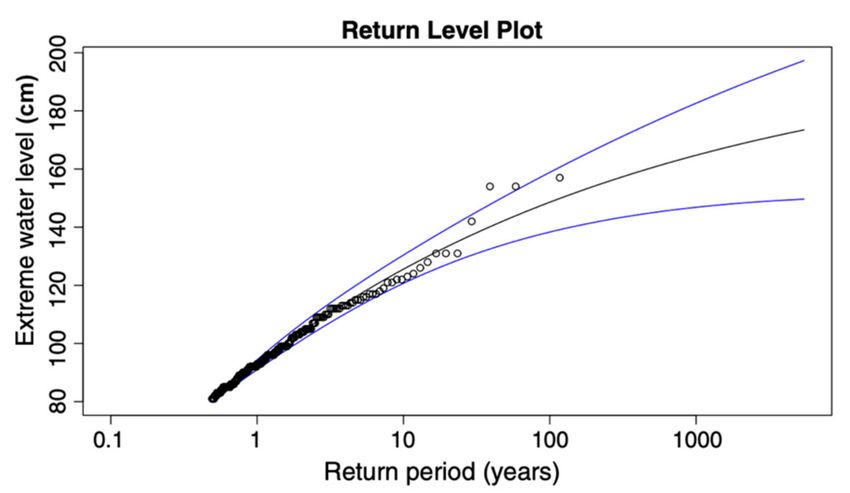
Sustainability 2021, 13, 7503                                                                                               9 of 26

              Figure 6. Municipal zoning designations on Falster used in deriving population estimates for SLR scenarios.

                                       This municipal framework details areas (represented as polygons within a shapefile)
                                  of the island, and what their intended and current purpose is in regards to land use that
                                  relate to national planning directives [12]. This data were used in order to determine
                                  which buildings and address points intersected with planning areas that were deemed as
                                  non-residential uses. Zoning areas that were designated as business areas, areas for public
                                  purposes, technical facilities, runways, basins, graveyards, and recreational areas were
Sustainability 2021, 13, 7503 10 of 26
assumed to be daytime structures and therefore structures that were located within these
areas were not included in population estimates. This is critical in the process of estimating
impacted population so that address and buildings that are not residential do not have an
estimated population value assigned to them which would result in unreliable estimates for
the island. Current municipal framework and zoning data were used for this study. Future
zoning can be incorporated into such an analysis to provide a more accurate estimation of
future SLR impacts. However, such dynamic data can easily complicate predictions and
make analysis troublesome compared to using current data.
The Guldborgsund municipal framework also details areas of residential usage into
types of residential usage; specifically, whether it is a summer cottage region or not. Such
classification can allow us to identify the types of structures in a region, and therefore
determine which industries may be hit hardest during an SLR event. On Falster, this can
prove to be crucial as much of the economy income is dependent upon tourism with 714,000
overnight stays on the island, accounting for 40% of the region of Zealand’s overnight stays,
for 2019 [13]. Being informed of how many summer cottages that may be wiped-out or
impacted by rising sea water will provide stakeholders with an idea of how their island’s
economy, and thus the residents and infrastructure, will be affected in such a scenario.
Being able to delineate land use areas, and structure types is critical to inform what is at
stake in the area.
With residential addresses located, these points were further reduced into two groups;
Permanent Residential and Non-Permanent Residential. Permanent residential structures
are structures where individuals reside on a full-time basis. These address points were
located in zoning areas labeled as; residential areas, nursing homes, villages, or city centers,
with their associated building footprint falling into the same scheme. There is room for
error to be introduced into estimations as villages and city centers do not consist solely of
residential address points, but were not excluded as they do contain residential structures.
Non-Permanent areas were located in zoning regions defined as summer cottage areas as
mentioned above. With estimations broken down into these two categories, stakeholders
will have a better image of the at-risk populations and the potential long-term impacts
such as the economic repercussions of the loss or reduction of a key industry and its
ancillary services.
In many cases, there were also structures that contained multiple address points
per building footprint, such as apartment buildings that have multiple families within
one footprint. Building footprints were defined as the extent of the building based on
their outer walls, provided in the form of polygons from BBR. To compensate for this, an
average population was derived for each address point within a parish and then assigning
the sum of the population points to their respective building footprint. Deriving an
average population from building footprints alone would lead to apartment buildings
being underrepresented if they were impacted in an SLR scenario. The process of deriving
population estimates can be seen in Figure 7.
When using the entire building polygon instead of relying solely upon an address
point, this ensures that properties that are expected to be impacted are included as their
real-world areal footprint is taken into consideration in this spatial event. Address points
only represent a single point of such a structure, and therefore are potentially excluding
many properties that lie along the edge of SLR scenario areas and do not come into contact
with rising waters. The added detail of building polygons is critical when predicting the
impact of SLR as well as including the potential population that is at risk of each scenario
and informing stakeholders of the potential outcomes and significance of future SLR events.Sustainability 2021, 13, 7503 11 of 26
Figure 7. Flowchart for deriving population per structure estimates.Sustainability 2021, 13, 7503 12 of 26
Parcels, or “jordstykke” as referred to in the Danish cadastral system, were provided
by SDFE in the form of polygons for the entire nation. Parcels in this study are defined as a
piece of land with an associated residence, or a farm with its associated fields, or a woodland
property [14]. These plots were used to determine estimated costs of property loss in the
cases of SLR when an average property value for the municipality was applied to the plots.
Plots are measured in three different ways with varying levels of spatial accuracy when
representing their respective areas in relation to the real world. Boundaries are measured
by map, as in conducting areal measurements derived from historical records and data, or
georeferencing; whenever construction occurs, a change in property boundaries triggers a
need to measure boundaries; or by a requested survey; a property owner wants to confirm
their property size for resale or tax purposes [15]. Due to the historic nature of some parcels,
particularly within city centers, there is some error introduced when measuring area of
parcels. This has the potential to affect spatial analysis and alter the statistics generated
from such analysis.
Property value estimations are provided by DST in the form of tabular data rep-
resenting the average market value of real estate in each municipality for each year in the
“EJDFOE1” dataset [16]. This average is then spatially joined to property parcels so that
they have a spatial representation. The number of parcels that intersected with each SLR
scenario shapefile then provides us with an estimated value of property loss due to rising
water levels based on the average price for the municipality.
Land cover data were downloaded in raster format from the Sentinel-2 Global Land
Cover (S2GLC) project at a resolution of 10 m, with 13 land cover classes that are automati-
cally derived for Denmark with an accuracy of 94% when compared with ground sampling
data [17]. Access to high quality ground cover data for the entire continent of Europe aids
in processing times, as well as providing accurate and detailed statistics for large areas
within the scope of such datasets, allowing end users and stakeholders to disseminate the
impacts of SLR on the land around them, and in their regions of interest.
Four different years were taken into consideration when conducting SLR analysis for
the island of Falster; 2020, 2050, 2080, and 2100, with their respective water levels seen in
Table 1. In the case of shoreline change, water level increase due to storm surges was not
included as they were considered discontinuous events. Sea levels can also be impacted
by tidal events; however, these were not considered for this study due to their dynamic
nature. In the case of this study, the most extreme 100 year storm surge event of 1.4 m [7]
was taken into account when calculating potential impacts. Even though such a storm
surge is a rare event (1% chance of a storm of this magnitude occurring each year), it must
considered when planning for extreme events, with the severity and likelihood of storms
increasing with rising atmospheric and water temperatures [18].
Table 1. SLR and Storm Surge scenarios for the island of Falster.
Year SLR (m) SLR with Storm Surge (m)
2020 0.15 1.55
2050 0.5 1.9
2080 0.95 2.35
2100 1.2 2.6
For the purpose of this study, the four years were chosen at intervals to visualize the
impacts at regular intervals in the future. However, storm surge data from more regular
occurrences (as seen in Figure 8) can be easily incorporated into this analytical workflow to
quantify such occurrences.Sustainability 2021, 13, 7503 13 of 26
Figure 8. Projections for potential storm surge events (cm) for Danish coastlines from
Hallegate et al. [19].
The growth of open-sourced geospatial platforms, such as OSM, and the increase
of data availability that these platforms provide can allow regions to supplement their
analysis further with more information available in their area to reinforce the consequences
of SLR. Users of OSM have the ability to report the location and address of local businesses
that they frequent. Whereas official data for building footprints, or address points, can lack
such attribution. To provide a general idea of the impacts of SLR on traditional brick and
mortar businesses, OSM was used to determine the location of businesses for the island.
Business data were accessed via OSMnx, a Python library that allows users to down-
load data from OpenStreetMap to model, project, visualize, and analyze real-world street
networks [20]. Building footprint data were downloaded in tabular form and stored as a
GeoPandas dataframe, where footprints that had an attributed name, where deemed to be
businesses. The overlay tool made available from the GeoPandas library in Python was
used to locate which of these footprints intersected with the various SLR scenarios in a
Python environment, negating the need to transfer data to a separate GIS environment to
manually process data. GeoPandas extends the datatypes used by pandas to allow spatial
operations on geometric types.
3. Results
Providing a general idea of which type of infrastructure, as well as the scale of
the impact, is critical to easily and efficiently convey estimates of potential impacts to
stakeholders. Not only are individuals at risk of losing personal property, but public
infrastructure such as roads, paths, and parks will be impacted as well. The impacts of SLR
on various aspects of infrastructure can be seen in Table 2.
Table 2. Estimated impacted area, parcels, structures, and infrastructure on Falster for various future
SLR scenarios.
SLR Scenario Structures Parcels Road (km) Area (km2 )
2.6 m (2100) 20,377 (31%) 12,527 (39%) 430 (26%) 99 (19%)
2.35 m (2080) 19,571 (20%) 12,170 (38%) 403 (24%) 91 (18%)
1.9 m (2050) 1622 (3%) 2131 (7%) 99 (6%) 28 (6%)
1.55 m (2020) 837 (1%) 1574 (5%) 56 (3%) 21 (4%)
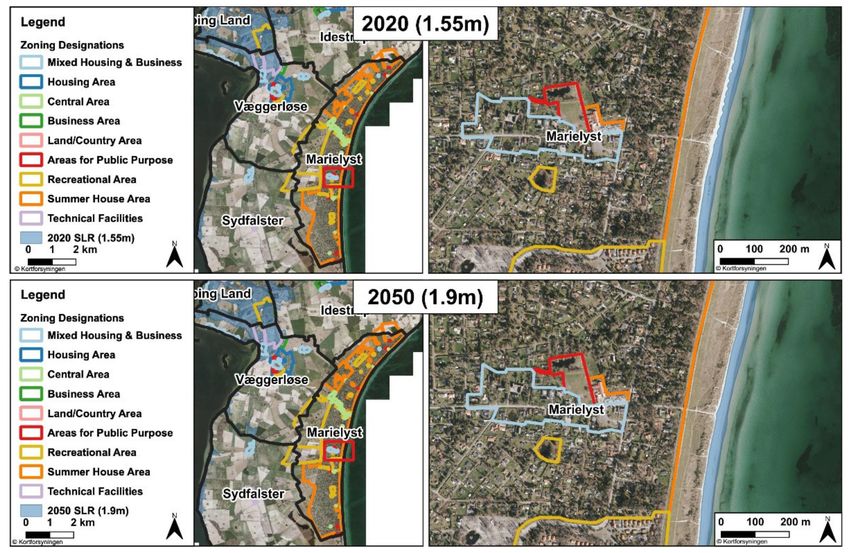
As seen in Figures 9 and 10, the areas of the island that are dependent on tourism are
expected to be severely impacted in SLR scenarios. An estimated 98.6% of the structures
in the region are expected to be flooded in a 2100 scenario with 99% of the road network
being inundated as well.Sustainability 2021, 13, 7503 14 of 26
Figure 9. Projections for the Marielyst area for 2020 and 2050 scenarios.
Figure 10. Projections for the Marielyst area for 2080 and 2100 scenarios.
3.1. Shoreline Change
When calculating shoreline change, EPR and Total Shoreline Change were examined
for Falster. EPR was calculated by dividing distance of shoreline movement by time elapsedSustainability 2021, 13, 7503 15 of 26
between the oldest and most recent shorelines. Rate is reported in meters per year, with
positive values indicating accretion and negative values indicating erosion.
The total number of transects created around Falster was 829, with general statistics
such as; EPR, Shoreline Change Envelope, Net Shoreline Movement, Linear Regression
Rate, and Weighted Linear Regression being calculated for each transect. In regard to EPR
results, there were seven transects that showed no shoreline change. Erosion was observed
in 766 transects, and accretion in 56. Therefore, as can be seen in Figure 11, shoreline change
is characterized predominantly by erosion over the extent of the study area. The maximum
erosion transect was recorded to be 31.09 m per year, with the average erosion rate being
measured at 1.83 m/yr.
Figure 11. End Point Rate analysis for the island of Falster.
Although coastal areas only account for approximately 5% of the total landmass, they
play a crucial role as they are home to one-third of the world’s population [21]. Referring
to our particular case, DSAS analysis of Falster shows that SLR is expected to have a
significant impact on coastal areas resulting due to predicted coastal erosion.
3.2. Economic Ramifications
Table 3 highlights the potential valuation for lost or impacted parcels for the four SLR
scenarios, with Figure 12 visualizing the impacts on local areas in a severe scenario. SLRSustainability 2021, 13, 7503 16 of 26
can be extremely damaging as it not only floods an area, but it has the potential to consume
an area, where land is no longer available to the public, or no longer viable to reside on.
Table 3. Estimated number of impacted parcels and the estimated property value impact for Falster.
SLR Scenario Parcels Impacted Estimated Costs (DKK)
2.6 m (2100) 12,517 15,607,610,021
2.35 m (2080) 12,170 15,174,931,210
1.9 m (2050) 2131 2,657,171,603
1.55 m (2020) 1574 1,962,641,062
Figure 12. Impacts of a 2.6 m event on Falster: (a) Estimated property value lost. (b) Estimated impacted structures.
An additional economic impact is the loss of businesses that will likely require reloca-
tion if SLR is not managed in a timely manner. Figure 13 highlights regions of businesses
that impacted during the four SLR scenarios. While data on the value of such businesses is
not publicly available, these institutions are critical to the population and local economy.
Businesses such as grocery stores, pharmacies, and other essential institutions are at risk in
these scenarios.
Denmark has over 7000 km of coastline, with coastal and maritime tourism accounting
for 37% of the nation’s total tourism revenue [4]. With such local institutions and services
at risk, the ability of a region to support its inhabitants drops drastically, potentially leading
to a drop in quality of life for an area. Immediate loss of businesses and services will
mean that citizens will have access to less resources immediately following a SLR event.
However, loss of land due to SLR or retreating areas, can have lasting impacts for a region
and its ability to provide a comprehensive source of goods and services need to adequately
support the region and its inhabitants. Shifting populations due to SLR at a regular interval
is troublesome when supporting businesses as well. If SLR is not managed appropriately,
populations and all of their required infrastructure, public and private, will consistently be
uprooted to cope with the loss of land, further hindering an area and its citizens to lower
standards of living.Sustainability 2021, 13, 7503 17 of 26
Figure 13. Impacted businesses using OSM data.
Natural disasters, and specifically SLR, have the ability to severely threaten, if not
eradicate local businesses. In the case of SLR, the labor inputs will drop drastically as
employees are displaced, employee mobility will drop with the loss of a transportation
network when roads and railways are flooded, and suppliers will not be able to provide
the goods needed for businesses to operate [22].
With over 900 registered active rental locations in the Guldborgsund municipality,
overnight rentals of summer cottages on the island provides significant income to the
local economy [23]. Many of these overnight rentals are located in the SLR prone region
of Marielyst as visualized in Figure 10. The loss of such rentals will have a significant
economic impact on the region as tourist will no longer have the facilities to travel to
the region.
Analyzing impacted businesses is also inherently difficult as some buildings share use
types between residential and small businesses. With a two-dimensional (2D) approach, as
employed in this study, it is easy to incorrectly classify buildings as solely residential or
solely business, when in reality, the three-dimensional (3D) nature of land use must be takenSustainability 2021, 13, 7503 18 of 26
into consideration to account for multiple use types per structure. This can be analyzed
with more data regarding structure use type in order to gain a more comprehensive
understanding of the potential economic impacts on local businesses, as well as gaining
a better understanding of the potential impacted population estimate. For the purpose
of this study, a general overview was obtained to provide an idea of what could happen
in the scenarios chosen. Tourism, a large source of income for the island, will be severely
impacted in severe SLR events. The permanent loss of land will require relocation, a costly
endeavor, or moving away from the island completely.
3.3. Protected Areas
Protected areas are vital to a region in numerous ways. They provide sanctuaries for
endangered species of plants and animals, areas for the public to enjoy and unwind, as
well as controlling growth of man-made regions that is critical in combating climate change
and controlling the consumption of precious resources. With SLR, many of these areas are
at risk of being damaged or lost.
Natura2000 designated sites are areas of land where man-made development is re-
stricted, primarily to allow for the networking and breeding of rare and endangered bird
species across continental Europe [24]. Losing such areas to rising water levels could
prove disastrous for many endangered species which frequent these areas and are already
experiencing the pressures of habitat loss due to urban development. As seen in Table 4,
there is significant pressure being placed on protected sites due to rising water levels.
Table 4. Impacted protected areas on Falster for future SLR scenarios.
Protected Sites Natura2000 Wetland Sites Nature & Wild Sites
SLR Scenario
(km2 ) Sites (km2 ) (km2 ) (km2 )
2.6 m (2100) 2.07 39.8 20.5 0.04
2.35 m (2080) 2.05 39.3 20.2 0.04
1.9 m (2050) 0.26 7.27 4 0.04
1.55 m (2020) 0.24 6.05 3.04 0.04
3.4. Waterworks and Boreholes
Of all municipal services, water supply is perhaps one of the most essential. Water-
works are not only vital for residential services, but also for industries and commercial
activities. In regard to the island of Falster, it is critical to analyze which waterworks and
boreholes are going to be flooded.
There are a total of 251 waterworks and 1841 boreholes in Falster according to the
Geological Survey of Denmark and Greenland (GEUS). As can be observed in Table 5,
approximately 18% of boreholes are going to be inundated in the 2100 scenario. Visualizing
where these pieces of infrastructure are located can visualize to stakeholders what and
where is at risk.
Table 5. Impacted water and borehole infrastructure for Falster.
SLR Scenario Waterworks Boreholes
2.6 m (2100) 6 (2.4%) 339 (18.4%)
2.35 m (2080) 6 (2.4%) 309 (16.8%)
1.9 m (2050) 1 (0.4%) 103 (5.6%)
1.55 m (2020) 1 (0.4%) 70 (3.8%)
The United Nations (UN) 6th Social Development Goal (SDG) lays out the need for
clean and sanitary water supplies for all by 2030 [25]. With the current predictions for
SLR, this goal will not be obtainable with the current planning methods and building
scenarios as seen in Table 5 and Figure 14. Vast areas of land will lose vital infrastructure
that provides clean water to the population. Losing such infrastructure can be extremelySustainability 2021, 13, 7503 19 of 26
damaging in the long term as areas will no longer be suitable for people to live, therefore
relegating the area to a substandard quality of living and economic productivity, creating a
marginalized area. Currently, floods and other water-related natural disasters account for
70% of deaths that stem from natural disasters [26]. National and municipal governments
must begin taking measures to plan and prevent against SLR.
Figure 14. Impacted waterworks and boreholes for the island of Falster in a 2.6 m SLR scenario.
3.5. Land Uses
Large losses of cultivated areas, as seen in Table 6, can have severe economic and
ecological impacts. Flooding of crops need not be permanent to render the yield of the
flooded area unsatisfactory to be sold or traded, damaging the livelihood of that individual
and the local economy. Less physical land allows for less productivity, thus decreasing the
economic productivity of the region. Inundation of cultivated lands by sea water also has
the potential of releasing previously stored toxins, such as fertilizers, into the water, making
them much more portable into neighboring areas or local water supplies. Such a scenario
could severely impact the health of a region, furthering the economic impacts of SLR.Sustainability 2021, 13, 7503 20 of 26
Table 6. Land cover loss for each SLR scenario. Land cover derived from Sentinel-2 imagery. Loss represented as area in
square kilometers and percentage of area lost of that land cover type for the island of Falster.
SLR & Storm
Impacted Land Use Type
Surge Scenario
Artificial Surfaces & Broadleaf Tree Coniferous Tree Herbaceous
Cultivated Areas
Water Lever Construction Cover Cover Vegetation
Year
Increase (m)
km2 % km2 % km2 % km2 % km2 %
2.6 m 2100 2.4 12.1 6.9 13.8 5.4 55.7 47.6 14.4 24.3 32.4
2.35 m 2080 2.2 10.8 5.7 11.4 5.3 33.9 44.3 13.3 22.5 30
1.9 m 2050 0.7 3.5 2.0 3.9 0.2 1.6 12 3.6 6.9 9.2
1.55 m 2020 0.4 2 1.3 2.7 0.1 1.3 8.1 2.4 5.6 7.5
Such health hazards have already been noted on a local scale in the area. Pesticides
and weed killers are commonly used in private households, but more commonly in
agricultural areas to promote crop growth. In the Baltic Sea, glyphosate a common weed
killer, has been detected in measurable levels [27]. With such toxins made available in
water supplies impedes progress toward SDG number 6, clean and sanitary water for all.
Losing large areas of cultivated lands has severe implications and consequences for the
surrounding areas, both economically and in regards to public health of the immediate
area and its neighbors.
Artificial land cover loss highlights the impact that SLR will have on the urban areas
of the island. Such loss of land is reflected in the estimated population and number of
structures impacted by such events. Artificial land cover also has the potential to exacerbate
the issues of water levels due to the amount of impervious cover prevalent in such areas.
Loss of natural areas can also be seen in Table 4, with the loss of protected areas, which
could contribute to urban crowding as displaced populations are forced to relocate, occupy-
ing areas that would otherwise be used for the production of goods, such as cultivated areas.
However, these areas could be closely studied for mitigation strategies. As these areas were
previously occupied by natural land cover, in a SLR event, people and artificial land cover
would not be impacted, instead, natural tendencies would take control of the adaptation
process. In other areas of the world, such as San Francisco, protected marshlands and
natural areas have been allowed to flourish, or redeemed from artificial development, and
employing “local adaptations” of these natural areas to successfully combat SLR in an area
that is highly vulnerable to rising sea levels [28]. Such local adaptations, using natural areas
to combat SLR, can provide municipal governments with data and methods to re-purpose
land from private land holders, and convert such areas to mitigate or combat SLR.
Monitoring what type of ecosystem and land cover was prevalent before an SLR event
can provide insight as to how nature will react to such an event. Continued observance of
these areas can provide critical data to highlight which natural strategies will prove most
effective based on their environment and circumstances.
For the purpose of this study, current land cover data was employed for land cover loss
predictions as seen in Tables 6 and 7. Such data is freely available for the entire continent of
Europe at high resolution and accuracy, allowing for rapid and accurate assessments of the
potential impacts of SLR. For further information of the potential risks, future predictions
of land cover change can be included in such a workflow in order to estimate the impacts
of future SLR events on future land cover types for a given area.Sustainability 2021, 13, 7503 21 of 26
Table 7. Land cover loss for each SLR scenario. Land cover derived from Sentinel-2 imagery. Loss represented as area in
square kilometers and percentage of area lost of that land cover type for the island of Falster.
SLR & Storm
Impacted Land Use Type
Surge Scenario
Natural Materials
Marshes Moors & Heathland Peatbogs Water Bodies
Water Lever Surfaces
Year
Increase (m)
km2 % km2 % km2 % km2 % km2 %
2.6 m 2100 6.4 62 1.32 49.3 0.34 43.4 3.4 27.8 0.5 46.1
2.35 m 2080 6.1 58.9 1.28 47.7 0.33 41.4 3.1 25.9 0.4 42.4
1.9 m 2050 3.2 31.1 0.43 15.9 0.27 34.4 2.2 17.9 0.35 35.3
1.55 m 2020 2.8 27.5 0.36 13.5 0.22 27.7 1.9 16. 0.28 28.6
3.6. Local Areas
Visualizing impacted local areas is essential for future municipal planning. Pro-viding
flooding statistics plays a key role when governing at a local administrative level.
As can be seen in Figure 15, Marielyst is expected to be significantly impacted with
88.4% of its land mass covered with water in a 2100 scenario. This is critical as most
of the summer cottages in Falster are located along the coast of Marielyst. Much of the
Marielyst coastline currently lies behind a dike. However as seen in our analysis, in certain
situations, this physical barrier can be overwhelmed at various points along its span, as
well as accessing land behind the dike from further down the coast, reinforcing the need for
a more comprehensive and holistic approach to combating SLR, instead of the fragmented
approach currently being employed.
Figure 15. Estimated inundated land mass (percentage of area) for local areas in Falster for various SLR scenarios.
3.7. Population
Representing impacted population can allow end users and stakeholders to gain
perspective of future SLR within their community. For the purpose of this study, popula-
tion estimates have been derived based on macro-scale reporting of general population
statistics of a region based on current population and building footprint data. For a more
thorough understanding of potential population impacts, future population and housing
development projections can be incorporated into such an analysis.Sustainability 2021, 13, 7503 22 of 26
It can be clearly seen in Tables 8 and 9 that SLR has the potential to impact a significant
portion of the population on Falster island that reside in coastal areas. Impacted population
has been broken down into two groups, permanent residential and non-permanent resi-
dential populations as seen in Table 10. This was done as a large number of structures on
the island lie within summer cottage areas. Such structures are not permanently occupied
and therefore should be differentiated.
Table 8. Impacted addresses and estimated population. Estimates are calculated from current
population, addresses, and building footprint statistics.
SLR Scenario Addresses Population
2.6 m (2100) 8731 (36%) 8802 (16%)
2.35 m (2080) 8408 (35%) 8176 (15%)
1.9 m (2050) 714 (3%) 2082 (4%)
1.55 m (2020) 360 (1.5%) 1177 (2%)
Table 9. Population impact by local areas for a 2.6 m scenario. Estimates are calculated from current
population, addresses, and building footprint statistics.
Local Areas Impacted Population
Marielyst 4035
Nykøbing By 2103
Sydfalster 1088
Nykøbing Land 571
Stubbekøbing By 377
Nordvest Falster 236
Nørre Alslev 97
Guldborg 96
Væggerløse 87
Eskilstrup 67
Østerfalster Land 27
Idestrup 18
Midtfalster 0
Table 10. Population Breakdown.
SLR Scenario Permanent Non-Permanent
2.6 m (2100) 4336 4465
2.35 m (2080) 3776 4400
1.9 m (2050) 2005 77
1.55 m (2020) 1177 0
We wish to reiterate that the purpose of this study and these statistics is not to provide
an exact number of individuals that are going to be affected, or impacted, in a region due
to future SLR.
4. Discussions and Conclusions
With spatial planning being decentralized in Denmark and local municipalities devel-
oping regional plans based on their individual needs in accordance to the planning act [29],
national level considerations should be employed to ensure a comprehensive approach
to mitigating future SLR. Land management helps to address many of the challenges that
are present when working with climate change adaptation planning. Flood and land use
modeling can aid in policy formulation to control urban development as well as enforcing
beneficial land use practices in areas prone to SLR as noted on Falster island [30]. Such
studies were conducted in other areas of Denmark, employing multi-criteria analysis of
future land use simulation in order to identify areas which are potentially vulnerable toSustainability 2021, 13, 7503 23 of 26
future climate change and SLR, highlighting the potential for wide scale implementation
of such techniques [31]. Climate adaptation as the result of SLR is a critical issue that
can be observed presently across the globe. However, the approach to solve SLR should
be more holistic and strategic, rather than a traditional approach with more obtrusive
solutions such as seawalls. Including more sectors of the economy and stakeholders of
the surrounding region can lead to a more integrated solution to the problem, instead of
localized temporary remedies.
Even with the EU Flood Directive being implemented in 2007, many Danish mu-
nicipalities lack explicit objectives on how to go about accomplishing this goal [32]. In
January 2018, Danish lawmakers agreed on regulating the Planning Act to prevent damage
caused by flooding and erosion, providing municipalities with the legal framework to
begin combating SLR. However, implementation of adaptations is still hindered by lack
of coordination at the municipal level [33]. When conducting geospatial analysis on this
study area, several regions of Falster are critically exposed to future SLR. Perhaps, the
biggest challenge is to provide a comprehensive and detailed analysis of which areas are
impacted, and how severely.
Guldborgsund is already aware of the their SLR problem, but they are unsure what
to expect in regard to their local areas within the island. It was determined that this was
largely due to a lack of geospatial analysis of available data that this study aims to alleviate
to some extent. Traditionally, in Denmark, coastal protection has been fragmented as
the responsibilities typically fall to privately managed local dike boards. These privately
managed institutions are concerned with their administrative regions, as well as issues of
financing such costly endeavors, leaving the problem of SLR in the hands of the public [34].
However, as noted throughout this study, SLR is not a local problem, but a national one. A
unified and holistic approach is required to tackle such a mounting problem effectively
and in a sustainable manner. Dikes across the country are likely failing to take into account
the inhabitants, increases in tidal amplitude, mean water levels, storminess, and increasing
surges that are being experienced in Denmark [5].
The analytical workflow developed in this study can be adapted to a Python environ-
ment with minimal data collection and pre-processing to allow for easy statistical analysis
of other areas of Denmark, allowing other coastal municipalities to determine the extent
and severity of sea level rise for their area. With the rise of open-sourced data, and global
datasets for land cover and elevation, such a study can also be implemented for other areas
of the world experiencing, or preparing for, SLR with similar results.
There are numerous methods of tackling SLR, with two pertinent strategies being hard
engineering and soft engineering. Hard engineering largely consists of man-made “gray”
structures designed to absorb energy and prevent coastal erosion, often times resulting
in detrimental effects further down the coastline. Man-made dikes are largely used, and
recommended in the Copenhagen Adaptation Plan [35], in order to protected the capital
city of Copenhagen, Denmark from experiencing flooding from a storm surge or SLR.
Such temporary solutions can often prove detrimental to surrounding developments and
natural areas.
Soft, or “green”, engineering strategies rely upon natural strategies to combat coastal
erosion and SLR. Wetland restoration can play a vital role in lowering future greenhouse
emissions as natural areas can act as carbon stores while forming a natural area to protect
communities against future storms and SLR [36]. Nature-based risk mitigation, in the
form of wetland preservation, can reduce the impact of waves, shoreline erosion, as well
as accumulating sediments to further prevent SLR in an area while also curtailing future
climate change [37] as well as benefiting the biodiversity of local ecosystems [38]. Softer
measures that employ natural processes, such as reefs or marshes, can often be more cost
effective in the long term, leading to greater flexibility of land use as the hard structures
of gray solutions often have require further improvements or are less effective altogether
when compared to green alternatives [39]. Natural, “green”, engineering solutions helpSustainability 2021, 13, 7503 24 of 26
to solve not only SLR, but climate change and other factors when compared to the more
tradition “gray” solutions.
In local areas, such as the heavily impacted area of Marielyst, serious considerations
need to be made in order to prevent a significant loss of land in a worst case scenario.
Natural solutions, such as wetlands that can be found in other areas of the island, may work
as a temporary solution, but may not be able to keep up with a potentially accelerating rate
of SLR. More comprehensive, and holistic solutions must be planned for, such as dikes that
incorporate soft and hard aspects of coastal protection [40]. By incorporating nature-based
solutions, which deal well with handling sediment accretion, with man-made structures,
such as dikes with reinforced outer slopes, SLR and flooding can be more easily managed
and prevented with only the need to increase the crest height of the dike if accretion of
sediments is too high thus allowing waves to reach the top of the structure [40–42].
Limitations & Future Studies
Throughout the course of this study, data were easily accessible via official sources
(SDFE, DST, DMI, etc.), or able to be supplemented from open source alternatives, such as
OSM, as Denmark is an extremely data-rich country. This includes sea level data that was
used for every step of the analysis. Where such data are not available, elevation data must
be derived, a time consuming and cumbersome process involving processing raster data
from local or global sources. Larger datasets can lack the resolution to accurately analyze
local areas of SLR, and may require down-sampling of data in order to increase resolution.
Throughout this study, current land cover data were used in order to derive statistics.
This is a limitation as land cover is a dynamic process, along with SLR. The statistics
presented give a general idea of land cover types impacted, but do not include future land
cover change and therefore may not be entirely representative of the future of Falster island.
Countries where administrative population figures are not available have the option
of using coarse, 1 km resolution, population data for the entire world in the form of a
raster dataset provided by the Center for International Earth Science Information Network
(CIESIN) that can then be down-sampled to their area of study where official figures
are not available [43]. While not being as fine a scale as the methods used in this study,
such data are still able to provide a general figure to allow for easy consumption of data
from stakeholders.
Collaboratively collected data and citizen scientists have greatly increased the amount
of data on infrastructure (transportation, businesses, scenic areas, etc.) with the introduction
and development of open-sourced platforms such as OSM. Access to freely available (and
detailed) data via Python environments and libraries allows other areas of the world to have
access to similar datasets that were employed in this workflow in their respective areas.
Further studies can include processing remotely sensed satellite imagery in order to derive
features from an area where data from official or unofficial sources may be lacking in
quantity or quality. Such means could be used to derive building footprints as well as land
cover information for much of the globe.
Author Contributions: Conceptualization, A.B.-P. and P.M.; methodology, A.B.-P. and P.M.; software,
A.B.-P. and P.M.; validation, A.B.-P. and P.M.; formal analysis, A.B.-P.; investigation, A.B.-P.; resources,
A.B.-P., P.M. and J.J.A.; data curation, A.B.-P. and P.M.; writing—original draft preparation, A.B.-P.;
writing—review and editing, A.B.-P. and J.J.A.; visualization, A.B.-P.; supervision, J.J.A.; project
administration, A.B.-P. and J.J.A. All authors have read and agreed to the published version of
the manuscript.
Funding: This research received no external funding.
Data Availability Statement: No new data were created or analyzed in this study. Data sharing is
not applicable to this article.
Conflicts of Interest: The authors declare no conflict of interest.You can also read