Mid West regional water supply strategy - A long-term outlook of water demand and supply
←
→
Page content transcription
If your browser does not render page correctly, please read the page content below
Government of Western Australia              Securing Western Australia’s water future
    Department of Water

Mid West
regional water supply strategy
A long-term outlook of water demand and supply

                                                             Report no. 3 | April 2015
                                                  Regional water supply strategy series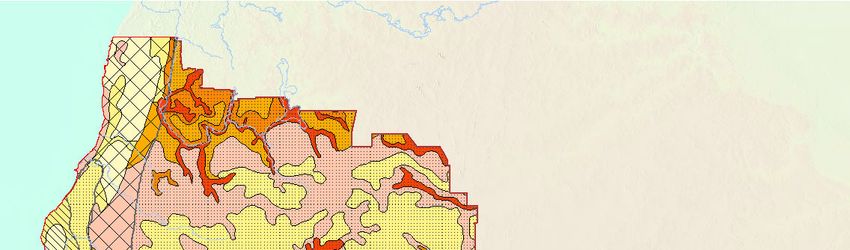
Mid West
regional water supply strategy
A long-term outlook of water demand and supply
Department of Water
168 St Georges Terrace
Perth Western Australia 6000
Telephone      +61 8 6364 7600
Facsimile      +61 8 6364 7601
National Relay Service 13 36 77
www.water.wa.gov.au

© Government of Western Australia

April 2015

This work is copyright. You may download, display, print and reproduce this material in
unaltered form only (retaining this notice) for your personal, non-commercial use or use within
your organisation. Apart from any use as permitted under the Copyright Act 1968, all other
rights are reserved. Requests and inquiries concerning reproduction and rights should be
addressed to the Department of Water.

ISBN 978-1-922248-14- 5 (print)
ISBN 978-1-922248-15-2 (online)

Acknowledgements

Project team: Amy Cowdell, Daniel Ferguson, Alana French

For more information about this report, contact
Water Supply Planning Branch, Branch Manager.

PO Box K822
PERTH WA 6842

(08) 6364 7600

Disclaimer

This document has been published by the Department of Water. Any representation, statement,
opinion or advice expressed or implied in this publication is made in good faith and on the
basis that the Department of Water and its employees are not liable for any damage or loss
whatsoever which may occur as a result of action taken or not taken, as the case may be in
respect of any representation, statement, opinion or advice referred to herein. Professional
advice should be obtained before applying the information contained in this document to
particular circumstances.

This publication is available at our website  or for those with special
needs it can be made available in alternative formats such as audio, large print, or Braille.
A message from the Minister

The Mid West region has great potential for future growth. Stretching from the shores of the
Indian Ocean at Geraldton right through to the Gibson Desert, the region is renowned for its
array of mineral resources, tourism opportunities and the agricultural and fishing industries.

The State Government is committed to the sustainable development of the Mid West,
and the Mid West regional water supply strategy is an important step in preparing the region
for further development. The strategy considers a range of water demand scenarios for mining,
industry, agriculture and towns in the region and identifies water supply options to meet
demand well into the future.

Water that is currently available in the region can present quality and access
challenges, which need to be considered when planning future mining, agricultural
and industrial developments.

The good news is that the strategy’s water demand forecasts indicate water supplies
for Geraldton and the region’s other major towns are secure until at least 2030. The
long-term outlook for meeting the increasing water demand in the ‘SuperTowns’ of
Jurien Bay and Morawa is also positive.

In 2012 the State Government commenced a four year, $1.9 million Royalties for
Regions-funded investigation of new and existing groundwater resources in the
East Murchison to support economic growth in the region.
                                                                                                  Mid West regional water supply strategy

In addition, we recently commenced an assessment of water resources to support growth of
irrigated agriculture in the West Midlands, as part of the Government’s Water for Food program,
which is also supported by Royalties for Regions.

The government is committed to securing a bright future for regional Western Australia. Our
water planning and investment in the Mid West region is further evidence of the importance we
place on our regional towns and industry.

Hon Mia Davies MLA
Minister for Water
                                                                                                  III
Contents
Contents
Foreword III
Summary IX
1 Purpose of this strategy 1
1.1 Background 1
1.2 Regional scale water supply planning 1
1.3 Intended outcomes 2
1.4 Strategy development 2
2 Mid West regional profile 3
2.1 Strategy area 3
2.2 Water supplies 3
2.3 Challenges to regional water supplies 9
3 Mid West regional water demand and supply 13
3.1 Mining 16
3.2 Industry 22
3.3 Agriculture 24
3.4 Urban 27
4 Mid West water supply strategy 37
Appendices 43
Appendix A — Water supply planning roles and responsibilities 44
Appendix B — Methodology 45
Mid West regional water supply strategy
Appendix C — Groundwater and surface water allocation and availability 50
Appendix D — Policies, plans and guidelines relevant to water supply development 54
Glossary 55
Shortened forms 56
Volumes of water 56
References 57
VContents
Figures
Figure 1 Current and estimated future water demand by sector in the Mid West region X
Figure 2 Local Government Authority boundaries within the Mid West region 4
Figure 3 Geological provinces and groundwater salinity in the Mid West region 7
Figure 4 Current and estimated future water demand by sector in the Mid West region 9
Figure 5 Historical annual rainfall for Geraldton 11
Figure 6 Historical annual rainfall for Wiluna 11
Figure 7 Current and proposed mining and industry activities in the Mid West region 15
Figure 8 Projected water demand for mining in the Mid West region 16
Figure 9 Iron ore export capacity scenarios in the Mid West Region 17
Figure 10 Groundwater investigations in the Mid West region 19
Figure 11 Projected water demand for heavy industry in the Mid West region 22
Figure 12 Projected water demand for irrigated agriculture in the Mid West region 24
Figure 13 Water demand and availability for Geraldton regional water supply scheme 30
Figure 14 Water demand and availability for Jurien Bay town water supply scheme 32
Figure 15 Water demand and availability for Arrowsmith water supply scheme 33
Figure 16 Public drinking water supply schemes in the Mid West region 35
Mid West regional water supply strategy
VIContents
Tables
Table 1 Projected water demand by sector in the Mid West region 14
Table 2 Water supply options for mining in the Mid West region 21
Table 3 Water supply options for a port and industrial estate at Oakajee 23
Table 4 Water supply options for irrigated agriculture in the Mid West region 26
Table 5 Town water supply schemes in the Mid West region 28
Table 6 Average annual household water use (kL/household/year) for Geraldton 29
Table 7 Water supply options for Geraldton regional water supply scheme 31
Table 8 Strategies and actions to support regional development 39
Table 9 Water supply planning roles 44
Table 10 Average annual population growth rates 46
Table 11 Assumptions about trend-breaking growth 47
Table 12 First use water supply options summary 49
Table 13 Groundwater availability in the Mid West region 50
Table 14 Surface water availability in the Mid West region 53
Table 15 Water quality descriptors 53
Table 16 Policies and guidelines relevant to assessment of water supply options 54
Mid West regional water supply strategy
VIISummary
Water use in the Mid West region could more than double over the next 30 years,
from 75 gigalitres1 per year (GL/year) to over 180 GL/year. The main drivers of growth
in the region include:
• proposed and planned mining projects
• a potential future port and industrial estate at Oakajee
• development of new areas for irrigated agriculture
• growth of Geraldton and rural towns, including the ‘SuperTowns’ of Jurien Bay
and Morawa.
The Mid West region is almost entirely dependent on groundwater for its water needs.
The total volume of groundwater available in the region is greater than the projected demand.
However, localised shortages and competition for high quality water sources will increase
with rising demand.
More than 200 GL/year of groundwater is still available for general use in the Northern Perth
Basin, which underlies much of the western part of the region. Most of the fresh to marginal
quality water used in the region will continue to be drawn from these sedimentary aquifers
within 100 km of the coast.
Further inland, groundwater in fractured rock aquifers is generally saline and the volumes are
often small or unable to be maintained over time. Most mining activities can adapt to using
the water available, but the growing magnetite mining industry requires greater volumes of
higher quality water. Future water solutions for mining include the treatment and use of locally
available, lower quality water as well as higher quality water supplies at a distance from mine
sites. The Department of Water’s $1.9 million Royalties for Regions-funded investigation of
Mid West regional water supply strategy
palaeochannels in the East Murchison will be completed in 2016 and provide new water supply
options for future mining development.
Projected water needs for industrial uses in the Mid West region largely depend on whether and
when a new port is established at Oakajee in response to growth in magnetite mining. Local
groundwater is limited, so water supply options include piping water from the Carnarvon Basin
(for which more detailed groundwater investigations will be needed), piping water
from the Northern Perth Basin (which may include trading of water licenses) or seawater
desalination on-site.
1
1 gigalitre equals 1 billion litres
IXSummary
Most of the likely growth in urban water demand is for the Geraldton-Dongara Regional
Water Supply Scheme. There is sufficient water from current groundwater sources to meet
this demand until after 2030. Sufficient water is also available to meet demand in the towns
of Jurien Bay and Morawa, even under the high population growth forecasts for the State
Government’s Regional centres development plan (‘SuperTowns’) initiative.
The upper demand range for agriculture assumes that 2500 ha of land is developed for irrigated
agriculture in addition to existing areas, requiring 30 GL/year by 2043. The most economically
viable water source for growth of irrigated agriculture in the region is locally available, high
quality groundwater, where it coincides with high quality agricultural land. Effectively meeting
future demand for agriculture will depend on targeted groundwater investigations and planning,
and early consideration of water supplies for new projects. Commencing in 2015, the Water for
Food Midlands groundwater and land assessment project, funded by the Royalties for Regions
initiative, will assess the potential for expansion of irrigation agriculture in an area west of
Moora to Dongara.
The future water demand scenarios (Figure 1) reflect the development potential for a diverse
range of industries in the Mid West region. Our strategy for managing the region’s water
resources therefore must be adaptable to a variety of possible futures.
The Department of Water has developed the Mid West regional water supply strategy to inform
long-term planning and regional development. Five strategies guide how government, industry
and the community can work together to ensure water is available to meet future demand in the
Mid West region.
Mining
8Industry
Urban
Mid West regional water supply strategy
Agriculture
Total
0
50
100
150
200
250
300
GL/year
2013
2043
low
growth
2043
medium
growth
2043
high
growth
Figure
1
CFigure
urrent
a1nd
| estimated
Currentfuture
and estimated future
water
demand
water
by
sector
in
tdemand by rsector
he
Mid
West
egion in the Mid West region
as
well
as
Figure
4
Current
and
estimated
future
water
demand
by
sector
in
the
Mid
West
region
XSummary
Strategy 1:
Maximise the sustainable use of local groundwater resources as a cost-
effective supply for the long-term.
The Arrowsmith groundwater allocation plan (DoW 2010a) and Jurien groundwater allocation
plan (DoW 2010b) provide the allocation limits and approach to managing groundwater
resources in the Northern Perth Basin.
As water demand pressure in the Northern Perth Basin increases, new knowledge will inform
our next phase of planning. Recent and proposed investigations into groundwater, ecosystems
and climate studies, information from private sector water resource investigations and
Department of Agriculture and Food WA land assessments will underpin increasingly precise
allocation limits and optimised water management.
The department recognises changing stakeholder needs in the Mid West region. We will
continue to engage Mid West region stakeholders on policy options for releasing and managing
available water. We will also implement measures to address the difference between existing
licensed entitlements and the water required in high competition areas, to maximise the water
available for new water developments.
Strategy 2:
Make the best use of water through a focus on water use efficiency, recycling
and integrated water and land use planning.
Water can be used more efficiently, particularly in areas of greatest scarcity, and better use
can be made of fit-for-purpose water. The mining sector will increasingly make more effective
use of freshwater by matching the water source quality to the various requirements of the
mining process, and consider opportunities for water recycling. There is also potential for
fit-for-purpose water supplies to be developed for irrigation of public open space, and new
industrial demands.
Water requirements and impacts have to be considered early in land use planning.
Mid West regional water supply strategy
The Department of Water will advise other agencies and proponents of sustainable and
cost-effective water supply options, and guide future growth to occur in areas where water
is available.
In partnership with the Cooperative Research Centre (CRC) for Water Sensitive Cities we
will support the City of Geraldton to implement the Towards a water sensitive city: Greater
Geraldton water planning and management strategy (2014) to become a ‘water sensitive’ city.
XISummary
Strategy 3:
Investigate and assess water resources to support regional development.
The department’s program of groundwater resource investigations identifies areas where water
is available to support regional development. The knowledge gained from these investigations
will be used to inform future water licensing, allocation planning and water supply planning.
Our Royalties for Regions-funded investigation of palaeochannels in the East Murchison
groundwater area, to be completed in 2016, will provide information on water availability and
identify prospective resources close to planned or undeveloped mining areas.
The Water for Food Midlands groundwater and land assessment project, funded by the
Royalties for Regions program, will investigate water and land resources to determine the
potential growth of irrigated agriculture in the Mid West region. This project will be completed
in 2018.
A recent groundwater investigation in the Allanooka and Casuarinas groundwater subareas of
the Northern Perth Basin improved our understanding of groundwater flow and salinity. This will
support strategic planning and management to best maintain these important resources for the
region’s major population centres.
There are several potential groundwater sources within a 70 km radius of Oakajee that
would require further investigations to confirm whether they are options to support industry
development.
Strategy 4:
Ensure emergency livestock water sources are available for areas with less
than 600 mm annual rainfall.
The department’s rural water planning program provides incentive schemes, planning and
technical services, and emergency water arrangements for rural communities in dryland
farming areas.
Mid West regional water supply strategy
Between May and October each year the department also provides monthly updates tracking
the seasonal rainfall and streamflow to assist emergency water supply planning.
XIISummary
Strategy 5:
Strengthen industry partnerships and collaboration in water supply planning.
The department will actively engage with mining and industry bodies to exchange information
on upcoming demands and options to meet new demand. We will also work with the Water
Corporation to track water demand and supply options for urban growth. This will be used to
regularly review the water demand–supply balance and inform our groundwater investigation
and planning priorities.
Our Western Australian water in mining guideline (DoW 2013a) provides a framework to address
water needs of new and changing projects early in the approvals process – well before a water
licence is issued. As development projects for a port and industrial estate at Oakajee are
defined, further work will be needed to calculate the water quality and quantity requirements.
Early planning and engagement with the department is encouraged to explore cost-effective,
fit-for-purpose water supply options.
Mid West regional water supply strategy
XIII1
Purpose of this strategy
1.1 Background
The Department of Water manages Western Australia’s water resources to support the state’s
economy, sustain the environment and provide amenity for the community. We continually
adapt to new challenges including the rising demand and competition for freshwater resources.
The Mid West region has recently benefitted from public and private investment in major
projects. These include the Mid West Energy Project, Australian Square Kilometre Array
Pathfinder project and the Karara iron ore project. Regional development arms of government
and the private sector are seeking to further diversify and grow the regional economy.
The availability of suitable land, energy and water is critical for regional development.
Government has a core role in ensuring well planned services and land and water resources are
sustainably managed to allow regional growth.
1.2 Regional scale water supply planning
This Mid West regional water supply strategy will help to ensure water supply investment is
aligned with state development objectives and land-use planning at a regional scale. It will also
provide the foundation for more detailed planning at a local area and site scale.
The strategy is based on projections of water demand for all water uses during the next 30
years. To inform future planning, investigations and decision making, it identifies:
• the timeframes for when demand will exceed existing supply
• water supply options to meet new demand
• water supply planning actions to support regional development.
Mid West regional water supply strategy
Water service providers and self-supplied water users generally undertake resource
investigations, water supply design and cost estimates before deciding on the best supply
option. Water supply options identified in this strategy are to inform future planning and
investment decisions by both government and the private sector. However, the identification of
options in this strategy does not mean they will be developed and funded by the government.
Appendix A has more information on the roles of water service providers and self-supply users
in planning and developing water supplies.
11
Purpose of this strategy
1.3 Intended outcomes
Applying this Mid West regional water supply strategy will support integrated regional planning
outcomes:
• Water supply planning and resource investigations support state land use and development
objectives.
• Information on water resource and supply options for towns and regional development is
available to government, industry and the community.
• Water users make decisions about developing water supplies based on knowledge of all
available water resources and supply options.
• Innovative, efficient and integrated water supplies are developed through early detection of
water shortages and timely planning.
1.4 Strategy development
This strategy has been developed with input from the Senior Officers Group for water
supply planning, chaired by the Department of Water. The Senior Officers Group includes
representatives from the Water Corporation and the departments of State Development,
Planning, Agriculture and Food WA, Premier and Cabinet, Treasury, Finance and Regional
Development. We have also consulted other relevant government agencies, industry
representatives and regional stakeholders during preparation of this strategy.
Mid West regional water supply strategy
22
Mid West regional profile
2.1 Strategy area
The Mid West region is characterised by a coastal area that includes the region’s major
population centres, a resource-rich hinterland dominated by dryland agriculture and a sparsely
populated interior with significant mineral reserves. The region is bounded by the Wheatbelt
and Gascoyne regions, known for food and fibre production, as well as the resource-rich
Pilbara and Goldfields regions.
The strategy area covers approximately 475 000 km 2 and extends along the Western Australian
coastline from 5 km south of Cervantes to the northern border of the Shire of Northampton
and east to the Shire of Wiluna (Figure 2). The strategy area aligns with the Mid West regional
planning boundary (as defined in the Planning and Development Act 2005), but also includes
the portions of the Shires of Dandaragan and Moora (within the Wheatbelt Development
Commission boundary) that fall within the Jurien groundwater area.
2.2 Water supplies
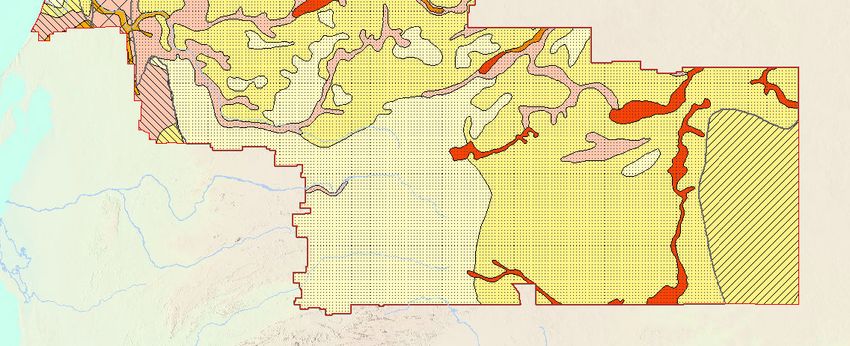
The Mid West region is almost entirely dependent on groundwater for its water needs. Land
and water use in the region is therefore closely associated with the underlying hydrogeology.
Groundwater in the region is clearly divided into coastal sedimentary aquifer systems to the
west and irregularly fractured rock storages in the eastern part of the region (Figure 3).
Northern Perth Basin
Most freshwater is taken from sedimentary aquifers within 100 km of the coast. In particular,
the Parmelia and Yarragadee formations of the Northern Perth Basin provide large volumes of
good quality water (Figure 3).
Mid West regional water supply strategy
The Northern Perth Basin of the Mid West region is covered by the Arrowsmith and Jurien
groundwater areas. Our management of these areas is guided by the Jurien and Arrowsmith
groundwater allocation plans. We review if our management of these areas is meeting the
objectives stated in the allocation plans annually.
More than 200 GL/year of groundwater is still available for general use and 28.5 GL/year
is reserved for public drinking water supply in the Northern Perth Basin. We are steadily
increasing our management of the water resources as demand approaches the allocation limits
set for the Arrowsmith and Jurien groundwater areas.
Our knowledge of the Northern Perth Basin is supported by the collection of large volumes of
data from government investigation programs, private bore records and geological reports. We
are continuing to compile this information in order to make it widely available to groundwater
professionals, groundwater users and the general public.
3PILBARA
Meekatharra (S)
GASCOYNE
Wiluna (S)
MID WEST
Murchison (S)
Cue (S)
Northampton (S)
Mid West regional water supply strategy
Mount Magnet (S)
Chapman Valley Sandstone (S)
(S)
Yalgoo (S)
Greater Geraldton (C) GOLDFIELDS - ESPERANCE
Mingenew Morawa (S)
Mid West regional profile
Irwin (S)
(S)
Three Springs Perenjori (S)
Location map (S)
±
Carnamah (S)
Legend
Coorow (S)
Mid West strategy area
Dandaragan (S) Moora (S)
Local government areas 0 50 100
WHEATBELT
Department of Planning regional boundary
Km
Figure 2 | Local Government Authority boundaries within the Mid West region
4Mid West regional profile
We recently completed a comprehensive groundwater investigation of the Allanooka and
Casuarinas groundwater subareas in the Northern Perth Basin. The study improved our
understanding of groundwater flow and salinity and will allow the development of strategies on
how to best manage and preserve these important resources.
In our next revision of the Arrowsmith and Jurien allocation plans, scheduled for after 2017,
we will use this new information from investigations into the hydrogeology of aquifers and
groundwater-dependent ecosystems of the Northern Perth basin. The impacts of climate
change on recharge will also be reviewed during this process.
Inland fractured rock
The eastern, inland part of the region is dominated by fractured-rock, alluvium, calcrete and
palaeochannel deposits, which have poor yields of mainly saline groundwater (Figure 3). These
resources are mostly within the Gascoyne and East Murchison groundwater areas.
Our knowledge of groundwater in the inland parts of the Mid West region has largely been
gained from investigations by mining companies and pastoralists to develop water supplies.
We have also compiled information from regional groundwater assessments and various
hydrogeological reports to locate water resources to support development in the region.
The Department of Water is now starting an investigation into the palaeochannel aquifer
systems of the East Murchison groundwater area, where hydrogeological information is
currently very limited. The $1.9 million Royalties for Regions-funded project will be completed
in 2016. It will significantly improve our knowledge of aquifer extent, storage, recharge zones,
water quality and acceptable yield of palaeochannels in the region.
Mid West regional water supply strategy
5Mid West regional profile
Surface water
The Mid West region has an extensive network of rivers and streams, many of which support
important ecological and social values. Most of these waterways are seasonal, flowing only
when there is high summer rainfall or a wet winter. They tend to be brackish (1501–5000 mg/L)
and often interact with groundwater.
Six surface water areas within the Mid West region are proclaimed for licensing purposes under
the Rights in Water and Irrigation Act 1914:
• Gascoyne River (majority in Gascoyne region)
• Greenough River
• Eneabba coastal tributaries
• Hill River and tributaries
• Irwin River and tributaries
• Nambung/Cataby coastal tributaries.
Variable rainfall and surface water yields in the region mean taking water from rivers is limited
to opportunistic small-scale use. High evaporation rates and sandy soils also hinder the
capture and storage of surface water runoff.
There are currently no allocation limits set for proclaimed surface water resources in the region
and proposals to take surface water are assessed on a case-by-case basis.
In unproclaimed surface water areas, landowners can take water without a licence provided
they do not significantly diminish the flow of water in the watercourse.
Mid West regional water supply strategy
6Legend
Mid West strategy area Groundwater Salinity (TDS mg/L)
Geological Provinces 35000
Mid West regional water supply strategy
Mid West regional profile
Figure 3 | Geological provinces and groundwater salinity in the Mid West region
7Mid West regional profile
Seawater desalination
Seawater desalination is not currently used as a water source in the Mid West region, although
it has been identified as a potential option for supplying a port and industrial estate at Oakajee.
New technology means that the cost of desalination is decreasing and it is one of the few water
supply options that is independent of climate.
The availability and cost of energy, the carbon footprint and the effects of brine discharge are
important factors in considering desalination.
Alternative water supplies
Alternative water supplies such as recycled wastewater, grey water, stormwater and rainwater
tanks are important fit-for-purpose options that can help reduce the pressure on the region’s
potable water supply schemes or high quality groundwater resources. These technologies can
be applied at the scale of lot, estate or suburb.
Use of recycled water by industry and for public open space in 2013 was estimated to be
0.3 GL. Around 23 per cent of wastewater in the region is currently reused, primarily for
irrigation of sporting grounds and public open space (Water Corporation 2012). This includes
recycling schemes in Geraldton, Kalbarri, Dongara and Morawa. The Narngulu wastewater
treatment plant was built as a high performance 3.5 ML/day, aerated lagoon system to service
the Narngulu Industrial area (DEC 2008). There is potential for future reuse by industry or for
irrigation purposes.
The City of Geraldton is also implementing pilot projects examining the potential to harvest
and redirect stormwater from urban catchments. Stormwater is currently harvested from
grain storage sheds at the Geraldton port, infiltrated into the superficial aquifer and used for
irrigating public open space (City of Greater Geraldton 2014).
The Department of Water’s Guideline for the approval of non-drinking water systems in Western
Australia (2013b) provides advice to land developers and local governments on creating a
development-scale supply of non-drinking water.
Mid West regional water supply strategy
8Mid West regional profile
2.3 Challenges to regional water supplies
Increasing demand for water
An estimated 75 GL/year of water is currently abstracted (almost entirely from groundwater) for
consumptive use in the Mid West region. Our forecasts indicate demand could grow to more
than 180 GL/year by 2043 under a medium growth scenario (Figure 4). Much of this projected
water demand relates to industries that are not yet established in the region, so there is a wide
range of possible growth scenarios.
In addition to the volume of water required, the location, quality and depth to water have to be
considered in forecasting if water is available to support future regional development. In total,
there is enough water throughout the Mid West region to meet a high growth scenario for water
demand to 2043. However, in reality demand will increase faster for the best quality and most
accessible groundwater resources.
Competition is most likely to occur in the Northern Perth Basin in areas that are identified
for intensive development of high water use industries. The high quality groundwater from
the Northern Perth Basin could also be sought to meet more distant demands such as for
magnetite mining in the East Murchison groundwater area or to supply Perth’s Integrated Water
Supply Scheme.
Mining
8Industry
Urban
Agriculture
Mid West regional water supply strategy
Total
0
50
100
150
200
250
300
GL/year
2013
2043
low
growth
2043
medium
growth
2043
high
growth
Figureand
Figure
1
Current
4 e| stimated
Currentfuture
and estimated future
water
demand
water
by
sector
in
demand
the
Mid
Wby
est
sector
region in the Mid West region
as
well
as
Figure
4
Current
and
estimated
future
water
demand
by
sector
in
the
Mid
West
region
9Mid West regional profile
Climate
Coastal areas of the Mid West region generally receive an average of 400 to 500 mm of rainfall
per year, with most rain falling during May to September. Since the year 2000, Geraldton has
exceeded the long-term average rainfall only once (Figure 5).
Inland areas of the region receive less than 250 mm/year, with more erratic rainfall as a result of
summer thunderstorms or depressions from cyclonic events occurring in the north. Wiluna, one
of the furthest inland towns of the region, has experienced an increased average annual rainfall
over the last ten years compared to the long-term recorded average (Figure 6).
Department of Water modelling indicates that there will be increased temperatures and
decreased rainfall across the Northern Perth Basin for each of three future climate scenarios
(wet, median and dry), which are based on twelve global climate models and four emissions
scenarios (Marillier et al, in press). Recharge to aquifers will reduce under these scenarios so
the total volume of water available today in the Mid West region may change in the future.
Mid West regional water supply strategy
10Mid West regional profile
1000
900
800
700
Rainfall (millimetres/year
600
500
400
300
200
100
0
1877
1881
1885
1889
1893
1897
1901
1905
1909
1913
1917
1921
1925
1929
1933
1937
1941
1945
1949
1953
1957
1961
1965
1969
1973
1977
1981
1985
1989
1993
1997
2001
2005
2009
2013
Annual rainfall 1899-1999 average (456 mm) 2000-2013 average (356 mm)
(1891 = No data)
Figure 5 | Historical annual rainfall for Geraldton2
1000
900
800
Rainfall (millimetres/year)
700
600
500
400
300
200
Mid West regional water supply strategy
100
0
1877
1881
1885
1889
1893
1897
1901
1905
1909
1913
1917
1921
1925
1929
1933
1937
1941
1945
1949
1953
1957
1961
1965
1969
1973
1977
1981
1985
1989
1993
1997
2001
2005
2009
2013
Annual 1899-1999 average (252 mm) 2000-2013 average (315mm)
Figure 6 | Historical annual rainfall for Wiluna 2
2
Data from Bureau of Meteorology 2014 a, b
113
Mid West regional water demand and supply
In 2013, water demand for the Mid West region was approximately 75 GL/year. This was almost
entirely sourced from groundwater. Less than one per cent was from other sources such as
surface water and recycled water.
The total volume of groundwater licensed for use in the region is 186 GL/year. However,
according to monitoring data submitted by water users only 65 GL of the total licensed
entitlements was actually used in 2013. A further 10 GL is estimated to be used for purposes
that do not require a licence (e.g. stock and domestic purposes). The difference between the
volume of water licensed and the volume actually abstracted is due to large fluctuations in
water use throughout mine lifecycles and variations in crop water demands from year to year.
A water demand scenario-modelling tool was used to estimate future water demand in the Mid
West region (see Appendix B – Methodology). The tool combines regional economic growth
data and population forecasts to estimate a range of water demand scenarios to 2043. We have
also taken account of advice received from across government and industry on the potential for
the following trend-breaking growth:
• proposed and planned mining projects
• a potential new port and industrial estate at Oakajee
• developing new areas for irrigated agriculture
• urban expansion, particularly in Geraldton and the towns of Jurien Bay and Morawa, which
are involved in the Regional centres development plan (‘SuperTowns’) initiative.
Our forecasts indicate that under a medium growth scenario regional economic growth could
result in a doubling of the demand for water in the Mid West region over the next thirty years
(Table 1). The iron ore sector is expected to be the major driver of this increased water demand.
Mid West regional water supply strategy
This will increase water use directly for mining operations and industrial port water use, and
indirectly for the regional population and service industries. Current and proposed mining and
industry projects are shown in Figure 7.
In 2012–13, 10.7 million tonnes of iron ore were exported (Geraldton Port Authority 2013). With
recent upgrades, the Geraldton port now has the capacity to handle 20 million tonnes per
annum (Mtpa) of iron ore.
A site at Oakajee, approximately 30 km north of Geraldton, has been identified as a potential
location for a new port that could support the forecast long-term growth of iron ore exports
from the region. Planning for the port indicates a start-up capacity of 45 Mtpa of iron ore, with
the capacity to increase to 70 Mtpa. A third berth could increase capacity to 105 Mtpa.
13Mid West regional water demand and supply
Table 1 Projected water demand by sector in the Mid West region
Projected
water Groundwater
Water Water
Water quality demand subareas with
Sector licensed taken
required* range† by high water
(GL/year) (GL/year)
2043 demand
(GL/year)
Egerton,
Fresh to
Mining 111 32 52–130 (93) Meekatharra,
hyper-saline
Mullewa/Byro
Casuarinas,
Fresh to Dongara,
Industry 1 1 1–37 (18)
brackish Kalbarri/
Eurardy
Dongara,
Fresh to Eneabba
Agriculture 48 15 28–74 (35)
marginal Plains, Twin
Hills
Unlicensed stock Fresh to
0 8 11–14 (12)
and domestic brackish
Allanooka,
Town water Fresh to
22 13 20–35 (23) Cervantes,
supply schemes marginal
Dongara
Licensed 4 3
Urban – self Fresh to Casuarinas,
Non- 6–9 (7)
supplied 0 3 brackish Dongara
licensed
Total 186 75 118-299 (188)
* See Appendix C
†
Medium demand in brackets
Mid West regional water supply strategy
14Telecom Hill
Coobina Robertson Range
Prairie Downs
Butcherbird
Abra
Grosvenor Plutonic
DeGrussa - Doolgunna
Jack Hills
Andy Well
Jundee-Nimary
Meekatharra Wiluna
!
( !
(
Meekatharra Wiluna
Weld Range Wiluna West
Murchison/Kentor Lake Way
Yeelirrie Mt Keith
Big Bell
Barrambie
Murchison / Silver Lake
(
Kalbarri !
Mount Magnet
Port Gregory Tallering Peak (
Mt Magnet ! Windimurra
Yalgoo
!
(
Eradu Pig Iron Bilberatha Hill
Oakajee Deflector-Gullewa
Kirkalocka Major projects
Geraldton ! ( Geraldton
Narngulu synthetic rutile Golden Grove Legend Proposed shown in red
Geraldton brick
Operating or under development shown in blue
Irwin River Koolanooka/Midwest
Mungada !
( Town
Dongara ! ( (
Morawa ! Karara !
A Chromite - Platinoids !
( Nickel
Centauri 1 Koolanooka South Mt Gibson Mid West strategy area
"
'
C Coal b Silica
Eneabba Three Springs
[ Construction materials "
Eneabba '
T Talc
!
(
map Central West Mt Gibson !
' Copper - Lead - Zinc !
¶
( Uranium
Location
Location map
Coolimba
!
? Gold "
'
V Vanadium - Titanium
(
Jurien !
"
§
) Heavy mineral sands "
! Power plant
Moora Chert
± #
"
) Iron ore "
| Port
Cooljarloo/Tiwest #
0 50 100 Manganese ore
MINEDEX Major Resources Projects Map data was extracted
Km on 26/08/2013 from Department of Mines and Petroleum.
Mid West regional water supply strategy
Mid West regional water demand and supply
Figure
Figure 71 || Current
Mid Westand proposed
regional mining
water and
supply industry activities
strategy Great Fingall in the Mid West region
Balline Extension HillCooljarloo/Image
Dongara Cashmere Downs Beyondie
Nowthanna
Minjar - Mt Mulgine Gidgee
Magellan Plutonic
Ilgarari Lake Maitland
MatildaDome
15Mid West regional water demand and supply
3.1 Mining
Approximately 111 GL/year of water is currently licensed for mining activities in the region.
This includes water for mine dewatering, mineral processing, dust suppression, exploration and
mine camps.
In 2013, only 32 GL/year was abstracted 3. Most of this water was used on-site; however, an
estimated 1.4 GL/year of excess dewater was discharged to the environment. Controlled
releases of dewatering surplus are subject to regulation by the Department of Water and the
Department of Environment Regulation to minimise impacts on the environment and optimise
use of fit-for-purpose water.
The emerging iron ore, uranium and on-shore gas industries will create further demand for
water in addition to established mining activities targeting gold, mineral sands and base
metals. Water abstraction for the mining sector in the Mid West region is expected to increase
to around 90 GL/year under a medium growth scenario and 130 GL/year under a high growth
scenario by 2043 (Figure 8).
Further information on water demand and supply for the different mining sectors is
provided below.
140
14
120
12
100
10
80
8
GL/year
GL/year
60
6
40
4
20
2
Mid West regional water supply strategy
0
2013
2018
2023
2028
2033
2038
2043
Demand
range
Medium
growth
scenario
Figure 8 | Projected water demand for mining in the Mid West region
Figure
8
Projected
water
demand
for
mining
in
the
Mid
West
region
3
Abstraction estimate is based on monitoring data from licensed water metering reports. Abstraction
is lower than licensed entitlements as the full entitlement is the volume required by a company when
reaching full production, and if dewatering is required, will meet peak dewatering rates (including
during high rainfall events). Abstraction will vary throughout the life of a mine.
16Mid West regional water demand and supply
140
120
Millions of tonnes per annum
100
80
60
40
20
0
2013 2018 2023 2028 2033 2038 2043
Geraldton port (25 Mtpa) Oakajee port (45 Mtpa) + Geraldton port (12 Mtpa)
Oakajee port (70 Mtpa) + Geraldton port (12 Mtpa) Oakajee port (105 Mtpa) + Geraldton port (12 Mtpa)
Figure 9 | Iron ore export capacity scenarios in the Mid West region
Iron ore
Proposed development of magnetite ore bodies within the Gascoyne and East Murchison
groundwater areas is the main driver for an increase in mining water demand. The first
shipment of magnetite from the Mid West region was made in early 2013. Until then hematite
was the only iron ore exported from the region. The emergent magnetite industry requires
higher quality groundwater for some phases of mineral processing.
At present, the Geraldton port can handle 20 Mtpa of iron ore; however, we have assumed that
25 Mtpa could be exported from the region without developing a new port. Water entitlements
have already been obtained to meet most of the water demand for iron ore mining under this
scenario.
Mid West regional water supply strategy
The potential development of a port at Oakajee would allow significant additional volumes of
iron ore to be exported. Indicative scenarios for the growth of iron ore mining in the region are
therefore based on three development scenarios for a port at Oakajee with an export capacity
of 45 Mtpa, 70 Mtpa and 105 Mtpa (Figure 9). For these scenarios exports from Geraldton port
are assumed to decrease to 12 Mtpa following construction of Oakajee.
Approximately 50 GL/year of water would ultimately be needed for magnetite mining if Oakajee
is developed and gradually increases to a capacity of 45 Mtpa. More than 90 GL/year will
be needed for iron ore mining if production attains a level that would see a port at Oakajee
progressively expand to three berths (capacity of 105 Mtpa).
17Mid West regional water demand and supply
Proposed magnetite mines are located in fractured rock groundwater areas. Piping better
quality and reliable volumes of groundwater from the sedimentary aquifers within the
Arrowsmith and Gascoyne groundwater areas has therefore become an option to supply
magnetite mines. However, as the subareas in the eastern parts of the Arrowsmith groundwater
area near full allocation, increasingly long distance transport of water is needed. This constraint
may drive the development of lower cost methods to use water that is more readily available,
but of poorer quality. This includes treating or adapting production processes to use lower
quality local groundwater.
To support the anticipated growth of magnetite mining, a major initiative is the Department
of Water’s investigation of palaeochannel aquifers within the vicinity of magnetite projects.
The $1.9 million Royalties for Regions-funded project to be completed by June 2016 aims
to define the Murchison palaeochannels in terms of their extent, water storage, yield, water
quality and viability for abstraction. The study will be conducted using a fixed-wing airborne
electromagnetic survey of palaeochannels within the investigation area (Figure 10). The
department will work with industry to identify potential data sharing opportunities that could
complement the investigation work.
Gold mining
Most gold mining occurs between Morawa and Meekatharra in the East Murchison groundwater
area. In 2013, 51 GL/year was licensed for gold mining and we estimate that 15 GL of this
entitlement was used. Only a small number of gold mining projects are currently operating, with
the remainder under care and maintenance. Most projects do not require significant volumes of
freshwater and therefore use groundwater from fractured rock, palaeochannels, alluvium and
local calcrete aquifers.
Several proposals to expand or re-develop existing gold projects are in their early stages and
have limited information on additional water needs. We have assumed that growth in gold
mining will follow historical trends during the forecast period.
Mineral sands
Licensed water entitlements for mineral sands mining near Eneabba, Jurien Bay and Port
Mid West regional water supply strategy
Gregory total 22 GL/year and the estimated water use for 2013 is 5 GL.
Mineral sands mining was scaled back in the region after the global financial crisis. However,
the processing of heavy minerals concentrate from other regions has increased at the
expanded Narngulu processing plant near Geraldton. The department has worked closely
with various mineral sand mining companies to facilitate access to groundwater for new and
expanded mineral sands projects.
18Meekatharra Wiluna
!
( !
(
Kalbarri !
(
Legend
Mid West strategy area
Mount Magnet
!
( !
( Town ±
Yalgoo River 0 50 100
!
(
Geological Provinces Km
"
| Carnarvon (Sedimentary)
Geraldton !
(
Officer (Sedimentary) Location map
Perth (Sedimentary)
Morawa
Dongara !
( !
( Combined Fractured Rock
Iron ore (magnetite) deposits
# Operating
Eneabba
!
( # Proposed
#
I Undeveloped
"
| Proposed Oakajee port
(
Jurien !
Water for Food (Midlands)
!
( Palaeochannel investigation area
Moora
Allanooka and Casuarinas
groundwater investigation areas
Mid West regional water supply strategy
Mid West regional water demand and supply
Figure 10 | Groundwater investigations in the Mid West region
19Mid West regional water demand and supply
Other mining
Most of the remaining water licensed for mining (24 GL/year) in the Mid West region is used
in the extraction of nickel and base metals. We estimate that 7 GL was used for these mining
activities in 2013.
The first vanadium mining project began production in early 2012. The forecast future water
demand for current and proposed vanadium mining projects is 7 GL/year. There are currently
no water licenses for uranium mining though water demand could reach 10 GL/year if proposed
projects proceed to full production.
Oil and gas
Oil and gas production in the coastal areas of the Northern Perth Basin used less than 0.2 GL
of the 0.7 GL of water licensed in 2013.
The growing interest in developing oil and gas resources means the demand for water by this
sector is likely to increase. Shale and tight gas resources in the region are currently being
explored to determine project viability. There are also numerous geothermal exploration sites
indicating future growth of this industry.
On-shore gas resources in shale and tight gas formations are usually located at depths below
2000 metres, so generally well below aquifers currently used for water production or likely to be
used in the future.
The Dandaragan trough is identified as the main potential shale gas area in the Mid West
region. The trough is approximately 50 km wide and extends from Dongara to Dandaragan.
It covers an area of the Northern Perth Basin that includes aquifers with significant volumes
of unallocated, high-quality groundwater.
The volume of water needed for each well in the hydraulic fracturing process varies from project
to project. It depends on the number of wells, size and length of the well and the properties of
the rocks to be fractured. To extract tight and shale gas, horizontal wells are generally drilled to
lengths of around 1.5 km or more and, depending on the number of fractures, could use around
Mid West regional water supply strategy
20 000 kL of water per well during production. The relatively small volume of water needed for
hydraulic fracturing indicates that competition for groundwater resources between shale and
tight gas developments and other water demands will not be a significant issue.
20Mid West regional water demand and supply
Mining water supply options
Most new mining activities are located within the inland fractured rock areas, where
groundwater quality is generally poor and yields are unreliable. Early consideration of water
supply options in the planning process and the efficient use of water are therefore very
important (Table 2).
The Department of Water’s Western Australian water in mining guideline (DoW 2013a) assists
mining proponents. We will support the mining sector in limiting its use of freshwater by
matching the water source quality to the various requirements of the mining process, and
consider opportunities for water recycling. High quality water should only be used for mining
where it is essential or where no other suitable water source is available.
The department also encourages the productive and beneficial use of mine dewatering
surplus 4. This could include its use for irrigated agriculture, other mining operations, industrial
use or urban water supply. Our Strategic policy no. 2.09: Use of mine dewatering surplus (DoW
2013c) promotes and encourages the appropriate use of mine dewatering surplus and provides
information on the considerations for proponents and approvals required.
Table 2 Water supply options for mining in the Mid West region
Location Option Considerations
Northern Perth • Local groundwater • Local water quantity and quality
Basin • Water efficiency and local recycling • Groundwater investigations and
• Fit-for-purpose use of poorer quality assessment
water • Competition with other water users
• Water trading • Distance to alternative sources
• Piping groundwater from other
groundwater subareas
Fractured rock • Local groundwater • Local water quantity, quality and
areas • Water efficiency and local recycling reliability
• Fit-for-purpose use of poorer quality • Groundwater investigations and
water assessment
• Piping groundwater from the • Distance to source
Mid West regional water supply strategy
Northern Perth Basin or Carnarvon • Competition with other water users
Basin
• Piping water from palaeochannel
resources in the East Murchison
groundwater area
• Water recycled and returned from
slurry pipelines to port
4
Mine dewatering surplus is the volume of water from a mine dewatering operation that is surplus to
the water requirements of that mine.
21Mid West regional water demand and supply
3.2 Industry
Water use for industry in the Mid West region in 2013 was approximately 1.5 GL. Industries in
the region include food processing, metal fabrication, chemical production and port water use.
Around 1 GL was supplied through groundwater bores managed by individual water users. The
Water Corporation also supplies scheme water to the Geraldton port and most industrial water
users in the region.
There is a wide range of possible growth scenarios for industry in the Mid West region (Figure
11). Industry growth is linked to growth in iron ore exports and the potential development of a
new port at Oakajee.
35
35
30
30
25
25
20
20
GL/year
GL/year
15
15
10
10
5
5
0
0
2013
2018
2023
2028
2033
2038
2043
Demand
range
Medium
growth
scenario
Figure 11 | Projected water demand for heavy industry in the Mid West region
Figure
11
Projected
water
demand
for
heavy
industry
in
the
Mid
West
region
Construction of a port at Oakajee and associated rail infrastructure would take approximately
36 months and require 3.5 GL of water (Oakajee Port and Rail 2010). About 5 GL/year of water
Mid West regional water supply strategy
would be required at the port to support the export of 45 Mtpa of iron ore. Local groundwater
resources are available along the proposed rail line between the port and mine sites for
construction and maintenance of the rail. However, there are insufficient volumes of local
groundwater to meet operational water demands at the port.
Conceptual stage planning for Oakajee includes an industrial estate adjacent to the port
facilities. Water demand for feedwater is estimated to be 29 GL/year by 2043 based on
assumptions about the mix of industries that could potentially locate in the estate (GHD 2012a).
This is made up of 19 GL/year of low quality (800–1000 mg/L total dissolved solids [TDS]) and
10 GL/year of high quality (100–200 mg/L TDS) feedwater for processing, cooling and dust
suppression. Around 0.08 GL/year of potable water supply would also be required and is likely
to be sourced from the Geraldton regional water supply scheme.
22Mid West regional water demand and supply
A district water management strategy (DWMS) was developed in 2012 to support the Oakajee
industrial estate structure plan (GHD 2012a). A DWMS is a high level water management report
required under the Better urban water management (WAPC 2008) process when developers
propose a major change to land use. The Oakajee DWMS identified that forecast feedwater
demand exceeds the local availability of freshwater (GHD 2012b).
In areas of limited fresh groundwater availability, heavy industry is encouraged to use lower
quality water such as brackish to saline groundwater, recycled water or surplus mine dewater.
Potential options to meet water demand for a port and industrial estate at Oakajee are
summarised in Table 3.
Table 3 Water supply options for a port and industrial estate at Oakajee
Option Considerations
Piping groundwater from more than • Further investigation required to identify and confirm
50 km away in the Carnarvon Basin the size and quality of potential sources in the
Gascoyne groundwater area
• Distance to source
Piping groundwater from resources more • Competition with other water users (town and
than 50 km away in the Northern Perth agriculture)
Basin • Distance to source
Wastewater recycling • Low volume available from a new wastewater
treatment plant north of Geraldton
• Recycling within the industrial estate is a longer-term
option once there is a base supply of wastewater
Reuse of water from slurry pipelines • Subject to development of privately owned slurry
used to transport ore to the port pipelines to transport ore from mine to port
• Water recycled from the slurry could be returned to
water deficit mine sites
Seawater desalination • Cost effectiveness compared to long distance
transport of groundwater
• High energy demands, carbon footprint and brine
disposal
Mid West regional water supply strategy
As development projects at the port and industrial estate are further defined, additional work
will be needed to more accurately gauge the water quality and quantity requirements. To
ensure the efficient use of high quality water, water source quality needs to be matched to
the different process water quality requirements. While the port and industrial estate are two
separate developments, there are opportunities for sharing water supply infrastructure to avoid
infrastructure duplication.
Early planning and engagement with the department is encouraged to explore cost-effective,
fit-for-purpose water supply options.
23Mid West regional water demand and supply
3.3 Agriculture
Irrigated agriculture
Irrigated agriculture in the region comprises pasture for beef production, horticulture and tree
farming (fruit and nuts). In 2013, 48 GL of groundwater was licensed to irrigated agriculture and
15 GL was used. The variability of annual inputs and outputs in agricultural production means
that the portion of licensed water entitlements used changes from year to year.
Most water used for irrigated agriculture occurs in the Dinner Hill, Dongara, Eneabba Plains,
Twin Hills and Northampton groundwater subareas of the Northern Perth Basin. This water is
mainly drawn from groundwater bores, although some properties around Northampton and the
Chapman Valley also use surface water for irrigation of fruit trees and vines. Climate and soil
constraints preclude the opportunity to use surface water for irrigated agriculture in most other
parts of the region.
A Department of Agriculture and Food WA (DAFWA) technical report (Tille et al. 2012) identifies
high quality land suitable for irrigated agriculture in the Geraldton planning region. Growth
of irrigated agriculture could also occur in the southern parts of the region to offset the
displacement of agricultural land due to urban expansion around Perth.
80
70
60
50
GL/year
40
30
20
10
Mid West regional water supply strategy
0
2013
2018
2023
2028
2033
2038
2043
Demand
range
Medium
growth
scenario
Figure 12 | Projected water demand for irrigated agriculture in the Mid West region
Figure
12
Projected
water
demand
for
irrigated
agriculture
in
the
Mid
West
region
24You can also read