Natural Gas Assessment New York State Energy Plan 2009 - December 2009 - NY.gov
←
→
Page content transcription
If your browser does not render page correctly, please read the page content below
Natural Gas Assessment
New York State Energy Plan 2009

           December 2009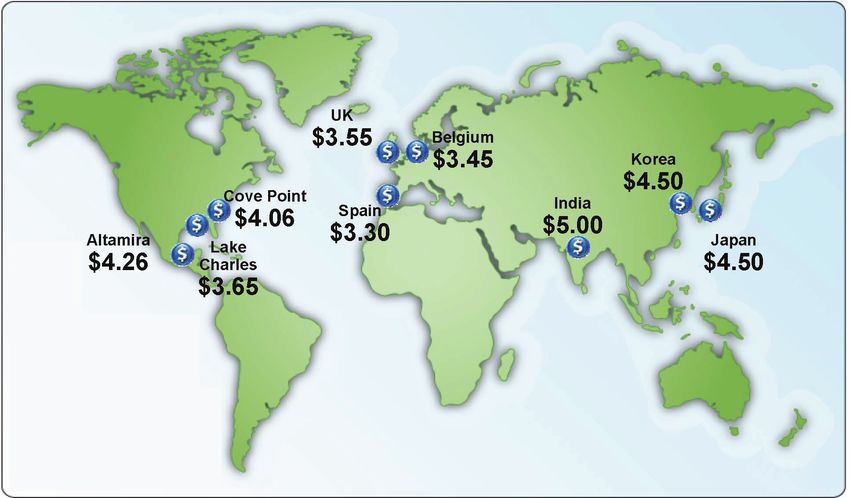
1 Overview
This Assessment describes the workings of the natural gas market in New York and the northeast region,
discusses current use and projected need for natural gas and analyzes the findings of the modeling effort
undertaken for the 2009 Plan. Since the regional natural gas market is dependent on the national gas
market, the Assessment describes aspects of the national markets for natural gas that are considered most
likely to have an impact on New York or the northeastern U.S. gas markets over the planning horizon.

Adequate supplies and pipeline capacity are needed to meet natural gas demand. Overall, natural gas
supplies are expected to remain adequate to meet projected demand, both nationally and for New York.
However, adequate pipeline delivery capacity is critical to ensure that available gas supplies can be
provided to the markets that require them. In order to assess the adequacy of the natural gas pipeline
delivery system serving New York, the combined gas requirements of the State’s residential, commercial,
industrial and electric generation customers were considered together and compared to currently available
pipeline delivery capacity at peak periods. This effort was accomplished by modeling New York’s
natural gas and electric systems. The modeling results of a Reference Case and four scenarios were
examined: retirement of the Indian Point nuclear power plant with replacement of the plant with gas-fired
generation, re-powering existing downstate residual oil-fired units with gas-fired facilities, a much colder
than normal winter, and a combination of the previous three scenarios. All scenarios resulted in a certain
level of unmet natural gas demand in 2018. Additional electric system modeling conducted to assess the
impacts from this unmet demand indicates that some electric generator demand for natural gas will not be
served due to the lack of natural gas delivery capacity. Additional analyses are being conducted to
determine the significance of this unserved load for reliably meeting electric customer requirements.

                                                                                                           1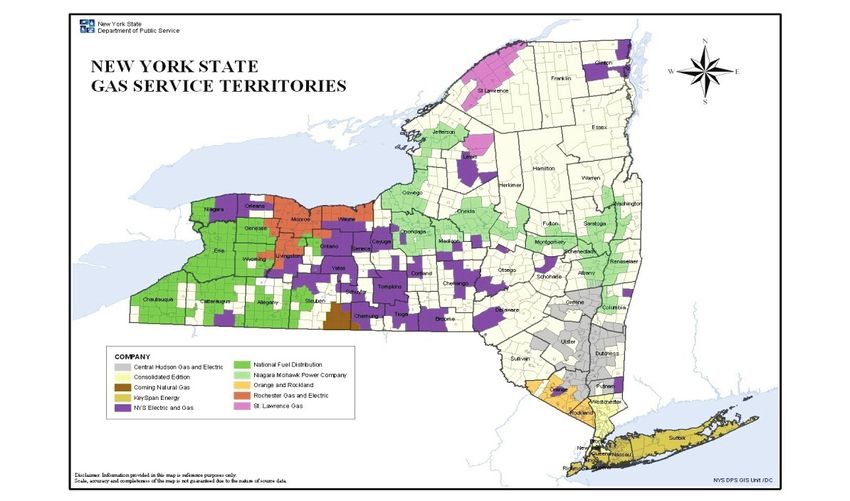
Natural Gas Assessment

2
2 New York State Natural Gas Market
New York currently uses approximately 1,200 billion cubic feet of natural gas per year, making it the
fourth largest gas consuming state in the nation. The breakdown of this gas consumption by sector is
residential 393 billion cubic feet (33 percent), commercial and industrial 375 billion cubic feet (32
percent), and electric generation 404 billion cubic feet (34 percent).1 Table 1 summarizes commonly used
measurements for natural gas.

Table 1. Common Units for Natural Gas
                                       Common Volume Measurements for Natural Gas
                                                           1 Cubic Foot (cf)
                                                     Thousand Cubic Feet (Mcf)
                                   Common Heat Content Measurements for Natural Gas
                                                     1 Therm (Th) = 100,000 Btu
                                          1 Dekatherm (Dt) = 1,000,000 Btu = 1 MMBtu
                                              1 MMBtu = 1 Dt = approximately 1 Mcf

The State has approximately 4.7 million natural gas customers served by eleven local gas distribution
companies (LDCs).2 These LDCs are regulated by the Public Service Commission (PSC). Figure 1
illustrates the service areas of the New York LDCs.

The downstate market (geographically: Long Island, New York City, Westchester, Orange and Rockland
Counties) is served by National Grid (formerly KeySpan Energy Delivery of New York City and
KeySpan Energy Delivery of Long Island) and Consolidated Edison Company of New York/Orange &
Rockland Utilities, Inc. (Con Edison/O&R). These companies depend on common interstate pipeline
companies,3 which connect either directly to production areas in the Gulf Coast region, to Canada, or to
major storage areas in the northeast.

The upstate market is served by Central Hudson Gas & Electric, Corning Natural Gas, National Fuel Gas
Distribution Corporation, National Grid Upstate, New York State Electric & Gas Corporation, Rochester

1
    Other uses, i.e., pipeline and distribution use and vehicle fuel, account for roughly 15 billion cubic feet of demand.
2
  The breakdown of customers by sector is 4.3 million residential customers and 0.4 million commercial, industrial, and electric
generation customers.
3
 Algonquin Gas Transmission (Algonquin), Iroquois Gas Transmission System (IGTS), TransCanada Pipeline Limited (TCPL),
Tennessee Gas Pipeline Co. (Tennessee), Texas Eastern Transmission LP (Texas Eastern), Millennium Pipeline Company LLC
(Millennium) and Transcontinental Gas Pipeline Corp (TRANSCO).

                                                                                                                                   3
Natural Gas Assessment Gas and Electric Corporation, and St. Lawrence Gas. Most of the LDCs serving the upstate market depend on a common set of interstate pipeline companies.4 The LDC natural gas franchise territories branch out from the more densely populated areas of New York. There are many rural areas in the State that do not have natural gas service because it is not economically practical to extend gas mains into areas with limited potential natural gas load. In order to expand service into new areas, an LDC needs to demonstrate that it can achieve a reasonable return on the cost of installing the expansion facilities.5 In situations where expansion of natural gas facilities into new areas is not economically viable, it may be possible to receive contributions towards the costs of the expansion facilities from potential customers, interested municipalities in the region, and State economic development funds.6 Figure 1. New York State Gas Service Territories Interstate pipelines provide a transportation service, moving gas from producing and/or storage areas, for their customers such as gas utilities and electric generators. The interstate pipelines serving the northeast are illustrated in Figure 2. Interstate pipeline companies do not sell the gas commodity; customers, such 4 Dominion Transmission Inc. (Dominion), Columbia Gas Transmission Corp. (Columbia), Empire State Pipeline Co. (Empire), Iroquois Gas Transmission System (IGTS), National Fuel Gas Supply Corporation (NFGS), Millennium Pipeline LLC (Millennium) and TransCanada Pipeline Limited (TCPL). 5 PSC. Case 89-G-078. Statement of Policy Regarding Rate Treatment to be Afforded the Expansion of Gas Service into New Franchise Areas. Issued and Effective December 11, 1989. 6 St. Lawrence Gas Company is considering a pipeline expansion from its existing facilities in St. Lawrence County to the Village of Chateaugay in Franklin County. Since the cost of the project cannot be supported by new customer revenues alone, potential additional dollars are being sought through the counties, municipalities, and State economic development funds. 4
Natural Gas Assessment
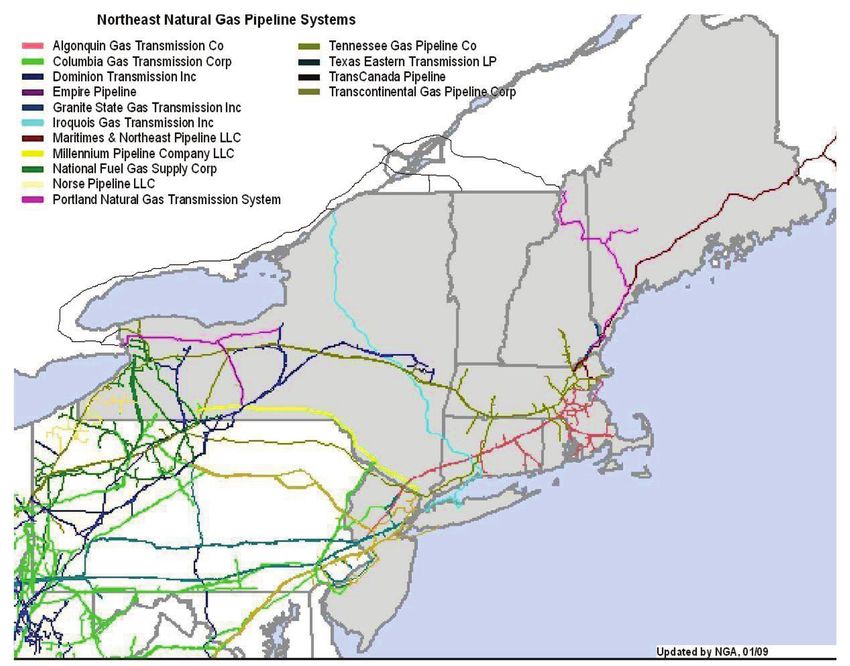
as the LDCs, purchase the natural gas from gas producers and gas marketers. The interstate pipelines are
regulated by the Federal Energy Regulatory Commission (FERC).
Figure 2. Northeast Natural Gas Pipeline Systems
Natural gas storage plays a significant role in meeting the State’s weather sensitive gas needs. LDCs
access interstate pipeline and independently owned storage facilities located at different points along the
interstate pipeline systems in the natural gas production and market areas. Generally, the regulation of
existing storage facilities and certification of new facilities fall under FERC jurisdiction.
LDCs deliver natural gas to their customers on either a firm or interruptible basis.7 As explained below,
customers may also choose to purchase the commodity from the LDC or from another provider. Firm
deliveries are generally provided to residential and small commercial and industrial customers that do not
have alternative fuel burning capability. Interruptible delivery service is not guaranteed and is used by
larger customers, e.g., some apartment buildings, commercial and industrial customers that have alternate
fuel burning capability. Electric generators generally depend on interruptible delivery services whether or
not they have dual fuel capability.8
All customers have the right to purchase natural gas from either the LDC or an Energy Service Company
(ESCO). When customers opt to purchase gas supplies from the LDC, they are referred to as “sales
7
The same is true for interstate pipeline companies.
8
For reference, a residential customer in New York uses between 100 and 140 Dt per year, and about 1 Dt on a peak day. In
contrast, a 350 MW combined cycle electric generating plant uses about 54,000 Dt per day, assuming an 100 percent capacity
factor, and about 12,000,000 Dt per year, assuming a 60 percent annual capacity factor.
5Natural Gas Assessment customers.” Those who purchase the commodity from an ESCO are “transportation customers.” In this case, the LDC is simply providing the delivery service. Therefore, there are four possible combinations of delivery service and commodity service options: firm or interruptible utility provided gas, and firm or interruptible delivery service with gas provided by third parties. Approximately 14 percent of residential customers purchase gas from ESCOs, as do 29 percent of small commercial and industrial customers, 41 percent of larger industrial customers, and virtually all electricity generators. LDC rates have been unbundled into separate delivery and commodity charges to facilitate customer choice and competition among commodity suppliers. Natural gas supply purchased by LDCs is passed on to their “sales” customers at cost, without any markup or profit. 6
3 Natural Gas Demand, Supply and Price
3.1     United States Demand
Natural gas consumption comprises about 23 percent of the total energy consumption in the United
States. Natural gas is used for many purposes: home space and water heating, cooking, commercial and
industrial space heating, commercial and industrial processes, as a raw material for the manufacture of
fertilizer, plastics, and petrochemicals, as vehicle fuel, and for electric generation. Over 50 percent of the
homes in the United States use natural gas as the primary heating fuel. In 2008, U.S. natural gas
consumption totaled about 23.2 trillion cubic feet, nearly matching the peak consumption of 23.3 trillion
cubic feet reached in 2000. Figure 3 presents U.S. historical natural gas demand by sector.

Figure 3. U.S. Natural Gas Consumption by Sector, 1999 to 2008 (TCF)

                                                             U.S. Natural Gas Consumption by Sector 1999-2008 in TCF

                                        25.00

                                        20.00
            Trillion Cubic Feet (TCF)

                                        15.00

                                        10.00

                                         5.00

                                         0.00
                                            1999      2000    2001            2002   2003          2004   2005         2006      2007          2008
                                                                                            Year

                                                   Other        Residential           Commercial          Industrial          Electric Power

   Source: EIA. Natural Gas Consumption by End Use. 2009. http://tonto.eia.doe.gov/dnav/ng/ng_cons_sum_dcu_nus_a.htm

Nationally, the electric generation sector consumed about 6.7 trillion cubic feet, accounting for about 29
percent of total U.S. natural gas demand for 2008. There has been significant growth in the use of natural
gas for electric generation, and it has increased about 40 percent from 1999 levels.

The residential sector represents about 4.9 trillion cubic feet or 21 percent of total U.S. natural gas
consumption for 2008. Residential natural gas demand is largely a function of heating demand and is
highly weather sensitive. Over 70 percent of annual residential consumption occurs during the five winter
months (November through March). The commercial sector represents about 3 trillion cubic feet or 13
percent of total U.S. natural gas consumption for 2008. Demand in the commercial sector has been
relatively flat over the past ten years. The industrial sector accounted for approximately 6.7 trillion cubic

                                                                                                                                                      7
Natural Gas Assessment
feet or 29 percent of total U.S. natural gas consumption in 2008. Demand in the industrial sector has
decreased about 18 percent in the last decade. Other uses of natural gas, including natural gas drilling
operations, pipeline delivery, and transportation, accounted for about 1.9 trillion cubic feet of total natural
gas consumption in 2008.9
3.2 New York State Demand
New York is the fourth largest natural gas consuming state in the nation using about 1,200 billion cubic
feet of natural gas per year, accounting for about five percent of U.S. demand.10
In 2008, New York’s 4.3 million residential customers used about 393 billion cubic feet of natural gas or
33 percent of total statewide gas use. The State’s 394,000 commercial customers used about 292 billion
cubic feet or 25 percent of total natural gas use. Natural gas consumption in the residential and
commercial sectors in New York represents a larger proportion of the total consumption than U.S.
consumption for those sectors (21 and 13 percent, respectively). The primary use of natural gas in New
York for residential and small commercial customers is for space heating and is highly weather sensitive.
The State’s natural gas market is winter peaking with over 70 percent of residential and 60 percent of
commercial natural gas consumption occurring in the five winter months (November through March).
Figure 4 presents New York historical natural gas demand by sector.
Figure 4. New York State Natural Gas Consumption by Sector
New York State Natural Gas Consumption by Sector 1999-2008 in TCF
1.4
1.2
1
Trillion Cubic Feet (TCF)
0.8
0.6
0.4
0.2
0
1999 2000 2001 2002 2003 2004 2005 2006 2007 2008
Year
Other Residential Commercial Industrial Electric Power
Source: EIA. Natural Gas Consumption by End Use. 2009. http://tonto.eia.doe.gov/dnav/ng/ng_cons_sum_dcu_SNY_a.htm
9
“Other” uses include: 1.3 trillion cubic feet of natural gas consumed in natural gas drilling and processing operations; 0.6
trillion cubic feet of consumption for pipeline and distribution use; and 0.03 trillion cubic feet for vehicle fuel.
10
The 1,200 billion cubic feet includes: 393 billion cubic feet for the residential sector; 292 billion cubic feet for the commercial
sector; 83 billion cubic feet for the industrial sector; 404 billion cubic feet for the electric generation sector; and roughly 15
billion cubic feet for other uses (pipeline and distribution use and vehicle fuel).
8Natural Gas Assessment
Although the total number of residential and commercial natural gas customers has increased, particularly
in the downstate market area, overall statewide gas consumption has remained relatively flat for these
sectors. This can be attributed to decreased customer usage due to conservation measures and increased
efficiency for new natural gas appliances.11
Natural gas use in New York’s industrial sector accounts for about 83 billion cubic feet or seven percent
of total consumption in the state. Industrial consumption has decreased over the historic period due to
both the industrial manufacturing capacity leaving the State and the continued movement away from
energy intensive manufacturing processes towards less energy intensive processes. New York’s industrial
sector natural gas use is a much smaller percentage of overall State natural gas demand than that of the
national industrial use to total national gas demand.
In 2008, the electric generation sector used about 404 billion cubic feet of natural gas or 34 percent of the
State’s total natural gas consumption. Consumption of natural gas for electric generation has fluctuated
during the historic period 1999 through 2008. Much of this fluctuation can be attributed to economic fuel
switching by older, dual-fuel oil/gas steam plants and peak demand weather related variances. Natural
gas has become and will continue to be the fuel of choice for new and replacement generation in New
York for the next several years due to its economic, operational and environmental advantages. In
general, natural gas-fired generation plants have lower capital costs, are cleaner burning, are more energy-
efficient, and have a greater degree of operational flexibility than other fossil fueled alternatives.
Between 2001 and 2007, approximately 5,000 MW of new natural gas-fired combined cycle and
combustion turbine capacity was built in New York. During the same period, about 3,000 MW of older
dual-fuel (oil and natural gas) units were retired. About 31 percent of electricity generated in New York
was fueled by natural gas in 2007.12
3.3 U.S. Natural Gas Supplies
Since natural gas is a national market, developments nationwide regarding gas supply are critical to the
State. Below are highlights of noteworthy aspects of U.S. natural gas supply.
U.S. natural gas dry production totaled 20.5 trillion cubic feet in 2008, which was six percent higher than
in 2007.13 About 98 percent of the natural gas produced in the United States comes from production areas
in the lower 48 States.14
As shown in Figure 5, the overall U.S. dry natural gas production has been relatively flat over much of the
last ten years. However, in the past few years, there has been a significant shift in gas supplies from
conventional or traditional supply areas and sources to unconventional or new supply areas and sources.
U.S. natural gas production from traditional, more mature and accessible natural gas supply basins, has
steadily declined. However, this decline has been offset by increased drilling activities and by increased
11
Historic consumption has not been normalized for weather.
12
2007 was latest available EIA generation statistics by energy source. http://www.eia.doe.gov/cneaf/electricity/epa/generation_
state.xls
13
Natural gas produced from a well may contain liquid hydrocarbons which are removed at a natural gas processing plant and the
gas is then considered “dry” and is sent to pipelines for delivery to customers.
14
Natural gas production from Alaska currently accounts for about two percent of the total U.S. dry natural gas production.
9Natural Gas Assessment
production from new unconventional gas supply areas.15 In 2008, natural gas production from new
supply resources totaled about 10.4 trillion cubic feet (28.5 billion cubic feet per day) or about 51 percent
of the total U.S. dry natural gas production.16
Figure 5. U.S. Dry Natural Gas Production
U.S. Dry Natural Gas Production (Tcf/year)
25.00
20.00
15.00
Tcf/year
10.00
5.00
-
1999 2000 2001 2002 2003 2004 2005 2006 2007 2008
Conventional Unconventional
Source: EIA. Natural Gas Production Data. http://www.eia.doe.gov/oil_gas/natural_gas/info_glance/natural_gas.html
Higher natural gas prices resulted in increased drilling activity, particularly in areas that were formerly
too expensive to develop. Higher prices have also contributed to the development of improved drilling
and production technology that has allowed for the economic production of natural gas in deep water
areas in the Gulf of Mexico and other large unconventional resources.
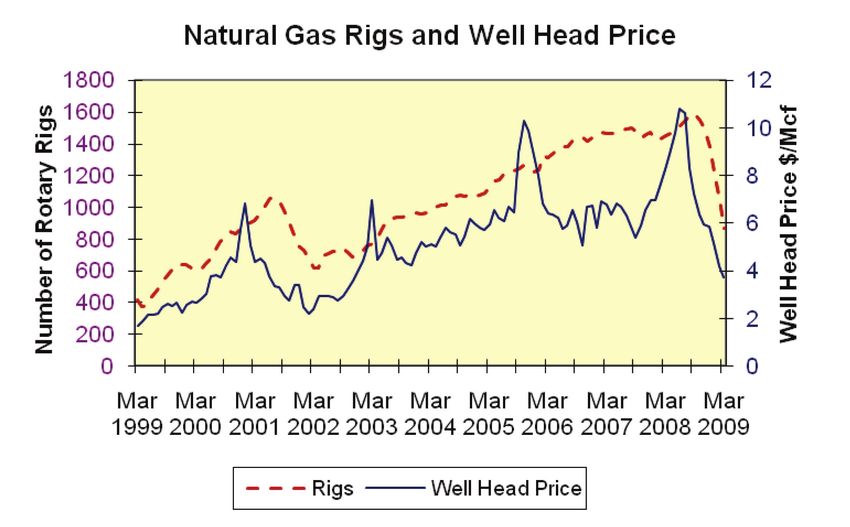
As shown in Figure 6, natural gas prices peaked in the summer of 2008 and are much lower now, which
has resulted in a decline in drilling activity. Total natural gas drilling rigs in operation have declined by
over 50 percent from the September 2008 peak. Although a corresponding decline in natural gas
production has yet to appear in available data through March 2009, a decline in natural gas production is
expected for the balance of 2009 and will continue into 2010. As the economy improves, the demand and
supply balance tightens, and natural gas prices increase, production is expected to respond adequately. It
is anticipated that natural gas prices and the number of operational drilling rigs need not return to 2008
levels for production to increase. Recent improvements in technology have reduced finding and
15
Unconventional natural gas is a widely used industry term and generally refers to gas that is more difficult and more expensive
to extract which usually involves new and developing production and well drilling technologies. Examples of what may
currently be considered unconventional sources of natural gas are: deep natural gas – gas that is beyond conventional well
drilling depths; tight sands natural gas; shale gas; coal bed methane gas; geopressurized zone gas; and methane hydrate gas. As
production from current unconventional sources matures and the technology used is more fully developed the sources may evolve
into being considered conventional.
16
For 2008, unconventional natural gas production is based on forecast EIA data, since actual unconventional production data
has not been finalized.
10Natural Gas Assessment
development costs, lowered well completion times, and enhanced well productivity, increasing the natural
gas production potential from domestic sources.17
Figure 6. Natural Gas Rigs and Well Head Price
Source: EIA. U.S. Natural Gas Rotary Rigs in Operation. 2009. http://tonto.eia.doe.gov/dnav/pet/hist/e_ertrrg_xr0_nus_cm.htm
The increased production from unconventional resources is primarily from tight sands, coal-bed methane,
and shale formations. The Rocky Mountain Region is the fastest growing region for tight sands natural
gas production and the predominate region for coal-bed methane natural gas production in the United
States. There are at least 21 shale gas basins located in over 20 states in the United States. Currently, the
most prolific shale producing areas in the country are in the southeast region and include the Barnett
Shale area in Texas, the Haynesville Shale in Texas and Louisiana, the Woodford Shale in Oklahoma and
the Fayetteville Shale in Arkansas. In the Appalachian region, which extends into New York, the
Marcellus Shale is expected to develop into a major natural gas production area.
Proven natural gas reserves for the United States totaled over 237 trillion cubic feet at the end of 2007, an
increase of about 12 percent over 2006 levels.18 The increase in reserves was the ninth year in a row that
U.S. natural gas proven reserves have increased.
17
EIA. Short Term Energy Outlook. 2009. http://eia.doe.gov/steo
18
The latest EIA proven reserves data is for 2007. Proven natural gas reserves are those which analysis of geologic and
engineering data demonstrates with reasonable certainty to be recoverable from known reservoirs, under existing economic and
operating conditions. http://tonto.eia.doe.gov/dnav/ng/ng_enr_dry_dcu_NUS_a.htm
11Natural Gas Assessment
3.4 Natural Gas Storage
Natural gas storage is essential in meeting customer demands. The natural gas demand cycle is highly
weather related, while supplies tend to be relatively stable. In order to ensure sufficient natural gas
supplies to meet customer requirements, gas is injected into underground natural gas storage facilities
during lower demand periods, typically April through October, and withdrawn from storage during the
higher demand winter season. However, with the recent trend towards natural gas-fired electric
generation, demand for natural gas during the summer months is now increasing. Natural gas storage also
serves as insurance against unforeseen incidents, such as natural disasters (hurricanes), or other incidents
that may affect the production or delivery of natural gas. There are approximately 400 natural gas storage
facilities in the United States with a total working gas storage capacity of approximately 3.8 trillion cubic
feet of natural gas.
Natural gas storage plays a significant role in meeting the State’s weather sensitive gas needs.
Approximately 35 to 40 percent of LDCs winter gas requirements are met through gas withdrawn from
storage facilities, primarily depleted gas wells, located in Pennsylvania and western New York.19
Generally, using storage facilities that are close to market is an economic way to meet seasonal demands.
The alternative would be to build additional pipeline capacity all the way back to the gas production
areas. In addition, some LDCs have peaking supplies such as liquefied natural gas or propane plants
located within their service territories that are critical to meeting gas demand on peak winter days.
3.5 Imports of Natural Gas
In 2008, the United States imported approximately 4 trillion cubic feet of natural gas mainly from Canada
along with some Liquefied Natural Gas (LNG) from a number of countries. Canada has been an
important source of supply to meet U.S. natural gas requirements. Imports from Canada totaled about 3.6
trillion cubic feet 20 and account for about 90 percent of total imports and 15.5 percent of the total U.S.
natural gas requirements.
Canada’s production from its primary resource region, the Western Canadian Sedimentary Basin, has
been relatively flat over the last ten years and is expected to decline over time. Moreover, Canada’s
natural gas consumption has been increasing for industrial and electric generation requirements. The
combination of falling Canadian natural gas production and increasing demand is expected to result in
decreased natural gas exports to the United States. Potential new Canadian unconventional production
from shale formations may mitigate declines in production.
Another source of the U.S. natural gas supply is from imported LNG. In 2008, the U.S. received about
400 billion cubic feet (1.1 billion cubic feet per day) of LNG imports, a decrease from 2007 levels which
were 771 billion cubic feet (2.11 billion cubic feet per day). The 2008 annual LNG imports represent
about 1.7 percent of total U.S. natural gas requirements. The principal reasons for the decline in LNG
deliveries were that 2008 LNG prices in the United States were lower than prices in other parts of the
LNG-importing world and Asian and European demand for LNG was high. Figure 7 illustrates the LNG
price variations around the world.
19
The storage fields in Pennsylvania and New York have total working gas storage capacity of about 390 billion cubic feet and
100 billion cubic feet respectively.
20
The United States exported 0.6 Tcf to Canada in 2008, therefore, U.S. net Canadian imports for 2007 were 3 Tcf.
12Natural Gas Assessment
Due to the world-wide economic recession, world LNG prices have fallen substantially, demand in Asia
and Europe has fallen off. Meanwhile, additional world LNG supplies are scheduled to come on-line. It
is expected that LNG deliveries to the United States in 2009 will increase over 2008 levels.
Figure 7. World LNG Landed Price Estimates for June 2009
World LNG Landed Price Estimates for June 2009
Source: FERC Monthly LNG Market Report $/MMBtu
The U.S. domestic production in the lower 48 states has increased with the development of new supply
basins, so the need for substantial increased volumes of imported LNG has diminished for the near term.
However, if new domestic production is not able to more than offset declining older production and meet
increasing demand, the United States will need incremental LNG imports.
Currently, there is more import and re-gasification capacity built in the world than there is liquefaction
and export capability. Some experts predict that as liquefaction capacity is completed, world supply
dynamics will change. The increased ability to liquefy and put the product out on the world market
should put downward pressure on world prices, and U.S. prices should be able to better compete for LNG
cargoes in the world market.
The United States has eight existing LNG receiving re-gasification terminals with a total capacity of
about 11.54 billion cubic feet per day, which far exceeds the current LNG import levels.21 In addition to
the existing LNG terminals, there are 22 U.S. and four Canadian LNG import terminals that have received
FERC, Maritimes Administration (MARAD/Coast Guard), and National Energy Board of Canada (NEB)
certification approval. There are also an additional nine U.S. LNG terminal proposals that are in various
stages of the FERC and MARAD certification processes.22
21
Existing LNG Terminals: DOMAC LNG, Everett, Mass.; Dominion Cove Point LNG, Cove Point, MD.; El Paso Southern
LNG, Elba Island, GA; Southern Union Trunkline LNG, Lake Charles, LA; Gulf Gateway Energy Bridge, Gulf of Mexico;
Northeast Gateway, Offshore Boston, MA; Cheniere Freeport LNG, Freeport, TX; and Sabine Pass Cheniere LNG, Sabine, LA.
22
FERC. LNG data. http://www.ferc.gov/industries/lng.asp#skipnavsub
13Natural Gas Assessment
3.6 New York State Natural Gas Supply Resources
Over 95 percent of the natural gas supply required to meet the demands of New York natural gas
customers is from natural gas supply production regions in other states, principally the Gulf Coast region,
and Canada. The gas supply is brought to the New York market by interstate pipelines that move the gas
from producing and storage areas for customers, such as LDCs and electric generators, who purchase the
gas supplies from gas producers and marketers.
New York natural gas production supplies about five percent of the State’s natural gas requirements.
Production of natural gas from wells in New York dates back to 1821 when the first commercial natural
gas well in the United States was drilled in Fredonia. Currently, there are about 6,700 active natural gas
wells in the State. For the 2008 calendar year, total reported State natural gas production was 50.3 billion
cubic feet, down nine percent from the 2006 record total of 55.2 billion cubic feet. These figures represent
an increase of over 200 percent since 1998 (16.7 billion cubic feet).23 The increase in New York natural
gas production is driven by prolific wells in the deep (7,000 to 11,800 feet) Trenton-Black River
formation in the Finger Lakes region. The largest area of production from this formation is in Chemung
and Steuben counties. Annual production from the formation has grown from about 1.6 billion cubic feet
in 1998 to over 40 billion cubic feet between 2005 and 2007, dropping to 34.8 billion cubic feet in 2008.
Trenton-Black River production accounts for about 69 percent of the State’s overall natural gas
production from just 100 producing wells, with one well alone producing about 2 billion cubic feet.24
The Marcellus Shale formation is attracting attention as a significant new source of natural gas production
in New York. The Marcellus Shale extends from Ohio through West Virginia and into Pennsylvania and
New York. Estimated natural gas reserves for the Marcellus Shale formation are very significant and it is
expected that the region will become a major natural gas production area in the United States. In New
York, the Marcellus Shale is located in much of the Southern Tier stretching from Chautauqua and Erie
counties in the west to the counties of Sullivan, Ulster, Greene and Albany in the east. While
economically recoverable natural gas reserves for the entire extent of the Marcellus Shale are estimated to
be up to 50 trillion cubic feet, it is not yet clear what fraction of that amount will be commercially
recoverable in New York.25
Horizontal well completions combined with hydraulic fracturing will provide the best means for
producing economic volumes of natural gas from the Marcellus Shale. While both horizontal drilling and
hydraulic fracturing are not new to natural gas development in New York, there are environmental
concerns with respect to the effects of fracturing on water supplies, and disposal and contamination issues
related to the chemical composition of the fluids used in the fracturing process. New York has a well
established regulatory program to oversee oil and gas drilling administered by the Department of
Environmental Conservation (DEC). There are regulations governing the well permitting, drilling
operations, and well site restoration when drilling is completed. To assess the potential environmental
concerns related to the development of the Marcellus Shale formation in New York, the DEC is reviewing
horizontal drilling and hydraulic fracturing in the context of a Supplemental Generic Environmental
Impact Statement (GEIS), which is expected to be finalized in 2010.
23
DEC. 2007 Annual Oil and Gas Production Data. 2008. http://www.dec.ny.gov/energy/36159.html
24
DEC. New York Oil, Gas and Mineral Resources. 2007. http://www.dec.ny.gov/pubs/36033.html
25
Geologists estimate that the entire Marcellus Shale formation contains between 168 and 516 Tcf of natural gas reserves and
that roughly 10 percent of those reserves are economically recoverable: http://www.dec.ny.gov/energy/46288.html
14Natural Gas Assessment
The extraction of projected economically recoverable reserves from the Marcellus Shale presents a unique
challenge with regard to the construction of the pipeline facilities necessary to tie this source into the
network and bring the produced gas to market. In the course of developing a conventional source of
natural gas, a company would drill a well and only if that well is successful, would it submit an Article
VII application to the PSC to construct the associated pipeline. It has been suggested that this procedure
may not be well suited for development of the Marcellus Shale. Some producers claim that the technique
used to tap into the Marcellus requires that the gas be produced immediately once the well has been
fractured and completed or the well may seal and cease to be productive. The Marcellus Shale formation
has a high concentration of clay, which makes it susceptible to re-closing if the gas does not flow
immediately. As a result, some producers contend that the pipeline must be certified, built, and ready to
accept gas before knowing for certain that the well will be a success.
3.7 Natural Gas Prices
The natural gas market price paid by customers is composed of three major components: the wellhead
price paid to the producer, interstate gas pipeline transportation costs, and the local distribution
company’s delivery charge.
As shown in Figure 8, natural gas commodity prices have shown an increasing trend with a high degree of
volatility over the past 10 years. Natural gas commodity prices have ranged from approximately $2 per
MMBtu in early 1999 to peaks as high as $12 to $14 per MMBtu in recent years.26 The NYMEX gas
commodity price in the third quarter of 2009 was in the $4 to $5 per MMBtu range. There are several
interrelated reasons for these changes, including higher oil prices, increased nationwide gas demand and a
general tightening in the national gas supply/ demand balance, hurricane seasonal damage to production
facilities, and the increased participation by non-commercial entities in the natural gas financial market.27
26
Based on New York Mercantile Exchange (NYMEX) data. Gas prices on the NYMEX are quoted for delivery at the Henry
Hub. The Henry Hub is a major interconnection point, or transportation hub, on the U.S. natural gas pipeline system located in
Louisiana, interconnecting with nine interstate and four intrastate pipelines. Price differentials, or basis, between the Henry Hub
and city gate delivery points reflect pipeline transportation services.
27
Natural gas is traded as the value of a commodity and natural gas prices are determined through the interaction of two types of
markets for natural gas; the physical market, which involves the purchase and sale of physical quantities of natural gas; and the
financial market, which involves the purchase and sale of derivatives and financial instruments in which the buyer and seller
seldom take physical delivery of the natural gas.
15Natural Gas Assessment
Figure 8. NYMEX Monthly Closing Price
NYMEX Monthly Closing Price ($/MMBtu)
16.00
14.00
12.00
10.00
8.00
6.00
4.00
2.00
-
Nov-99
Nov-00
Nov-01
Nov-02
Nov-03
Nov-04
Nov-05
Nov-06
Nov-07
Nov-08
May-99
May-00
May-01
May-02
May-03
May-04
May-05
May-06
May-07
May-08
May-09
Source: NYMEX. Monthly Closing Price.
One of the most significant impacts to prices during the last 10 years was caused by hurricanes Katrina
and Rita in 2005. As the storms made their way through the Gulf of Mexico, they damaged oil and gas
production platforms, refineries, and processing plants which resulted in prices soaring to unprecedented
levels ($14 per MMBtu during the month of November 2005).
Prior to Katrina and Rita, prices tended to follow a somewhat more predictable pattern with prices
increasing in the winter when demand increased and dropping during the summer months when demand
lessened. By the spring of 2006, prices were back down to the average levels of the period 2003 to 2005
(pre-Katrina) with the price for natural gas averaging approximately $7 per MMBtu.
During the following winter of 2006/2007, gas prices did not display the typical heating season increases
that had been experienced in 2003 and 2004. Instead, prices tended to remain fairly constant during the
period, with a noticeable drop in prices during the summer of 2007. The fact that little to no hurricane
activity in the Gulf of Mexico was experienced in 2006 and 2007 may have contributed to the relative
stability in prices. The winter of 2007/2008, however, saw the start of a large increase in prices which
reached a peak in July 2008 near $13 per MMBtu, which was a level never before experienced during any
previous summer. Many factors could have contributed to this spike in a non-heating period which
historically does not produce dramatic increases in prices, including record high world oil prices.
Speculators in the natural gas financial market are also thought to have contributed to the spike in prices
during this period.
Since the 2008 summer natural gas price peak, prices have steadily fallen to levels that have not been seen
in close to six years. Several supply, demand and economic factors contributed to the decline in gas
prices: high natural gas storage levels, increased onshore natural gas production, the general economic
downturn and its negative impact on gas demand and prices, as well as the collapse of world oil prices.
16Natural Gas Assessment
The 2008 hurricane season was the most active since 2005 and hurricanes Gustav and Ike, while not as
devastating as Rita and Katrina, caused significant damage to oil and gas production facilities in the Gulf
region in September 2008. Despite the hurricane activity there was not a significant spike in natural gas
prices during the fall of 2008 and the downward trend in prices continued into 2009 with prices appearing
to stabilize in the $3 to $5 per MMBtu range.
Retail prices include the commodity cost of natural gas and the pipeline and LDC delivery charges. Since
the commodity price makes up a significant portion of the customer’s delivered price, retail prices have
exhibited a similar pattern of growth and volatility. As shown in Figure 9, the average delivered price of
natural gas to residential customers in New York was about $8.20 per MMBtu in January 1999, climbing
to $24.50 per MMBtu in August 2008, and decreasing to about $15 per MMBtu in March 2009. New
York average delivered price to customers is approximately $3.00 per MMBtu higher than the national
average.
Figure 9. Natural Gas Prices for Residential Customers
Natural Gas Prices for Residential Customers
30.00
25.00
20.00
$/Mcf
15.00
10.00
5.00
-
United States New York State
Source: EIA. Natural Gas Prices. 2009. http://tonto.eia.doe.gov/dnav/ng/ng_pri_sum_dcu_nus_a.htm
Because of the historically volatile nature of gas prices, the PSC expects LDCs to diversify the pricing of
their gas purchases in order to ameliorate price volatility. The PSC issued a Gas Purchasing Policy
Statement in 1998, which outlined the purchasing options that a diversified supply portfolio might
include. 28 Among these options are a blend of short and long-term fixed price purchases, spot
acquisitions, use of physical and financial hedges, and contracts that provide flexibility in the amount of
gas taken. The policy is intended to mitigate the effect of price volatility on customers’ bills. However,
the policy also acknowledges that market price fluctuations cannot be predicted with great accuracy and
therefore the weighted average price of a sufficiently diversified gas supply portfolio may turn out to be
28
PSC. Case 97-G-0600. Request for Gas Distribution Companies to Reduce Gas Cost Volatility and Provide for Alternate Gas
Purchasing Mechanisms, Statement of Policy on Gas Purchasing Practices. Issued April 28, 1998.
17Natural Gas Assessment lower or higher than the prevailing market price. The PSC stated that excessive reliance on any one gas pricing mechanism or strategy does not appear to reflect the best management of the gas portfolio and any LDC without a diversified gas purchasing strategy will have to meet a heavy burden to demonstrate that its approach is reasonable. 18
4 Natural Gas System Modeling and Analysis
4.1         Analytic Approach
In order to assess the adequacy of the natural gas delivery system, the combined gas requirements of the
electric generation and residential, commercial and industrial gas utility customers must be considered
together and compared to available pipeline delivery capacity at peak periods. This is the analytical
challenge that the Plan has addressed through modeling of New York’s natural gas and electric systems.

The natural gas interstate transmission system is sized to supply fuel to customers with firm contracts
whose natural gas needs peak in the winter. For the most part electric generators rely upon interruptible
service, which entitles generators to utilize available capacity when it is not needed to serve customers
with firm contracts. At present, the electric generation sector is increasingly reliant on natural gas for a
number of reasons: it is cheaper than oil; it meets increasingly strict environmental requirements; and it
requires no significant on-site fuel storage. The reliance of electric generation on natural gas, coupled
with the reliance on interruptible services for the delivery of that gas, raises reliability concerns regarding
the adequacy of the natural gas infrastructure to support electric generation requirements.

Generally, the peak need for natural gas for electric generation occurs in the summer, but some dual-fuel
electric generators may require gas during peak winter months. However, during peak winter months
customers with firm capacity contracts may require the entire available capacity leaving no pipeline
capacity for electric generators and other interruptible customers. Many generators have dual-fuel
capability allowing them to burn an alternate fuel, typically distillate fuel oil,29 during times when natural
gas supplies are limited.30 As long as there are adequate units that are dual-fueled, and there is alternate
fuel available and generators are permitted to use it, reliance on interruptible services represents an
efficient utilization of assets. During times of peak gas system demands, electric reliability could be
impaired if there is a lack of ability to burn alternate fuels, either because not enough units have alternate
fuel ability, or if their alternate fuel is not available due to either supply or environment limitations.

This reliability concern could deepen as some of the older dual-fuel units are replaced with newer units
fueled only with natural gas. Many of the older existing base load generation facilities, particularly in
New York’s downstate region, use natural gas with residual fuel oil as backup fuel. These plants
typically have a large amount of residual oil storage capacity on-site, and are virtually not limited as to
how much oil they can burn. Newer, gas-fired combined cycle generation facilities typically use distillate
oil as an alternate fuel and have limited ability to burn such oil, typically limited to 720 hours or 30
days.31 These plants have very limited oil storage capacity on-site, typically only enough for a few days.
These newer gas units, however, benefit the gas system in that they use less gas per kilowatt-hour

29
     Distillate fuel oil includes No. 2 heating oil, kerosene, diesel fuel, and jet fuel.
30
     Generators without dual-fuel capability will not operate if they do not have firm contracts and gas supplies are not available.
31
  The air emission rules provide for new facilities to opt for different levels of oil burn. However, permits that would allow
more oil burning require installation of more expensive equipment to reduce emission levels. The additional equipment that
would be required to meet the emissions requirements adds cost to the facility, so new facilities generally opt for the permit that
provides for the limited burning of oils as the lower cost alternative.

                                                                                                                                       19
Natural Gas Assessment generated. This improved efficiency may assist in lowering the annual electric generation natural gas demand (TBtu), while the GWh generated by natural gas-fired units is projected to increase. While a requirement that generators hold more gas pipeline on a firm basis would resolve the issue,32 there would be a myriad of issues involved in accomplishing that, given the competitive structure of the generation market. Such issues as who would acquire the capacity, how much would be required, how would it be paid for, and how would it be made available to generators who needed it would need to be addressed. An important related issue is the availability of distillate oil in sufficient quantities to meet the demands of generators when natural gas deliveries are not available. This issue will be addressed further in both this Assessment and the Petroleum Assessment. 4.2 Model Scenarios A combination of five different models was used to assess the adequacy of the natural gas delivery system to meet the needs of both the electric power and “core” natural gas markets.33 The Integrated Planning Model (IPM) was used to determine the electric system growth and system dynamics at the national and regional levels, consistent with the Electricity Assessment. The output of IPM, which includes new generator data such as installation date, size, and fuel type, was used as input to the General Electric Multi-Area Production Simulation (MAPS) model. MAPS economically dispatches individual electric generators and the output contains generator specific information, including generator run time, fuel usage, and emissions. This results in detailed gas usage by generation unit, at all locations in the State. Three models were then used to assess the adequacy of the natural gas system: the Gas Market Model (GMM), the Gas Production Cost Model (GPCM), and the Regional Infrastructure Assessment Modeling System (RIAMS). GMM is a national network model that was used to determine the overall supply, demand, and prices of natural gas for each of the scenarios. GPCM was used to determine the utilization of New York- specific infrastructure and identify any potential bottlenecks on an annual basis. RIAMS was used to project daily and seasonal constraints on New York’s natural gas delivery system.34 Using this suite of models, a Reference Case and four scenarios were examined: 1) retirement of the Indian Point nuclear units and replacing them with gas-fired generation; 2) re-powering existing downstate oil- fired units with gas-fired facilities; 3) much colder than normal weather conditions; and 4) combination of the other three scenarios.35 32 Historically, from a generator’s perspective, committing to pay on a year round basis for firm pipeline capacity when the generator does not know when it will be dispatched, is generally not economically viable and may result in increasing retail electricity costs. 33 These models were provided by ICF International (ICF), a consulting firm that has considerable experience modeling New York’s power systems. ICF, under contract with NYSERDA and under the direction of NYSERDA and DPS, conducted studies using the models to evaluate the ability of the electric and gas systems to simultaneously meet their demands and to identify any potential problems that could adversely affect the reliability of the electric system over the planning period from 2009 to 2019. ICF developed the modeling databases by acquiring New York Independent System Operator (NYISO) data, historic gas usage provided by LDCs, and other proprietary information. 34 RIAMS is an economic mathematical model, which is less granular than a traditional hydraulic model; it is a reasonable choice considering monetary and time constraints. 35 The Reference Case and scenarios reflect the carbon policy developed under the Regional Greenhouse Gas Initiative (RGGI) and do not reflect a national carbon policy. 20
Natural Gas Assessment

4.3       Key Assumptions
The modeling effort reflects the following key assumptions:

     •    U.S. GDP growth of 3.0 percent annually
     •    New York GDP growth of 2.8 percent annually
     •    Long-term Refiners Acquisition Cost of Crude Oil (RACC) of $65/bbl in 2008 dollars
     •    No U.S. carbon policy
     •    Normal weather based upon a 30-year average except for the much colder than normal weather
          scenario and the combination scenario
     •    The model’s peak day analysis is based on average temperatures, which are about 95 percent of
          design day temperatures36
     •    Recently completed pipeline expansion projects, including the Millennium Pipeline and Empire
          Connector, and associated expansions on Algonquin and Iroquois, and the Transcontinental Leidy
          to Long Island project
     •    A recently completed storage project “Thomas Corners” in western New York
     •    Completion of the Maritimes and Northeast Phase 4 project in New England
     •    Completion of the Texas Eastern TIME II project in Pennsylvania and New Jersey
     •    Completion of the Spectra Steckman Ridge and Dominion Storage Factory projects in
          Pennsylvania

These key assumptions were used in all of the natural gas modeling scenarios presented below.

4.4       Reference Case: Gas Demand and Supply Projections
The results of the modeling are presented below. It is important to recognize that many assumptions go
into such a modeling effort, and while the results provide a valuable tool for understanding the expected
trends in the market, the accuracy of the results is limited to the strength of the assumptions. While every
effort has been made to reflect the most accurate assumptions available, given the uncertainty surrounding
market changes it is best when interpreting the results to err on the conservative side in order to ensure
reliability. For example, while efforts to directly reduce gas demand through efficiency programs have
been initiated in New York, electric efficiency efforts in this State may increase gas demand by
encouraging conversion of certain electric appliances, e.g., water heaters, to natural gas. Therefore, a
simple comparison of the models’ numerical results, e.g., demand versus supply projections, needs to be
tempered with an understanding of the underlying markets. Further, all of these analyses assume that all
elements of the gas system, such as pipelines, compressors and production facilities are operating as
designed. The vulnerability of the State from pipeline or compressor failures has not been assessed and
would need to be examined as part of a separate contingency analysis.

The projections of national and New York demand and supply for natural gas, as described below, result
from the ICF International natural gas and electric system models.

36
  For this modeling effort, design day temperature is defined as temperatures 10 percent colder than normal. For this analysis,
this equates to an average daily temperature in New York City of 5º F and in Buffalo an average daily temperature of -3º F.

                                                                                                                              21
Natural Gas Assessment
4.5 U.S. Natural Gas Demand
The projections for the residential, commercial and industrial sectors show steady growth, but are
moderated by demand side management (DSM), conservation and efficiency gains.37 The U.S. natural
gas demand for electric power generation is expected to increase by about 2.5 percent annually as both the
electricity demand and the use of natural gas to fuel power plants increases. As shown in Figure 10, the
U.S. power sector natural gas consumption is expected to increase by about 2.1 trillion cubic feet by
2020.
Figure 10. U.S. and Canada Gas Consumption
U.S. & Canada Gas Consumption
(Trillion Cubic Feet, Tcf)
35 Delta Delta
2007-2013 2007-2020
30
1.7 2.1
25 Power
Generation
20
0.7 1.3
Industrial
15
10 Commercial 0.3 0.4
Residential 0.4 0.7
5
Other 0.2 0.3
0
2000 2005 2010 2015 2020
Total 3.2 Tcf 4.8 Tcf
Source: ICF International. March 2009.
As the demand for electric generation capacity increases, natural gas is expected to continue to be an
important fuel of choice for new electric generation facilities. Since 1998, natural gas-fired combined
cycle and combustion turbine capacity grew by over 200,000 MW in the United States. Gas-fired plants
have continued to be favored due to relatively low capital costs and low pollutant emissions.
Currently, gas-fired electric generation makes up about 20 percent of the total U.S. electric generation
capacity. In the next 10 years, it is projected that gas-fired electric generation will grow to about 26
percent of total U.S. generation. Natural gas will act as an important bridge fuel for the implementation
of a carbon-limiting policy. The growth in gas-fired electric generation is expected to slow after 2015, as
new advanced coal generation units, renewable capacity, and some new nuclear generation facilities enter
the electric generation market.
37
U.S. projected average annual demand growth rates are 0.9 percent for the residential sector; 0.9 percent for the commercial
sector; and 1.0 percent for the industrial sector.
22Natural Gas Assessment
4.6 U.S. Gas Supply
North American gas supply is projected to increase over the forecast period in order to satisfy increased
demand. As shown in Figure 11, dry natural gas production for the United States and Canada is expected
to increase by about 30 percent from about 26.2 trillion cubic feet in 2007 to 30.6 trillion cubic feet in
2020. Declining production from conventional natural gas supply basins will be more than offset by
increases in production from unconventional sources and increased LNG imports over the forecast period.
Figure 11. The Changing Gas Supply Mix
The Changing Gas Supply Mix (Tcf per Year)
Source: ICF International. March 2009.
4.7 Lower 48 U.S. Production
Production from the Lower 48 States is projected to increase from about 19.2 trillion cubic feet in 2007 to
24.2 trillion cubic feet in 2020. The projected increase in Lower 48 production is attributed to increasing
natural gas production in new supply sources38 and deepwater Gulf of Mexico offshore regions.
Projected growth in production from new supply sources and deepwater Gulf of Mexico are partially
offset by projected declines in conventional existing production.
4.8 Alaskan Natural Gas Production
Alaskan gas production is gas produced in association with oil production on the Alaskan North Slope,
and the majority of the gas currently produced is re-injected into the supply basin. Current annual
Alaskan marketed gas production is about 420 billion cubic feet. The Alaskan Gas Pipeline is projected
to be in-service starting in 2020, assuming that the project can obtain adequate financing, and will provide
additional supplies to the Lower 48. The Alaskan Pipeline is projected to have an initial capacity of about
38
New supply sources would include unconventional basins, such as tight sands, coalbed methane, and gas shale formations.
23Natural Gas Assessment
1.46 trillion cubic feet (4 billion cubic feet per day), and expanding in 2023 by another 0.7 trillion cubic
feet (2 billion cubic feet per day).
4.9 Canadian Supply
Canadian production is expected to decline by about 700 billion cubic feet (1.9 billion cubic feet per day)
by 2020. The decline in production will be partially offset by increased LNG imports to Canada.
Coupled with the projected decline in net Canadian supply is a projected increase in Canadian domestic
demand particularly in the electric power generation and industrial sectors. As a result, it is expected that
the amount of Canadian gas available to export to the United States will decline by about 1.5 trillion cubic
feet (4.1 billion cubic feet per day) by 2020.
4.10 LNG
It is expected that LNG imports to North America will increase from current levels of 2.3 billion cubic
feet per day in 2007 to 3.9 billion cubic feet per day by 2013, and 6.2 billion cubic feet per day by 2020,
supplying about six percent of U.S. and Canadian gas needs by 2020 as shown in Figure 12. North
American re-gasification capacity is expected to continue to exceed LNG deliveries. Utilization of North
American re-gasification facilities averages about 20 percent of capacity throughout the projection period.
Figure 12. North American LNG Imports
North American LNG Imports
7
6
Mexico
5
4
U.S. Gulf Coast
3
2
U.S. & Canada East Coast
1
0
2005 2010 2015 2020
Source: ICF International. March 2009.
For 2008, U.S. LNG imports were below recent prior levels due to lower U.S. market prices versus the
global market. LNG prices in Europe were nearly double U.S. market prices, and Asian prices have been
three times the U.S. market price in 2008. European and Asian markets are heavily dependent on LNG to
meet their gas demand. The Asian markets are tied to oil prices, so given the disparity between natural
24Natural Gas Assessment
gas and oil prices, cargoes of LNG will seek those markets first, followed by European markets, before
gas is delivered to American LNG re-gasification facilities.39
While it would be preferable not to depend upon imported energy supplies if domestic energy supplies
can meet all of our needs, avoidance of additional gas imports may not be sustainable in the long run.
Further, there are advantages in having a diversified portfolio of supplies available to meet growing
market needs. Having the flexibility to be able to accept LNG imports could provide New York with
added supply access and options that could serve to put downward pressure on prices in the future,
particularly during periods of high demand.
39
A possible exception would be if a long-term contract exists between the LNG receiving terminal and an LNG supplier. The
existing LNG facility in Everett, Massachusetts, which has been in operation for over 30 years, has a long-term contract with its
LNG supplier.
25You can also read