Structure and Importance of the U.S. Pork Industry
←
→
Page content transcription
If your browser does not render page correctly, please read the page content below
Structure and Importance of the U.S. Pork Industry

                                                    Dr. Steve R. Meyer
                                            Partners for Production Agriculture

                                                    Dr. Barry Goodwin
                                              North Carolina State University

Disclaimer: The opinions expressed in this document are held solely by its authors and do not represent the views or opinions of
any other organization, regardless of affiliation.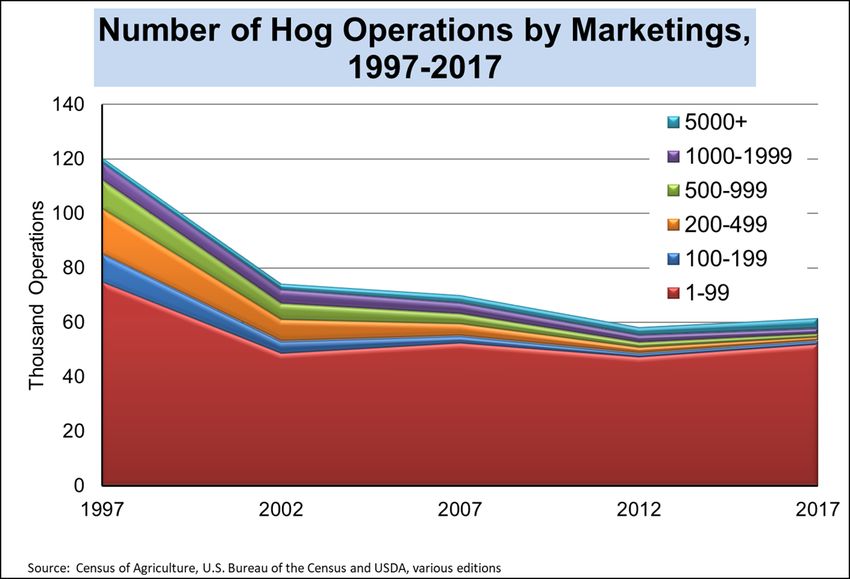
Executive Summary
Pork production is a major contributor to the U.S. economy. While there are only 66,000 pork
producers, the 131 million animals they marketed in 2020 provided over $22 billion in cash
receipts in 2020. In a report based on 2016 data, Iowa State University economists found that
the industry was responsible for nearly 514,000 jobs in the United States. Pork producers used
roughly 1.1 billion bushels of corn and the soybean meal from 455 million bushels of soybeans
in 2020. Much of this impact is centered in major production states from the Dakotas and
Nebraska eastward across the Corn Belt all the way to Pennsylvania. In addition, North Carolina
is the third largest hog producing state and there is a major production and processing area in the
Oklahoma and Texas panhandles and southwest Kansas.
The number of U.S. hog operations has fallen sharply since the 1950s but has stabilized since
2000. Small operations with less than 100 pigs still account for the vast majority of farms, but
97.2 percent of all hogs are owned by operations with 1,000 head or more. Large farms own and
produce most of the hogs in the United States, but most of these large farms are still owned by
family enterprises. While “corporate” production does exist, it does not account for nearly as
high a percentage of total production as media reports purport.
The United States is a global leader in pork production. Its modern, efficient packing plants with
sterling food safety track records are a differentiator relative to other protein suppliers
domestically and around the world. The U.S. pork industry has added many modern plants since
the 1990s, including three brand new, state-of-the-art facilities since 2017. The pork packing
sector is indeed concentrated with the largest four firms holding about 64 percent of total
capacity in 2020. But the sector’s Herfindahl-Hirschman Index, the metric used by the U.S.
Department of Justice to gauge concentration and the potential for non-competitive behavior,
was roughly 1,345 in 2020, well below the DOJ’s critical level of 1,500 to demark a competitive
industry.
Pigs are produced in many manners, all of which have the goal of providing the best
environment for the animals and their caretakers and producing safe, wholesome pork. These
range from pasture production to climate-controlled barns. Some genetic lines are aimed at cost-
efficient production of lean pork products preferred by many consumers. Others are designed for
superior meat quality favored by other more flavor-influenced consumers. There is no right or
wrong way to raise a hog – just better or worse ways depending on climate, available feed
ingredients and specific end uses and grower and customer preferences.
USDA’s Economic Research Service estimates that just over 60 percent of all U.S. hogs were
produced using some form of production contract in 2017. Under these contracts, growers agree
to provide facilities, labor, utilities, and waste-nutrient management to contractors/integrators
who own pigs. Contractors/integrators provide the animals, feed, management oversight,
veterinary/medical supplies and services and transportation. Growers face no market risk and
very little, if any, production risk. Contractors accept all of those risks. Contractors gain access
to land, labor and modern facilities while growers get steady income that will pay them a wage
and retire any debt incurred. Once the debt is repaid, contract facilities generate significant cash
flows. Contract hog production has allowed many families to remain on their farms earning a
good living while playing important roles in their rural communities.

                                                                                                   2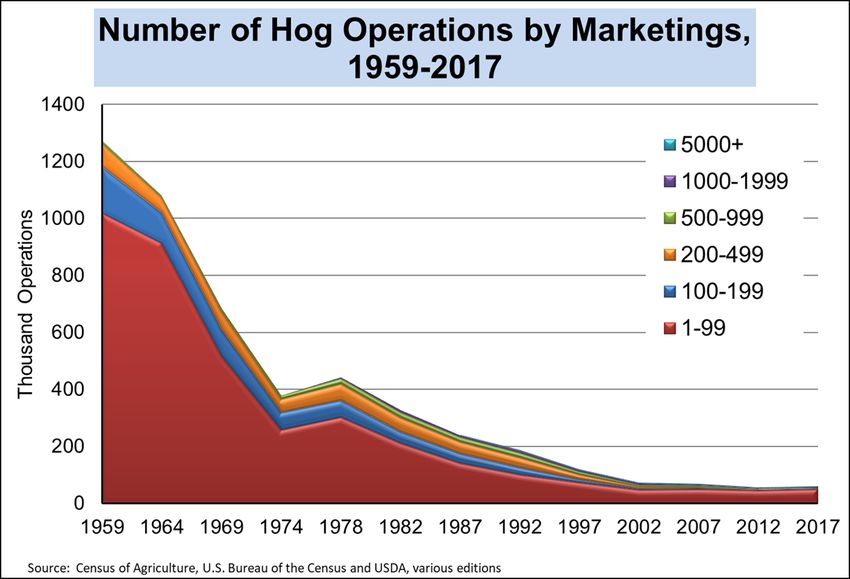
Hog production contracts differ dramatically from poultry production contracts. Hog growers
are normally paid on a pig space per year basis with possible premiums for better feed
conversion rates and lower death losses relative to an agreed-upon standard. Poultry producers
are generally paid per bird placed, with premiums and discounts applied based on the grower’s
ranking among similar, usually nearby growers on performance metrics such as feed conversion
and death loss. Hog contracts are long-term agreements spanning typically 5 to 10 years.
Poultry contracts are flock-by-flock agreements with placements of future flocks at the discretion
of the contractor. Hog growers can market their services to a broad group of contractors because
pigs and market hogs can be shipped long distances without significant stress or loss. Most
poultry growers are captive to one (or maybe two or three) nearby contractors because chickens
cannot be shipped long distances without suffering significant losses.
The use of marketing agreements/contracts has grown dramatically since the early 1990s. They
now govern the transfer of most pigs from producers to packers. Most marketing
agreements/contracts cover deliveries for three-to-seven years with prices based on
negotiated/spot hog prices, CME Lean Hogs futures contracts, USDA’s estimated pork cutout
value or feed ingredient prices and pro forma cost of production formulas. These agreements
provide certainty regarding packing plant access for producers and sufficient hog supplies for
packers to operate plants at peak efficiencies. Some also reduce the variability of prices to be
paid, thus mitigating risk. Most pork industry lenders prefer that their customers have marketing
agreements in place to guarantee market access for their pigs. One negative impact of the
growth of marketing agreements/contracts has been a long-term decline in the number of hogs
for which prices are negotiated each day. This reduced level of “price discovery” interactions
has cast significant doubt on whether those negotiated prices represent the true value of hogs.
The “public good” aspects of price information make increasing the number of hogs for which
prices are negotiated particularly difficult. Ideas to require some minimum level of negotiated
sales/purchases have significant negative repercussions as well.
Hog and pork prices are determined by the interaction of supply and demand at various
market/product levels. Consumer-level pork demand is the primary source of the demand for
wholesale pork cuts. Export demand for U.S. pork accounts for roughly 25 percent of wholesale
demand as well. Packers derive their demand for hogs from the demand for wholesale cuts. The
farm-level supply of hogs is the basis of downstream supplies of wholesale cuts and retail and
foodservice pork products. Industry participants use a number of information sources to gauge
these interacting supplies and demands. Prices at all levels are discovered simultaneously by the
interaction of buyers and sellers across the country and even around the world.
In recent years, domestic consumption has accounted for about 75 percent of U.S. pork output
while exports have accounted for 25 percent. Growing exports have claimed 63 percent of the
increase in U.S. pork output since 1994. Domestic consumption grows at roughly the rate of
U.S. population growth, meaning that domestic per capita consumption has been roughly steady
since the early ‘80s. The only significant deviation from this steady pattern was in 2011-2015
when higher feed prices driven by a) government-subsidized and mandated use of corn-based
ethanol and b) the drought of 2012 as well as significant piglet losses cause by porcine epidemic
diarrhea virus (PEDv) in 2014 pushed U.S. production sharply lower.
The pork industry in the United States, Canada and Mexico are highly integrated due to the
North American Free Trade Agreement of 1994 and its successor, the U.S.-Mexico-Canada
                                                                                                    3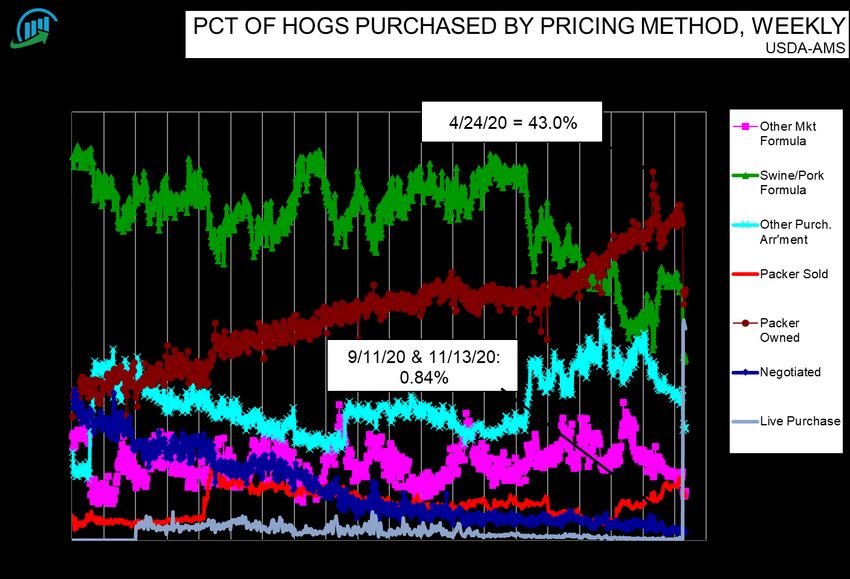
Agreement. These agreements eliminated tariffs among the three signatories, fostering growth in
trade. Mexico and Canada are the number two and four U.S. pork export markets. U.S.
producers purchased roughly 4.4 million weaner/feeder pigs from Canadian farms for finishing
in the United States in 2020. U.S. packers bought an additional 800,000 Canadian pigs for
processing in U.S. plants in the same year. The United States is Canada’s largest pork export
market. Shipments to Mexico have grown 16-fold from 1993 to 2020, but the Mexican pork
industry has grown by 60 percent since 1995. Mexico is now a major exporter of pork as it sells
high value cuts to Asian markets and purchases lower-value cuts from the United States.

                                                                                              4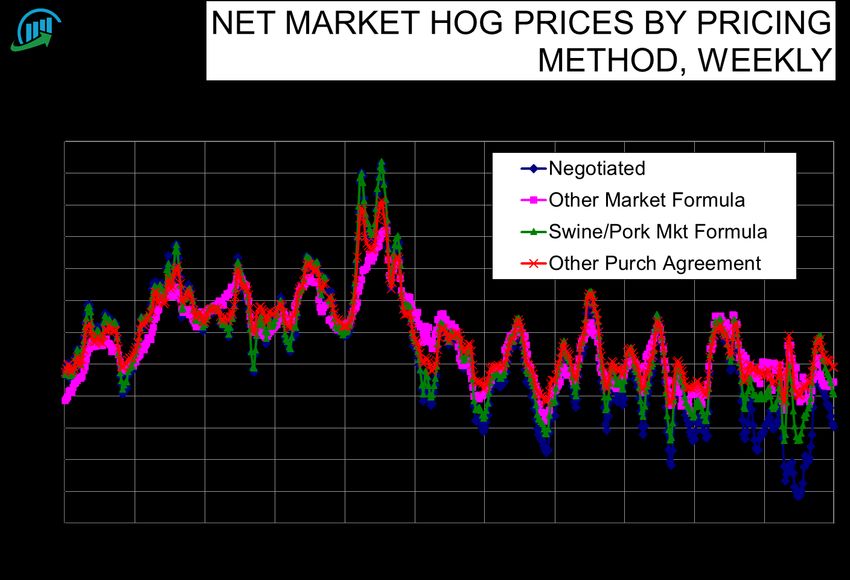
Table of Contents

Introduction                                             6

Economic Importance                                      6

Industry Structure                                       7

Raising, Selling, and Buying Hogs                       11

Production Contracts                                    12

Marketing Agreements                                    13

Market Drivers and Dynamics for Pork and Hogs           14

Price Discovery                                         16

Important Markets for U.S. Pork                         21

Pork Exports                                            22

North American Pork Market                              23

Pork vs. Beef vs. Chicken: A Comparison                 24

                                                             5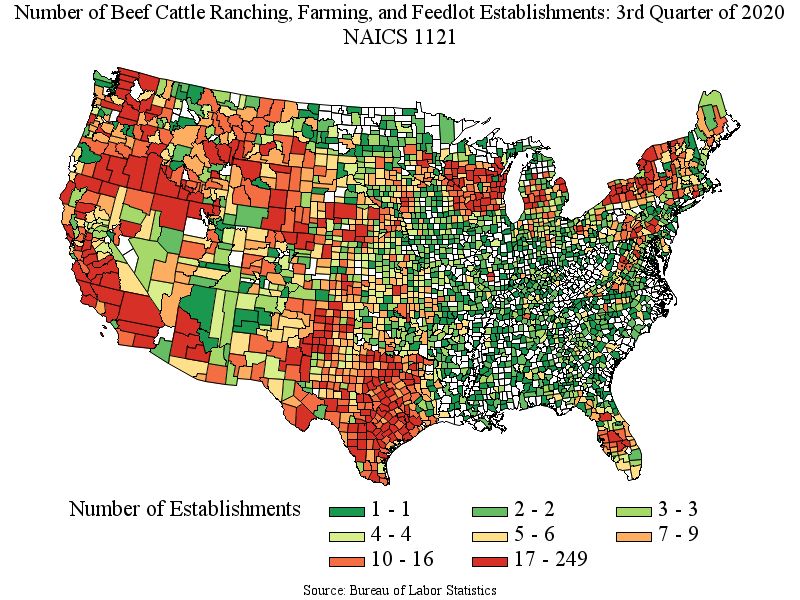
Introduction
The National Pork Producers Council in 1987 launched a pork promotion campaign with one of
the world’s most iconic slogans: Pork. The Other White Meat. The idea was to go head-to-head
with chicken for the American consumers’ food dollars. Beef was and is the No. 1 protein
purchased in the United States, but the No. 2 spot was up for grabs.
About the same time, the U.S. pork industry saw innovations in feed rations, animal care and
housing and genetics; new ways of selling, buying and marketing hogs; and implementation of
the first two major U.S. free trade agreements – with Canada, then Canada and Mexico – all of
which prompted tremendous growth in pork production even as the number of hog operations
declined.
That growth today has made the U.S. pork industry the globe’s No. 2 producer (behind China)
and the world’s No. 1 exporter of pork.
It is in that context that this paper examines the structure of the U.S. pork industry and its
importance to agriculture, the U.S. economy and rural America – the places that feed 330 million
Americans and millions more around the world.
Economic Importance
The U.S. pork industry is a significant contributor to the economic activity of U.S. agriculture
and the broader U.S. economy. More than 60,000 pork producers marketed more that 131 million
hogs in 2020 despite significant disruptions caused by the coronavirus pandemic. Those animals
provided farm-level cash receipts of over $22 billion.
Iowa State University economists Daniel Otto, Lee Schulz and Mark Imerman estimated that in
2016 the U.S. pork industry was directly responsible for the creation of more than 37,000 full-
time-equivalent jobs in pork production and generated roughly126,000 jobs in the rest of
agriculture. In addition, the pork sector was responsible for 124,750 jobs in packing and
processing and 33,400 jobs in professional services such as financial services, insurance, and real
estate. In total, the U.S. pork industry is responsible for nearly 514,000 mostly rural jobs in the
United States.
U.S pork producers in 2020 provided 28.3 billion pounds of safe, wholesome, and nutritious
meat protein to consumers worldwide. By comparison, in 1960, at least 10 times as many pork
producers produced about 12 billion pounds of carcass-weight pork.
Pork exports add significantly to the bottom line of each U.S. pork producer and have grown
dramatically in recent years. They also supported an estimated 110,000 jobs in the U.S. pork
sector and its allied industries in 2016, according to the ISU economists. (U.S. pork exports
accounted for only about 20 percent of total U.S. production in 2016, so the employment
contribution was almost certainly larger in 2020, when exports were a larger percentage of
production.)
Additionally, pork producers used roughly 1.1 billion bushels of corn and the soybean meal from
455 million bushels of soybeans in 2020. Pigs also consumed roughly 5 million tons of distillers
dried grains with solubles (DDGS), a major by-product of corn-based ethanol production.

                                                                                                  6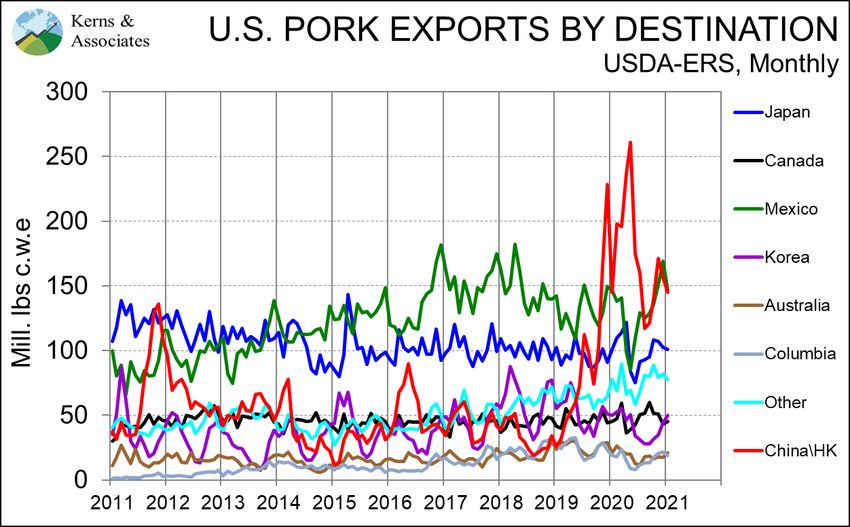
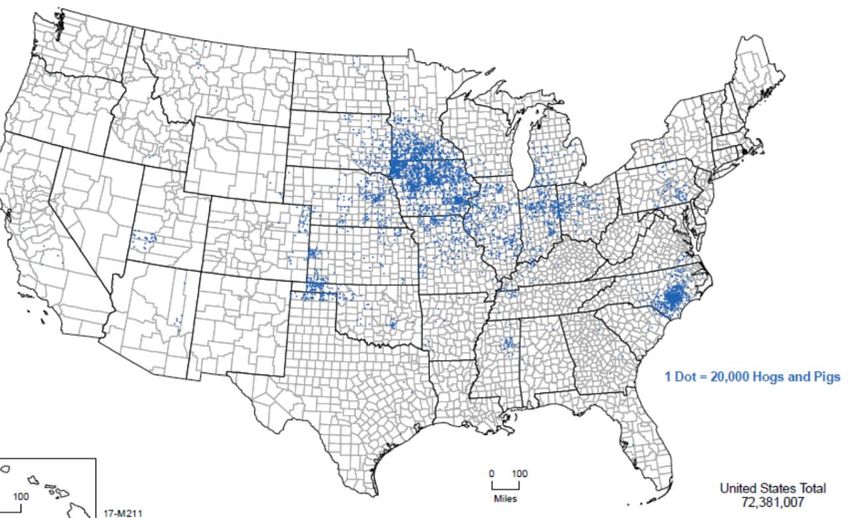
While the U.S. pork industry enhances the well-being of all U.S. citizens by providing safe,
nutritious pork products, it contributes more specifically to the economics of a number of states,
primarily in the Midwest. Figure 1 shows the geographic distribution of hogs in the United States
as of December 1, 2017. Major concentrations of hogs, hog farmers and the industries they
support can be found in 13 states across a wide geographic region ranging from the Midwest to
mid-Atlantic and as far north as the Canadian border. One significant reason for this
geographical distribution is that many of those states also are among the top producers of corn
and soybeans – the main ingredients of hog feed. Colorado, North Carolina, Oklahoma, Texas
and Utah also have large numbers of hogs and related enterprises. Smaller concentrations are
found in Arizona, California, Mississippi, Montana and Tennessee. The pork packing sector
mirrors these hog locations quite closely.
       Figure 1

       Hogs and Pigs in the U.S., December 1, 2017 (Source: USDA, 2017 Census of Agriculture).

Industry Structure
The structure (producer size, ownership, market share, etc.) of the U.S pork industry has changed
dramatically over time but has been relatively stable since the early 2000s. Figures 2 and 3 show
the number of U.S. hog operations by size category from USDA’s Census of Agriculture.
The sharp decline in the number of hog operations from the late 1950s through the 1970s was
mirrored by reductions in the number of operations producing nearly all agricultural products.
Major technological changes were a primary driver as were cultural and social changes that
resulted in much smaller farm families and large migrations from farms to cities.

                                                                                                 7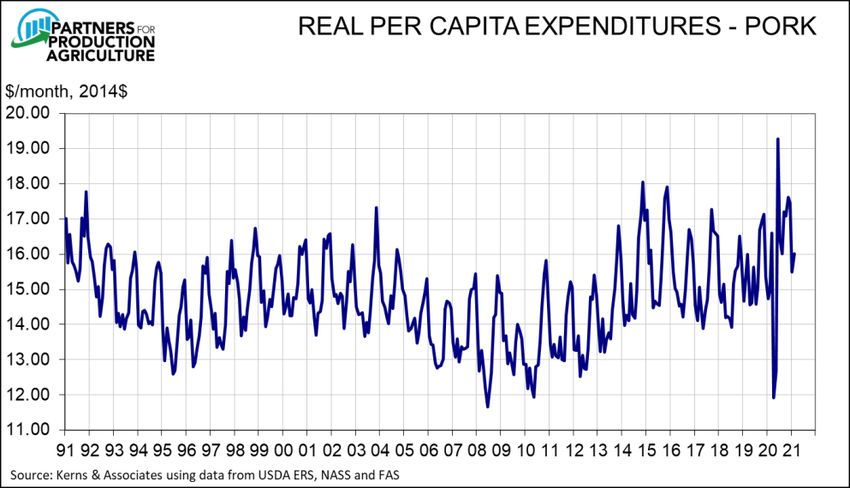
Figure 2

Figure 3

Hog operations have somewhat stabilized near 60,000 in the last two Census of Agriculture years.

                                                                                                   8
Technological changes continued in the pork industry from the ‘70s through the ‘90s as
confinement production – housing animals indoors to protect them from weather, disease and
predators – and advances in animal disease control and nutrition gave rise to substantial
economies of scale in hog production. While farms that produced both feed (mainly corn) and
hogs had a historical advantage over those that produced only hogs, federal price support
programs resulted in relatively low cash corn prices during this period, which allowed
specialized pork enterprises to be competitive with their upstream-integrated competitors.
These forces culminated in a major restructuring of the pork production sector in the mid-1990s.
Economies of scale and the looming threat of environmental regulation drove a large expansion
of the production sector that resulted in very low prices. The low prices of 1994 and, even more
so, the price debacle of 1998 (when live hog prices were less than $15 a carcass hundred weight
(cwt.); today they’re around $105) drove producers large and small from the industry but had a
disproportionate impact on small producers because of the generally – but not always – lower
productivity of enterprises that were part of diversified farms relative to specialized hog
enterprises.
USDA in 1964 began breaking out “large” farms that had 1,000 head and more hogs. At that
time, these large farms had 3.2 percent of the total U.S. inventory. That share grew to 22.7
percent in 1978, so USDA began providing more detail in the 1982 Census, and the new “large”
category of farms with inventories of 5,000 head and more held 4.9 percent of the national hog
population. As can be seen in Figure 7, the share of farms with 1,000 head and more hogs has
continued to grow over time, with the most dramatic growth being in those farms with 5,000 and
more hogs. Farms with over 1,000 head now account for 97.2 percent of the national inventory.
Those with 5,000 or more hold a 72.8 percent inventory share.
A major advantage U.S. pork has in world markets and its competitive position relative to other
U.S. proteins exists in the efficiency of U.S. pork packing companies and plants. U.S. plants are,
on average, larger than others in the world and, according to industry sources, capable of
converting hogs to value-added pork products at lower costs than plants located elsewhere in the
world.
The growth of U.S. pork plants is the result of adding many large, efficient plants since the early
1990s. That growth was accompanied by the closure of many older, generally smaller plants,
some of which were in areas that no longer produce many hogs. (See Figure 4.)

                                                                                                  9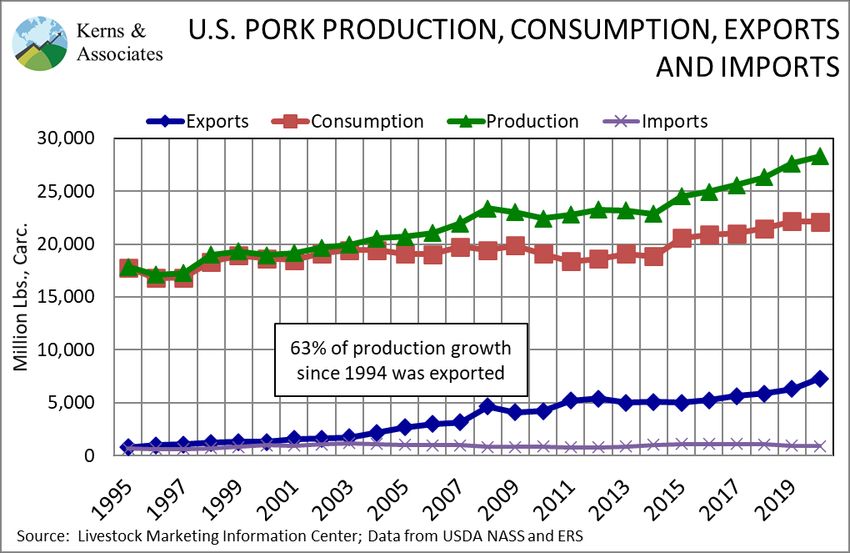
Figure 4
              PORK PACKING CAPACITY BY COMPANY
    Company                          Headquarters            2019         2020          Change
  1 Smithfield                       Smithfield, VA           130,300      130,300
  2 JBS                              Greeley, CO              93,000       93,000
  3 Tyson Foods (IBP)                Dakota Dunes, SD         81,300       81,800           500
  4 Clemens Food Group               Hatfield, PA             23,700       23,700
  5 Seaboard Farms                   Shaw nee Mission, KS     20,500       22,500          2,000
  6 Triumph Foods                    St. Joseph, MO           21,500       21,300           (200)
  7 Triumph-Seaboard                 Sioux City, IA           20,400       20,400
  8 Hormel                           Austin, MN               19,000       19,000
  9 Indiana Packing Co.              Delphi, IN               17,300       16,700           (600)
 10 Wholestone Foods                 Fremont, NE              10,675       11,500           825
 11 Prestage Foods                   Webster City, IA         10,000       10,000
 12 Agar Foods                       Rantoul, IL               7,400        7,400
 13 Premium Iow a Pork               Hospers, IA               3,150        5,250          2,100
 14 Prime Pork                       Windom, MN                5,100        5,100
 15 Sioux-Preme Packing              Sioux Center, IA          4,600        4,600
 16 Johnsonville Sausage             Watertow n, WI            3,500        3,425            (75)
 17 Yosemite Meats                   Stockton, CA              3,200        3,200
 18 J.H Routh                        Sandusky, OH              4,200        2,900         (1,300)
 19 Pork King Packing                Marengo, IL               2,200        2,250            50
 20 Redw ood Farms (Dakota Pork)     Estherville, IA           2,400        2,000           (400)
 21 Abbyland Foods                   Curtiss, WI               2,000        2,000
 22 Fisher Ham and Meat              Spring, TX                1,700        1,700
 23 The Pork Company                 Warsaw , NC               1,500        1,500
    USA Pork Products                Hazellton, PA             1,500        1,500
 25 Leidy's                          Souderton, PA             1,350        1,350
 26 Verschoor Meats                  Sioux City, IA            1,200        1,200
 27 Spectrum Meats                   Mount Morris, IL          1,150        1,150
 28 Tri-Eagle Provision (Vin-Lee-Ron) Mentone, IN              1,100        1,100
    Sw aggerty Sausage Co            Kodak, TN                   850        1,100           250
 30 Bob Evans Farms                  Xenia, OH                 1,000        1,000
 31 Jim's Farm Meats                 Atw ater, CA                850          850
 32 Olson Meat Company               Orland, CA                  800          800
 33 Peoria Packing                   Chicago, IL                 800          800
 34 Calihan Packing Company          Peoria, IL                  750          750
 35 Independent Meats                Tw in Falls, ID             730          730
 36 Martin's Pork Products           Falcon, NC                1,300          650           (650)
 37 F.B. Purnell Sausage             Simsonville, KY             500          500
    Masami Meat Company              Klammath Falls, OR          500          500
    Dekalb County Packing Company    De Kalb, IL                 500          500
 40 Pioneer Packing Company          Bow ling Green, OH          450          450
 41 Williams Sausage Co.             Union City, KY              400          400
 42 Carleton Packing Company         Carleton, OR                375          375
 43 Parks Family Meats               Warsaw , NC                 350          350
 44 Morris Meat Packing              Morris, IL                  300          300
    Wampler's Sausage                Lenoir City, TN             300          300
    Dean Sausage                     Atalla, AL                  300          300
 47 Dealaman Eterprises, Inc.        Warren, NJ                  200          200
 48 Gunnoe Sausage                   Goode, VA                      90             90
    Dayton Meat Co.                  Dayton, OR                  200           -            (200)

    Other plant not listhed                                    3,600        3,600
    Total Daily Capacity                                     510,070      512,370          2,300
    Weekly Capacity @ 5.4 days per w eek                    2,754,378    2,766,798        12,420

    Red numbers denote sow/boar plants or primarily sow/boar plants
    Yellow shading indicate no response to 2020 survey

Daily slaughter capacity of U.S. pork packing plants (Source: National Hog Farmer).

                                                                                                    10
This shift increased the concentration of ownership in U.S. pork packing. The four-firm
concentration ratio (CR-4) of the U.S. industry grew from roughly 44 percent in 1995 to just over
70 percent in 2016. There is no critical value for CR-4, but 70 percent is normally considered
high concentration.
The Department of Justice (DOJ) uses the Herfindahl-Hirschman Index as its critical measure of
concentration, especially in evaluating proposed mergers. The HHI is simply the sum of the
squared value of all companies’ market shares. A sector with four firms whose market shares are
30, 30, 20 and 20 would have a HHI of (30 x 30) + (30 x 30) + (20 x 20) + (20 x 20) = 2,600.
DOJ considers sectors with an HHI of 1,500 or below to be competitive. Any merger that leaves
an industry’s HHI below 1,500 will not likely be challenged. An HHI of 1,500 to 2,500 is
considered moderately concentrated, and mergers in this range that change HHI by 100 or more
points will receive added scrutiny from DOJ. An industry with HHI greater than 2,500 is
considered highly concentrated, and any merger that increases the HHI by 200 points or more
will be presumed to enhance market power. DOJ does not specify actions it will take, but higher
scrutiny is understood to mean the chance of challenging the merger increases.
The pork packing sector generally has remained under the competitive market threshold of HHI
1,500. It did rise above that level in 2016 following the purchase of Cargill’s pork operations by
JBS. Based on daily slaughter capacity, the sector’s HHI in 2016 was about 1,538. DOJ uses
actual market shares of hog slaughter, not capacity, to compute its official HHI figures.
The opening of new packing plants in Sioux City, Iowa, and Coldwater, Mich., in 2017 and in
Wright County, Iowa, and Luverne, Minn., in 2019 and 2020, respectively, reduced the sector’s
CR-4 and HHI significantly. These plants were built with hog producers’ involvement and
investments and represent vertical integration downstream through packing and processing by
producers. Using packing capacity data, the 2020 CR-4 is 64, while the HHI is 1,345, indicating
a structure more conducive to competition in the U.S. pork packing sector.
Raising, Selling, and Buying Hogs
The markets for pork and hogs are national in that prices for hogs, whether sold by producers to
packers live or in carcass form and pork cuts are determined primarily in the Corn Belt where the
vast majority of hogs are raised, slaughtered and processed into pork. Prices in other production
regions are based on these Midwestern prices, generally differing by the amount of transportation
costs, just as economic theory predicts. Prices in regions with smaller hog numbers also may be
affected by factors other than transportation costs since they are far more dependent on local
demand conditions.
Pigs are produced in a variety of ways in the United States. Some are still produced on
diversified farms that involve multiple enterprises, while others are produced by specialized
companies in specialized facilities. Some are produced outdoors in either pasture or woodlands,
while others spend their entire lives indoors in climate-controlled buildings. Some pigs are from
genetic lines known for superior meat qualities that provide superior flavor, marbling or other
characteristics determined in white tablecloth restaurants, while others are from lines designed to
produce lean pork that meets the preferences of today’s health-conscious consumer.
Virtually all U.S. pigs are fed diets based on corn and soybean meal though some regions use
other ingredients such as milo, barley and peas as well as by-products from ethanol plants,
11bakeries, cereal makers and others. There is no right or wrong way to raise a hog – just better or
worse ways depending on the local climate, available feedstuffs and specific end uses.
The entities that produce hogs vary as much as the hogs themselves. These range from 4-H and
Future Farmers of America (FFA) projects that involve only a few purchased feeder pigs each
year to regionally diverse divisions of large production companies. There are sole
proprietorships, partnerships, corporations of every type and limited liability companies. Most
hog operations – even large ones – are owned and operated by individual families and usually
involve several members of those families. Such family operations are typically full-time,
commercial-scale hog producers.
During the past 30 years, the industry has moved from hundreds of thousands of small operations
that sold pigs by the pickup or trailer load through auction barns and buying stations to far fewer
operations that sell pigs by the semi-trailer load directly to packers. That move led to new
business practices in the pork industry. Contract production, open market operations and
vertically owned enterprises are business choices that depend on factors such as transaction
costs, risks and uncertainty in markets. No single solution is optimal for all circumstances.
Today’s demands for higher quality and verified production practices require improved
information throughout the supply chain. Contracts provide the ability to create, control and
communicate that information.
Production Contracts
The 1980s saw the advent of contract production where the owner of pigs would contract with
others to provide buildings, labor, utilities and waste management for a fee. Contract grower-
finish facilities were the most common, but contract nurseries and breeding-gestation-farrowing
units also were used.
The use of production contracts accomplishes several important goals for hog producers. First,
they allow a hog producer to expand rapidly because the owner does not have to raise the capital
to construct all the needed buildings. Contracts allows those facilities to be built with the contract
grower’s capital and credit and to be placed on the contract grower’s balance sheet. The trade-
off, of course, is that the contract grower can build equity in barns, feeders, hog sorters and other
production facilities, with a useful life that in many cases goes well beyond the terms of the
initial contract and indebtedness.
Second, contracts allow swine production operations to be geographically dispersed, reducing
the risk of loss that would exist if all animals were on one site and placing valuable waste
nutrients (manure) near growing crops. Dispersion of facilities helps swine producers address
potential risks such as disease and casualties from weather or fire. Having nutrients as fertilizer
near their point of use reduces transportation costs and risks as well.
Third, the growth of swine production contracts coincided with the development of separate-site
swine production systems that segregated pigs of differing ages to control disease, increase pig
health and enhance production efficiencies. Production contracts facilitated the widespread
adoption of these systems by giving pig owners access to land in different areas. The benefits
have been tremendous and have resulted in healthier animals, lower-cost production, higher
output, more affordable pork products for U.S. and foreign consumers and ready access to
organic fertilizers that many crop farmers use.
12Finally, production contracts allow thousands of rural residents to remain on family farms,
making a full-time living in agriculture. Production contracts provide repayment assurance for
bankers and, in turn, allow growers to finance, upgrade and modernize buildings. They provide
steady sources of income without the grower having to face output or market risk. Once paid off
(usually in 8 to 12 years), contract buildings provide substantial cash flow that can be used to
replace or expand facilities. Many growers eventually become independent hog producers thanks
to the opportunity provided by a production contract.
Contract hog production payments were initially made on a per-head basis, with premiums paid
for superior performance such as low death loss, low feed conversion rate and more pigs per sow
per year. However, these types of payments do not perform well if weather conditions are bad or
a disease challenge is encountered. In addition, early marketing or delayed pig deliveries meant
growers were without pigs – and thus without payments – for periods of time, a situation that
obviously reduced their incomes and ability to repay loans.
Other payment systems were tried, but the industry finally adopted, in general, a system that pays
growers a fixed amount per animal space per year with, in many but not all cases, premiums for
performance that exceeds pre-specified levels. Hypothetically, the owner of a 1,000-head
finishing barn may receive $36 per pig space per year (i.e., $36,000 annually). In addition, the
swine production contract grower may receive a premium if the feed conversion rate is less than,
say, 2.9 lbs. of feed per pound of gain or if death losses are, perhaps, less than 2.4 percent of
delivered pigs. This payment system guarantees a minimum income level to growers, provides
incentives to improve performance and, thus, profitability for pig owners and allows owners
flexibility in the timing of placing and marketing pigs without imposing a consequence on the
grower. The system has worked very well for swine contractors and swine production contract
growers.
Marketing Agreements
The other business practice that developed over the past 30 years is the use of marketing
agreements to transfer ownership of pigs from producers to packers. Marketing agreements, like
production contracts, have evolved over time to meet the needs of packers and producers.
Early marketing agreements were offered by packers as a way of securing leaner hogs that would
yield higher proportions of saleable cuts. In the 1980s and 1990s, the U.S. hog populations
contained a large number of animals with too much fat and not enough lean muscle. As
consumers began demanding lean pork products, packers identified producers who had lean,
good cutting hogs and offered them a premium if they would make a long-term (as much as 5 to
7 years in some cases) commitment to sell to that packer. An additional benefit is assurance of
throughput levels that maximize packing plant efficiencies. This allows producer-to-consumer
price spreads to be as small as possible, keeping producer prices high and/or consumer prices
low.
Another incentive for using marketing contracts – guaranteed and timely access by producers to
packing capacity – was driven primarily by the hog price crash of 1998. In that year, hog
supplies increased sharply even while packing capacity declined primarily because of the
bankruptcy of Thorn Apple Valley Packing in Detroit. Timely marketings were impossible
during November and December of 1998, and prices fell to record lows. The inability to sell
hogs on a timely basis drove many producers and their lenders to enter into marketing
13agreements to guarantee access to packing capacity, or “shackle space” at a packer. Few
producers or lenders wanted to take the risk of lacking a market for their pigs, even over a very
short period of time. Most shackle space contracts have prices tied by formulas directly to the
spot or negotiated market and thus have no risk-mitigating characteristics – the price may be $1
or $2 higher than the spot price in return for a long-term supply commitment, but the variance
(i.e., the risk) of the formula price will be the same as the variance of the spot price. Producers
who use these kinds of contracts to guarantee shackle space can (and many do) use futures,
options and cash contracts with packers – the same tools used by producers selling on the
spot/negotiated market – to manage risk.
Some marketing agreements, though, have price-stabilizing or risk-mitigating components. Most
of these do not attempt to raise or lower long-run prices as much as they try to reduce price
variation, preventing steep downturns in revenues and helping manage cash flows. These
contracts stabilize producers’ financial performance and thus generally enhance their access to
capital. In addition, they result in a more stable supply of hogs for packers.
There have been attempts over the years to limit how producers sell and packers buy hogs, but
such proposals would lead to more volatility in the market, less stability for producers and
packers and, inevitably, to more vertical integration of the pork industry, with packers simply
owning hogs from birth to slaughter.
Market Drivers and Dynamics for Pork and Hogs
Prices of pork products and hogs depend, quite logically, on the supply of hogs and the demand
for pork. Note that this statement involves two different but related products: pigs and pork.
Pork demand is not simply per capita consumption. It is the quantities of pork that consumers are
willing and able to buy at alternative prices. It is not a quantity but a set of price-quantity pairs.
Prices and quantities are, logically, negatively related: Consumers will buy less pork at higher
prices and more pork at lower prices.
Since price and quantity are negatively related, one way to characterize the condition of pork
demand is to observe the product of the two – total expenditures. Real per capita expenditures
(RCPE) for pork is simply the product of the real (i.e., deflated) price of pork and per capita
consumption in retail weight. The relative magnitude of price and quantity changes determine the
change in RPCE. Monthly RPCE since 1991 appears in Figure 5. Note the large disruptions in
consumer-level pork demand in 2020 because of supply chain disruptions caused by COVID-19.
14Figure 5
The demand for pork is determined by consumer tastes and preferences, consumer incomes and
prices of substitute goods (primarily beef, chicken and turkey). Changes in any of these variables
will change the price-quantity pairs thus “shifting” demand.
The demand for pork at the wholesale level and demand for hogs at the farm gate are “derived”
from consumer demand by deducting costs and profits of intermediary firms from the prices
consumers are willing to pay. This process results in sets of price-quantity pairs at the wholesale
and hog levels that correspond to consumer-level price-quantity pairs.
Just as consumer-level pork demand is the “source” of demand for wholesale pork and hogs, the
farm-level supply of hogs is the source for the wholesale and consumer-level supplies of pork.
And just as demand is not a quantity but a set of price-quantity pairs, so is hog supply a set of
price-quantity pairs that represent the number of hogs producers are willing and able to supply to
the market at alternative prices.
The supply of hogs is determined by the cost of inputs, production technology and expectations
for profits. All of these are, importantly, somewhat a function of time, and they influence hog
supply over relatively long periods.
Producers cannot quickly change the number of hogs they produce. Decisions to change output
levels can be made relatively quickly, but the actual reduction of hog numbers will take 10 to 12
months with the gestation period of a sow being roughly 4 months and pigs taking 5.5 to 7
months to reach market weight. Expansion decisions take longer to execute than do reduction
decisions as, in most cases, production facilities must be built. Expansion decisions have a 20-
to 30-year impact on hog supplies since facilities placed into production will likely remain in
production even if the original owner fails.
To hog supply, the costs of harvesting, processing, transporting, and packaging pork and
required profit margins are added to determine sets of price-quantity pairs that represent the
amounts packers are willing and able to offer to wholesale pork buyers (further processors, retail
stores, restaurants, etc.) at various wholesale prices. Costs of retailing and foodservice
preparation and required profits of those establishments are then added to wholesale values to
15determine a set of price-quantity pairs that retailers/restaurants are willing and able to offer at
alternative prices to consumers.
The only remaining market factor is export demand. Over the last decade, the United States is the
largest single pork exporting country in the world. The EU is the largest exporting entity. U.S.
pork exports accounted for just over 27 percent of total carcass weight production in 2020. The
value of U.S. pork and pork variety meat exports in 2020 accounted for $56 per hog.
Export customers in essence compete with domestic retail and foodservice businesses to buy
wholesale pork. So, export demand impacts the hog-pork economy at the wholesale level.
Portions of observed wholesale pork and farm-level hog demand are derived from export
wholesale demand.
This entire process provides supply and demand relationships at the farm, wholesale and
consumer levels that simultaneously determine the quantities of hogs and pork produced and the
prices at which those products trade at the farm, wholesale and consumer levels.
Price Discovery
No single entity or group of entities “sets” the price for pork and hogs in the United States.
Prices are determined by the supply and demand relationships described above on a daily basis
and are “discovered” by the interaction of buyers and sellers at all levels of the hog-pork
economy. No entity knows the precise status of supplies or demands at the various market levels.
Interaction and negotiation determine quantities traded and the prices of those trades from the
various levels of uncertainty, therefore there can be different prices paid for hog or any
wholesale cut on any given day.
The quantity of hogs supplied to the market is the result of breeding decisions made almost a
year before the pigs reach market weight. Therefore, the short-run supply of hogs tends to be
inelastic, meaning that the quantity can change very little regardless of the price of hogs. In
addition, consumer-level pork demand – and thus wholesale pork demand and hog demand – are
by nature inelastic, meaning that any change in the quantity offered for sale will cause a larger
price change in percentage terms in the opposite direction. So, when the supply curve increases
(shifts to the right), prices fall by a greater percentage than quantity increases and producers’
total revenues decline. When the supply curve decreases (shifts left) the opposite occurs.
Clearly, the inelastic nature of hog demand allows producer revenue to increase when the
quantity supplied is restricted. This is not unique to pig production, and the revenue-inelasticity
relationship is a primary reason for antitrust laws. Without legal prohibitions, sellers can collude
to restrict supplies and the resulting price increase will lead to higher revenues.
Prices in the hog-pork complex are most clearly discovered at the wholesale level. It is here that
the demands of domestic retailers and foodservice companies as well as export customers
interact with the supply functions for wholesale pork cuts. This interaction produces individual
cut prices that determine the cutout value of a pork carcass. Cutout value is the sum of the prices
of the various wholesale cuts multiplied by the percentage of the carcass they represent.
Hog prices are directly derived from the cutout value. As the cutout value rises, packers can (and
usually do) pay more for hogs. As cutout falls, hog bids usually fall commensurately.
16The relative changes of cutout value and hog price depend largely on the bargaining position of
producers and packers at any given point in time. When hog supplies are ample, packers can
push hog values down relative to the cutout value. When hog supplies are tight, producers can
command a higher proportion of the cutout value for their animals.
The prices paid for hogs are derived in several fashions. Some are negotiated each day by hog
sellers and packer buyers. Some are established by formulas that make various adjustments to
negotiated prices, futures market prices or some other market price. Others are arrived at based
on producers’ cost of production.
Pork plants that process 100,000 market hogs or more during a year are required by the
Livestock Mandatory Reporting Act of 1999 to report a variety of information to USDA’s
Agriculture Marketing Service each day. Among these variables are the price, number, weight
and carcass characteristics of pigs purchased and slaughtered. Companies that slaughter 100,000
sows/boars per year are required to report similar information on their purchases of cull sows and
boars each day.
Prices paid for barrows and gilts are the result of several pricing mechanisms. The ones included
in mandatory price reporting reports are:
1. Negotiated Prices – The result of buyer-seller interaction that results in agreement on a
base price and a day of delivery. This is the “spot” market for pigs, and the number of
pigs sold in this market has declined steadily. The number and percentage of pigs traded
on negotiated prices reached all-time lows in 2020.
2. Swine or Pork Market Formula – Prices are based on a price from a hog or pork market.
Negotiated prices are frequently the base market for formula-priced hogs, with actual
prices normally including an “add-on” from that base. Western Corn Belt plus $2/cwt.,
for example. A growing portion of this price category is based on a pork market,
primarily USDA’s estimated pork cutout value. Cutout formulas usually include a
percentage (e.g., 90 percent of the cutout) or a fixed adjustment (cutout value less $10).
Some hogs are priced using a combination of hog and pork markets.
3. Other Market Formula – Prices are based on Lean Hogs futures and options.
4. Other Purchase Arrangement – Prices that do not fit neatly into the other categories. This
classification generally includes hog prices that have some limitations (window contracts,
price floors, etc.), are based on a market other than futures or hogs/pork (e.g., cost of
production, corn/soybean meal prices, etc.) or involve non-carcass merit premiums (e.g.,
pen gestation, the absence of antibiotics, specific breed(s), free-range, etc.).
The proportion of hogs priced by these alternative methods has changed over time. (See Figure
6). Some important points to note are:
1. The share of hogs for which prices are negotiated has been falling for many years but has
reached crucially low levels recently. There is no “right percentage” for negotiated
animals, but the chances of a mismatch between the number of “open market” (i.e., non-
committed) hogs supplied by producers and demanded by packers increases as the
number of these hogs falls. Two extra loads are less critical when 10 percent of hogs are
negotiated than they would be when 1 percent is negotiated.
172. Packer ownership of hogs continues to grow, but the primary driver of growth since 2016
has been the opening of three large, modern plants either entirely or partially owned by
producers. Because of this ownership, those producers’ animals moved from another
pricing mechanism to “packer-owned.” These changes are also the driver in the changes
in Packer-Sold pig shares in 2017 and 2019. Packer-sold pigs are pigs raised by packers
that are, generally, not in good geographic locations to be processed in the packers’ own
plants. The 2020 spike was due to COVID-19 disruptions.
3. Changes in USDA Agricultural Marketing Service definitions caused some major shifts
among pricing categories in 2016. AMS does not do this often, but it does have an impact
on the data when it does.
Figure 6
Of primary concern to producers are the changes in price levels that have resulted from these
long-term shifts in how hog prices are set. Figure 7 shows the weekly average prices of the four
reporting categories for producer-sold hogs – i.e., hogs sold by independent producers to
packers. Noteworthy features of Figure 7 are:
1. While Other Market Formula (Futures-tied) prices and Other Purchase Arrangement (the
catch-all category) prices move generally with the market, they almost always will deviate to
some degree. The reason is that OMF prices are based on futures prices at the time an
agreement is made between the producer and the packer but are reported only when those
animals are harvested. Therefore, the reported price might differ substantially from the
market price on the day of sale or slaughter. OPA prices differ because some of the price
18mechanisms are based on other markets (corn and soybean meal, for instance), and some
non-carcass premiums (pen gestation, Berkshire genetics, for instance) can be large.
2. Swine or Pork Market Formula and Negotiated Prices were very close to each other until
2016 because: a) almost all Swine or Pork Market Formula prices were based on negotiated
prices; and b) hog supplies were generally below packing capacity.
3. Swine or Pork Market Formula and Negotiated Prices began to diverge in 2016 and have
been vastly different from mid-2019 until March 2021. There are two reasons for this
divergence.
a. Over roughly the past five years, more and more swine or pork market formulas
have been based on pork prices, primarily USDA’s estimated cutout value. That value is
almost always more stable than hog prices as wholesale demand is more elastic than is
hog demand. This is one of the attractive features to producers of tying hog prices to the
cutout value. Pricing hogs off that cutout value and including those prices in the Swine or
Pork Market Formula keeps the formula price higher when market prices fall. Such had
been the case almost exclusively before 2018.
b. Hog production has increased to the point where it once again challenged packing
capacity in 2019, meaning the price of negotiated pigs could be pushed lower by packers
since there were few alternative outlets for these “extra” pigs relative to supplies
committed to packers through contracts. This factor became especially large in 2020,
when packing plants reduced throughput or even closed because of COVID-19 cases
among their workers. Plants that stayed open simply could not process all the hogs
available, allowing the negotiated price to fall dramatically. Producers had to move hogs
regardless of the price that was offered. The price of cutout-based hogs did not fall nearly
as far, thus causing the large differential in 2020. It should be noted that the negotiated
prices in mid-2020 – in the $20s and $30s per cwt. – were actually higher than they could
have been based on market conditions. Packers could have dropped prices to practically
zero and producers would have had to accept them to prevent being forced to destroy
market-ready animals. There was, to anyone’s knowledge, no “collusion” to keep prices
at or above about $30/cwt carcass weight. Packers simply did not lower their bids
beyond that point.
19Figure 7
The decline in the number of hogs for which prices are negotiated is the result of several diverse
but powerful forces. It is not the result of any conspiracy among either producers or packers.
Lenders prefer their clients to have long-term agreements for selling their pigs to guarantee
“shackle space” or market access. Such contracts are frequently required to obtain financing.
Producers who sell multiple truckloads of hogs per week or even per day prefer not to negotiate
the price of every load since doing so takes time and, thus, money and is stressful. The process is
easier and more fruitful when pigs are in relatively tight supply but becomes very difficult and
potentially disastrous when supplies are ample.
Neither producers nor packers are compensated for negotiating (i.e., discovering) prices in the
spot market. In fact, producers are frequently penalized for negotiating since the price in the spot
market is, more and more often, lower than prices paid for hogs priced by in other manners.
Further, neither producers nor packers must pay to use these data as the base for other pricing
mechanisms. And the use of the data by one party in no way diminishes its value in use by
another party. These are all characteristics of a “public good” and give rise to a “tragedy of the
commons,” where the public good is under-produced and over-used in the presence of strictly
market forces.
Public goods (roads, July 4 fireworks displays, etc.) are usually provided by the government
since leaving their production up to the private sector is bound to fail. But this particular public
good can only be reported by the government. It cannot be produced by the government. Prices
must be produced by the parties to the trade, and not every producer or every packer is
necessarily good at negotiating prices. Thus, there is a serious question as to whether forcing
negotiated transactions through public policy will result in efficient and accurate price discovery.
And there will be other negative impacts. One of the reasons producers have longer-term pricing
arrangements is that lenders desire more certainty about where market hogs will be sold and how
20they will be priced. Many loans for operations and facilities are contingent on a producer having
a long-term marketing contract that guarantees access to packing capacity and specifies how
prices will be determined. The risk reduction of such agreements is far from trivial so, without
them, capital availability will become a problem for many pork producers.
Important Markets for U.S. Pork
While, as noted earlier, pork export markets have grown in importance, the U.S. pork industry’s
“bread and butter” remains the domestic market, which takes roughly 75 percent of total annual
production. Figure 8 shows the history of U.S. pork output, total consumption, exports and
imports. Export growth has used 63 percent of the growth in output since 1994. Domestic
consumption has used the remainder of that growth. Imports have been quite steady since the
mid-‘90s.
Figure 8
Domestic consumption has grown at roughly the rate of population growth, resulting in relatively
steady U.S. per capita pork consumption (see Figure 9.) In fact, except for the four years from
2011 through 2014, U.S. per capita pork consumption has been between 47.8 and 52.7 pounds in
every year since 1982. The low levels of 2011 through 2014 were caused, first, by higher
production costs driven by the diversion of corn to ethanol production to fulfill federal mandates,
then by high corn and soybean prices because of the 2012 drought and finally, by the loss of 6 to
8 million pigs in 2013 and 2014 due to the Porcine Epidemic Diarrhea virus (PEDv).
21Figure 9
Steady pork consumption, however, does not mean steady pork demand. The price consumers
are willing and able to pay is an additional aspect of demand, and the combination of steady
consumption and higher real (deflated) pork prices mean that pork demand has increased nicely
since 2009. Real per capita expenditures for pork, a proxy for the condition of pork demand, has
increased by nearly 19 percent since its 2009 nadir. The increase is the result of positive changes
in consumers’ preferences for pork (driven at least in part by pork’s stellar record of food safety
and improvements in the pork products offered to consumers), the relative prices of pork, beef
and chicken and growth in consumer incomes.
Pork Exports
The U.S. pork industry exported a record 7.225 billion pounds (carcass weight equivalent) of
pork products in 2020. That quantity represented 25.5 percent of total U.S. output. In value
terms, the U.S. exported $7.7 billion of pork and pork products, representing 38.5 percent of the
$20 billion of hogs sold last year.
Over the past 10 years, the United States, on average, has been the top exporter of pork in the
world; it is the globe’s lowest-cost producer of pork. In any given year, the U.S. pork industry
ships product to more than 100 countries.
Since the U.S. pork industry first became a net exporter in 1995, pork has been a consistent
contributor to the balance of trade of the United States. Top U.S. markets historically have been,
in order, Japan, Mexico and Canada. South Korea joined that top echelon in 2011, and China,
which had been an intermittent market for U.S. pork, was the top destination for U.S. pork in
2020. Forecasters expect Mexico to return to the top spot in 2021. (See Figure 10.)
22Figure 10
Top export markets for U.S. pork, monthly (Source: Kerns & Associates).
North American Pork Market
Policies that foster the free flow of goods and expand export markets – mostly through trade
agreements –are critical to the continued success of America’s pork producers, U.S. agriculture
and the overall American economy.
Proof of that can be seen in the robust trade among the United States, Canada and Mexico under
the 1994 North American Free Trade Agreement and now, the U.S.-Mexico-Canada Agreement
(USMCA), which updated the 25-year-old NAFTA. In fact, Canada and Mexico are the top two
destinations for U.S. goods and services, accounting for more than one-third of total U.S. exports
and supporting 14 million American jobs. Those jobs produce the nearly $1.4 billion of goods
that are shipped to Canada and Mexico daily.
While trade between the United States and Canada has been strong since before the countries
signed their free trade agreement in early 1988, trade between the United States and Mexico
before NAFTA was somewhat anemic, totaling only $50 billion each way in 1993. Today, U.S.
exports to Mexico are valued at $213 billion and support 5 million U.S. jobs. U.S. agricultural
exports to Mexico have grown nearly 400 percent since NAFTA was implemented.
Mexico and Canada were the No. 2 and No. 4 export markets, respectively, for the U.S. pork
industry in 2020. From 1993, the year before NAFTA was implemented, to 2020, U.S. pork
exports to Mexico increased 16-fold, from just 98 million pounds to almost 2.1 billion pounds,
and exports to Canada went from 36.4 million pounds to nearly 500 million pounds. Both
NAFTA partners export some pork products to the United States.
Indeed, the pork industries in all three countries have become integrated to a large degree.
Canadian hog farmers in 2020, for example, sold about 4.4 million feeder pigs – ones 3-8 weeks
old, weighing from 12 to 60 pounds – to U.S. pork producers mostly in the upper Midwest who
23raised them to slaughter weight. Canada also ships about 800,000 hogs a year directly for
slaughter in U.S. packing plants.
The United States is Canada’s most important market for livestock and meat exports, and the two
countries have developed a symbiotic relationship with regard to pork production: Canada has
cooler summer temperatures that reduce seasonal infertility in its breeding animals, modern
breeding, gestation and farrowing facilities and the sows to populate them and – because of the
weak dollar – less expensive labor; and the United States provides large, efficient packing plants,
cheap feed, finishing space and the millions of acres of row crop fields – where corn and
soybeans are grown (the feed) – on which to apply the highly-valued manure produced by hogs.
The interdependence of the North American pork market is further illustrated by the growth of
the Mexican pork industry since NAFTA went into effect and U.S. pork exports to Mexico began
increasing. Estimates are that from 1995 to 2020 pork production in Mexico increased by 60
percent. That rise was the result of the eradication of some diseases, improvements in disease
prevention, growth in slaughter and processing plants as well as by a significant increase in
consumer demand. It also prompted Mexico to start exporting pork. The resulting increase in
demand for Mexican pork have led to even more imports of U.S. pork (it’s more economical for
Mexico to export high-value cuts to Japan, for example, and import lower-value cuts from the
United States.)
Further, Mexico’s pork exports needed to come from packing facilities that met international
standards, so starting in the early 2000s, the country’s government encouraged development of
more federally inspected plants. A significant portion of those facilities, however, were
underutilized. Mexico first filled the excess shackle space by importing live hogs from the
United States. More recently it has been relying on increased production (more hogs) from its
own producers, which has required importation of breeding stock – about 30,000 gilts annually –
from the United States.
Nearly all of the pork market integration among the United States, Canada and Mexico took
place under NAFTA, which set a zero-tariff rate for pork traded in North America.
Pork vs. Beef vs. Chicken: A Comparison
In most developed economies, individuals consume meat as their primary source of dietary
protein. In the United States and in most countries, three fundamental meat commodities form
the cornerstone of individual diets: pork, beef, and chicken. Lesser roles in the typical American
diet are claimed by fish, lamb, turkey, and other specialty meats. Although these different meats
are sometimes assumed to be near-perfect dietary substitutes, the individual meat commodities
are highly differentiated. This is true across the different meat commodities but also within a
single type of meat, where qualities and cuts are highly heterogeneous. In addition to the fact that
individual meats have numerous quality attributes that affect consumption, the animal industries
that are the sources of the meats are very different.
Production and marketing practices for pork, beef and chicken differ substantially, as do the
geographic patterns of production. Figures 11 through 13 illustrate the geographic distribution of
pork, poultry and beef cattle producers as of the third quarter of 2020 and the distribution of
hogs, broilers and beef cattle as determined by the 2017 Agricultural Census.
24Beef cattle are produced in nearly every state, with counties in the Great Plains and Western
United States having large numbers of beef cattle operations. In contrast, while hogs are
distributed in the wide regions mentioned earlier, major concentrations exist in Eastern North
Carolina and the Corn Belt. Poultry production also is geographically concentrated, with
operations mostly in the Southern United States and the Delta region.
Figure 11
25You can also read