Sustainable Bulk-Packaging System for Sugar Shipping: Case Study of the Enterprise Leader in Europe - MDPI
←
→
Page content transcription
If your browser does not render page correctly, please read the page content below
administrative
           sciences

Article
Sustainable Bulk-Packaging System for Sugar
Shipping: Case Study of the Enterprise Leader
in Europe
Mariarosaria Lombardi 1, *, Giuseppe Maffia 2 and Caterina Tricase 1
 1    Department of Economics, University of Foggia, 1-71121 Foggia, Italy; caterina.tricase@unifg.it
 2    Marketing Consultant, 1-71121 Foggia, Italy; giuseppemaffia@live.it
 *    Correspondence: mariarosaria.lombardi@unifg.it

 Received: 29 October 2019; Accepted: 25 November 2019; Published: 27 November 2019

 Abstract: From 2002 to today, world sugar production has steadily increased due to higher food
 consumption and biofuel production. Furthermore, in the European Union, the CAP 2014–2020
 new reform abolished the system of production and sugar exportation quotas by 1 October 2017.
 Therefore, since that date, the international sugar exchange has significantly increased in light of these
 new structural and political–economic conditions. Thus, companies offering a new bulk-packaging
 technology for international shipping could increase their market success. At the same time,
 the possibility for the same buyers (from sugar producers to logistic agencies) to use a safer and
 more sustainable packaging system has become important for economic and environmental cost
 reduction. The present study aims at presenting the experience of a small Italian enterprise that
 became a European leader in this sector due to its patents concerning a new, more efficient and
 sustainable product for bulk sugar transport in containers. This technological innovation represents
 not only a noteworthy sustainable business strategy for becoming more competitive in the market, but
 also a system for ensuring more effective sugar transport, mainly for the reduction in management
 costs (up to 65%) for buyers.

 Keywords: bulk packaging system; sugar market; sugar shipping; sustainable business;
 technological innovation

1. Introduction
      Sucrose (commonly known as sugar) is one of the most imported commodities worldwide for its
volume of production (178.6 Mt in 2018). It is mainly extracted from sugarcane (Saccharum officinarum
L., a perennial tropical plant) and sugar beet (Beta vulgaris var. Saccariphera, a biennial plant), since they
have a high concentration by weight: 7–18% and 8–22%, respectively (Schiweck et al. 2002). Sugar is
mainly transported in bulk (using auto silos and containers) or using bags of natural material (e.g.,
jute) or plastic (e.g., polyethylene or high-density polyethylene) of 25–50 kg in weight (Brody 2006).
The transport vector can be naval (ship), railway and road (TIS (Transport Information Service) 2017).
      In the last decade, world sugar production has gradually risen, due to higher food consumption
and biofuel production. This stressed a market situation characterized by a greater complexity of
trade between the producing and importing countries due to the high numbers of actors involved.
This is also reflected in the European Union (EU) market where the system of production and
sugar exportation quotas was definitively abolished by 1 October 2017, according to Regulation (EU)
No. 1308/2013, to increase competitiveness and strengthen the European market in world trade
(European Commission 2013).

Adm. Sci. 2019, 9, 91; doi:10.3390/admsci9040091                                    www.mdpi.com/journal/admsci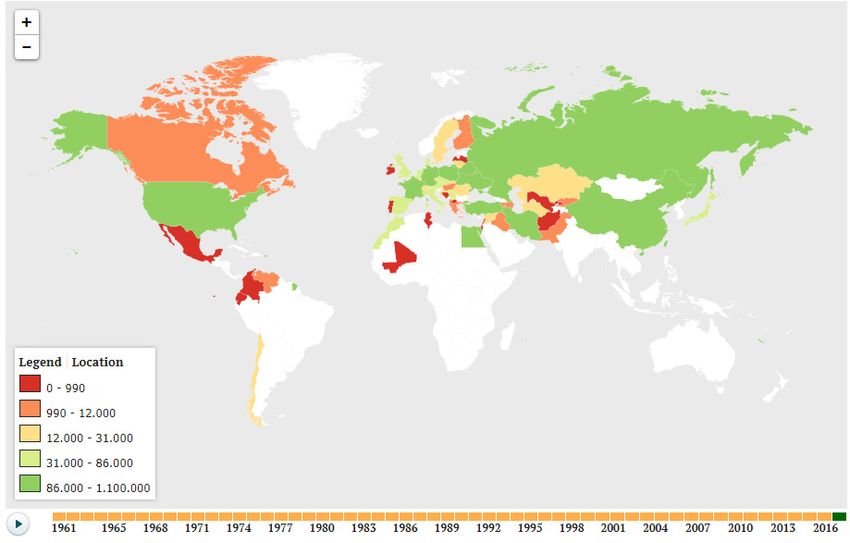
Adm. Sci. 2019, 9, 91                                                                              2 of 16

      Consequently, the movement of sugar, especially in maritime trade (with containers), will
significantly increase in the light of the EU market’s new structural and political–economic conditions.
Generally, the containers are upholstered internally by a packaging system (which may be unique
or a plurality of bags) to avoid food contamination with the metal of the box. To safeguard the
quality of the sugar transported, it is necessary that the international technical specifications are
respected (ISO 22000:2005 2017; BMT Survey 2017). Container packaging systems are, therefore,
of great importance to ensure not only the food safety of the commodity, but also a reduction in
economic and environmental costs (Hansen et al. 2012; Brody 2006). The role played by companies
that offer bulk-packaging systems for the shipping sector has indeed become increasingly essential,
since new and competitive scenarios are opening up.
      The ability to offer an innovative packaging able to reduce environmental and economic costs for
buyers (from sugar producers to logistic agencies), linked, for example, to easier commodity loading
and unloading and packaging disposal, also becomes crucial for packaging producers’ market success.
      In light of this, the present study aims at presenting the experience of a small, young Italian
enterprise (i.e., Eceplast) that launched an innovative product (Barless Liner). It is certified for the
quality management of production processes, environmental sustainability and food safety (ISO 22000),
allowing the company to be recognized as a leader in bulk packaging systems (container liners) at the
European level.
      Hence, the paper, starting by describing the sugar market, provides useful information on
a “virtuous” example of sustainable business strategy and on a specific “know-how” concerning the
importance of using sustainable bulk commodity packaging to reduce economic and external costs in
this sector. The methodology used to carry out this study is based on a qualitative analysis (systematic
review) and face-to-face interview. The former has been necessary to gather data aimed at discussing
the main topic, that is, the bulk-packaging system for the shipping sector, according to an innovative
and sustainable approach. The latter has been used to collect in-depth information about the company,
which is selected as a case study.
      The paper was divided into the following sections: a literature review about maritime transport,
with a specific focus on dry bulk shipping; description of the sugar market, highlighting the complex
trade between the producing and importing countries, above all in the EU; the packaging systems
used for international sugar shipping, focus on bulk-packaging systems; presentation of the case study
and its sustainable business due to the adoption of innovation in bulk-packaging systems, underling
its environmental and economic advantages; and conclusions.

2. Literature Review
      Over the past century, international maritime transport has been the principal mode for allowing
the exchange of commodities amongst countries, thus favoring globalization. Currently, it continues to
play an essential role in international trade since it covers, in the world’s economy, over 90% of the
world’s trade. In 2018, the total volumes of commodities carried by sea reached an all-time high of
11 billion tons (with a growth of around 3.9% per year in the last decade). This data is expected to grow
by 3.8% per year in the next 5 years. Dry bulk commodities, followed by containerized cargo, other
dry bulk, oil, gas and chemicals, contributed the most to this growth. Growing demand for goods and
raw materials and more consolidation within the shipping industry are estimated to increase business
operations for ship-owners even if, in 2019, uncertainty concerning trade tensions between China
and the United States has had negative consequences on the world economy, leading to a decelerated
demand for dry bulk and tankers (UNCTAD 2019; Clarksons 2019). Consequently, shipping is one of
the most finance-intensive industries in the world and future financing needs are expected to increase
(Wohlstrand and Marek 2014).
      This mode has also changed greatly in recent years because more attention has been paid to
reducing its environmental impact and to improving its efficiency by introducing containerization and
ultra-large container vessels, that allow relevant economies of scale (Halim et al. 2018); designing for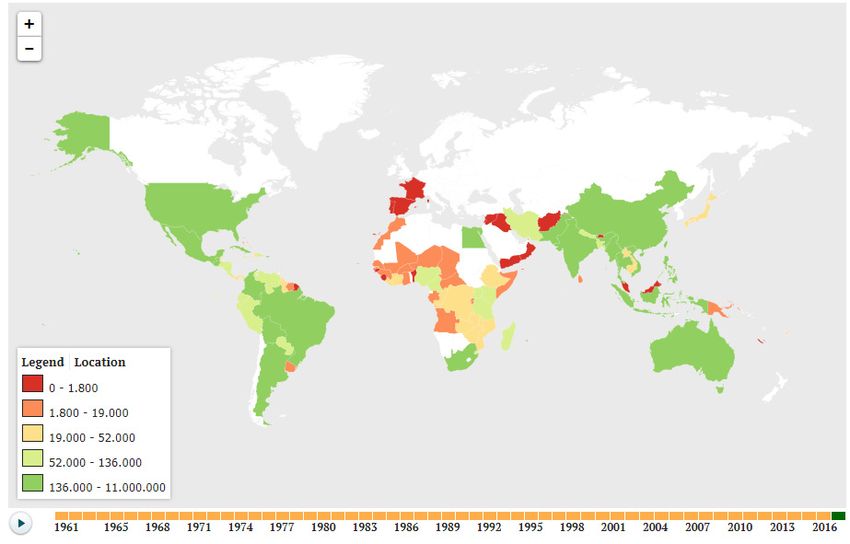
Adm. Sci. 2019, 9, 91                                                                                3 of 16

ports’ effective voluntary programs and appropriately motivating participation from global shipping
companies that visit these ports (Linder 2018); increasing energy efficiency in shipping, through
reduced speed at sea, enabled by a shorter time in port, whilst maintaining the same transport service
(Johnson and Styhre 2015).
      To support this statement, the authors conducted a systematic review to verify how many academic
papers have been published on this topic and to describe the scientific evolution of these studies.
For this reason, data were collected through a combination of (a) database searches (cross-discipline
platforms of Elsevier) as of 7 November 2019, and (b) screening references of studies retrieved under
(a). The aim was to select highly referenced studies, to identify, highlight and assess all data related to
the above-mentioned subject. For an initial selection, the key words were: (i) sugar market; (ii) sugar
shipping and/or transport; (iii) maritime transport, (iv) bulk packaging system and, (v) dry bulk
shipping. The search was not limited to a specific period.
      The qualitative analysis revealed a few articles on the specific topic (sugar along with bulk
packaging system). Indeed, the majority of in-depth studies were expressly focused on: (a) the
environmental impact of international trade by shipping and aspects of the dry bulk shipping
industry; and, (b) the sugar industry, where some details were provided for overall sugarcane
agribusiness diversification.
      Concerning the importance of environmental concerns, (Gritsenko 2017) stressed that: “maritime
transport is a significant contributor to the global Greenhouse Gas (GHG) with emissions set to grow”.
According to the Third International Maritime Organization (IMO) GHG Study, the annual CO2
estimate in international shipping decreased from 2.8% in 2007 to 2.2% in 2012. Nevertheless, this
value will considerably increase by 2050, reaching 17% of global GHG, in the case of maintaining the
current regulatory measures (Energy Efficiency Design Index—EEDI, and the Ship Energy Efficiency
Management Plan—SEEMP), while the European Commission, in 2011, set a goal to reduce emissions
from shipping by at least 40% by 2050 (European Commission 2011).
      For this reason, it is useful to complement technical standardization in the areas of ship design
and operations, with policies targeting shipping sectors.
      To this end, a previous study, written by (Wang et al. 2015), declared that: “various market-based
measures have been proposed to reduce CO2 emissions from international shipping. One promising
mechanism under consideration is the Emission Trading Scheme (ETS)”. They demonstrated,
by elaborating an economic model, that currently the ETS application is not effective, due to the
particular characteristics of the sector: inhomogeneous carriers, and different market structures and
companies across different shipping sectors. Therefore, it was important to continue to study and
evaluate certain key issues regarding the ETS itself, although numerous political and institutional
factors might be responsible for such slow progress.
      Some years later, (van der Loeff et al. 2018) confirmed that: “although maritime transport offers
by far the most energy efficient mode of long-distance mass cargo transportation, it has a significant
responsibility for anthropogenic climate change . . . Despite its importance, the maritime shipping
sector has been traditionally overlooked in climate mitigation discussions, since this sector was largely
neglected in the 1997 Kyoto Protocol”. The main problems for effective application of CO2 abatement
measures, in this sector, involve the absence of reliable emissions data and the inherent difficulty of
exactly accounting for the quota of emissions attributable to the involved countries, companies and
commodities, as well as the threat to global trade interests.
      Specific research on seaborne containers, by (Yang et al. 2018), highlighted that: “uncertainties
as a result of climate change, epidemics, and increasing economic upheaval create risks for the
proper functioning of container supply chains (CSC) and stimulate the research and development
of resilient and sustainable container transportation”. Consequently, it is necessary to include
green perspectives into the management of intermodal container transportation for improving the
environmental performance of international trade flows, mainly considering the different methods
Adm. Sci. 2019, 9, 91 4 of 16
and practices currently used in various transport segments (e.g., port, shipping and road) and
geographical regions.
This aspect was also stressed by (Shin et al. 2018), stating that: “research on sustainability of
maritime logistics is on the rise, yet fragmented in terms of conceptual development, empirical
testing and validation, and theory building. These issues are related to green ports/shipping, carbon
emission/climate change and region-specific environmental regulation/management”. Specifically,
they stressed that, in the case of maritime logistics, it is necessary to implement optimal logistics
systems, sustainable supply chain design, and service quality management in order to deal with the
sustainability issues.
As regarding the aspects of dry bulk shipping industry, a first study in the literature of maritime
economics, examining the impact of subsidies on the fleet renewal schemes of shipping companies,
has been presented by (Yang et al. 2019). They proposed a “model of general applicability and use
to shipping companies wishing to design efficient ship renewal schemes under various market and
regulatory circumstances”. In the framework of environmental sustainability, this research could
represent a starting point to provide useful evidences to governments and supranational regulatory
organizations, such as IMO and the European Commission, for implementing or evaluating scrapping
subsidies for environmental or other purposes.
More specifically, (Moutzouris and Nomikos 2019) analyzed the relationship between second-hand
vessel prices, net earnings, and holding period returns in sectors of the dry bulk shipping industry.
They showed that “high shipping earnings yields strongly and negatively predict future net earnings
growth. Furthermore, there is no consistent evidence of time-varying expected returns in the second
hand dry bulk shipping industry”. These evidences had never been reported before in the shipping
literature, thus representing a valuable study for providing a framework to determine prices in shipping
assets, with finite economic lives and also subject to wear and tear. Certainly, this data might also affect
the application of environmental subsidies and actions for reducing the GHG emissions released by
the dry bulk shipping industry.
In this framework, it is also interesting to examine which innovations in packaging systems for
dry bulk shipping industry are able to ensure not only the food safety of the dry commodity, but also
the reduction of economic and environmental costs for logistic operators. This is mostly true for the
sugar shipping that will increase due to the new EU structural and political–economic conditions,
as previously described.
In addition, (Bezuidenhout and Trevor 2009) highlighted that: “almost none of the research
conducted to date brings long-term sustainability, environmental issues, value adding, the sugar
markets and marketing beyond the mill into a overall supply chain context. This is considered
a significant shortcoming in the sugar industries of the world, since many modern supply chains do
consider these issues holistically”. This means that researchers have mainly investigated the integration
of sugarcane supply systems, especially in a harvesting context, assessing long-term strategic issues,
while omitting the importance of shipping logistics.
Moreover, (Higgins et al. 2007) underlined that: “sugar industries around the world are primarily
“push chains”, where sugarcane is pushed through the chain to produce raw sugar with minimal product
differentiation and sold at market value as a bulk commodity. A general sugar value chain consists of
growing, harvesting, cane transport, mill processing, sugar transport and storage/shipping/marketing
sectors”. Consequently, in order to increase the sugar value chain opportunities, a technical solution
along with the participation of actors from across the chain, are needed, considering also the last phase
of the sugar value chain, which is the shipping sector.
Therefore, the present study may represent a starting point to deal with one aspect of the sugar
supply chain and to develop further empirical researches.Adm. Sci. 2019, 9, x FOR PEER REVIEW 5 of 16
sugar-producing
Adm. Sci. 2019, 9, 91 countries are India, China, Thailand and Pakistan, which contributed to almost5 72%
of 16
of the total quantity (Knoema 2019a).
Different, however, is the diffusion of sugar beet, predominantly present in the northern
3. The Sugar Market
hemisphere of the world (Figure 1b). In 2017, its total surface area was 4.9 Mha, 24.0% of which was
located
3.1. in the
World Russian Federation. The other leading countries are the United States, France, Germany
Market
and Turkey, which together account for 56.4% of the globally harvested product (Knoema 2019b).
Sugar
Accordingcan to
be the
extracted from data
most recent two available,
different plants, whichproduction
world sugar are cultivated
stoodfor their Mt
at 178.6 agronomic
in 2018;
characteristics, in different areas of the world.
80.2% came from sugarcane and the remaining 19.8% from sugar beet. Average per capita
Sugarcane,
consumption wasa tropical plant, isless
22.6 kg, slightly present
than in
thethe southern
value partinof2016
recorded the (23
planet
kg),(Figure 1a). demand
and global In 2017,
the
wastotal
172.4harvested
Mt (with surface areaannual
an average was 25.9 Mha, of
growth mostly
2.01%located in Brazil
from 2001). (more
By the endthan 39%).
of 2018, The sugar
world other
major sugar-producing countries are India, China, Thailand and Pakistan, which contributed
stocks rose modestly by 0.62 Mt, reaching 111.1 Mt (or 64% of global consumption, more than the to almost
72%
60.8%ofrecorded
the total in
quantity (Knoema 2019a).
2017) (International Sugar Organization (ISO) 2019).
(a) (b)
Figure 1. Harvested surfaces for sugar cane (a) and sugar beet (b)
(b) in
in 2017.
2017. Source: (Knoema
(Knoema 2019a,
2019a,
2019b).
Different, however,
The ten main is the diffusion
producers and theirofrelative
sugar beet, predominantly
amount offered onpresent in thein
the market northern hemisphere
2018 are shown in
of the world (Figure 1b). In 2017, its total surface area was 4.9 Mha, 24.0% of
Figure 2. India is the most important country, with more than 33 Mt of sucrose produced which was located in the
by
Russian Federation.
sugarcane, followed The
by theother leading
EU-28, withcountries
about 18 are
Mt the United
from sugarStates,
beet. France, Germany and Turkey,
which together account for 56.4% of the globally harvested product (Knoema 2019b).
According to the most recent data available, world sugar production stood at 178.6 Mt in 2018;
35
80.2% came from sugarcane and the remaining 19.8% from sugar beet. Average per capita consumption
was 22.6 kg, slightly less
30 than the value recorded in 2016 (23 kg), and global demand was 172.4 Mt
(with an average annual growth of 2.01% from 2001). By Sugar
thecane
end ofSugar beetworld sugar stocks rose
2018,
25
modestly by 0.62 Mt, reaching 111.1 Mt (or 64% of global consumption, more than the 60.8% recorded
Production in Mt
in 2017) (International Sugar Organization (ISO) 2019).
20
The ten main producers and their relative amount offered on the market in 2018 are shown in
Figure 2. India is the most
15 important country, with more than 33 Mt of sucrose produced by sugarcane,
followed by the EU-28, with about 18 Mt from sugar beet.
10
The volume of sugar exchanged at the international level in 2018 decreased by almost 4 Mt tones
compared to 2017. The major exporters are Brazil (21 Mt) and Thailand (11 Mt), while the main
5
importers are Indonesia and China (with more than 5 Mt) and the United States (almost 2.5 Mt).
0
India Brasil EU-28 Thailand China USA Pakistan Mexico Russia Australia
Countries
Figure 2. Main producers of sugar in the world (2018). Source: our elaboration on data from the
(International Sugar Organization (ISO) 2019).
The volume of sugar exchanged at the international level in 2018 decreased by almost 4 Mt tones
compared to 2017. The major exporters are Brazil (21 Mt) and Thailand (11 Mt), while the main
importers are Indonesia and China (with more than 5 Mt) and the United States (almost 2.5 Mt).Figure 1. Harvested surfaces for sugar cane (a) and sugar beet (b) in 2017. Source: (Knoema 2019a,
2019b).
The ten main producers and their relative amount offered on the market in 2018 are shown in
Figure
Adm. Sci. 2. India
2019, is the most important country, with more than 33 Mt of sucrose produced
9, 91 6 ofby
16
sugarcane, followed by the EU-28, with about 18 Mt from sugar beet.
35
30
Sugar cane Sugar beet
25
Production in Mt
20
15
10
5
0
India Brasil EU-28 Thailand China USA Pakistan Mexico Russia Australia
Countries
Figure 2. Main
Figure 2. Main producers
producers of
of sugar in the
sugar in the world
world (2018).
(2018). Source:
Source: our
our elaboration
elaboration on
on data
data from
from the
the
(International Sugar
(International Sugar Organization
Organization (ISO)
(ISO) 2019).
2019).
3.2. The
TheEuropean
volume ofUnion Market
sugar exchanged at the international level in 2018 decreased by almost 4 Mt tones
compared
Since 2006, the sugar CMOexporters
to 2017. The major (Common are BrazilOrganization
Market (21 Mt) and inThailand
the EU)(11
hasMt), whilecompletely.
changed the main
importers
The are Indonesiainand
first intervention thisChina
sense(with
was more than 5 Mt)
Regulation (EC)and
Nothe United States
318/2006, (almost
proposed 2.5 Mt). the
to increase
competitiveness of the entire sugar supply chain through rationalization and concentration of
production means and substantial investments (European Commission 2006). With such a system,
sugar, eventually produced in surplus, was actually withdrawn from the market, and farmers were
asked to reduce the sowing for the following year. The reform came about for three reasons: to make
the sugar regime coherent with the new plan of the CAP; to prevent internal imbalances in the EU
market, resulting from the implementation of the EBA (European Banking Authority, which provided
zero-duty imports from developing countries); and to reduce EU domestic production, following the
unfavorable outcome of the WTO panel in 2005, which provided for observance of preferential import
volumes (Lang et al. 2017).
After more than ten years of rigid regulation (COM reform of 2006)1 , which has isolated the
Community market from price fluctuations, there has been a strong reduction in the sector’s businesses,
above all in Italy—from more than 200 plants in 2003 to fewer than 110 in 2018; from more than
350 thousand sugar beet growers to 140 thousand (De Molli 2017; CEFS (Comite Europeen Des
Fabricants Du Sucre) 2018).
Since 1 October 2017, the market situation has further changed as a result of the definitive
abolition of sugar production and export quotas. This was foreseen in the second intervention of CAP
reform, Regulation (EU) No. 1308/2013 of 17 December 2013, aimed at increasing competitiveness and
strengthening the European market in world trade, for which rules were laid down in December 2017
(European Commission 2013, 2017).
In the beginning, market experts agreed on the absolute conviction that EU production would be
more competitive than that of sugarcane coming from abroad. Moreover, they believed that, by the
following season, the EU would have returned to being a net exporter. In addition, they expected
another shock in the sugar CMO over the next few years due to “Brexit” (Great Britain’s exit from
the European Union), because some of the major sugar factories in Europe are located in the United
1 The reform obliged all State members to reduce the sugar production costs below 405 €/t.Adm. Sci. 2019, 9, 91 7 of 16
Kingdom. Thus, there would have been opportunities, but also risks for likely greater market volatility,
as long as the several industries did not find a new equilibrium.
Unfortunately, in the short term, this scenario did not occur as predicated. The entire EU beet
sugar sector continues to experience severe instability. Actually, the effects of the new reform, in the
marketing year 2018/2019, have not always been positive: sugar production decreased by 17% (17.6 Mt)
in 2017/2018; sugar consumption remained stable at 17.5 Mt; and cultivated surfaces slightly reduced
to 1.62 Mha (International Sugar Organization (ISO) 2019; European Commission—Committee
for the Common Organization of Agricultural Markets 2019). These data confirm that adaptation
to the post-quota situation has not been easy for the sugar growers and processors who fell into
a crisis (a 30% loss on their income) due to low prices and the abundant supply of sugar stocks
(CEFS (Comite Europeen Des Fabricants Du Sucre) 2018). In July 2019, prices reached the lowest level
(320 €/t) of the last decade, even below the reference threshold (404 €/t) (the benchmark for the
health of the sector) (CIBE—International Confederation of European Beet Growers 2019a, 2019b;
European Commission—Committee for the Common Organization of Agricultural Markets 2019).
These sugar price fluctuations and collapse were caused by world trade conditions, positions of
speculators and third countries dumping subsidized sugar on the world market (minus 36% in the
EU since September 2017) (European Commission—Committee for the Common Organization of
Agricultural Markets 2019). The only winners of the reform have been the sugar-using food and
beverage industries, to whom around 2 billion euros was transferred at the expense of farming families
(CIBE—International Confederation of European Beet Growers 2019b), despite sugar producers having
engaged in severe reorganization to increase their competitiveness and sustainability. In August 2019,
the current European Union Agricultural Commissioner stated, “there is evolving evidence that the
Adm. Sci. 2019, 9, x FOR PEER REVIEW 7 of 17
sugar market is starting to improve. Indeed, production and stock levels are adjusting and spot prices
areadjusting
are said to beand around
spot 430 €/t are
prices at the moment”
said (European
to be around 430 €/tCommission—Committee
at the moment” (Europeanfor the Common
Commission—
Organization of Agricultural Markets 2019).
Committee for the Common Organization of Agricultural Markets 2019).
Inthis
In this context,
context, as
as shown
shown by by Figure
Figure 3,
3, after
afterthe
the11October
October2017
2017there
therehas
hasbeen
beena arelevant increase
relevant increase in
white
in white sugar
sugarexports and
exports andsimultaneously
simultaneously a reduction in imports.
a reduction However,
in imports. However,thisthis
positive effect
positive diddid
effect not
last. Maybe much more time is needed to make EU sugar beet production more competitive
not last. Maybe much more time is needed to make EU sugar beet production more competitive than than that
of sugarcane.
that of sugarcane.
Figure
Figure 3.
3. The
TheEUEU sugar
sugar trade
trade after
after 11 October
October 2017. Source:
Source: (European
(European Commission—Committee
Commission—Committeefor
for
the Common Organization of Agricultural Markets
the Common Organization of Agricultural Markets 2019).2019).
3.3. The Italian Market
After the CMO reform of 2006 and the following reform of 2013, Italy was the country that had
renounced the largest volume of production quotas, about 1 Mt, with a reduction of 67%, passing
from 19 operating plants (2005) to three (2018) (De Molli 2017; Gallerani 2018; COPROB—
Cooperativa Produttori Bieticoli 2019).Adm. Sci. 2019, 9, 91 8 of 16
3.3. The Italian Market
After the CMO reform of 2006 and the following reform of 2013, Italy was the country that had
renounced the largest volume of production quotas, about 1 Mt, with a reduction of 67%, passing
from 19 operating plants (2005) to three (2018) (De Molli 2017; Gallerani 2018; COPROB—Cooperativa
Produttori Bieticoli 2019).
In 2018, the cultivated sugar beet surface amounted to just over 34,000 ha, a drastic 97.8%
reduction since 2002 (ISTAT 2019; European Commission—Committee for the Common Organization
of Agricultural Markets 2019). White sugar production amounted to 0.22 Mt in the marketing year
2018/2019, almost 80% less than 2006 (COPROB—Cooperativa Produttori Bieticoli 2019), but the
demand was 1.6 Mt (Agostini 2019). Consequently, Italian sugar production covered only 12% of
the demand, because the prices and margins of the sector have been greatly reduced (Agostini 2019).
Two plants provide the local supply and they are located at Minerbio (Emilia Romagna region) and
Pontelongo (Veneto region) in Northern Italy. They are owned by Co.Pro.B2 (national market leader
and unique cooperative beet sugar producer). There is another plant (located at Brindisi [Apulia
region] in Southern Italy) that is owned by the foreign joint venture SRB Spa3 . This plant only refines
imported raw sugar and is the only one of its kind in Italy and the second in Europe (SRB Spa 2019).
Therefore, it is clear that the country was forced to import white sugar from European countries
(especially France and Germany) and raw sugar from the Extra-EU (Mauritius) (International Sugar
Organization (ISO) 2019) to meet internal demands.
The Italian situation, in comparison with its competitors, such as France and Germany, was
influenced by the highest production costs that affected the final price on the market, equal to 386 €/t
versus 324 €/t in Germany (updated in July 2019) (European Commission—Committee for the Common
Organization of Agricultural Markets 2019). Therefore, this liberalization mainly favored some member
States (Germany and France), which have increased their beet-growing agricultural areas, generating
over-production and creating an EU oligopoly market, to which Italy, like the rest of Southern Europe,
is in danger of succumbing (Ronchetti 2018). Currently, Italy is increasingly an exporter of products
obtained from the processing of imported base products.
4. International Sugar Shipping
4.1. Technical Specifications for Sugar Quality
Before explaining the most common packaging typologies used for international sugar shipping,
it is necessary to clarify and describe the international technical specifications required to safeguard
the quality of the transported sugar (ISO 22000:2005 2017; BMT Survey 2017).
The first is the humidity, which has to be between 55% and 65%. In fact, a sudden process of
fermentation and mold production is triggered if the value exceeds 75%; on the contrary, a value less
than 50% leads to toasting and hardening of the product.
Another fundamental element is the temperature, which must be between −25 ◦ C and +25 ◦ C.
Rapid variations within this range should be avoided, to prevent the formation of water vapor and/or
recrystallization of the commodity, creating sucrose agglomerates.
Sugar water content is another important parameter: it must be between 0.03% and 0.05%.
If the water content exceeds this range, the product goes into sugar inversion (dissolution of
monosaccharaides, glucose and fructose).
The last technical factor is ventilation, which must normalize the temperature when it undergoes
significant variations. For example, switching from cold to hot zones creates a heating of the outside
2 This was addressed to food and beverage production (75%), while only 25% was allocated directly to the Large Distributed
Organization and to the Hotel, Restaurants and Bars sector (Ho.Re.Ca.).
3 It is a joint venture between Cristal Union (European leader for sugar beet) and ASR (world leader for sugar cane refining).Adm. Sci. 2019, 9, 91 9 of 16
layer of the sugar. This phenomenon causes the formation of water vapor that creates sucrose
agglomerates in the outside layer and melting and fermentation in the internal layers, producing sugar
syrup. Switching from hot to cold areas triggers the opposite mechanism, causing the loss of fluidity of
the product (TIS (Transport Information Service) 2017; BMT Survey 2017).
4.2. Packaging for Sugar International Shipping: The Bulk Container Liner Bags
Over time, the packaging for sugar transport has been changed and improved. There are
several typologies that vary according to the material used (polypropylene—PP, high-density
polyethylene—HDPE, and jute) or shape (bags and sacks). In this case, the weight capacity ranges,
on average, from 25 kg to 100 kg (Brody 2006). It is more common to use packaging for the transport in
bulk (using auto silos and containers) to save space and thereby transport more sugar (weight capacity
from 500 kg to 3 t), assuring always the food safety of the product. The transport vector can be naval
(ship), railway and road (TIS (Transport Information Service) 2017).
The packaging market for transport in bulk is increasing and includes various segments: bulk
container liners, flexi-tanks (for liquid), and flexible intermediate bulk containers (FIBC). The most
recent data stated that, in 2013, FIBC was the largest product segment of the overall market. Bulk
container liners held a 35% share and are expected to display moderate growth until the end of 2020
(TMR—Transparency Market Research 2016). As shown in Figure 4, in 2020 North America (mainly
the United States) and Europe will continue to dominate the packaging market for transport in bulk,
Adm. Sci. 2019, 9, x FOR PEER REVIEW 9 of 16
with 31.0% and 28.5%, respectively. Indeed, there are several multinational cooperation and European
industries, which
manufacturers operate
in the worldinare
theAnthente
European community
(China); market(USA)
Protekcargo (Bulkand
Flow 2017; Europages
Eceplast (Italy), this 2017).
latter
Asia (mainly China) will be the fastest growing region, with 25.8% in
will be the case study of this study (TMR—Transparency Market Research 2016). 2020.
2013
14.6%
14.9% 2020
32.3% 31.0%
North America
North America
24.8% Europe
25.8% Europe
Asia Pacific
Asia Pacific
RoW
28.3% 28.3% RoW
Figure 4. Packaging
Figure 4. marketfor
Packaging market forthe
the transport
transport in bulk.
in bulk. Source:
Source: (TMR—Transparency
(TMR—Transparency Market
Market Research
Research 2016).
2016).
In terms of revenue, global bulk container packaging will be $1596 million by 2020, with an average
5. A Newgrowth
potential Sustainable Bulk-Packaging
of 9.8% from 2014 to 2020System: Eceplast’s BarlessMarket
(TMR—Transparency Liner Research 2016). The major
applications for this type of packaging are food and beverages, non-hazardous
In order to collect information about the case study, i.e., Eceplast S.r.l., the chemicals,
European andleader
other
(e.g., pharmaceuticals).
enterprise The first category
in the bulk container will
liners, the be the fastest
method growing
of in-depth application
face-to-face segment. Its
interviewing market
has been
share passed from 33.0% by 2013 to 34.7% by 2020, due to growth in population
used. Specifically, the authors asked specific questions about the company and the technological and subsequent
increase of food
innovation productasdemand.
introduced Currently,
a sustainable the most
business important
strategy bulk acontainer
to pursue liner manufacturers
higher competitiveness in
in the
the world are Anthente (China); Protekcargo (USA) and Eceplast (Italy), this latter
market. The interviewees were N. Altobelli (Commercial director) and S. Di Cori (Investment and will be the case
study of this study (TMR—Transparency Market Research 2016).
regulations).
In Italy, the company Eceplast S.r.l. is certainly an interesting case because, starting from a patent
5. A New Sustainable Bulk-Packaging System: Eceplast’s Barless Liner
for a packaging system for the transport of dry bulk in containers, it has increased its competitive
In order
advantages in to collect
this sector.information about the case study, i.e., Eceplast S.r.l., the European leader
enterprise in the bulk
The company, founded container liners,
in 1995, the method
is located ofindustrial
in the in-depth face-to-face
zone of Troia interviewing
(a small townhasinbeen
the
used. Specifically,
Apulia the authors
region of Southern Italy) asked
and hasspecific questions
90 employees. about
From the company
its founding year and
untilthe technological
2008, production
innovation
was markedintroduced as a sustainable
by the implementation of abusiness strategy
first patent to pursue
to facilitate the aloading
higher and
competitiveness
unloading ofinbulk
the
market. The interviewees were N. Altobelli (Commercial director) and S.
commodities. This patent has allowed the company to become a leader in the European UnionDi Cori (Investment and
regulations).
(Altobelli 2019).
From 2008 to today, the company has been in a phase called Industrial 4.0, characterized by
technological automation of its processes. In addition to the production plant, the site hosts
administrative and commercial offices, a research and development sector and quality control.
Eceplast’s activities are mainly the production of packaging for dry and liquid bulk transport
and for spare parts and components for the automotive sector. Over the years, it has been able toAdm. Sci. 2019, 9, 91 10 of 16
In Italy, the company Eceplast S.r.l. is certainly an interesting case because, starting from a patent
for a packaging system for the transport of dry bulk in containers, it has increased its competitive
advantages in this sector.
The company, founded in 1995, is located in the industrial zone of Troia (a small town in the
Apulia region of Southern Italy) and has 90 employees. From its founding year until 2008, production
was marked by the implementation of a first patent to facilitate the loading and unloading of bulk
commodities. This patent has allowed the company to become a leader in the European Union
(Altobelli 2019).
From 2008 to today, the company has been in a phase called Industrial 4.0, characterized
by technological automation of its processes. In addition to the production plant, the site hosts
administrative and commercial offices, a research and development sector and quality control.
Eceplast’s activities are mainly the production of packaging for dry and liquid bulk transport and
for spare parts and components for the automotive sector. Over the years, it has been able to market
about 380 packaging models in 90 countries. Almost all production lines are highly automated, with
on-board computers, sensors and integrated intelligence.
The various transport packaging typologies can be grouped as follows: liner bags for dry
bulk products, and thermos-protectors to protect and ship temperature-sensitive cargo. These were
designed to lower costs and minimize carbon footprint with reuse and recycling programs. Eceplast is
introducing a new, more scientific approach to thermal issues on the European intermodal transport
market: paper sacks, spare parts and components for the automotive sector (Eceplast 2019).
The present study focuses on packaging systems concerning dry bulk product transport (in
this case sugar) with container. The company is the major producer of “liner bags” for containers,
as previously mentioned. Generally, the liner bags use a container’s open side for loading and
unloading of bulk products. They are systems made of linear polyethylene and polyethylene, both
of low density, reinforced with raffia fabric and with the possibility of using steel bars, anchored to
a stiffening wall with special holes.
Thanks to the first Italian patent, released in 1998, No. IT1290065, Eceplast launched on the
international market an innovative transport system that is effective, hygienic and 100% waterproof.
This system provides the welding of the cylindrical plastic pieces flexible on perpendicular plastic
surfaces to facilitate loading and unloading and enhance security and structural integrity
The liner bag price for a buyer is equal to 80 euros, without considering reduction (up to 65%)
of container management costs due to the following: elimination of cleaning costs; optimization of
transport streams (containers after discharge are ready to be loaded); decrease of cargo bed wear (every
loading without a liner damages floor planes, which deteriorate due to the necessary subsequent
washings); and, obviously, cleaner containers have a greater benefit (Altobelli 2019). Finally, the liner
bags are waterproof, as they avoid percolation losses during transportation and prevent expensive
penalties. For hazardous materials, they represent the ideal solution to reduce the risk of contamination
and pollution.
Eceplast’s liner bags have been certificated by ISO 9001:2008 and ISO 14000:2004 rules, for quality
and environmental management, respectively, and by ISO 22000:2005 for food safety management.
This latter certification, obtained in 2010, is designed to harmonize existing national and international
standards about food safety and Hazard Analysis and Critical Control Points (HACCP) (Eceplast 2019).
The ISO 22000 standard was published by the TC34 Committee in September 2005, under the name
“Food Safety Management Systems—Requirements for any Organization in the Food Sector”, and
adopted by the UNI (National Board of Unification) in April 2006. The set of technical standards concern
food safety “from field to table”, based on the fundamental elements recognized internationally by all
operators in the sector (ISO/TS 22002-1:2009; 22004:2005; 22003:2007; ISO 22005:2007; ISO 22006:2009)
(ISO 22000:2005).Adm. Sci. 2019, 9, 91 11 of 16
The Patent of New the Barless Liner: Sustainable Business Strategy
In the “liner bags” category, special attention is paid to a new product called a Barless Liner.
Its patent application was submitted in April 2014 with the aim of introducing a technological
innovation in the “standard liners”, mainly to eliminate the high disposal cost for final buyers
(commodity producers and/or logistics companies) due to the presence of steel bars.
Eceplast, starting from what has already been done by Illinois Machine Works (Texas) with
patent No. USA US2007267410, has deposited a patent application, No. PCT/IT2014/000099, entitled
“Supporting structure for a container cargo”. Indeed, the proposed innovation is to remove steel bars
and reduce general costs, thanks to the maximization of bulk loading times, the higher installation
speed, and the higher level of safety compared to standard products. In other words, its purpose is to
provide a supporting structure that is simpler to be realized and more efficient from a structural point
of view (Altobelli 2015). Additionally, the Barless Liner has a positive impact on the environment,
because its use reduces the amount of waste in the short and medium term. In fact, it can be 100%
recycled (Eceplast 2019). The Barless Liner’s price is 100 euros; even if more expensive than standard
liner bags (+20 euros), this product is the best solution, since the buyer does not support other costs
(e.g., security, disposal, loading and unloading, and taxes linked to weight).
Specifically, the new support structure is located on the open side of a container, and it is
characterized by a series of pre-tensioned belts, which are connected to an elastically deformable
composite element in the center of the ring. This new system allows optimization of the assembly
phases of the supporting structure. The tension of the entire structure is, in fact, adjustable, acting on
any belt.
Furthermore, the benefits and technology of Eceplast’s barless innovation are shared with the
container shipment world to create a “barless safety system (BSS) network” involving customers,
distributors, suppliers, and end-users in this crowdsourcing innovation. The network improves
customer value and drives advancements across the shipping industry. Eceplast grants access to BSS
developments, good practices for the sales team, a better price, tutorial video, and return and refund
policy (Eceplast 2019).
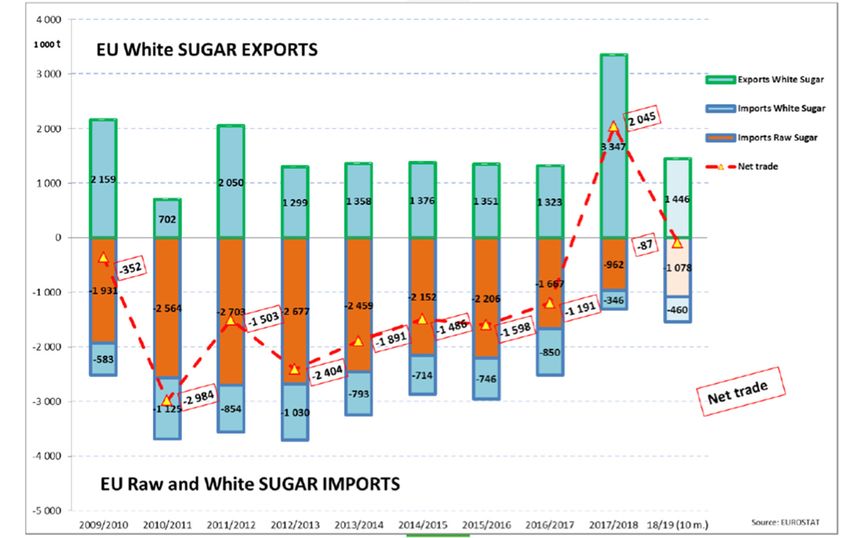
Figure 5 represents the set of images, attached to the patent, for a detailed description of the
technological innovation:
3 Figure 5a shows the cargo-supporting structure applied to the rear open side of a generic container;
3 Figure 5b is a front view of the open side, with the cargo-supporting structure;
3 Figure 5c indicates a detail of the deformable and non-extensible element;
3 Figure 5d illustrates a side view of the inner liner of the container.
Figure 5a describes the open side of an ISO4 (5) 20-foot or ISO 40-foot (6 or 12 m) container with
the cargo-supporting structure, which is the object of the invention. In detail, it is made up of a liner for
the transport of bulk (4). Furthermore, the structure consists of pre-tensioned belts (1), deformable and
non-extensible element (2) and tensioner (3) means. There is also an opening for the introduction or
extraction of bulk (6). The innovation is the deformable element conforming to a circular ring, in which
the belts pass. This can be deformed but not spread wide because, inside, it has wire that gives greater
rigidity to the ring itself.
In the front view (Figure 5b), it is possible to notice the system of belts anchored on the inner wall
of the container. Each of them must also be fixed to the center ring, to act as support of the same; in
addition, they are arranged horizontally and diagonally, with anchorages in the opposite position.
There is a possibility that each belt can move around the ring several times, mostly for assuring the
4 An ISO container is a metal parallelepiped, whose measurements were established internationally in 1967. In front of
a common width of 8 feet (2.44 m) and a common height of 8 feet and 6 inches (2.59 m), they are spread in two standard
lengths of 20 and 40 feet.Adm. Sci. 2019, 9, 91 12 of 16
anchorage. The whole structure is tensioned by means of special ratchet levers (3), which can act on
each belt. It is preferable to act on the belt located at the bottom of the liner (4). Unlike known systems,
this type of structure can be tensioned by a single cargo point to balance the entire structure uniformly,
thanks to the inner structure of the ring.
Figure 5c shows the central ring, constituted of an elastomer matrix and a reinforcing element.
The first one is a cured rubbery material; the latter is a steel ring, placed on the inner circumference (21)
or on a series of steel wires placed in the rubber matrix.
Finally, Figure 5d shows schematically the Barless Liner inside the container. The same is
constituted of low-density polyethylene with a thickness of about 0.14 mm. It is also possible to insert
a raffia cloth, to be interposed between the liner and the structure so far described, to ensure a clear
separation between the bulk material and the cargo-supporting structure (Altobelli 2015).
Figure 5. Eceplast’s Barless Liner scheme. Source: (Altobelli 2015).
To have a preliminary idea of the main differences between Eceplast’s patent proposal and
a standard liner system, Tables 1 and 2 have been elaborated. Table 1 indicates the reduction in the
materials used, whereas Table 2 shows the optimization of the loads using a plurality of bags (pieces).
Table 1. Liner 20 ft Standard and Barless: comparison of material amount in kg.
Kind of Material Liner 20 ft Standard Liner 20 ft Barless
Extruded film in low-density polyethylene 12 12
Raffia of polypropylene 2 3
Steel 50 1.5
Rope of polyester - 0.8
Total 74.0 17.3
Source: (Di Cori 2017).
Table 2. Liner 20 ft Standard and Liner 20 ft Barless: comparison of loading number for plurality of
bags (pieces).
Units Liner 20 ft Standard Liner 20 ft Barless
500 (on-going project for optimization,
Pieces for cargo pieces 300
for 1000 pieces)
Weight for cargo kg 19,500 8650 (after optimization project, 17,300 kg)
Source: (Di Cori 2017).Adm. Sci. 2019, 9, 91 13 of 16
From a preliminary assessment, the significant reduction in the use of steel, replaced by the
introduction of a small amount of polyester, is evident. This innovation increases the container capacity
and reduces its weight and, thus, it can contribute to the reduction in environmental impact in terms of
fossil fuel use and resulting greenhouse gas emissions. This is due to the saving of energy required for
transport (with lighter vehicles the energy consumption will be less) and the reduced steel production.
In addition, the possibility of using a Barless Liner several times helps to reduce waste production,
according to the “circular economy” concept (Foschi and Bonoli 2019), and could be considered a tool to
mitigate climate change in seaport container activities (Mamatok et al. 2019). Therefore, this packaging
system combines sustainable technology and product innovation to improve maritime trade from
and to the EU, in addition to ensuring cost reductions and meeting food safety standards certified by
ISO 22000.
6. Conclusions
In recent years, there has been a growing demand for bulk-packaging systems for container
shipping, above all in Europe. This is critical especially for the international movement of sugar that,
after the abolition of EU sugar quotas on 1 October 2017, introduced in 2006 by the PAC to restructure
and defend the industry, will certainly increase. Consequently, it is important to offer efficient services
and products to companies operating in this sector to reduce the economic and environmental impacts
linked to this activity.
In this field, some innovations have been adopted during the last decades. One of the most
interesting is the 20 ft Barless Liner, developed by Eceplast S.r.l., an Italian company that could certainly
represent a virtuous example, both for its specific technological innovation and for its sustainable
business strategy.
Indeed, innovative products certified for the quality management of production processes,
environmental sustainability and food safety allow the company to be recognized as a leader in
container liners at the European level. The new patent application “Supporting structure for a container
cargo”, registered in the United States in 2016 and still pending in the European Union, will surely
strengthen its position in the market. The core innovation is the optimization of the assembly phase
of the supporting structure. The tension of the entire structure is, in fact, adjustable, acting on any
belt. This means that the structure can be tensioned by a single cargo point, which can balance the
entire structure uniformly, thanks to the inner structure of the ring. The 20 ft Barless Liner presents
certainly economic benefit: for Eceplast, because its production cost is 5% lower than standard liners,
because of the abolition of steel bars (Altobelli 2019) and, for buyers (both commodity producers and
logistic companies), because the management costs could be reduced by 65%, because of the disposal
cost of steel bars, the increment of space for loading a higher number of bags, and the improvement
of the transport efficiency. Certainly, all these elements contribute to more general environmental
benefits too: a minor amount of material used; reduction of waste disposal; and fossil fuel saving in
international shipping. In this sense, this paper is limited to a preliminary study, while the authors
aim at developing a Life Cycle Assessment (LCA) study, comparing the environmental impacts of
production and use of Liner 20 ft Barless, with those of a standard liner. This allows analysis of all the
real benefits deriving from this new technological innovation, stressing the opportunities for the whole
market, and the actors involved in the supply chain.
Finally, the research findings of the current study should be useful for managerial implications
for other practitioners. Firstly, it is important to take into account the environmental sustainability
approach in the own business strategy, above all in this period of time, where concerns about climate
change are at the core of world economic development policy. This approach could reinforce their
position on the market, raising their competitiveness. Secondly, it should be profitable to focus on
business, concerning the implementation in the maritime transport of optimal logistic systems, in order
to deal with sustainability issues. As widely discussed, this will be one of the sectors of the growing
GHG emissions, considering the increase in world population and, consequently, of international tradeAdm. Sci. 2019, 9, 91 14 of 16
by shipping. Therefore, the need to reduce its environmental impact could be one of the main topics of
the further international agreements of worldwide governments.
Author Contributions: M.L., conceptualization, writing—review and editing; G.M. writing—original draft
preparation; C.T., supervision.
Funding: This research did not receive any specific grant from funding agencies in the public, commercial,
or not-for-profit sectors.
Acknowledgments: We would like to thank Nicola Altobelli (commercial director of Eceplast S.r.l) for comments
that greatly improved the manuscript and for providing insight and expertise.
Conflicts of Interest: The authors declare no conflict of interest.
References
Agostini, Massimo. 2019. Lo Zucchero Italiano sta Sparendo: Ecco Perché. First & Food Web Magazine. March 12.
Available online: https://food.firstonline.info/lo-zucchero-italiano-sta-sparendo-ecco-perche/ (accessed on
2 October 2019).
Altobelli, Giuseppe. Inventors. 2015. Supporting Structure for a Container Cargo. Patent WO/2015/15112, October
8. Available online: https://patentscope.wipo.int/search/en/detail.jsf?docId=WO2015151124 (accessed on
3 September 2019).
Altobelli, Nicola. 2019. Commercial Director, Eceplast srl., Troia FG, Italy. Personal communication.
Bezuidenhout, Carel, and Baier Trevor. 2009. A global review and synthesis of literature pertaining to integrated
sugarcane production systems. Proceedings of the Annual Congress-South African Sugar Technologists’ Association
82: 93–101.
BMT Survey. 2017. CargoHandBook.com, The World’s Largest Cargo Transport Guidelines Website, Sugar
(Raw and Refined). Available online: http://www.cargohandbook.com/index.php/Sugar (accessed on
4 March 2019).
Brody, Aaron Leo. 2006. Packaging, Food. In Kirk-Othmer Encyclopedia of Chemical Technology, 5th ed. Hoboken:
John Wiley & Sons Inc., vol. 18, pp. 30–54.
Bulk Flow. 2017. Barless Liners. Available online: http://bulk-flow.com/bulkflow-product/barless-liners/ (accessed
on 20 July 2019).
CEFS (Comite Europeen Des Fabricants Du Sucre). 2018. CEFS Sugar Statistics. Available online: http:
//www.comitesucre.org/site/statistics/ (accessed on 7 July 2019).
CIBE—International Confederation of European Beet Growers. 2019a. CIBE-CEFS Open Letter to the EU
Commission and the Agri Council. Press Release. May 14. Available online: https://www.cibe-europe.eu/
CIBENews?newsRecordID=83 (accessed on 20 September 2019).
CIBE—International Confederation of European Beet Growers. 2019b. Last Meeting of the High-Level Group on
Sugar. Press Release. June 14. Available online: https://www.cibe-europe.eu/CIBENews?newsRecordID=86
(accessed on 20 September 2019).
Clarksons. 2019. The Commodity Demand for the Period of 2010–2018 and Expectations for the Current Year and
2020. Available online: https://www.clarksons.com/ (accessed on 22 November 2019).
COPROB—Cooperativa Produttori Bieticoli. 2019. Azienda. Available online: http://www.coprob.com/azienda/
(accessed on 30 July 2019).
De Molli, V. 2017. La realtà della filiera agroalimentare italiana e la sua importanza per il Paese. In Presentazione al
Workshop “Fatti e Persone Dietro la Filiera Dello Zucchero”. Bologna: COPROB, Italia Zuccheri, The European
House—Ambrosetti, Royal Hotel Carton, Bologna. Available online: http://www.coprob.com/wp-content/
uploads/2017/01/La-realt%C3%A0-della-filiera-agroalimentare-italiana-Valerio-De-Molli.pdf (accessed on
15 June 2019).
Di Cori, S. 2017. Investiment and Regulations, Eceplast srl., Troia FG, Italy. Personal communication.
Eceplast. 2019. Liner Bags for Containers. Available online: http://www.eceplast.com/category/liner-for-container/
(accessed on 15 July 2019).
Europages. 2017. Container Liners. Available online: http://www.europages.co.uk/companies/container%20liners.
html (accessed on 2 July 2019).Adm. Sci. 2019, 9, 91 15 of 16
European Commission. 2006. Council Regulation (EC) No 318/2006 of 20 February 2006 on the Common
Organization of the Markets in the Sugar Sector. Official Journal of the European Union, L 58/1-31, 28.2.2006.
Available online: https://eur-lex.europa.eu/legal-content/EN/TXT/?uri=CELEX:32006R0318 (accessed on
2 August 2019).
European Commission. 2011. White Paper: Roadmap to a Single European Transport Area—Towards a Competitive and
Resource Efficient Transport System. Luxembourg: European Commission.
European Commission. 2013. Regulation (EU) No 1308/2013 of the European Parliament and of the Council
of 17 December 2013 Establishing a Common Organization of the Markets in Agricultural Products and
Repealing Council Regulations (EEC) No 922/72, (EEC) No 234/79, (EC) No 1037/2001 and (EC) No 1234/2007.
Official Journal of the European Union, L 347/671-853, 20.12.2013. Available online: https://eur-lex.europa.
eu/LexUriServ/LexUriServ.do?uri=OJ:L:2013:347:0671:0854:EN:PDF (accessed on 2 August 2019).
European Commission. 2017. Commission Implementing Regulation (EU) 2017/1185 of 20 April 2017 Laying
Down Rules for the Application of Regulations (EU) No 1307/2013 and (EU) No 1308/2013 of the European
Parliament and of the Council as Regards Notifications to the Commission of Information and Documents
and Amending and Repealing Several, Official Journal of the European Union, L 171/113-130, 4.7.2017.
Available online: https://eur-lex.europa.eu/legal-content/EN/TXT/PDF/?uri=CELEX:32017R1185&from=EN
(accessed on 29 July 2019).
European Commission—Committee for the Common Organization of Agricultural Markets. 2019. Sugar Trade
Statistics. September 26. Available online: https://ec.europa.eu/agriculture/sites/agriculture/files/market-
observatory/sugar/doc/market-situation_en.pdf (accessed on 2 October 2019).
Foschi, Eleonora, and Alessandra Bonoli. 2019. The commitment of packaging industry in the framework of the
European strategy for plastics in a circular economy. Administrative Science 9: 18. [CrossRef]
Gallerani, Claudio. 2018. L’esperienza di COPROB, Audizione in Senato Roma. September 6. Available online:
https://www.senato.it/application/xmanager/projects/leg18/attachments/documento_evento_procedura_
commissione/files/000/000/356/Audizione_Senato_Presentazione_COPROB_6_09_2018.pdf (accessed on
29 July 2019).
Gritsenko, Daria. 2017. Regulating GHG Emissions from shipping: Local, global, or polycentric approach? Marine
Policy 84: 130–33. [CrossRef]
Halim, Ronald, Lucie Kirstein, Olaf Merk, and Luis Martinez. 2018. Decarbonization Pathways for International
Maritime Transport: A Model-Based Policy Impact Assessment. Sustainability 10: 2243. [CrossRef]
Hansen, Anlaug Ådland, Erik Svanes, Ole Jørgen Hanssen, Mie Void, and Bjorn Tore Rotabakk. 2012. Advances in
bulk packaging for the transport of fresh fish. In Advances in Meta, Poultry and Seafood Packaging. Sawston:
Woodhead Publishing, pp. 248–60. [CrossRef]
Higgins, Andrew, Peter Thorburn, Ainsley Archer, and Emma Jakku. 2007. Opportunities for value chain research
in sugar industries. Agricultural Systems 94: 611–21. [CrossRef]
International Sugar Organization (ISO). 2019. Sugar Year Book 2019; London: International Sugar Organization.
ISO 22000:2005. 2017. Food Safety Management Systems—Requirements for Any Organization in the Food Chain,
ISO/TC 34/SC 17. Available online: https://www.iso.org/standard/35466.html (accessed on 18 September 2019).
ISTAT. 2019. Coltivazioni: Cereali, Legumi, Radici Bulbi e Tuberi. Available online: http://dati.istat.it/ (accessed on
18 June 2019).
Johnson, Hannes, and Linda Styhre. 2015. Increased energy efficiency in short sea shipping through decreased
time in port. Transportation Research Part A 71: 167–78. [CrossRef]
Knoema. 2019a. World Data Atlas: Sugar Cane—Area Harvested (1961–2017). Available online: https:
//knoema.com/atlas/topics/Agriculture/Crops-Production-Area-Harvested/ (accessed on 5 July 2019).
Knoema. 2019b. World Data Atlas: Sugar Beet—Area Harvested (1961–2017). Available online: https://knoema.
com/atlas/topics/Agriculture/Crops-Production-Area-Harvested/ (accessed on 5 July 2019).
Lang, Tim, Victoria Schoen, Kawther Hashem, Lucy McDonald, Jennifer Parker, and Anna Savelyeva. 2017.
The environmental, social and market sustainability of sugar. In Advances in Food Security and Sustainability.
Amsterdam: Elsevier, pp. 115–36, chp. 5.
Linder, Alison. 2018. Explaining shipping company participation in voluntary vessel emission reduction programs.
Transportation Research Part D 61: 234–45. [CrossRef]
Mamatok, Yuliya, Yingyi Huang, Chun Jin, and Xingqun Cheng. 2019. A System Dynamics Model for CO2
Mitigation Strategies at a Container Seaport. Sustainability 11: 2806. [CrossRef]You can also read