City of Hamilton Residential Intensification Market Demand Analysis March 2021
←
→
Page content transcription
If your browser does not render page correctly, please read the page content below

Appendix B to Report PED17010(i)
                                                                                         Page 1 of 63
City of Hamilton Residential Intensification
Market Demand Analysis
March 2021
 Results Subject to Revision as New Information Becomes Available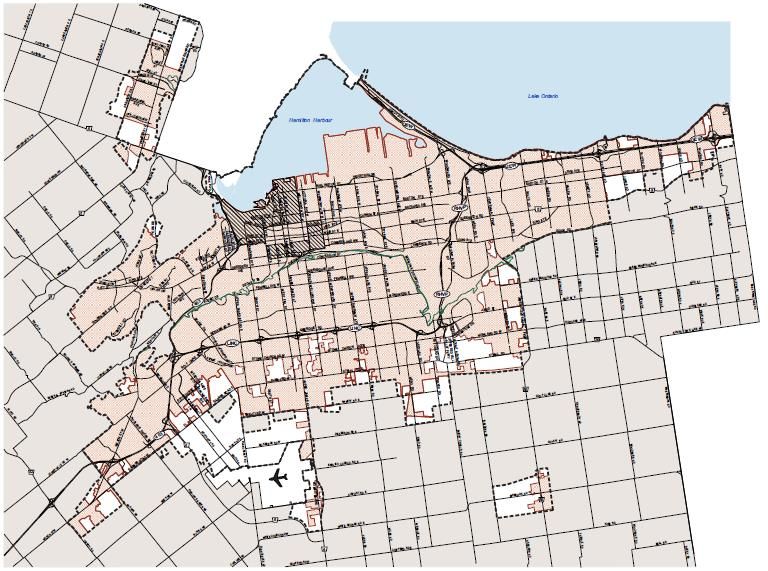
Contents

         Sections                                                  Page

         Section 1: Introduction and Background                     2

         Section 2: Major Trends and Drivers of Intensification     9

         Section 3: The City of Hamilton in Context                 23

                                                                          Appendix B to Report PED17010(i)
         Section 4: Forecast Demand for Intensification             34

         Section 5: Conclusions and Recommendations                 52

                                                                                               Page 2 of 63
Results Subject to Revision as New Information Becomes Available             1
Section 1: Introduction and Background
    The City of Hamilton has retained Lorius and Associates, in association with Hemson
    Consulting Ltd., to undertake an analysis of long-term demand for residential
    intensification. The market demand analysis is required to support the City’s
    assessment of intensification potential, the update of the Growth Related Integrated
    Development Strategy (the GRIDS 2 update) and the Municipal Comprehensive
    Review (MCR) for the period to 2051.

    1.1 Purpose of the Assignment
    The purpose of the assignment is to prepare a forecast of demand for residential
    intensification and provide commentary on an appropriate intensification target for
    the City. The results will be used for the GRIDS 2 update and as input to the Land
    Needs Assessment (LNA) required for the MCR as well as the outstanding appeals of
    the Urban Hamilton Official Plan (UHOP). The forecast of future demand will also be
    taken into consideration by staff and Council in their determination of whether an
    alternative target should be sought in accordance with the Growth Plan for the

                                                                                               Appendix B to Report PED17010(i)
    Greater Golden Horseshoe: A Place to Grow (Growth Plan, 2020).

    1.2 Planning for Intensification
    Encouraging residential intensification is a key City and Provincial planning objective.
    The Growth Plan states that by the time the next MCR is approved and in effect, and
    for each year after, a minimum of 50% of all residential development occurring
    annually over the period to 2051 will be within the delineated built-up area.

                                                                                                                    Page 3 of 63
    For Hamilton, this rate of intensification equates to nearly 1,800 units annually,
    which is more than double the historic level of such development that has occurred
    over the past decade. The Growth Plan rule provides direction on the proportion of
    new residential development that is to occur through intensification within a specified
    geographic area and refers to a total number of new units added, but not number of
    people, overall density, specific unit types or units gained or lost through changes in
    occupancy of the existing stock.

Results Subject to Revision as New Information Becomes Available                                  2
Section 1: Introduction and Background                                                            City of Hamilton
    For Hamilton, the intensification target is higher than currently set in the UHOP                Estimated Rate of
    (40% of new residential units). The target also exceeds the historic rate of                       Intensification
    intensification in the City, which averaged around 33% between 2008 and 2016,
    as shown at right. In the 2016-2019 period the rate of intensification increased -               Year            Rate
    to 38% although the market was paused somewhat as a result of the COVID-19
    Pandemic lockdowns in early 2020.                                                                     2008       38%
                                                                                                          2009       35%
    The primary purpose of the Growth Plan intensification target is to reduce the
                                                                                                          2010       28%
    amount of lands developed in greenfield locations. However, intensification is also
    embedded in many other important City planning objectives including:                                  2011       34%
    • Supporting increased levels of transit ridership, in particular the GO Stations                     2012       25%
      and BLAST network;
    • The development of complete communities that provide a full range of housing                        2013       32%
      types as well as employment opportunities, local retail stores, public service                      2014       36%
      facilities and transportation options; and

                                                                                                                               Appendix B to Report PED17010(i)
                                                                                                          2015       42%
    • Delivering higher levels of urban amenity and more active and animated
      streetscapes to the marketplace, especially in the downtown and other nodes                         2016       28%
      and corridors identified in the UHOP. Moreover, in older areas where population
      may be declining intensification can deliver the new units required to maintain                     2017       26%
      local service levels for schools, retail and health care.                                           2018       50%
                                                                                                        2019        46%
    From an urban land needs perspective, the Provincial intensification requirement
    means that it is necessary to plan for a long-term shift in housing demand towards          2008-2011           33%

                                                                                                                                                    Page 4 of 63
    higher density residential units. This shift in demand, in turn, has the effect of
                                                                                                2011-2016           33%
    reducing the balance of units to be allocated to the City’s designated greenfield
    areas. As a result, the mandated intensification target has City-wide growth                2016-2019           38%
    planning implications, in particular for the amount of additional land outside the
                                                                                                2008-2019           35%
    existing urban area that may be required by 2051 and for the different types of
    units available to satisfy future demand.                                          Source: City of Hamilton (housing starts)

Results Subject to Revision as New Information Becomes Available                                                                   3
Section 1: Introduction and Background
     1.3 Defining Intensification                                                               Key Concepts
     Residential intensification occurs across a range of built forms and within
     both urban and suburban settings:
                                                                                                Housing Unit Types
     • From a built form perspective, the majority of residential intensification           Apartments include both rental
                                                                                           and ownership (“condo”) forms.
       occurs in higher-density rowhouse and apartment units. Occasionally some
                                                                                            Row houses include traditional
       intensification occurs through single and semi-detached units on remnant            townhouses and multiple street/
       greenfield sites or through smaller-scale infill.                                  block towns joined side-to-side or
     • In terms of location, intensification tends to be focussed within the built-up        back-to-back, with no other
                                                                                              dwellings above or below.
       urban area, including in downtowns and waterfronts, along main streets
       and around transit nodes, at the edges of older industrial or commercial
       areas (referred to as “Brownfields” or “Greyfields”) and within older                     The Built-up Area
       existing residential communities.                                                  The “built-up area” is defined and
     • Suburbs can also be ‘retrofitted’ to increase density, for example through           mapped as the area that was
       the development of underutilized or ‘leftover’ large lots for new single              already built when the 2006
                                                                                          Growth Plan first took effect. It is
       detached units or row housing. There is also an emerging trend towards
                                                                                            illustrated on the map on the

                                                                                                                             Appendix B to Report PED17010(i)
       the redevelopment of existing large format (“Big Box”) retail centres for a                  following page.
       mix of uses including significant high-density residential.
                                                                                           In the City of Hamilton, the built-
                                                                                              up area included a number of
     In this sense, intensification can occur in traditional ‘greenfield’ locations for      larger vacant, underutilized or
     both ground-related housing as well as the high-density, mixed-use forms             remnant ‘greenfield’ sites that have
                                                                                            since developed with a range of
     typically envisioned for the Urban Growth Centres (UGC) or other parts of the
                                                                                                   housing unit types.
     older urban fabric such as the City’s nodes and corridors. So, while the term
     “intensification” and “Growth Plan target” tend to be used interchangeably,            The remaining supply of these
                                                                                          parcels is limited and distinct from

                                                                                                                                                  Page 5 of 63
     they are not exactly the same. The Growth Plan target applies to the total
                                                                                          what the City refers to as the “built
     new units within the built-up area. Intensification is defined as a net increase      boundary holes”: areas that are
     in the number of dwelling units whether it is infill or redevelopment units.         physically within the City’s built-up
     The vast majority of units added inside the built-up area will be “true”                area but identified under the
     intensification from a built-form perspective (i.e. row house and apartment              Growth Plan as part of the
     units) but some intensification will also occur outside the built-up area on         Designated Greenfield Area (DGA).
     designated greenfield lands.

Results Subject to Revision as New Information Becomes Available                                                                 4
Section 1: Introduction and Background
      1.3 Defining Intensification – The Built-Up Area

                                                                         Appendix B to Report PED17010(i)
                                                                                              Page 6 of 63
      Source: Urban Hamilton Official Plan Appendix G - Boundaries Map

Results Subject to Revision as New Information Becomes Available            5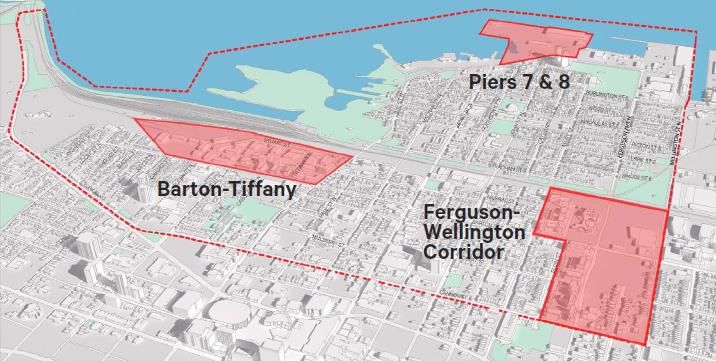
Section 1: Introduction and Background
    1.4 The COVID-19 Pandemic
    This report was prepared during the COVID-19 Pandemic, which is having
    severe and far-reaching global economic impacts. All economic sectors have
    been affected, some more so than others, and the full extent of the pandemic’s
    social and economic impact is yet to be seen.

    In discussing potential impacts, it should be noted that there is no experience
    with an economic recession of this origin, magnitude or speed of contraction
    anywhere in the world in recent times, making the nature of the recovery
    speculative no matter the source. Significant events of this type – major wars
    or epidemics (without lockdowns) – have typically heralded periods of major
    social and economic change in all parts of society.

    There is uncertainty over how quickly the economy will return to pre-pandemic
    conditions. Many of the economic factors driving intensification have also been

                                                                                      Appendix B to Report PED17010(i)
    negatively affected, above all being the available income to purchase housing
    in a period of high unemployment, reduced incomes and steadily declining
    savings for many households. The short-term attractiveness of urban locations
    throughout the Greater Toronto and Hamilton Areas (GTHA) may be further
    compromised by the appearance of blight created by the many street front
    businesses that remain closed and uncertainty if they will reopen as before.

    Nevertheless, the long-term economic outlook for the GGH and the City of

                                                                                                           Page 7 of 63
    Hamilton remains positive, albeit with a significant unanticipated pause in the
    current period. According to the updated Growth Plan forecasts prepared by
    Hemson Consulting Ltd., the GGH economy is evolving into a global economic
    powerhouse. It will remain very attractive to newcomers, mainly international
    migrants that are the primary source of population growth in the GTHA. Over
    the long-term, continued population growth will drive strong demand for all
    types of housing, including residential intensification.

Results Subject to Revision as New Information Becomes Available                         6
Section 1: Introduction and Background
    1.5 Context and Approach to the Analysis
    Notwithstanding the economic pause arising from the COVID-19 Pandemic, the
    last five years have shown a significant acceleration of market interest in the City
    of Hamilton. Strong residential and non-residential building activity, rising real
    estate values and several high-profile projects in both the downtown and on the
    waterfront are among the major indicators of this shift. The City’s burgeoning
    arts, culture and Creative Industries (especially film) also speaks to an emergent
    dynamic of renewal from an urban lifestyle perspective and bodes well for the
    long-term demand for residential intensification.

    The forecast of demand for intensification is prepared within the context of the
    long-term regional growth outlook and the City’s well-documented resurgence as
    a significant economic and cultural centre within the Greater Golden Horseshoe
    (GGH). Broad economic, demographic and other market demand-side factors are
    taken into account and supplemented by feedback from industry stakeholders,

                                                                                           Appendix B to Report PED17010(i)
    the City of Hamilton staff and members of Council.

    For the purposes of this assignment, intensification is considered to be all new
    units within the built-up area and will be mostly apartment and rowhouse units,
    with only limited infill of lower density ground-related housing forms. The main
    source of this latter type of development is likely to be remnant greenfield sites
    or other small-scale infill opportunities.

                                                                                                                Page 8 of 63
    Since the specific amount, timing and location of intensification activity can be
    difficult to predict, the approach is to model a range of market demand outlooks.
    The result is a “Current Trends”, “High” and “Low” forecast of market demand
    and commentary on the areas within the City where intensification is expected to
    occur. It is important to note that the approach is to provide a long-term demand
    outlook for land use planning purposes. The report is not intended to address
    short-term demand for specific unit types, pricing or sales nor provide a site-by-
    site analysis of market redevelopment potential.
Results Subject to Revision as New Information Becomes Available                              7
Section 1: Introduction and Background
     The report that follows provides the results of our review and analysis including
                                                                                          Introduction and
     the anticipated amount, timing and general location of development within the
                                                                                            Background
     City of Hamilton. It is structured into five main sections:

     • Section 1 sets out the purpose of the assignment, key planning considerations,
       definitions and the context and approach to the analysis;
                                                                                          Major Trends and
     • Section 2 describes the major trends and factors driving the demand for
                                                                                           Factors Driving
       intensification, including economic factors, age structure, land supply, housing
                                                                                           Intensification
       cost and affordability and lifestyle preferences;
     • Section 3 provides an overview of the City of Hamilton within this context,
       including the expanding role of the City in the broader metropolitan economy,
       the role of greenfields and intensification in accommodating growth and local
                                                                                             The City of
       real estate and housing market factors;
                                                                                             Hamilton in
     • Section 4 describes the forecast demand for intensification, including the             Context

                                                                                                             Appendix B to Report PED17010(i)
       overall growth outlook for the GGH and City of Hamilton. A range of demand
       outlooks are described, including a Current Trends, High and Low forecast
       reflecting changes in Hamilton’s relative attraction for intensification from a
       broader market perspective; and
     • Section 5 provides our conclusions and recommendations including the broad
                                                                                            The Demand
       areas of the City where future demand can be expected to occur and an                  Forecast
       appropriate intensification target over the period to 2051. Commentary is also
       provided on the implications of higher targets for the current LNA, GRIDS 2
       update and MCR process.

                                                                                                                                  Page 9 of 63
                                                                                           Conclusions and
                                                                                          Recommendations

Results Subject to Revision as New Information Becomes Available                                                8
Section 2: Major Trends and Drivers of Intensification
      The major trends and drivers of demand for residential intensification include: economic factors that drive
      housing demand overall; age structure (demographic and lifecycle factors) that largely dictates housing
      choice by unit type; and housing supply, which determines options available to consumers and, in turn,
      housing cost and affordability. Finally, changing lifestyle preferences has increased demand for denser, well-
      serviced urban areas with a concentration of amenities and transit access, which influences the location and
      type of intensification that occurs throughout the metropolitan region.

                                                      Continued economic expansion, job growth and real estate investment has driven
                Economic
         1                                            strong population growth and demand for housing units overall in the Greater
                Factors                               Toronto and Hamilton Area (GTHA).

                                                      Housing choice is closely tied to age structure. Recent growth has included a high
                                                      share of younger adults (15-29 years old) that typically occupy apartment units.
         2      Age Structure
                                                      There is also a large number of existing older adults (30 -75 years) that typically
                                                      occupy larger, family-sized units.

                                                                                                                                               Appendix B to Report PED17010(i)
                                                      Housing supply determines the options available to satisfy consumer demand.
         3       Housing Supply                       Since 2006, a number of factors have limited the options available to satisfy all
                                                      segments of the housing market, especially larger family-sized units.

                                                      Strong demand in relation to supply has contributed to increased housing costs
                Housing Cost and
         4                                            and affordability strains which, in part, have led to a shift to smaller housing units
                Affordability                         and more people living in denser, more affordable housing forms.

                                                                                                                                                                  Page 10 of 63
                                                      A growing preference for cosmopolitan lifestyles and quality of life considerations
                                                      has increased demand for well-serviced urban areas and interest in amenity-rich
         5
                Lifestyle                             work environments as a tool to attract skilled labor. These trends have played a
                Preferences                           major role in the significant concentration of development in downtown Toronto
                                                      and emergence of large scale intensification in the City of Mississauga, southern
                                                      York Region, and, more recently, in the City of Hamilton.

Results Subject to Revision as New Information Becomes Available                                                                                  9
Section 2: Major Trends and Drivers of Intensification
2.1 Economic Factors Driving Overall Housing Demand
Figure 1: Historic Employment in Toronto and
The Toronto region economy continues to grow, especially in Hamilton-Niagara Economic Regions (ER)
technology and other knowledge-based industries. This strong
economic performance fosters continued in-migration, which drives
growth in population and overall housing demand.
Economic Region Continues to Perform Well
As shown in Figure 1, the Toronto Economic Region has grown COVID-19 Pandemic
steadily over time, to a total of over 3.6 million jobs in 2019. The
Hamilton-Niagara Economic Region has also increased from just
under 640,000 jobs in 2001 to over 765,000 jobs in 2019. After
2019, employment declined due to the abrupt changes brought
about by COVID-19 Pandemic. As shown in Figure 2, most of the
historic growth within the GTHA has been in the regions of York
and Peel and the City of Toronto. The City of Hamilton has played
Figure 2: Distribution of Employment Growth
Appendix B to Report PED17010(i)
a somewhat more limited role to date.
in the GTHA (Census 2001 – 2016)
Long Term Growth Outlook Remains Positive
There is no question that the COVID-19 Pandemic is likely to have
significant long-term economic consequences. Some of the sectors
that face the steepest path to recovery include travel and tourism,
conventions, retail restaurants and print media.
Page 11 of 63
Notwithstanding these impacts, however, the long-term growth
outlook remains positive. In general, both the GTHA and Outer
Ring are anticipated to experience rates of long-term economic
growth sufficient to absorb the expanding labour force created
through migration. This expectation is consistent with the Ministry
of Finance’s Ontario’s Long Term Report on the Economy (2017) Source: Figures 1 and 2 Hemson Consulting Ltd. based
on Statistics Canada Information by municipality and
which remains a sound economic outlook. defined Economic Region
Results Subject to Revision as New Information Becomes Available 10Section 2: Major Trends and Drivers of Intensification
2.1 Economic Factors Driving Overall Housing Demand
Figure 3: Change in Employment by Skill
GTHA Evolving to a Modern Service-Based Economy
Level, GGH, 2001–2014
The GTHA economy continues to grow rapidly in professional
services and other knowledge-based activities that tend to cluster in
urban areas. Increased automation, Artificial Intelligence (AI) and
other advances in the digital economy have led to an increased
demand for high-skilled jobs, as illustrated by the pattern of growth
in employment by skill level shown in Figure 3.
Migration Driving Growth in Population and Housing
The scale and nature of job growth historically has made Canada
and the GTHA very attractive for migration, especially international Source: Neptis Foundation and Metropole Consultants:
immigration. Continued in-migration will drive growth in population Planning the Next GGH, November 2018
and the resident labour force and, in turn, demand for new housing.
Notwithstanding short-term COVID-19 impacts, net international Figure 4: Net International Migration to the
Appendix B to Report PED17010(i)
migration to the GTHA is forecast to increase steadily over the GTHA, 1996-2051
period to 2051, as shown in Figure 4.
Other Factors Have Also Contributed to Demand
In addition to broader demographic forces, a decade of steady
income growth and low interest rates has increased the buying
power of residents and, in turn, demand for housing and housing
Page 12 of 63
prices. The rise of housing as an investment vehicle and the sharing
economy has further boosted demand, including short term rental
platforms that are concentrated in central city areas and (until very
recently) continue to grow. Notwithstanding short-term COVID-19
impacts, the overall price and demand for housing is expected to
remain high in a North American context. Source: Hemson Consulting Ltd., 2020, Greater Golden
Horseshoe: Growth Forecasts to 2051
Results Subject to Revision as New Information Becomes Available 11Section 2: Major Trends and Drivers of Intensification
2.2 Demographic Factors Influencing Demand by Unit Type
Figure 5: Housing Occupancy Patterns by
Age structure is the main determinant of housing demand. While Age Group, City of Hamilton, 2016
there have been some recent changes in the occupancy patterns of
young adults and the elderly, the long-term market is still dominated
by larger, family-sized units for the 30-75 year age group.
Housing Choices Are Closely Tied to Lifecycle Patterns
As illustrated by Figure 5, housing demand follows an established
pattern, typically beginning with young adults in apartments. After
family formation, housing preference shifts to larger units (single and
semi detached, rowhouse). The pattern moves back to apartments
later as empty-nesters downsize and more single-person households
are formed through divorce or widowhood.
Over the last 20 years, household formation for young adults has Source: Hemson Consulting Ltd.
Appendix B to Report PED17010(i)
declined somewhat as they stay at home longer and occupy
Figure 6: Share of Current Population by
apartments for longer. As well, seniors have been staying in their Age Structure 2019
homes longer before downsizing, which reduces the supply of larger
family-sized units for other generations. Little else has changed for
the large group of residents between the age of 30 and 75 that tend
to demand larger family-sized units.
As shown in Figure 6, the largest age group in the GTHA is in peak
Page 13 of 63
years for family households and peak demand for new ground-
related housing (Figure 5) most of which is accommodated in more
traditional greenfield areas. Although an important goal, the
provision of new ‘family-friendly’ apartments (typically 3-bedroom
units) remains limited for most municipalities, including Hamilton,
where very few large new units are being built. Most new high-rise
Source: Hemson Consulting Ltd.
projects are focussed on smaller units.
Results Subject to Revision as New Information Becomes Available 12Section 2: Major Trends and Drivers of Intensification
2.2 Demographic Factors Influencing Demand by Unit Type
Long-Term Market is Dominated by Ground-Related Housing Demand
Housing demand by type continues to be driven strongly by young families
seeking ground-related housing units. Of course, some households will make
different choices reflecting their specific economic circumstances or family
structure. However, the dominant housing form choices of the broader
population are well-established.
Within this context, the shift in demand to higher density housing is of note,
especially the surge of demand for high-rise apartment development in
downtown Toronto. Recently, however, this trend has begun to moderate in
response to the COVID-19 Pandemic. The high cost of housing coupled with
a rise in remote work has led to a short-term increase in demand and prices Ground-Related Housing
for new homes in nearby markets, especially the City of Hamilton, Guelph Generally refers to housing that is
accessible from the ground. It
and Kitchener-Cambridge-Waterloo. A rebound in apartment demand can be
includes all housing that is not an
Appendix B to Report PED17010(i)
expected as the economy recovers around mid-2023. apartment unit, including larger
family-sized units
Over time, as younger adults age and start families, many will continue to
opt for increased space and amenity of larger family-sized units, including
traditional suburban ground-related housing. These residents will join the
already large mass of population entering peak family-formation. In
addition, the turnover of units to younger families is reduced as the elderly
remain in their homes longer, further driving demand for new and larger
Page 14 of 63
family-sized units to accommodate population growth.
Age structure is by far the best predictor of demand for households and
specific housing unit types. As the population continues to age, pressure for
more ground-related housing can be expected especially from ‘millennials’,
which are the largest and fastest growing demographic group in the GTHA
and just entering their family forming years.
Results Subject to Revision as New Information Becomes Available 13Section 2: Major Trends and Drivers of Intensification
2.2 Demographic Factors Influencing Demand by Unit Type
Density and Location of Family-sized Units is Shifting Figure 7: Inner-Ring Median Developing Lot
From a demographic perspective, demand for larger family-sized Sizes in the DGA (Square Metres)
housing has been consistent. What has shifted, however, is the lot
size, density and location of demand for those units:
• As shown in Figure 7, there has been a trend of declining lot
sizes for single-detached housing. At the same time, unit sizes
on those lots have increased as the market moved to a denser
and more affordable ground-related product. There is anecdotal
evidence that lot sizes have continued to decline since 2011.
• Within the ground-related market, row houses have also been a
growing share over time including “maisonettes”. From a pricing
perspective, other things being equal, rowhouses tend to be
more affordable as starter homes than single-detached units and
about the same cost as a much smaller apartment; and Source: Performance Indicators for the Growth Plan
Appendix B to Report PED17010(i)
• There is a continuing trend of rapid residential growth outside for the Greater Golden Horseshoe, 2006. Ministry of
Municipal Affairs and Housing, 2015
Toronto in the ‘905’ communities. In recent years, this growth
has been moving even further afield (some would say “leap-
frogging” defined as non-contiguous development beyond
“The high price tags for new and
established urban centres) to communities within the extended resale homes in Toronto [have]
commuter shed of the GGH: a trend that may be accelerated by made commuter-friendly and nearby
the COVID-19 Pandemic and worsening housing affordability. As [Census Metropolitan Areas] CMAs
shown in Figure 6 previously, the largest age group in the GTHA such as Oshawa, Hamilton, St.
Catharines-Niagara, Guelph and
Page 15 of 63
is in peak demand for new ground-related housing.
Kitchener-Cambridge-Waterloo
increasingly popular among home
What these trends suggest is that consumers continue to trade
buyers, due to their overall
travel time and financial savings for affordable ground-related,
affordability.”
family-sized units. Where this demand outstrips the available
housing supply, the market tends to respond by providing denser Source: Recent trends in new house prices in the Greater
Golden Horseshoe Region. Statistics Canada 2018
ground-related forms or moving location, rather than shifting into
high-rise apartment units.
Results Subject to Revision as New Information Becomes Available 14Section 2: Major Trends and Drivers of Intensification
2.3 Housing Supply
Since 2006, the Growth Plan has sought to shift the pattern of growth in the GGH
towards more compact urban forms through policy intervention. The policy changes
introduced by the Growth Plan, among other factors, have led to delays in bringing
new supply to market and, in turn, affected options available to satisfy demand. The
planning policy context is evolving to address this challenge, including Bill 108 and a
growing interest in “missing middle” housing forms.
Growth Plan Seeks to Contain Greenfield Development
From its inception in 2006, the Growth Plan has sought to limit the amount of new
urban lands developed for greenfield development. The primary mechanism to
achieve this objective is to shift growth from greenfield areas to higher levels of
intensification – implemented with the requirement that a specific share of growth
(a minimum of 50% of new housing units) be accommodated in the built-up area.
The intended effect is to shift the housing market overall towards medium and
Appendix B to Report PED17010(i)
higher density forms by limiting the number of ground-related units accommodated
on greenfield lands. These Growth Plan-related shifts are long-term and will affect
the market and pricing over time.
Process for Getting New Land to Market has Been Delayed
The Growth Plan also introduced new requirements for official plan reviews and
boundary expansions, which can take upwards of 10 years. The lengthy process
required to complete the necessary requirements has generally extended the
Page 16 of 63
approvals cycle for urban boundary expansion and, in turn, delayed the provision of
short-term supply for ground-related housing in greenfield areas.
As an example, most municipal conformity exercises for the 2012 Growth Plan
Schedule 3 forecasts have yet to be completed. There is also anecdotal evidence of
developers holding back serviced lot supply as part of their internal phasing plans,
further delaying the delivery of new land to market.
Results Subject to Revision as New Information Becomes Available 15Section 2: Major Trends and Drivers of Intensification `
2.3 Housing Supply
Planning Policy Context is Evolving
At current housing prices, many households in the GTHA simply cannot afford
to participate in the ownership market, especially millennials. Housing
affordability is also a key factor driving out-migration from the GTHA to the
outer ring: a trend that may be accelerated by the COVID-19 Pandemic. To
the extent that housing supply has some bearing on price and affordability,
planning policy is evolving to address this challenge:
• The More Homes More Choice Act (“Bill 108”) and related initiatives were
put in place in June, 2019 in order to, among other matters, streamline the
approvals process and boost housing supply;
• In August 2020 the Province released a new land needs assessment (LNA)
methodology as part of Amendment 1 to the Growth Plan (2019). The new “Large [single-family] homes
Appendix B to Report PED17010(i)
LNA method adopts a much more ‘market-based’ approach, directing and tiny condos only work for
municipalities to ensure that sufficient land is available to accommodate all some people. We need a mix
segments of the housing market and avoid shortages that would drive up of housing types – such as
land cost; and multiplexes, low- and midrise
apartments – and sizes, like
• There is a growing interest in the “Missing Middle” housing market to condos that are large enough
address the affordability challenge including larger, family-sized units. The for families.”
Page 17 of 63
Missing Middle refers to the range of housing types between traditional
Source: More Homes, More Choice. Ontario’s
single-detached houses and high-rise apartments that have gone ‘missing’ Housing Supply Action Plan, May 2019
from many large cities, including the GTHA. These include ‘family-friendly’
units in low and mid-rise apartment forms, laneway housing, garden and
courtyard apartments, multiplex structures, live/work units and residential
units above commercial businesses.
Results Subject to Revision as New Information Becomes Available 16Section 2: Major Trends and Drivers of Intensification
2.4 Housing Cost and Affordability
Strong demand in relation to supply has driven the cost of housing Figure 8: Historic Residential Average Price
to record levels and affordability remains a serious challenge for Greater Toronto Area
most potential buyers. Over the last 15 years, this affordability
challenge has encouraged a broad shift towards medium and
higher density housing forms throughout the GTHA.
GTA Housing Prices Have Reached Record Levels
The average cost of housing in the GTA has increased to record
levels. As shown in Figure 8, prices peaked in 2017 and then
corrected, partly due to measures put in place to cool the market
through the Fair Housing Plan and tightened mortgage regulations
(the ‘stress test’) which led to reduced purchasing power for most
potential borrowers. A similar pattern has occurred in Hamilton,
with average home prices now also at historic highs.
Figure 9: City of Hamilton Mortgage Payments
Appendix B to Report PED17010(i)
as a Share (%) of Median Family Income
Affordability has Become a Serious Challenge
As shown in Figure 9, beginning around 2014 the proportion of
family income required to service the cost of a mortgage has risen
sharply, now standing at over 40% in 2020. Housing affordability
issues are now actually dampening housing unit growth because
many people simply cannot afford to buy a home in the GTHA and
are being pushed further into the Outer Ring and beyond.
Page 18 of 63
The recent surge in demand for detached homes driven by demand
for larger living spaces and reduced attachment to live in or near
core urban areas has led to further price increases. As such, the
current housing cost and affordability challenge is not expected to
Source: RBC Economics Focus on Canadian Housing:
resolve any time soon. There are simply fewer and fewer people Housing Trends and Affordability December 2020
that can purchase an average home at current prices, noting the
high proportion of income spent for those that did.
Results Subject to Revision as New Information Becomes Available 17Section 2: Major Trends and Drivers of Intensification
2.4 Housing Cost and Affordability
Figure 10: Change in Housing Price Index
Single Detached Homes Have Shown Significant Price Increase
Greater Toronto Area 2006 - 2020
Notwithstanding the source of supply constraints, the effects can
be seen in the widening divergence in price increases between
ground-related and apartment units since 2012, as shown at right
in Figure 10. Although the monthly cost of ownership and rental
housing may be comparable, affording the necessary down
payment remains a major barrier to market entry.
Prices moderated after the 2017 housing correction, and appear to
have been affecting units by type more equally since. Apartments
have also become relatively less expensive during the COVID-19
Pandemic, in part due to the short-term increase in the supply of
vacant units previously used for Airbnb purposes or occupied by
Source: Canadian Real Estate Association 2020
residents that have since vacated for financial reasons.
Appendix B to Report PED17010(i)
Figure 11: Share of Housing Completions by
Market has Shifted to Smaller and More Affordable Options Census Period Within Greater Golden Horseshoe
The combination of market, pricing and policy-based factors has
led to more people living in denser and more affordable housing.
As illustrated by Figure 11, in the 2011 to 2016 period, 52% of
new housing construction in the GTHA were apartments versus
29% of the market during the previous 25 years.
Page 19 of 63
The shift to more affordable options led to a boom in high-rise
apartment buildings, historically focussed in Toronto. However,
intensification is also occurring in southern Peel and York Regions
and, increasingly, Hamilton. Notwithstanding short-term COVID-19
impacts, these trends appear to indicate a lasting shift to medium Source: Hemson Consulting Ltd. Based on Statistics
Canada
and higher density forms in the market, which bodes well for the
future of intensification.
Results Subject to Revision as New Information Becomes Available 18Section 2: Major Trends and Drivers of Intensification
2.5 Lifestyle Preferences
Emerging trends in lifestyle and locational preferences have driven changes in
the distribution of growth within the GTHA, especially evident with the focus of
high-rise residential and office development in downtown Toronto. Large-scale
intensification, however, is also emerging in other GTHA municipalities, such as
southern York and Halton regions and the City of Hamilton.
Demand for Transit-Oriented Urban Lifestyles is Growing
Recent population growth has included many young adults (the “millennials”) “Providing excellent transit
which has driven key changes in lifestyle and consumer preferences: service offers employers access to
the widest possible pool of
• From a locational perspective, there has been a growing interest in more
workers – a critical competitive
cosmopolitan lifestyles and walkable communities with high levels of urban
asset. Attracting employees also
amenities and transit access; means creating a high-quality
• The aging of the population is also supporting this trend, with the elderly urban environment – one that
increasingly preferring denser urban environments with high levels of integrates transit, provides a
walkable and cyclable public
Appendix B to Report PED17010(i)
amenity and good transit access; and
• The changing nature of work also plays a part, including growth in emerging realm, and offers worker
clusters or “archetypes”, as developed in recent work prepared by the Neptis amenities and services, such as
Foundation, and the associated “war for talent”. As a result, amenity-rich,
restaurants, cafes, shops,
daycares, or recreational
accessible work environments have become increasingly important to the
facilities.”
location decisions of major employers, especially knowledge-based firms
seeking to attract young talent and skilled workers. Source: Neptis Foundation and Metropole
Consultants: Planning the Next GGH,
Page 20 of 63
November 2018
Notwithstanding short-term COVID-19 impacts, these trends are expected to
continue over the planning horizon. At the same time, however, there remains
a large pool of demand for family-sized housing. Moreover, as many millennials
age and form households the appeal of urban amenities and access to transit
will give way to a need for more living space, driving additional demand for
ground-related housing. Others will continue to prefer urban locations. This
fragmentation of the ‘urban’ versus suburban housing market creates both
challenges and opportunities.
Results Subject to Revision as New Information Becomes Available 19Section 2: Major Trends and Drivers of Intensification
2.5 Lifestyle Preferences
High-Density Development has Concentrated in Downtown Toronto Figure 12: City of Toronto Job Increase
One of the most visible outcomes of recent trends has been the surge of by Category, 2017-2018
new development in central Toronto. Recent growth is the result of a cycle
of economic and demographic factors that are relevant for understanding
the drivers of residential intensification:
• The GTHA’s continued transition to a knowledge-based economy has led
to major office-based employers locating in downtown Toronto and, in
turn, booming technology-based and Creative Industry sectors that
employ a large share of young, mobile workers;
• Professionals in these fields tend to prefer urban locations and lifestyles
with high amenities and access to transit, which, in turn, attracts more
office employers to be close to their prospective work force; and
• This trend is accelerated by congestion, ironically, as Union station
becomes ever more accessible to the maximum GTHA labour force, via
Appendix B to Report PED17010(i)
the TTC subway, light rail, bus and a radial commuter rail network (GO
Transit) delivering significant in-bound ridership (and jobs) from
communities in the ‘905’ areas.
Employment growth has been so strong that Toronto has already achieved
its 2031 employment forecast and will likely achieve its prior 2041 forecast
sometime between 2024 and 2026. The office sector has been performing
particularly well (until recently) as shown in Figure 12.
Page 21 of 63
At the same time, there has also been an increase in office work occurring
in non-office forms, in particular “flex space” which has become more
Source: Toronto Employment Survey 2018,
widespread due its cost advantages and flexibility in use . Other forms of Toronto City Planning
smaller co-working and shared office space have also become more
prevalent, including in the City of Hamilton: another trend that may be
accelerated by the COVID-19 Pandemic.
Results Subject to Revision as New Information Becomes Available 20Section 2: Major Trends and Drivers of Intensification
2.5 Lifestyle Preferences
Market has Emerged in Other GTHA Municipalities
There is no question that the recent focus of development in downtown
Toronto has been extraordinary by any measure. Contrary to popular belief,
however, this trend is in line with the traditional demographic pattern of
young adults moving to the urban core for education and job opportunities.
It just so happens that recent growth has included a large share of this age
group which, along with the growing technology-based and Creative
Industry sectors that attract large numbers of young professionals, have
concentrated in and around the downtown.
The City of Toronto will continue to play a major role in accommodating Numerous residential and mixed-
apartments, however it is no longer the only part of the market. Large-scale use developments are completed
intensification has been occurring outside Toronto in more urbanized areas underway or proposed in the
VMC, including major offices.
such as in the vicinity of shopping centres (e.g. Mississauga) in older
Appendix B to Report PED17010(i)
commercial areas (e.g. Oakville) and along major arterial roads (e.g.
Hamilton). Substantial levels of intensification are also taking place in the
Vaughan Metropolitan Centre (VMC), supported in large part by the new
subway line to downtown Toronto.
These emerging areas offer many of the factors that attract younger
workers (access to employment, transit, shopping, urban amenities) but not
yet at the level that attracts so many to central Toronto. Indeed, the City of
Page 22 of 63
Toronto appears to have entered a period of growth where the sheer scale of
new investment creates its own market interest – or “buzz” – making the
downtown attractive for intensification in its in its own right in addition to
Pier 8 in Hamilton’s West Harbour
broader demographic and economic trends. Nevertheless, some higher
area is envisioned to accommodate
density housing is being built through intensification outside Toronto, 1,500 new units and significant non-
including the City Hamilton, the City of Guelph, the Kitchener-Cambridge- residential floor space.
Waterloo area and others.
Results Subject to Revision as New Information Becomes Available 21Section 2: Major Trends and Drivers of Intensification
2.5 Lifestyle Preferences
Intensification is not a Substitute for Greenfield Development
While intensification is emerging in other GTHA municipalities, ground-related
housing types remain the dominant form of development for most communities
outside Toronto. The exceptions are locations where a specific circumstance or
catalyst for intensification is in place, such as major transit investment (the
VMC), an almost fully built-out land supply (Mississauga) or large numbers of
students and young professionals related to the technology sector (Kitchener-
Cambridge-Waterloo, Toronto).
For the most part, older adults and families with children continue to locate
largely outside the City of Toronto, mainly because of the availability of larger
and more affordable family-sized units. Most Canadians also live in suburban
spaces. An estimated two-thirds of the country’s total population are living in
some form of suburb, with over 80% in the large metropolitan areas of Toronto,
Appendix B to Report PED17010(i)
Montreal and Vancouver: in short, a nation of City-dwellers who live in the
suburbs (Council for Canadian Urbanism, 2018).
Achieving higher rates of intensification is an important objective within this
context. From a planning perspective, however, housing units built as
intensification within the built-up area are generally not a direct substitute for
ground-related housing in greenfield areas. Almost all of the designated land for
larger family-sized housing is outside the City of Toronto. As a result, and
Page 23 of 63
despite the boom of apartments in the downtown, most of the population and
housing growth to 2051 will continue to be accommodated in the regional
(“905”) municipalities of the GTHA and City of Hamilton. The distribution and
timing of this growth, in turn, will be governed largely by the availability of
housing supply to meet this demand for family-sized units.
Results Subject to Revision as New Information Becomes Available 22Section 3: The City of Hamilton in Context
As discussed in Section 2, demand for residential intensification Figure 13: Price Growth Relationship Between
is driven by strong economic and demographic forces, combined GTA and Nearby CMAs
with lifestyle and employer preferences. This section provides an
overview of the City of Hamilton within this context, including its
expanding role in the metropolitan area, population and housing
market trends and residential intensification activity.
3.1 Hamilton’s Expanding Role in the Metropolitan Area
In recent years there has been a well-documented acceleration of
market interest in the City as a location for new housing and
business investment. These recent growth trends bode well for
the future of intensification.
Source: CMHC Housing Market Insight Report, Hamilton CMA,
Housing Cost Spillovers From GTA January 2017
House prices in the central GTA have increased faster than
Appendix B to Report PED17010(i)
Figure 14: Historic Residential Average Price
surrounding areas, especially for larger, family-sized units. These
Hamilton-Burlington Area
price increases continue to motivate buyers to purchase more
affordable homes in nearby urban areas, driving up prices in
those communities.
As shown in Figure 13, price spillovers historically have been
most prevalent in the cities of Barrie, Guelph and Hamilton. And
Page 24 of 63
there is anecdotal evidence that more recent spillovers are
occurring even further to the west in Brantford, St. Catharine's-
Niagara, and Kitchener. As shown by Figure 14, average housing
price in the larger Hamilton-Burlington area has risen steadily
over time, even after the 2017 peak and correction. However,
while prices may have increased, the City of Hamilton remains
affordable relative to the broader GTA where the amount of price
appreciation has generally been greater.
Results Subject to Revision as New Information Becomes Available 23Section 3: The City of Hamilton in Context
3.1 Hamilton’s Expanding Role in the Metropolitan Area
Economic Migration from Central Toronto
Hamilton’s relatively affordable real estate market has made the City more
attractive not only for new home buyers but also economic development.
This is one of the reasons for the City’s burgeoning Creative Industries
sector and local arts scene: economic activities that attract young workers
and tend to cluster in central urban areas.
There is anecdotal evidence of downtown Toronto businesses relocating for
more affordable space options, including the City of Hamilton. The changing
nature of the office market is also driving demand for ‘flex space’, shared
The former Westinghouse headquarters
work spaces and other co-working arrangements as well as ‘Brick and shown above has been converted to
Beam’ retrofits, such as the Westinghouse redevelopment and Cotton 80,000 sq. ft of Class A office space and a
Factory Creative Hub, both shown at right. ground floor event space
Appendix B to Report PED17010(i)
In our view, the COVID-19 Pandemic is likely to at least sustain current
trends in the office market. Increases in remote working have also led to an
interest in new office models: the ‘hub and spoke’ concept, for example,
which is characterized by a small central office augmented by other smaller
offices or co-working space closer to where employees live. This trend along
with the overall attraction of suburban office markets from a real estate
cost perspective bodes well for the future of office growth and residential
intensification in the City of Hamilton.
Page 25 of 63
Over the longer-term, these trends are anticipated to continue as a result The former Imperial Cotton Co. has been
of the growing cost, ever-worsening congestion and other disbenefits to transformed into the “Cotton Factory”: a
occupying central Toronto office locations. A positive outlook for office creative industries complex, with space
growth bodes very well for the future of intensification, especially growth in for workshops and small manufacturing,
tech-related/creative sectors and associated demand for fashionable office office space for creative professionals,
and studios for artists
space in historic downtown industrial buildings.
Results Subject to Revision as New Information Becomes Available 24Section 3: The City of Hamilton in Context
3.1 Hamilton’s Expanding Role in the Metropolitan Area
Role as Regional Centre in Southwest GGH Figure 15: Service Area of the Hamilton
Niagara Haldimand Brant LHIN
The City of Hamilton has served as a regional centre within the broader
southwest GGH for decades. The City is the location of significant higher
education and health care resources, community service and cultural
amenities serving the broader Hamilton-Niagara-Haldimand-Brant area,
represented conceptually by the boundaries of the Local Health Integration
Network (LHIN) shown in Figure 15.
Continued housing cost spillovers combined with economic migration from
central Toronto is likely to solidify if not expand the City’s economic role as
a regional service centre. There is also the real possibility of Hamilton
emerging as the second major historic downtown centre in the GGH, driven
by a combination of intense growth pressure in the Toronto core and the
City’s growing attraction for new business investment. “COVID-19 speeds up home buyer
exodus from Toronto, condo market
Appendix B to Report PED17010(i)
This potential also suggests that Hamilton will continue to serve demand for quivers”
‘regional’ population-related employment such as hospitals, universities and
Reuters, August 2020
specialized downtown shopping. As noted, a key factor driving housing
demand in the outer ring will be continued out-migration from the GTHA. “‘It’s a 180-degree turn’: Toronto
This pattern of demand – combined with the focus on boosting housing realtors see signs of a pandemic
supply as part of Bill 108 and new LNA method – is anticipated to continue exodus”
for communities in the broader Hamilton-Niagara area; especially larger, Globe and Mail, August 2020
Page 26 of 63
family-sized housing.
“Hamilton house prices explode
There is recent anecdotal evidence of increased sales and pricing in amid COVID as Toronto buyers
Hamilton and farther afield in Niagara. The trend towards more dispersed leave commuting worries behind”
growth (discussed in Section 2.2) combined with the City’s burgeoning CBC News, September 2020
Creative Industries sector (especially film) could further expand the City’s
current role as a regional service centre within the southwest GGH and, in
turn, support demand for residential intensification.
Results Subject to Revision as New Information Becomes Available 25Section 3: The City of Hamilton in Context
3.1 Hamilton’s Expanding Role in the Metropolitan Area
Industrial and Business Park Development
Hamilton is forecast to play a greater role in accommodating employment
growth over the long-term, especially for business park and industrial-type
uses. After lagging behind for some time, this sector has recently returned
to higher levels of performance:
• Demand for greenfield industrial land and building space has increased,
as indicated by recent and pending projects in the Ancaster, Stoney
Creek, Flamborough and Red Hill Business Parks. According to City staff,
there is also a growing market interest for development lands in the
Airport Employment Growth District (AEGD);
• The Port of Hamilton continues to expand as a key link in the goods
movement network for agri-food, steel, and other marine-supported
industry. Continued investment combined with the amalgamation with
the Oshawa Port Authority speaks to a growing regional role for the Port
Appendix B to Report PED17010(i)
as a major piece of economic infrastructure; and
• There is a renewed interest in the Bayfront Industrial Area as a location
for growth. Of particular interest is the potential of the nearly 800 acre
(310 ha) Stelco lands to accommodate a mix of new employment and
potentially additional Port-related uses.
As the City’s industrial and business park development accelerates,
Page 27 of 63
employment will grow, making the City more attractive as a location for
new investment and, in turn, driving population growth and increased
demand for housing units overall. It will be important to plan for and
protect these economic opportunities from short-term pressures for
employment land conversion. There is already a large potential supply of
residential intensification opportunities and the City has a long-standing
policy objective to focus this type of development in the downtown and
other planned nodes and corridors.
Results Subject to Revision as New Information Becomes Available 26Section 3: The City of Hamilton in Context
3.1 Hamilton’s Expanding Role in the Metropolitan Area
Research, Innovation and the Technology Sector
Another element of the City’s economic and social transformation is its growing
attraction for research, innovation and technology-related sectors:
• The City has solidified its role as a leading centre for research and development
in the GGH, notably for health and life sciences, but also the automotive, steel
and advanced manufacturing sectors. The City has been recognized as one of
the Top Intelligent Communities in the World by the Intelligent Community
Forum (ICF) for best practices in workforce development, innovation, and digital
inclusion and advocacy (2018 and 2020);
• A network has evolved to encourage innovation and entrepreneurship at the
local level including the McMaster Innovation Park (MIP) and Joyce Centre for
Partnership and Innovation at Mohawk College. Collaborative workspaces such
as Seedworks, the Cotton Factory and other shared office/creative spaces have
emerged throughout the City to further support growth; and
Appendix B to Report PED17010(i)
• The City (until recently) has been experiencing accelerated growth in the
technology sector along with other areas such as City of Guelph and the
Kitchener-Cambridge-Waterloo area. Similar to housing, this growth has been
driven in part by rapid office growth, rising space and operating costs and a
shortage of qualified talent in the downtown Toronto market.
Notwithstanding the short-term COVID-19 impacts, the City is expected to
continue its past strong performance in technology-related and Creative Industry
Page 28 of 63
sectors. The film sector, in particular, has the potential to outpace growth
expectations. Moreover, a key aspect of emerging tech markets is the presence of
younger age groups, which prefer urban lifestyles and tend to cluster in downtown
areas. This demographic is also a major source of demand for high-density
apartment units and, in turn, residential intensification. Improved accessibility to
downtown Toronto via the West Harbour GO station is anticipated to compound
these advantages over time.
Results Subject to Revision as New Information Becomes Available 27Section 3: The City of Hamilton in Context
3.2 Local Population and Housing Market Trends
Figure 16: Population Growth by Census
Population and housing market trends in Hamilton have largely Period, GGH, 2001-2016
followed the broader metropolitan area, including recent growth in
central city areas, growth in younger age groups and a shift to more
affordable, higher density housing. The long-term outlook remains
positive, and both greenfields and intensification will play a role in
accommodating growth.
Population Growth has Shifted Within the GTHA
As shown in Figure 16, since 2001 the regional ‘905’ municipalities
have accounted for the majority of population growth in the GGH,
especially the regions of York and Peel. Their highest levels of growth
were in the 2001-2006 period, then declines thereafter. The Cities of Source: Hemson Consulting Ltd. Based on Statistics
Hamilton and Toronto, on the other hand, experienced their most Canada Annual Demographic Statistics
rapid growth in the 2011 to 2016 period as part of a broad shift of
Appendix B to Report PED17010(i)
growth towards more central city areas. Figure 17: Age Structure of Net Migration,
Hamilton, Rest of GTHA (2016 -2021e)
Recent Growth is Largely in Younger Age Groups
Within the GGH there is a long-standing pattern of growth in the
form of young adults moving to the “Big City” for education and
employment (historically the City of Toronto) and older adults, along
with their children, moving out of Toronto to the ‘905’ and further
afield to adjacent communities in the GGH.
Page 29 of 63
The demographic profile of growth in Hamilton shows a similar
pattern of migration, primarily from other locations in the GTHA but
also Canada and internationally. As shown in Figure 17, the recent
growth has been mainly young adults and those in early family
Source: Hemson Consulting Ltd. Based on Statistics
formation years, similar to the profile that has driven growth in the Canada Annual Demographic Statistics
regional municipalities in the rest of the GTHA and GGH.
Results Subject to Revision as New Information Becomes Available 28You can also read