Comparison of aerosol optical depth from satellite (MODIS), sun photometer and broadband pyrheliometer ground-based observations in Cuba - Atmos ...
←
→
Page content transcription
If your browser does not render page correctly, please read the page content below
Atmos. Meas. Tech., 11, 2279–2293, 2018
https://doi.org/10.5194/amt-11-2279-2018
© Author(s) 2018. This work is distributed under
the Creative Commons Attribution 4.0 License.

Comparison of aerosol optical depth from satellite (MODIS),
sun photometer and broadband pyrheliometer
ground-based observations in Cuba
Juan Carlos Antuña-Marrero1 , Victoria Cachorro Revilla2 , Frank García Parrado1 , Ángel de Frutos Baraja2 ,
Albeth Rodríguez Vega1 , David Mateos2 , René Estevan Arredondo3,1 , and Carlos Toledano2
1 AtmosphericOptics Group of Camagüey (GOAC), Meteorological Institute of Cuba, Camagüey, Cuba
2 AtmosphericOptics Group (GOA), University of Valladolid (UVA), Valladolid, Spain
3 Huancayo Observatory, Geophysical Institute of Peru, Huancayo, Peru

Correspondence: Juan Carlos Antuña-Marrero (jcam45@gmail.com)

Received: 29 August 2017 – Discussion started: 3 November 2017
Revised: 15 March 2018 – Accepted: 19 March 2018 – Published: 20 April 2018

Abstract. In the present study, we report the first compari-      (e) both algorithms present good correlations for compar-
son between the aerosol optical depth (AOD) and Ångström          ing AODt , AODa , AODta vs. AODSP , with a slight overes-
exponent (AE) of the Moderate Resolution Imaging Spectro-         timation of satellite data compared to AODSP , (f ). The DT
radiometer (MODIS) instruments on the Terra (AODt ) and           algorithm yields better figures with slopes of 0.96 (Terra),
Aqua (AODa ) satellites and those measured using a sun pho-       0.96 (Aqua) and 0.96 (Terra + Aqua) compared to the DB
tometer (AODSP ) at Camagüey, Cuba, for the period 2008 to        algorithm (1.07, 0.90, 0.99), which displays greater variabil-
2014. The comparison of Terra and Aqua data includes AOD          ity. Multi-annual monthly means of AODta establish a first
derived with both deep blue (DB) and dark target (DT) algo-       climatology that is more comparable to that given by the
rithms from MODIS Collection 6. Combined Terra and Aqua           sun photometer and their statistical evaluation reveals bet-
(AODta ) data were also considered. Assuming an interval          ter agreement with AODSP for the DT algorithm. Results of
of ±30 min around the overpass time and an area of 25 km          the AE comparison showed similar results to those reported
around the sun photometer site, two coincidence criteria were     in the literature concerning the two algorithms’ capacity for
considered: individual pairs of observations and both spatial     retrieval. A comparison between broadband aerosol optical
and temporal mean values, which we call collocated daily          depth (BAOD), derived from broadband pyrheliometer ob-
means. The usual statistics (root mean square error, RMSE;        servations at the Camagüey site and three other meteorolog-
mean absolute error, MAE; median bias, BIAS), together            ical stations in Cuba, and AOD observations from MODIS
with linear regression analysis, are used for this comparison.    on board Terra and Aqua show a poor correlation with slopes
Results show very similar values for both coincidence crite-      below 0.4 for both algorithms. Aqua (Terra) showed RMSE
ria: the DT algorithm generally displays better statistics and    values of 0.073 (0.080) and 0.088 (0.087) for the DB and DT
higher homogeneity than the DB algorithm in the behaviour         algorithms. As expected, RMSE values are higher than those
of AODt , AODa , AODta compared to AODSP . For collocated         from the MODIS–sun photometer comparison, but within the
daily means, (a) RMSEs of 0.060 and 0.062 were obtained           same order of magnitude. Results from the BAOD derived
for Terra and Aqua with the DT algorithm and 0.084 and            from solar radiation measurements demonstrate its reliabil-
0.065 for the DB algorithm, (b) MAE follows the same pat-         ity in describing climatological AOD series estimates.
terns, (c) BIAS for both Terra and Aqua presents positive
and negative values but its absolute values are lower for the
DT algorithm; (d) combined AODta data also give lower val-
ues of these three statistical indicators for the DT algorithm;

Published by Copernicus Publications on behalf of the European Geosciences Union.
2280                                      J. C. Antuña-Marrero et al.: Comparison of aerosol optical depth from satellite

1   Introduction                                                 as a whole data set. We also used deep blue (DB) and dark
                                                                 target (DT) algorithms to evaluate the reliability of satellite
Atmospheric aerosols play an important role in weather and       AOD and AE retrievals in selecting the most appropriate data
climate (IPPC, 2013). Depending on the physical, chemical        set to derive the climatology of both AOD and AE aerosol
and optical properties of atmospheric aerosols together with     parameters in Cuba.
their origin and spatial and temporal distribution, they can        The earliest attempt to measure aerosol optical properties
affect the Earth’s radiative budget as well as dynamic, bio-     at ground level in Cuba recorded in a scientific publication
geochemical and chemical processes (Knippertz and Stuut,         dates back to 1988 (Martinez, 1988), where the Linke tur-
2014; Seinfeld and Pandis, 2016). All of these processes play    bidity factor and the Ångströmß turbidity coefficient were
a key role at a global and regional scales due to the high       derived from solar direct normal irradiance (DNI) measure-
spatio-temporal variability of aerosol properties. Aerosols      ments. Twenty years later, a cooperation agreement between
can also affect the biosphere and, in particular, humans in      scientific institutions in Spain and Cuba enabled a Cimel
several ways: for example, the Saharan dust transported to       CE318 sun photometer to be installed at Camagüey (Cuba)
America across the Atlantic supplies nutrients to the Amazon     and for it to be included in the AErosol RObotic NEtwork
forest (Swap et al., 1992; Yu et al., 2015). Moreover, in the    (AERONET, Holben et al., 1998). Several aerosol studies
Caribbean, in addition to aerosols of local origin, dust makes   have been conducted using the AOD and AE from Cam-
the amount of aerosol exceed air quality standards associated    agüey’s sun photometer observations (see Antuña-Marrero
with human health (Prospero and Lamb, 2003; Prospero et          et al., 2017; http://www.goac.cu/uva/, last access: 9 April
al., 2014). The great variability of Saharan dust transported    2018).
to the Caribbean basin has been documented using long-term          Broadband pyrheliometric DNI observations allow the
observations in Barbados (Prospero and Lamb, 2003; Pros-         BAOD to be determined, which complements sun photome-
pero and Mayol-Bracero, 2013) and more recently in Mi-           ter aerosol observations at Camagüey, and provides aerosol
ami, Guadeloupe and Cayenne (Prospero et al., 2014). The         information at three other locations in Cuba. The main pur-
Caribbean region is thus of great importance for aerosol stud-   pose of determining BAOD is to offer information concern-
ies due to its low aerosol background, which helps aerosol       ing aerosol variability over the island, also making it possi-
transport studies (Kaufman et al., 2005; Denjean et al., 2016;   ble to extend aerosol records back in time. The first BAOD
Velasco-Merion et al., 2017). One difficulty, however, is that   calculations used for DNI measurement were conducted at
it is an area where land and water are mixed in individual       Camagüey under clear-sky conditions for the period 1985–
pixels when remote satellite aerosol studies are carried out.    2007 using Gueymard’s (1998) improved parameterisations
   In order to improve calculations of aerosol climatology       (Fonte and Antuña, 2011). García et al. (2015) used this kind
for Cuban land areas, which remains ongoing, we com-             of DNI observation for a longer period (1981–2013) and
pared aerosol ground-based observations and available satel-     compared this BAOD to sun photometer AOD data. They
lite data, as a first step towards assessing this climatology.   used observations under the clear line of sight between the
This involves a comparison between all the available Cam-        broadband pyrheliometer and a region of 5◦ around the sun
agüey sun photometer aerosol optical depth (AOD) data and        as well as improved climatological values of the integrated
the broadband aerosol optical depth (BAOD) provided by so-       water vapour.
lar radiation measurements with the series of AOD (550 nm)          This comparative analysis does not aim to be a validation
from the Moderate Resolution Imaging Spectroradiometer           study of the MODIS sensor since many works during the
(MODIS) instruments on board the Terra (2001 to 2015) and        long history of the MODIS sensor on the Terra and Aqua
Aqua (2002 to 2015) satellites. Selected observations were       platforms have sought to improve its features (these include
those spatially and temporally collocated between satellite      Kaufman et al., 1997a, b; Tanré et al., 1997; Remer et al.,
instruments and ground-based sites. In addition to the aerosol   2002, 2005, 2006; Hsu, et al., 2004, 2006, 2013; Levy et
load given by the AOD, we also evaluated the Ångström ex-        al., 2007, 2009, 2010, 2013, 2015; Sayer et al., 2013, 2014;
ponent (AE) as a parameter that provides information about       https://darktarget.gsfc.nasa.gov/atbd/overview, last access: 9
particle size for MODIS and sun photometer data.                 April 2018). However, compared to other areas of the world,
   One of the challenges we faced was the low amount of po-      no studies have been reported in the Caribbean region and in
tential coincident AOD and AE from MODIS and the sun             Cuba in particular (Papadimas et al., 2009; Mishchenko et al.,
photometer. The same is true for AOD from MODIS and              2010; Kahn et al., 2011; Bennouna et al., 2011, 2013; Witte
broadband-pyrheliometer-derived BAOD, in both cases due          et al., 2011; Gkikas et al., 2013, 2016; Levy et al., 2015).
to existing gaps in the ground-based time series and also be-       As mentioned, our aim is to establish reliable aerosol cli-
cause this area is strongly affected by clouds (mainly par-      matology in Cuba based on satellite and ground-based in-
tial cloud cover). In order to maximise the number of satel-     struments. By making a detailed comparison of similarities
lite and surface measurement pairs, we used primary AOD          and differences between available data sets, the present work
and AE L2 products without any averaging as well as com-         seeks to make a contribution to this aim.
bined AOD and AE from Terra and Aqua MODIS sensors

Atmos. Meas. Tech., 11, 2279–2293, 2018                                            www.atmos-meas-tech.net/11/2279/2018/
J. C. Antuña-Marrero et al.: Comparison of aerosol optical depth from satellite 2281
The article is structured as follows. Section 2 begins with We selected AOD at 550 nm from MODIS (both on Terra
the description of the data sets, followed by the explanation and Aqua satellites) Collection 6, L2 data level derived us-
of the coincidence criteria between the AOD and AE MODIS ing the two algorithms, DB for land with the highest data
L2 products and the same two variables from the sun pho- quality (quality flag = 2, 3) and DT for land, corrected (qual-
tometer and broadband pyrheliometer BAOD. This section ity flag = 3). In addition, we selected the AE retrieved over
ends with the explanation of the statistical indices used. Sec- land from the DB algorithm using the corresponding pairs of
tion 3 is composed of various sections designed to explain AOD values (412/470 or 470/650 nm) with the highest qual-
and discuss the large volume of results that emerge from the ity (quality flag = 2, 3), since the DT algorithm only retrieves
comparison by taking two different retrieval AOD aerosol al- the AE over the ocean (Table B1 in Levy et al., 2013). Table 1
gorithms for both the Terra and Aqua platforms, with the sun lists the aerosol products used in the present study.
photometer and BAOD. Section 4 contains the conclusions. At a global scale, it has been established that by using
the DT algorithm over land, MODIS-retrieved aerosol size
parameters evidence poor quantitative capacity, particularly
AE (e.g. Levy et al., 2010; Mielonen et al., 2011). However,
2 Materials and methods for the DB algorithm, AE capacity increases for moderate
or high aerosol loadings, AOD > 0.3 (Sayer et al., 2013). We
2.1 MODIS satellite instruments therefore decided to conduct the comparison between the AE
from the MODIS DB algorithm and the AE from the Ca-
The twin MODIS instruments on board the Terra and Aqua magüey sun photometer to estimate its uncertainty. The en-
satellites have accumulated over 15 years of observations of hanced DB algorithm methodology for deriving AE in Col-
several atmospheric parameters, including AOD at several lection 6 is the same as in Collection 5. It uses the Ångström
wavelengths and the AE parameter. These are the two most power law and AOD values at 412, 470 and 650 nm. Under
common parameters for describing atmospheric aerosol op- non-vegetated surfaces, AE is derived using the AOD from
tical properties. Based on the assumptions about the prop- pair 412/470 nm. For vegetated surfaces, AE is derived from
erties of the Earth’s surface and the aerosol type expected the 470/650 nm pair. In the case of a surface with mixed veg-
over these surfaces, the MODIS Atmosphere team devel- etated and non-vegetated areas, AE is derived using the AOD
oped three algorithms for processing MODIS observations at the three wavelengths mentioned (Hsu et al., 2013).
(Levy et al., 2013). Regions which appear visually dark
from space, referred to as dark target (DT), include the al- 2.2 Camagüey AERONET sun photometer
gorithm assumptions for vegetated land surfaces (Kaufman
et al., 1997a, b) and for remote ocean regions (Tanré et al., The Camagüey sun photometer was installed thanks to an
1997). The third algorithm, called the deep blue (DB) algo- agreement between the University of Valladolid (UVA),
rithm, includes assumptions for surfaces which are visually Spain, and the Meteorological Institute of Cuba (INSMET)
bright from space and uses near-UV wavelengths (DB band for joint aerosol research. It contributes to the NASA
near 410 nm). Under these conditions, the DB band provides AErosol RObotic NEtwork (AERONET; Antuña et al.,
a better signal than the visible wavelengths, improving the 2012). Annual replacement of the instrument for a calibrated
information content for aerosol retrievals (Hsu et al., 2004, instrument, sent from Valladolid to Camagüey, encountered
2006) due to lower surface albedo at this short wavelength. numerous transportation and customs delays, causing gaps in
Levy et al. (2013) provide a detailed explanation of basic the observation series. However, the collected series of obser-
MODIS retrieval concepts and improvements to the DT algo- vations does represent a valuable data set of aerosol colum-
rithm in Collection 6 for aerosol products. In addition, Hsu nar optical properties in the Caribbean, enabling GOAC–
et al. (2013) give a detailed explanation of the DB algorithm INSMET (Atmospheric Optics Group of Camagüey – In-
improvements in Collection 6. stitute of Meteorology) and GOA-UVA (Atmospheric Op-
Following Levy et al. (2013), we summarise the MODIS tics Group of Valladolid University) to conduct preliminary
calculus chain. MODIS Level 0 (L0) is the basic data file aerosol research (Antuña-Marrero et al., 2017).
containing raw observations from the sensors. Observations The AERONET Cimel sun photometers have been con-
grouped in 5 min swath scans (called granules) are Level 1A ducting aerosol observations at nine spectral narrow band
(L1A), which after calibration become Level 1B (L1B). L1B filters for over two decades, producing spectral AOD and
data feed the MODIS geophysical retrieval algorithms, gen- column effective particle properties (Holben et al., 1998).
erating the primary geophysical observations, which include In general, Cimel sun photometer nominal wavelengths are
AOD and AE, designated Level 2 (L2). This is followed 340, 380, 440, 500, 675, 870, 935, 1020 and 1640 nm. In
by Level 3 (L3), consisting of daily and monthly statistics some cases, the 1640 nm is replaced by a 1240 nm. Its pro-
of geophysical products, in 1◦ × 1◦ latitude–longitude grid cessing algorithm, based on the Beer–Lambert–Bouguer law,
boxes. L2 aerosol products are stored in the MOD04 (Terra) allows spectral optical depth values at an uncertainty level
and MYD04 (Aqua) files. of approximately 0.01 to 0.02 to be determined (Holben et
www.atmos-meas-tech.net/11/2279/2018/ Atmos. Meas. Tech., 11, 2279–2293, 20182282 J. C. Antuña-Marrero et al.: Comparison of aerosol optical depth from satellite
Table 1. Aerosol products from the MODIS Collection 6 data set used in the present study.
Product Description
Deep_Blue_Aerosol_Optical_Depth_550_ Deep blue AOT at 0.55 micron for land with higher
Land_Best_Estimate quality data (quality flag = 2, 3)
Deep_Blue_Angstrom_Exponent_Land Deep blue Ångström exponent for land with all
quality data (quality flag = 1, 2, 3)
Optical_Depth_Land_And_Ocean AOT at 0.55 micron for both ocean (average)
(quality flag = 1, 2, 3) and land (corrected)
(quality flag = 3)
al., 1998; Eck et al., 1999). Because of this low level of un- Stations
24
certainty, AERONET AOD observations commonly serve as Camagüey
23 Topes de Collantes
reference values (ground truth) to validate AOD measured by Jovellanos
other remote sensing sensors (Zhao et al., 2002). AERONET
Latitude
La Fe
22
AE are derived for five different wavelength intervals: 340–
21
440, 380–500, 440–675, 440–870 and 500–870 nm. In the
present study, the selected AE is the one in the 440–675 nm 20
range (AESP ). 19
We used Camagüey sun photometer Level 2.0 data as pro- -86 -84 -82 -80 -78 -76 -74
Longitude
cessed by AERONET, i.e. cloud screened and quality assured
(Smirnov et al., 2000), covering the period from 7 October
Figure 1. Map of Cuba with the stations where the sun photometer
2008 to 1 August 2014. This consisted of 29 940 single AOD and the four broadband pyrheliometer observations are conducted.
(340 to 1640 nm) and AESP observations. By applying the
Ångström power law, we converted single sun photometer
AOD observations at 500 nm wavelength to AOD at 550 nm, control procedures established for this set of instruments
(AODSP ) using the AESP from the same measurement: (GGO, 1957). Once the manual measurement is conducted
and recorded in a notebook designed for that purpose, all the
−AESP measurement information is digitised using Actino version
λ550
AODSP = AOD500 . (1) 2.0 software (Estevan, 2010; Antuña et al., 2008) of the Di-
λ500 agnostic Service of the Broadband Aerosol & Clouds Opti-
cal Depth for Cuba (http://www.goac.cu/seoc/, last access: 9
April 2018), a public service provided by GOAC. The soft-
2.3 Solar direct irradiance measurements and derived ware includes robust quality control of input data, its process-
BAOD ing and output quality control (Antuña et al., 2011). Because
of the ageing of the Soviet-era instruments, the magnitude of
Four actinometric stations belonging to the Solar Radiation the error associated with the broadband pyrheliometers cur-
Diagnostic Service in Cuba provided the DNI observations rently operating in Cuba is estimated to be around 10 %.
used to derive the BAOD (Antuña et al., 2008, 2011). Ta- Based on the model parameterisation of solar broadband
ble 2 lists the WMO code of the four stations, the geograph- irradiances, the integrated aerosol optical depth δa , BAOD,
ical location and the number of observations available for can be obtained using Eq. (2), in which direct normal solar
the periods at each station. Figure 1 shows the geographi- irradiance (DNI) is measured and the remaining variables are
cal location of the four stations. The stations are equipped determined independently (Gueymard, 1998).
with Yanishevsky manual broadband solar radiation instru-
ments supplied between the 1970s and 1980s by the Hydrom-
1 E0n
eteorological Service of the Soviet Union. The Yanishevski δa = ln − mR δc − mw δw − mnt δnt (2)
ma DNI
broadband pyrheliometer is the M-3 model, a thermo-battery
system with a 5◦ field of view connected to an analogic gal- The individual atmospheric processes considered are
vanometer, GSA-1MA or GSA-1MB model (GGO, 1957). Rayleigh scattering, absorption by ozone (O3 ), stratospheric
Calibrations of all the actinometric instruments are con- and tropospheric nitrogen dioxide (NO2 ), uniformly mixed
ducted periodically by comparison with a master broad- gases, water vapour, and extinction (mostly scattering) by
band pyrheliometer and a master pyranometer. Trained ob- aerosols. The variables in Eq. (2) are optical air mass of
servers perform hourly manual observations from sunset to aerosols (ma ), Rayleigh scattering, uniformed mixed gases,
sunrise, following the standard methodologies and quality O3 absorption and stratospheric NO2 (mR ), water vapour
Atmos. Meas. Tech., 11, 2279–2293, 2018 www.atmos-meas-tech.net/11/2279/2018/J. C. Antuña-Marrero et al.: Comparison of aerosol optical depth from satellite 2283
Table 2. Information about Cuban actinometric stations operating under the Solar Radiation Diagnostic Service (SRDS). Available number
of BAOD observations are included in column 6 and the period is covered in the last column.
Code Station name Latitude Longitude Height (m) No. observations Period
78355 Camagüey (CMW) 21.42 −77.85 122 m 2495 2001–2015
78330 Jovellanos (JVN) 22.80 −81.14 23 m 1182 2010–2015
78342 Topes de Collantes (TPC) 21.92 −80.02 766 m 1358 2011–2015
78321 Santa Fé (LFE) 21.73 −82.77 32 m 1756 2011–2015
(mw ) and tropospheric NO2 (mnt ) and the corresponding other stations, we calculated the monthly mean PW values
broadband optical depths δ. The method makes a series of using the vertical integrated water vapour (kg m−2 ) from spa-
assumptions, i.e. using Bouguer’s law, in the strict sense that tially coincident ERA-Interim reanalysis between 1979 and
it is only valid for monochromatic radiation and is applied to 2013 (Barja et al., 2015). Taking into account all the above-
define broadband transmittance. For a detailed description of mentioned errors, the total uncertainty of the method used to
the derivation of Eq. (2) and the parameterisation of the vari- determine BAOD is of the order of 10−2 (Gueymard, 1998).
ables, see Gueymard (1998), Fonte and Antuña (2011) and
García et al. (2015) for the method’s application to our data. 2.4 Coincidence criteria for MODIS and sun
In order to avoid cloud contamination in BAOD retrieval, photometer observations
we used only DNI observations with the cloud-free condi-
tion in the line of sight to the sun. In other words there is a Obtaining sufficient AOD satellite observations over land
clear line of sight between the broadband pyrheliometer and for climatological studies in insular areas poses a challenge
a region of 5◦ around the sun (GOAC, 2010). Furthermore, when compared to the amount of data usually available over
to avoid errors associated with high-elevation zenith angles, continental regions such as the USA, Europe or China. The
causing larger air masses, DNI observations performed at reason tends to be the small size of the islands. In the case of
06:00 and 18:00 local time (LT) were not used in the present Cuba, its particular narrow latitudinal and elongated longitu-
study. dinal extension combined with its irregular coasts renders the
The main errors of the method for determining BAOD are MODIS L3 product unsuitable for climatological studies. As
associated with instrumental errors and the error when esti- can be seen in Fig. 1, most of the 1◦ by 1◦ grid cells consist
mating the precipitable water (PW) component (Gueymard, of both land and sea areas, resulting from the merging AOD
2013). In the first case, in order to ensure the quality of the measured over the two surfaces. The red grid cell in Fig. 1 is
solar radiation data set from the four actinometric stations an example of the limitations of MODIS L3 products in rep-
used in this study, including DNI, they are regularly subject resenting land areas in the case of Cuba. In response to this,
to a two-step quality control procedure (Estevan et al., 2012). we plan to use the MODIS L2 product to produce aerosol cli-
The first step applies the standard procedures designed for matology for Cuba rather than L3, which is commonly used
Yanishevski-type actinometric instruments from the former for this type of study. In this regard, it is vital to validate the
Soviet Hydrometeorological Service (Kirilov et al., 1957). single observations from MODIS L2 with the single sun pho-
Data that pass this quality procedure are then evaluated fol- tometer observations. We designed and applied a method to
lowing the standards set by the Baseline Solar Radiation Net- maximise the available pairs of MODIS L2 and sun photome-
work, BSRN (Ohmura, 1998; Long and Shi, 2006, 2008; Es- ter AOD and AE observations that are coincident in space
tevan et al., 2012). and time while avoiding duplicating the use of any of them.
The size of the field of view of the broadband pyrheliome- Additionally, in an effort to increase the amount of data, we
ters is another potential source of error since, in certain cases, tested the differences between Terra and Aqua L2 MODIS
circumsolar radiation causes more radiation to be measured AOD and AE observations in order to determine the possible
than expected. In such cases, the effect is an underestimation combination of both Terra and Aqua in a single data set.
of BAOD. Nevertheless, this effect is low in general, except Hereinafter, AODt , AODa , AODta and AODSP will denote
in specific conditions such as large air masses or in the pres- spatio-temporal AOD from collocated MODIS (Terra, Aqua
ence of high aerosol loads or large-particle aerosols (Guey- and Terra + Aqua) and AERONET sun photometer data re-
mard, 1998). spectively. Unless otherwise indicated, “AOD” refers to AOD
Monthly mean PW values at the four actinometric stations at 550 nm wavelength. Similarly, AE from Terra, Aqua and
were used as input to derive monthly mean δw values (Guey- Terra + Aqua derived using only the DB algorithm will be
mard, 1998). For Camagüey, we calculated the monthly mean denoted by AEt , AEa and AEta .
PW values from the sun photometer PW observations from Given the challenges arising from the small amount of po-
2008 to 2014 (García et al., 2015). For each of the three tential coincident spatial and temporal AODt and AODa with
AODSP and BAOD, as explained above, we used MODIS L2
www.atmos-meas-tech.net/11/2279/2018/ Atmos. Meas. Tech., 11, 2279–2293, 20182284 J. C. Antuña-Marrero et al.: Comparison of aerosol optical depth from satellite
Table 3. Number of available non-negative AODa , AODt , AEa and 25
AEt data. They are spatially coincident with the Camagüey sun pho- Terra Aqua Sun photometer BAOD
tometer in a radius of 25 km for each retrieval algorithm, DB and DT
for the whole period 2001–2015 as well as the period 2008–2014, 20
when sun photometer data, AODSP and AESP , are available.
Frequency (%)
Period 2001–2015 2008–2014 15
Algorithm DB DT DB DT
Parameter AOD AE AOD AOD AE AOD 10
Terra 6884 8111 6311 3418 4024 3166
Aqua 2445 3909 2869 1329 1534 2093
5
data to maximise the number of available MODIS observa- 0
06:00 08:00 10:00 12:00 14:00 16:00 18:00
tions for comparison. Hereinafter, we call these observations Hours (local time)
“single observation values”, using the same denomination for
the instantaneous sun photometer observations on each day Figure 2. Frequencies of the time of day (local time) overpass of
and for hourly broadband pyrheliometer observations. An- Terra and Aqua (blue and red respectively). Camagüey’s sun pho-
other way to increase the amount of data was to combine tometer site is in a radius of 25 km for the period 2001 to 2015. In
AODt and AODa (AODta ) for comparison with AODSP and green are the time frequencies for the Camagüey’s sun photometer
observations in the period 2008 to 2014. In addition, the time fre-
BAOD. In these cases, different observations of AODSP and
quencies for the direct radiation observations are used to calculate
BAOD match AODt and AODa because the time difference the BAOD. The bar width is 10 min for Terra, Aqua and the sun
established for coincidence (±30 min) is lower than the dif- photometer and 1 h for the BAOD.
ference between the Terra and Aqua daily overpass times.
Spatial coincidence criteria were guaranteed by selecting
all the AODt and AODa measured inside the 25 km radius
around the sun photometer site for the whole data period the BAOD observations for Camagüey for the period 1981
from each satellite sensor. Table 3 shows the amount of spa- to 2015. Note that the BAOD histogram shows only hourly
tial coincident information for non-negative AODt and AODa frequency values, since that is the time interval between the
values. It shows the amount of data available for the whole manual pyrheliometric observations.
period 2001 to 2015, when broadband pyrheliometer obser- For each day, we compared the corresponding time of each
vations at Camagüey are available, and 2008 to 2014, the pe- single sun photometer measurement with the time of each
riod of available sun photometer observations. There are at single AODt and AODa observation located in a radius of
least twice as many available observations from Terra as from 25 km around the sun photometer site (an area of almost
Aqua for the two periods. The greater number of available 2000 km2 ) and in the time window of ±30 min between both
data from Terra compared to Aqua is associated with the dif- types of observations. The former selection process includes,
ferent overpass times of the two satellites over Cuba. Figure 2 for each satellite, the AODt and AODa values derived both
shows that Terra overpasses occur from mid-morning to late with the DB and DT processing algorithms separately, pro-
morning before convective activity begins, while the Aqua ducing four independent bulk data sets, two for Aqua and two
overpasses take place in the early afternoon when convection for Terra. We then identified four different cases of matching
has already begun, causing a higher number of observations data per day in the bulk coincident data sets. The first con-
to be discarded in AOD retrievals due to cloud presence. sisted of days with only one AODSP value and one AODt
(AODa ) coincident value, and the second consisted of only
Collocated “Single observation” values and “daily one AODSP value coincident with multiple AODt (AODa )
mean” values values each day. In the third case, only one AODt (AODa )
value coincided with multiple AODSP values. Finally, the
All Aqua and Terra overpass times in a radius of 25 km fourth case consisted of multiple AODSP values coincident
around Camagüey for the periods 2001 to 2015 (Terra) and with multiple AODt (AODa ) values.
2002 to 2015 (Aqua) are shown in Fig. 2. Overpass times, de- Coincident cases were then selected for comparison on
fined by the maximum and minimum values of all the 25 km a case by case basis. In the first instance, we selected all
spatially coincident MODIS observations, are 10:12–11:49 cases. In the second case, because of the MODIS instru-
(LT) for Terra and 12:47–14:20 (LT) for Aqua. In addition, ments spatio-temporal sampling geometry, time differences
Fig. 2 shows the diurnal frequency of sun photometer ob- between MODIS and sun photometer observations are of the
servations from 2008 to 2014 and the diurnal frequency of order of 1 min. As a result, only the criterion of the minimum
Atmos. Meas. Tech., 11, 2279–2293, 2018 www.atmos-meas-tech.net/11/2279/2018/J. C. Antuña-Marrero et al.: Comparison of aerosol optical depth from satellite 2285
distance between the positions of the AODt (AODa ) and the pected uncertainty, defined as a 1 standard deviation confi-
sun photometer was applied to determine the pair of coinci- dence interval, entails the sum of the absolute and relative
dent values, therefore not allowing any repeated AODSP and AOD errors. Usually referred to as expected error (EE), it
AODt (AODa ) values to be selected. Since it consists of only was applied in accordance with Eq. (3) (Sayer et al., 2014).
one AODt (AODa ) measurement and multiple AODSP obser-
vations, in the third case the distance is the same; hence the
selection criteria was the minimum of the time differences EEDT = ±(0.05 + 0.15 AOD) (3)
between AODSP and AODt (AODa ) observations. The fourth
case, the most complicated, allowed both criteria to be ap- The aim is to compare the performance of the DB and DT
plied. No differences in the amount of coincident data were algorithms directly (Sayer et al., 2014). All of these statisti-
found when testing whether the order in which the two crite- cal indicators were evaluated for the whole set of collocated
ria were applied had any impact. AODt , AODa , AODta with AODSP , and BAOD; AEt , AEa ,
Another approach, the most commonly used for compar- AEta with AESP ; as well as time frequencies (Fig. 2) and his-
ison (Bennouna et al., 2011; Sayer et al., 2014), involves tograms of these quantities. We also evaluated these statistics
averaging all the AODSP values in the interval of ±30 min on a monthly scale for the AOD values.
and comparing them to the MODIS instrument overpass time
(note that AODt and AODa averages are really the daily
3 Results and discussion
values of MODIS) located in a radius of 25 km around the
sun photometer. At least two single AODSP and two sin- This section is divided into four subsections. In the first sub-
gle AODt (AODa ) observations were required to calculate section, we analyse in detail the main results from comparing
the spatio-temporal average. We applied a similar approach the AOD satellite MODIS sensors and the sun photometer
to calculate collocated daily means of AESP , AEt and AEa . data given by the statistical indicators and linear correlations
The procedures described above generated a series of collo- as a result of taking two different criteria, which were two
cated daily means of AODSP vs. AODt (AODa ) and AESP different retrieval AOD aerosol algorithms for the Terra and
vs. AEt (AEa ). Hence, by combining the former generated Aqua platforms. Section 3.2 analyses the same type of re-
series of AOD (AE) for Terra and Aqua, we produced the co- sults but from the perspective of monthly values, since they
incident (Terra + Aqua) data set. The term “collocated daily represent the climatology of AOD and the associated uncer-
mean AOD” will be used hereinafter, although it should be tainties. Section 3.3 shows AE behaviour and Sect. 3.4 anal-
stressed that this approach reduces the number of observa- yses the comparison of satellite MODIS data in relation to
tions generated by virtually a third. broadband aerosol optical depth from solar radiation.
After explaining the coincidence criteria adopted here, it
is well known that this type of comparison shows major dif- 3.1 Comparison of AOD retrievals from sun
ferences depending on the spatial and/or temporal resolu- photometer and MODIS satellite instruments
tion taken for the MODIS sensor in relation to the ground-
based instruments used (Santese et al., 2007; Levy et al., As explained, we selected MODIS AODt (AODa ) and sun
2009; Bennouna et al., 2011, 2013). The justification for us- photometer AODSP data based on two different criteria for
ing a single-observation data set and a collocated daily means their comparison. Results are shown in Tables 4 and 5, corre-
data set separately to analyse this comparison is based on sponding to collocated daily means and single observations
(a) the characteristics of the surface area under study, with respectively. The values of all the statistics of these two ta-
nearby areas of water and land; (b) the difference concerning bles are extraordinarily similar, with analogous behaviour for
how cloud cover affects data during the overpass time of the the different algorithm and platforms. In truth, no substantial
Terra and Aqua platforms; (c) the possibility of including the differences are found. It must be noted that Table 4 for col-
largest amount of data; and (d) the fact that only single obser- located daily means contains a third less data than Table 5
vations can be compared in the case of BAOD pyrheliometer based on single observations. In contrast, however, the lat-
measurements. ter data have a higher associated error than daily mean data.
This result cannot be foreseen a priori but clearly demon-
2.5 Statistics strates that either criterion may be taken, since the result is
basically the same.
The statistics used in the present study are those commonly Taking Table 5 together with Fig. 3 of collocated daily
used (e.g. Sayer et al., 2014). These are the root mean mean values, we then analyse the different behaviours of
square error (RMSE), mean absolute error (MAE), median the two algorithms for the Terra and Aqua platforms. AODt
bias (BIAS), the Pearson linear correlation coefficient (R), (AODa ) from the satellite are compared with the sun pho-
the number of coincident MODIS and sun photometer cases tometer, AODSP . Figure 3 shows the density plots of the
(cases) and the fraction (f ) of the MODIS/AERONET AOD collocated daily mean AOD values from the sun photome-
retrievals in agreement within the expected uncertainty. Ex- ter vs. those of MODIS instruments for Terra, Aqua and
www.atmos-meas-tech.net/11/2279/2018/ Atmos. Meas. Tech., 11, 2279–2293, 20182286 J. C. Antuña-Marrero et al.: Comparison of aerosol optical depth from satellite
Table 4. Statistics from comparing collocated daily means of AODt and AODa with AODSP and the combined AODta .
AODSP vs. AODt AODSP vs. AODa AODSP vs. AODta
DB DT DB DT DB DT
RMSE 0.084 0.060 0.065 0.062 0.078 0.061
MAE 0.062 0.045 0.046 0.047 0.056 0.046
BIAS −0.053 −0.001 −0.033 0.006 −0.046 0.002
R 0.730 0.729 0.785 0.779 0.741 0.753
f 0.656 0.803 0.763 0.795 0.694 0.800
Cases 311 335 169 254 480 589
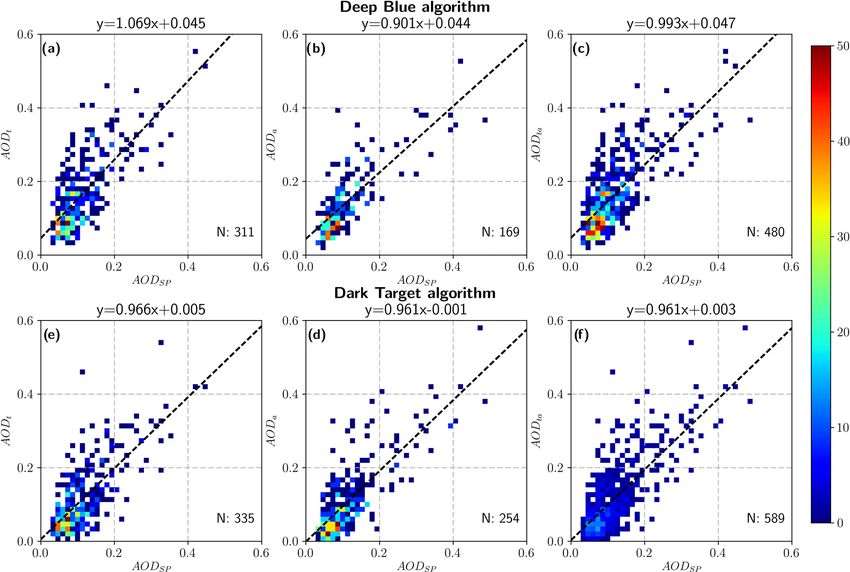
Figure 3. Collocated daily mean density scatter plots of the coincident AOD observations from the sun photometer and Terra and Aqua
MODIS instruments for DB and DT algorithms: (a) to (c) show AODSP vs. AODt , AODa and AODta respectively for the DB algorithm; (d)
to (f) show the same for the DT algorithm. The data density is represented by the colour scale, showing the number of data points located in
a particular area of the plot. Linear regression is given by the black discontinuous line and the corresponding equation. The number of data
points appears in the right bottom.
Terra+Aqua for DB (top plots) and DT (bottom plots) al- evidences more unified behaviour, as can be seen for the
gorithms. The least squares linear fit lines and equations are slope values (0.96 for both Aqua and Terra), while DB
also shown in the figure, while the correlation coefficients changes, giving a value above 1 (1.069) for Terra and below
(R values) are in Table 5. In general, the plots show that low- 1 for Aqua (0.901). However, these differences are not very
loading aerosols predominate and that scatter increases for relevant since both algorithms give almost identical R val-
higher aerosol loadings, with a slight overestimation of AODt ues, and the difference appears for the platforms with higher
(AODa ) satellite data compared to AODSP . In all cases, the values for Aqua than for Terra (∼ 0.78 and ∼ 0.73 respec-
slopes are between 1 and 0.9 and the intercepts are of the or- tively). A compensation effect can be observed when data are
der of 10−2 (with lower values for the DT algorithm), show- combined, since in this case the slope of the DB algorithm
ing very good values of these parameters for Terra and Aqua is closer to 1 than the DT algorithm, although the intercept
for both the DT and DB algorithms. is higher (closer to 0 for the DT algorithm). For combined
Figure 3 shows that the DT algorithm generally displays data, the two algorithms show more similar behaviour than
better behaviour than the DB algorithm. The DT algorithm for separate Aqua or Terra results. Table 5 shows that the
Atmos. Meas. Tech., 11, 2279–2293, 2018 www.atmos-meas-tech.net/11/2279/2018/J. C. Antuña-Marrero et al.: Comparison of aerosol optical depth from satellite 2287
Table 5. Statistics from comparing collocated single observation of AODt and AODa with AODSP and combined AODta .
AODSP vs. AODt AODSP vs. AODa AODSP vs. AODta
DB DT DB DT DB DT
RMSE 0.081 0.061 0.063 0.064 0.076 0.062
MAE 0.059 0.046 0.044 0.050 0.054 0.047
BIAS −0.048 0.007 −0.027 0.017 −0.042 0.010
R 0.716 0.701 0.817 0.794 0.744 0.742
f 0.664 0.773 0.773 0.784 0.699 0.777
Cases 880 900 419 500 1299 1400
(a) 0.3 (b) 0.15 Coincident measurements
0.4
0.2 0.1 AESP
RMSE
AOD
0.35 AEa & AEt
0.1 0.05
0.3
0 0
J F MA M J J A S O N D J F MA M J J A S O N D
Frequency (%)
(c) 0.15 (d) 0.25
0.05
0.1 0.2
MAE
0
Bias
0.05 -0.05
0.15
-0.1
0
J F MA M J J A S O N D J F MA M J J A S O N D 0.1
(e) 1 (f) 1
0.75 0.75 0.05
R
0.5 0.5
f
0
0.25 0.25 0 0.5 1 1.5 2
Ångström exponent
0 0
J F MA M J J A S O N D J F MA M J J A S O N D
AODSP AODtaDB AODtaDT
Figure 5. Frequency distribution of the Ångström exponent (AE)
values from both MODIS instruments Terra and Aqua and the sun
Figure 4. Monthly means and statistics (RMSE, MAE. . . ) resulting photometer are coincident in ±30 min and 25 km radius around Ca-
from the comparison between AODSP and AODta for both DB and magüey.
DT algorithms: (a) monthly means of the AODSP and AODta for
both DB and DT algorithms, (b) RMSE for the comparison between
AODSP and AODta for both DB and DT algorithms, (c) the same
for MAE, (d) BIAS, (e) R and (f) f . The blue discontinuous line tions for CSA (ENA) was 3032 (4155). Sun photometer data
at f = 68 % represents 1 standard deviation confidence interval for were averaged within the 30 min MODIS overpass time and
the EE indicator.
MODIS data were averaged in the 25 km radius around the
sun photometer site, which makes the comparison appropri-
ate. We selected the BIAS and R statistics in Table 1, which
magnitudes of the RMSE, MAE, BIAS and f statistics are were defined as in the present study (Sayer et al., 2013).
lower for the DT than for the DB algorithm (see the higher We compare those statistics with the ones given in Ta-
values of DB for Terra, column 1, and the more similar val- bles 4 and 5, calculated for Camagüey. The BIAS for the
ues in the other columns). As mentioned, the values of these CSA (ENA) stations is −0.016 (0.0094), although those of
four parameters show that the DT algorithm presents more Camagüey for both single observations and collocated daily
unified behaviour for both platforms than the DB, which has means are −0.027 and −0.033, thus showing higher values
similar values for Aqua but changes significantly for Terra. for Camagüey, similar signs for CSA and the opposite signs
Although the statistical numbers in the comparison de- for ENA. R values for Camagüey for single observations
pend on the area under study, comparisons between areas and collocated daily means are 0.82 and 0.79 respectively,
are always possible. A recent validation of MODIS Collec- which are lower by around 10 % (5 %) than the R values of
tion 6 AODa (Aqua), derived using the DB algorithm with 0.96 (0.86) for the CSA (ENA). However, it should be noted
AODSP from six AERONET stations in Central and South that the number of cases used for the statistics at Camagüey
America (CSA) and seven in eastern North America (ENA), was 419 for single observations and 169 for collocated daily
was reported by Sayer et al. (2013). The number of pairs of means, representing 6 % and 14 % of the 3032 cases used in
collocated MODIS and AERONET daily averaged observa- the cited study. In addition, none of the stations in the CSA
www.atmos-meas-tech.net/11/2279/2018/ Atmos. Meas. Tech., 11, 2279–2293, 20182288 J. C. Antuña-Marrero et al.: Comparison of aerosol optical depth from satellite
Table 6. Statistics from comparing AEt , AEa and AEta with AESP for single observations and daily mean values.
Single observations Single observations Collocated daily means Collocated daily means
(Except AE 1.5 & 1.8) (Except AE 1.5 & 1.8)
AEt AEa AEta AEt AEa AEta AEt AEa AEta AEt AEa AEta
RMSE 0.637 0.692 0.658 0.575 0.609 0.587 0.637 0.659 0.645 0.548 0.578 0.561
MAE 0.494 0.553 0.516 0.446 0.496 0.464 0.490 0.512 0.498 0.431 0.466 0.445
BIAS −0.327 −0.337 −0.331 −0.129 −0.101 −0.119 −0.398 −0.384 −0.393 −0.189 −0.139 −0.167
R −0.187 −0.426 −0.272 −0.191 −0.444 −0.269 −0.259 −0.414 −0.308 −0.124 −0.400 −0.236
Cases 615 374 989 353 189 542 311 169 480 172 120 292
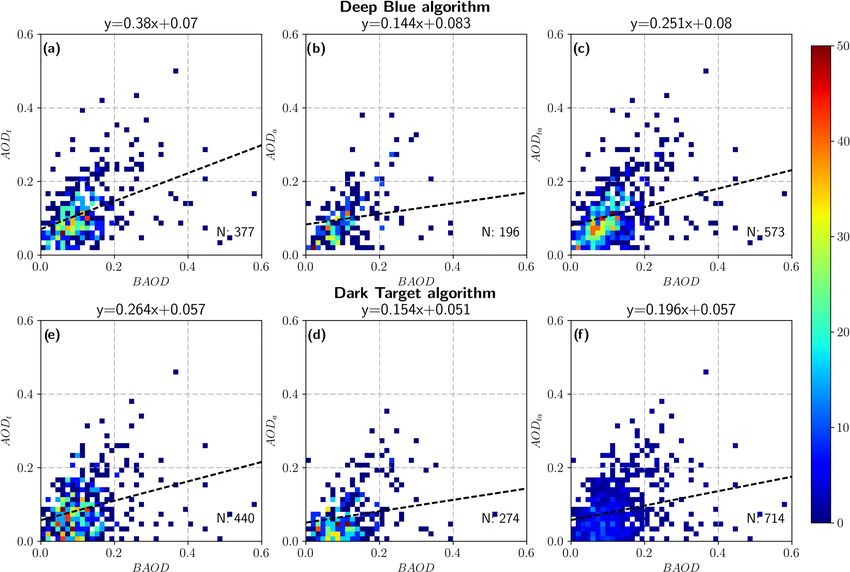
Figure 6. Single observations density scatter plots of the coincident BAOD observations from the broadband pyrheliometer and Terra and
Aqua MODIS instruments for DB and DT algorithms: panels (a) to (c) show BAOD vs. AODt and AODa and AODta for the DB algorithm;
(d) to (f) show the same for the DT algorithm. The data density is represented by the colour scale, showing the number of data points located
in a particular area of the plot. Linear regression line is shown by the black discontinuous line and the corresponding equation. The number
of data points appear in the right bottom.
(ENA) regions were located in the Caribbean, but were fur- the comparison between AODSP and AODta for both the DB
ther south and north (Sayer et al., 2014). Despite the signif- and DT algorithms. Tables S1 and S2 (see Supplement) also
icant difference in the number of cases used in both studies illustrate this comparison, although they add separate infor-
and the location of the six stations, the results show reason- mation for Terra and Aqua (see Supplement). In Fig. 4a,
able agreement. the multi-annual monthly means from the combined AODta
and AODSP for both the MODIS DB and DT algorithm are
3.2 Monthly means values and statistics shown, providing an initial overview of aerosol AOD clima-
tology in Camagüey. It can also be seen that the DT algorithm
Given the close similarity in the results from single obser- gives the best match with monthly mean AODSP .
vations and collocated daily means data, it seems reasonable The monthly RMSE and MAE plots in Fig. 4b and c gener-
to evaluate monthly mean values based on only one of them, ally show increases, with an increase in the AODta for the DT
i.e. for the collocated daily means data. Figure 4 shows the algorithm and also for the DB algorithm. The exception is the
monthly means (based on the mean of each month for every minimum in April for the DT algorithm (this means greater
year of the measured period) and the statistics resulting from
Atmos. Meas. Tech., 11, 2279–2293, 2018 www.atmos-meas-tech.net/11/2279/2018/J. C. Antuña-Marrero et al.: Comparison of aerosol optical depth from satellite 2289
Table 7. Number of coincident cases of AODt , AODa , AODta with BAOD both for the DB and DT algorithms.
Station BAOD vs. AODt BAOD vs. AODa BAOD vs. AODta
DB DT DB DT DB DT
Camagüey 166 171 66 79 232 250
Topes de Collantes 112 138 49 76 161 214
Jovellanos 65 65 35 34 100 99
La Fe 34 66 46 85 80 151
All combined 377 440 196 274 573 714
differences between satellite and sun photometer in summer higher values over 80 % from November to January, in gen-
than in winter). These results are consistent with the fact that eral for both algorithms. This is the period of the year with
the AOD uncertainty depends on the AOD itself (see Eq. 3) the lowest monthly mean values of both AODta and AODSP .
and greater AOD variability in summer. The AODta peaks for During the rest of the year, including the period of the Saha-
the DT algorithm in March in both RMSE and MAE are also ran dust arrivals, it shows its lowest values between 60 and
present in the results for AODt and AODa separately, and the 75 % for the DT algorithm, while values for DB below 50 %
number of cases available for the statistics is among the high- occur in four of the months between June and October. The
est of all the months seen in Tables S1 and S2. In Table S2, discontinuous blue line at f = 68 % denotes a 1 standard de-
for the DT algorithm, we can see that the number of cases of viation confidence interval, which is selected to describe EE.
AODta from March to April drops by 55 %. However, some- The f values above that value mean the algorithm works bet-
thing similar happens for the DB algorithm in Table S1, with ter than expected. All the statistics demonstrate that the DT
the number of AODta cases falling from March to April by algorithm performs better than the DB for the region of study.
61 %. Sampling cannot therefore be seen as the cause of the However, the lowest R values for those months with the high-
RMSE and MAE peaks for the DT algorithm. We plan to est f values would seem to be contradictory. At present, we
revisit this feature in future studies. In summer, the RMSE have no explanation for this.
and MAE show their maximum values associated with the
maximum values of the AOD resulting from Saharan dust 3.3 Comparison of Ångström exponent by sun
reaching Cuba from across the Atlantic. The BIAS is nega- photometer and MODIS satellite instruments
tive in summer for both Terra and Aqua AOD, showing that
AODt and AODa observations have higher magnitudes than Figure 5 shows the frequency distribution of the coincident
AODSP . AESP with both AEt and AEa using the DB algorithm, as
Tabulated results of the comparison between AODt , AODa explained. As can be seen in the literature, the Ångström ex-
and AODta with AODSP on a monthly scale also show bet- ponent varies between 0 and 2. Our Ångström exponent data
ter results for the DB (see Table S1) than for the DT (Ta- obtained from the AERONET sun photometer measurements
ble S2) algorithm. Here, we only discuss the results of the are within this range, with a wide and smooth frequency dis-
joint AODta data set using both the DT and DB algorithms. tribution of values and with a not well-defined maximum in
In Fig. 4d, the BIAS for the DT algorithm is positive from the range 1.2–1.6. Neither AEt nor AEa present any real dis-
December to May, a period of the year with predominantly tribution shape because there are practically no values below
lower AODta and AODSP values. During this period, AODta 1. Most are around AE = 1.5, followed by a second maxi-
underestimates AODSP . BIAS then becomes negative from mum at AE= 1.8. The first, 1.5, is a regional default value
June to November, which is when Saharan dust reaches the for AEt and AEa (Hsu et al., 2013; Sayer et al., 2013) as-
Caribbean basins. At the same time, the BIAS of the AODta sumed by the DB algorithm in the case of low AOD values
derived with the DB algorithm is negative for the whole year, (AODt or AODa < 0.2). The second is associated with the fact
with higher absolute values than those from the DT algo- that the AEt and AEa values allowed by the aerosol optical
rithm. models in Collection 6 are constrained between 0 and 1.8 to
The correlation coefficient, R, in Fig. 4e is the statistic avoid unrealistic values (Sayer et al., 2013).
which shows almost the same agreement for the DB and DT Table 6 shows the results of the comparison of coincident
algorithms. However, the DT shows a higher number of R AEt , AEa and AEta with ESP . For both single observations
values bearing higher magnitudes. R magnitudes remain over and collocated daily mean data the statistics were calculated
0.5 almost the whole year round, except in December and for the two options: the first including all values and the sec-
January when lower AOD values occur. ond excluding cases with AE = 1.5 and 1.8. The statistics
Figure 4f shows the fraction of the AODta (f ) in agree- in Table 6 present similar values for those derived by sin-
ment with AODSP within the expected uncertainty, showing gle observation and for collocated daily mean values. This
www.atmos-meas-tech.net/11/2279/2018/ Atmos. Meas. Tech., 11, 2279–2293, 20182290 J. C. Antuña-Marrero et al.: Comparison of aerosol optical depth from satellite
Table 8. Statistics from comparing the single observations of BAOD at the four actinometric stations coincident in space and time with the
single observation (L2) of AODt , AODa and AODta . In bold are the values of best agreement.
Camagüey, La Fe, Topes de Collantes & Jovellanos
BAOD vs. AODt BAOD vs. AODa BAOD vs. AODta
DB DT DB DT DB DT
RMSE 0.080 0.087 0.073 0.088 0.078 0.088
MAE 0.055 0.063 0.048 0.066 0.052 0.064
BIAS 0.001 0.027 0.014 0.049 0.005 0.035
R 0.455 0.325 0.501 0.417 0.468 0.355
Cases 373 436 191 268 564 704
was expected once we knew the results for AOD, although retrievals in agreement within the expected uncertainty, be-
similar values also appear for Terra and Aqua (no clear dis- cause this uncertainty still has to be established for BAOD.
tinction appears between Terra and Aqua). These statistics We highlighted the best-performing algorithm in bold for
present very high values if compared with those shown for each of the statistics. The AODa derived with the DB algo-
AOD. The R correlation coefficient presents very low val- rithm performs better than the other three combinations of
ues, which are below 0.5 (the poor correlation is observed in AODt , AODa , for DT and DB in accordance with all four
the scatter plots similarly to those in Fig. 6, not shown here). statistics, except for BIAS, where the best-performing algo-
Excluding AEt and AEa values equal to 1.5 or 1.8 entails no rithm is still the DB algorithm, but for AODt . However, in
substantial difference, only lower BIAS values. Overall, the general, and taking into account the low amount of data and
results of the comparison showed the low quantitative skill the fact that we have single observations, the RMSE, MAE
of the AEt and AEa for this site. One factor contributing to and BIAS for AODt , AODa , AODta derived with both DB
this result is that the AE from the MODIS DB algorithm dis- and DT algorithms remain in the same order of magnitude
plays great uncertainty for low-AOD conditions, since AE as in Tables 4 and 5, with the exception of the low values of
is obtained as a gradient between two small AOD numbers the correlation coefficient R. The BIAS shows almost similar
(Wagner and Silva, 2008). behaviour except for its best-performing value. This contrast-
ing behaviour of algorithms and platforms with respect to the
3.4 Comparison of AOD between MODIS products and earlier results of Tables 4–5 is clearly shown in Fig. 6, where
BAOD for the four Cuban actinometric stations the scatter plots of the BAOD vs. AODt , AODa , and AODta
are depicted. What is clear is the poor correlation given by
Two main facts limit the number of available BAOD values the very low values of the slope with respect to value 1 and
coincident in time with AODt and AODa : the hourly time also the relatively high values of the intercept in relation to
step between manual DNI observations and the required con- 0. Hence it results in low values of the R coefficient. BAOD
dition of a clear line of sight between the pyrheliometer and a shows a high uncertainty for low values of AOD (below 2;
region of 5◦ around the sun. Consequently, only one BAOD see this range over the x axis in the plots), which are those
measurement could coincide each day with AODt and an- prevalent in this area (l).
other with AODa given the time coincidence criteria. Table 7
lists the number of coincident AODt , AODa , AODta obser-
vations in space and time with BAOD for the DB and DT 4 Conclusions
algorithms for each of the actinometric stations. Since the
number of coincident observations at each station is low, we This study addresses the comparisons of different sources
decided to combine all the pairs of AODt , AODa and AODta of AOD and AE from a ground-based sun photometer
coincident with BAOD in the four sites in order to conduct (AERONET level 2.0 data), MODIS instruments (Terra,
the comparison. In addition, we did not consider the very few Aqua, and Terra + Aqua) and retrievals from direct normal
cases with values of BAOD > 0.6, around 1 % of all cases, so solar irradiance observations in Cuba.
as to avoid the possibility of inadvertent cloud contamina- The comparison of spatial and temporal coincident single
tion. observations and collocated daily means of AODt , AODa ,
Table 8 contains almost the same statistics used in previ- AODta vs. AODSP shows, in general, a better performance
ous comparison satellite-sun photometer data (see Tables 4 for the dark target (DT) than for the deep blue (DB) algo-
and 5), both for the DB and DT algorithms for the four acti- rithm for Camagüey. In particular we found (1) small differ-
nometric stations together. The only statistic not included in ences between AODt and AODa , thus justifying the combi-
Table 8 is f , the fraction of the MODIS/AERONET AOD nation of these observations in a single data set for clima-
Atmos. Meas. Tech., 11, 2279–2293, 2018 www.atmos-meas-tech.net/11/2279/2018/J. C. Antuña-Marrero et al.: Comparison of aerosol optical depth from satellite 2291
tological studies; (2) both DT and DB algorithms are bet- 2020 Research and Innovation Program under grant agreement
ter than expected (f around 80 %) between November and no. 654109 (ACTRIS-2). We acknowledge the funding provided
January, but in other months f is of the order of 1 stan- by MINECO (CTM2015-66742-R) and by the Junta de Castilla y
dard deviation (f = 68 %) for DT and significantly lower León (VA100U14).
for DB; (3) from linear correlation analysis, MODIS slightly
Edited by: Marloes Gutenstein-Penning de Vries
overestimates AOD compared to the sun photometers; and
Reviewed by: two anonymous referees
(4) data from both MODIS instruments are well correlated
with AERONET AOD with regression slopes close to 1 and
the DT algorithm outperforming the DB algorithm. In ad-
dition, the comparison of multi-annual monthly means of References
AODta with AODSP indicate better agreement with results
from the DT algorithm (compared to DB), consistent with Antuña, J. C., Fonte, A., Estevan, R., Barja, B., Acea, R.,
the findings above. and Antuña Jr., J. C.: Solar radiation data rescue at Ca-
The Ångström exponents AEt , AEa and AEta do not show magüey, Cuba, B. Am. Meteorol. Soc., 89, 1507–1511,
good agreement with the spatial and temporal coincident https://doi.org/10.1175/2008BAMS2368.1, 2008.
Antuña J. C., Hernández, C., Estevan, R., Barja, B., Fonte, A.,
AESP values when the default −1.5 and the constrained −1.8
Hernández, T., and Antuña Jr., J. C.: Camagüey’s solar radiation
values are or are not considered. Those results corroborate rescued dataset: preliminary applications, Óptica Pura y Apli-
the limited skills of the MODIS-derived AE, as indicated in cada, 44, 43–48, 2011.
previous studies. Antuña, J. C., Estevan, R., and Barja, B.: Demonstrating the Po-
In the comparison of BAOD vs. AODt , AODa , AODta , tential for First-Class Research in Underdeveloped Countries:
where only individual observations can be compared, the Research on Stratospheric Aerosols and Cirrus Clouds Optical
statistics indicate larger uncertainties but of the same order of Properties, and Radiative Effects in Cuba (1988–2010), B. Am.
magnitude as the statistics of MODIS photometer. Although Meteorol. Soc., 93, 1017–1027, https://doi.org/10.1175/BAMS-
correlations are very poor, these results support the potential D-11-00149.1, 2012.
for BAOD to be a reliable source of aerosol information for Antuña-Marrero, J. C., De Frutos Baraja, A., and Estevan
climatological studies in areas that lack a sun photometer or Arredondo, R.: Joint aerosol research between Cuba and Spain
proves fruitful, EOS, 98, 10 pp., 2017.
any other surface aerosol measurement.
Barja, B., Rosas, J., and Estevan, R.: Caracterización del contenido
integral del vapor de agua atmosférico sobre Cuba obtenido
mediante mediciones y modelación, Scientific Report, Grant
Data availability. MODIS Aerosol Product MxD04 Version 6.0 200.04070, 77 pp., unpublished, 2015 (in Spanish).
DOI information and links for downloading can be accessed from Bennouna, Y. S., Cachorro, V. E., B., Toledano, C., Berjon,
the MODIS Data Product at the NASA Goddard Space Flight Cen- Prats, N., D Fuertes, González, R.; Rodrigo, R., Torres,
ter (GSFC) from https://modis.gsfc.nasa.gov/data/dataprod/mod04. B., and De Frutos, A. M.: Comparison of atmospheric
php (NASA, 2018a). Sun photometer aerosol observations for Ca- aerosol climatologies over southwestern Spain derived from
magüey, Cuba, from the AErosol RObotic NEtwork (AERONET) AERONET and MODIS, Remote Sens. Environ., 115, 1272–
from Goddard Space Flight Center (GSFC) are available from http: 1284, https://doi.org/10.1016/j.rse.2011.01.011, 2011.
//aeronet.gsfc.nasa.gov (NASA, 2018b). Bennouna, Y. S., Cachorro, V. E., Torres, B., Toledano, C.,
Berjon, A., de Frutos, A. M., and Alonso Fernandez-Coppel,
I.: Atmospheric turbidity determined by the annual cycle of
The Supplement related to this article is available online the aerosol optical depth over north-center Spain from ground
at https://doi.org/10.5194/amt-11-2279-2018-supplement. (AERONET) and satellite (MODIS), Atmos. Environ., 67, 352–
364, https://doi.org/10.1016/j.atmosenv.2012.10.065, 2013.
Denjean, C., Formenti, P., Desboeufs, K., Chevaillier, S., Triquet,
S., Maillé, M., Cazaunau, M., Laurent, B., Mayol-Bracero, O.
L., Vallejo, P., Quiñones, M., Gutierrez-Molina, I. E., Cas-
Competing interests. The authors declare that they have no conflict sola, F., Prati, P., Andrews, E., and Ogren, J.: Size distri-
of interest. bution and optical properties of Africanm mineral dust after
intercontinental transport, J. Geophys. Res., 121, 7117–7138,
https://doi.org/10.1002/2016JD024783, 2016.
Acknowledgements. This work has been supported by the Cuban Eck, T., Holben, B., Reid, J., and Dubovik, O.: Wavelength depen-
National Program “Meteorology and sustainable development for dence of the optical depth of biomass burning, urban, and desert
Cuba” research grant P211LH007-20 and by the joint agreement dust aerosols, J. Geophys. Res., 104, 31333–31349, 1999.
between the University of Valladolid, Spain, and the Cuban Estevan, R.: Certificación de depósito legal facultativo de obras pro-
Meteorological Institute for aerosol research. Juan Carlos Antuña- tegidas, software: “Actino 2.0”, CENDA, 218–2010, 2010 (in
Marrero wishes to thank Loraine Remer and Andrew Sayer for Spanish).
their contributions to understanding MODIS algorithms. This Estevan R., Antuña, J. C., Barja, B., Hernández, C. E., Hernández,
research has received funding from the European Union’s Horizon T., García, F., Rosas, J., and Platero, I. Y.: Climatología de la Ra-
www.atmos-meas-tech.net/11/2279/2018/ Atmos. Meas. Tech., 11, 2279–2293, 2018You can also read