Longitudinal Study of the Variation in Patient Turnover and Patient-to-Nurse Ratio: Descriptive Analysis of a Swiss University Hospital
←
→
Page content transcription
If your browser does not render page correctly, please read the page content below
JOURNAL OF MEDICAL INTERNET RESEARCH                                                                                                                 Musy et al

     Original Paper

     Longitudinal Study of the Variation in Patient Turnover and
     Patient-to-Nurse Ratio: Descriptive Analysis of a Swiss University
     Hospital

     Sarah N Musy1,2, MSc; Olga Endrich3,4, MD; Alexander B Leichtle4,5, MD; Peter Griffiths6,7,8, PhD; Christos T Nakas5,9,
     PhD; Michael Simon1,2, PhD
     1
      Institute of Nursing Science, University of Basel, Basel, Switzerland
     2
      Nursing and Midwifery Research Unit, Inselspital, Bern University Hospital, University of Bern, Bern, Switzerland
     3
      Medical Directorate, Inselspital, Bern University Hospital, University of Bern, Bern, Switzerland
     4
      Insel Data Science Center, Inselspital, Bern University Hospital, University of Bern, Bern, Switzerland
     5
      University Institute of Clinical Chemistry, Inselspital, Bern University Hospital, University of Bern, Bern, Switzerland
     6
      Health Sciences, University of Southampton, Southampton, United Kingdom
     7
      National Institute for Health Research Applied Research Collaboration (Wessex), Southampton, United Kingdom
     8
      LIME Karolinska Institutet, Stockholm, Sweden
     9
      Laboratory of Biometry, University of Thessaly, Volos, Greece

     Corresponding Author:
     Michael Simon, PhD
     Institute of Nursing Science
     University of Basel
     Bernoullistrasse 28
     Basel, 4057
     Switzerland
     Phone: 41 61 267 09 12
     Email: m.simon@unibas.ch

     Abstract
     Background: Variations in patient demand increase the challenge of balancing high-quality nursing skill mixes against budgetary
     constraints. Developing staffing guidelines that allow high-quality care at minimal cost requires first exploring the dynamic
     changes in nursing workload over the course of a day.
     Objective: Accordingly, this longitudinal study analyzed nursing care supply and demand in 30-minute increments over a period
     of 3 years. We assessed 5 care factors: patient count (care demand), nurse count (care supply), the patient-to-nurse ratio for each
     nurse group, extreme supply-demand mismatches, and patient turnover (ie, number of admissions, discharges, and transfers).
     Methods: Our retrospective analysis of data from the Inselspital University Hospital Bern, Switzerland included all inpatients
     and nurses working in their units from January 1, 2015 to December 31, 2017. Two data sources were used. The nurse staffing
     system (tacs) provided information about nurses and all the care they provided to patients, their working time, and admission,
     discharge, and transfer dates and times. The medical discharge data included patient demographics, further admission and discharge
     details, and diagnoses. Based on several identifiers, these two data sources were linked.
     Results: Our final dataset included more than 58 million data points for 128,484 patients and 4633 nurses across 70 units.
     Compared with patient turnover, fluctuations in the number of nurses were less pronounced. The differences mainly coincided
     with shifts (night, morning, evening). While the percentage of shifts with extreme staffing fluctuations ranged from fewer than
     3% (mornings) to 30% (evenings and nights), the percentage within “normal” ranges ranged from fewer than 50% to more than
     80%. Patient turnover occurred throughout the measurement period but was lowest at night.
     Conclusions: Based on measurements of patient-to-nurse ratio and patient turnover at 30-minute intervals, our findings indicate
     that the patient count, which varies considerably throughout the day, is the key driver of changes in the patient-to-nurse ratio.
     This demand-side variability challenges the supply-side mandate to provide safe and reliable care. Detecting and describing
     patterns in variability such as these are key to appropriate staffing planning. This descriptive analysis was a first step towards
     identifying time-related variables to be considered for a predictive nurse staffing model.

     https://www.jmir.org/2020/4/e15554                                                                         J Med Internet Res 2020 | vol. 22 | iss. 4 | e15554 | p. 1
                                                                                                                              (page number not for citation purposes)
XSL• FO
RenderX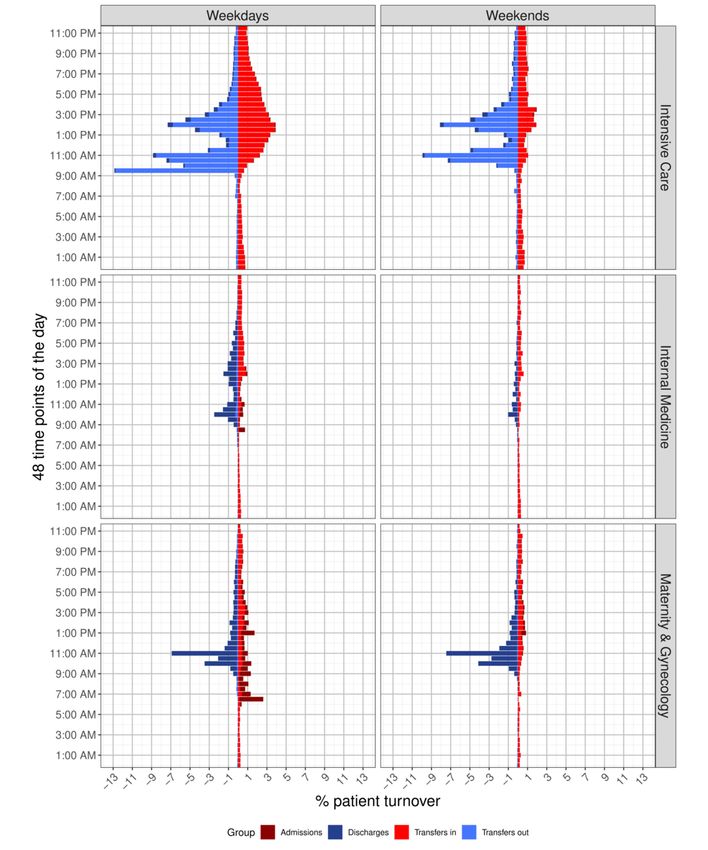
JOURNAL OF MEDICAL INTERNET RESEARCH                                                                                                     Musy et al

     (J Med Internet Res 2020;22(4):e15554) doi: 10.2196/15554

     KEYWORDS
     patient safety; electronic health records; nurse staffing; workload; routine data

                                                                           Every nursing unit manager’s job includes assuring patient
     Introduction                                                          safety and quality of care every hour of the day. However, due
     Determining appropriate nursing staff numbers and skill mixes         to the noted limitations and considering the principle that
     in hospital units is vital to both ensure quality of care [1-4] and   nurse-patient relationships occur on the individual level [25],
     maintain health care budgets [5]. Understaffing or poor skill         previous studies have offered a limited view of the small-scale
     mixes can lead to adverse patient outcomes, while overstaffing        supply and demand dynamic of nursing workload. Nurse staffing
     can lead to budgetary overruns and ultimately close hospitals.        planners are particularly challenged by demand-side variability,
     In economic terms, the relationship between patients and nurses       which occurs over very short periods. Therefore, to both
     is one of supply and demand, respectively, representing the           optimize staffing levels (ie, maintain levels that will allow safe
     amount of care required by the patients versus the nursing staff’s    patient care while minimizing personnel costs) and develop
     capacity to provide that care.                                        reliable staffing guidelines, it is necessary to record and explore
                                                                           fluctuations in nursing workload throughout the day rather than
     Undoubtedly, care demands and staffing requirements vary              simply considering daily or shift averages.
     widely across departments, units, seasons, months, days of the
     week, shifts (morning, evening, or night), and even hours [6-8].      Therefore, this study’s overall aims were to describe the supply
     Each unit’s patient count fluctuates with patient turnover            and demand dynamics of nursing care and identify mismatches
     resulting from admissions, discharges, and transfers within and       between supply and demand from a longitudinal perspective.
     between units [9-12]. In turn, turnover affects the volume of         Specifically, in 30-minute increments, across a range of units
     nurses’ clinical and administrative duties [13,14].                   in a Swiss University Hospital (Inselspital, Bern), we describe
                                                                           every recorded change in patient numbers (ie, care demand);
     Another notable factor is patient acuity, or the amount of time       nurse numbers (ie, supply); patient-to-nurse ratios for the various
     each patient requires. Newly admitted or transferred patients         nurse groups; extreme supply and demand mismatches; and
     tend to have high levels of acuity because they require baseline      patient turnover (ie, numbers of admissions, discharges, and
     assessments and treatments [15,16]. Specific patient                  transfers).
     characteristics, including demographics (eg, age, gender, family
     support, socioeconomic factors), personal background,                 Methods
     diagnoses, and treatment regimes, can also increase acuity. For
     example, patients who are older [17-19], lack family support          Study Design and Setting
     [18], or have limited knowledge of their health condition(s) [20]     This retrospective, descriptive, observational study used
     have more complex care needs, with strong implications for            routinely collected patient data from the Inselspital University
     nurse staffing. Depending on each shift’s patient numbers and         Hospital, Bern, Switzerland. As one of Switzerland’s five
     combined acuity, nursing workloads can vary across and within         University Hospitals, the Inselspital treats approximately 48,000
     wards. Meeting their specific needs requires an appropriate           inpatients annually [26]. Only inpatient units with data for the
     number and skill mix of nurses: registered nurses (RNs),              full 3 years were included. Our data were drawn from 10
     licensed practical nurses (LPNs), and unlicensed personnel.           departments: (1) Internal Medicine; (2) Cardiology &
     Some studies have used nursing staff with or without                  Cardiovascular Surgery; (3) Orthopedics & Plastic Surgery; (4)
     qualification in their analyses [21,22]. In Switzerland, RNs          Neurology, Neurosurgery, Otolaryngology, Head and Neck
     typically represent the major proportion of hospital nursing          Surgery, & Ophthalmology; (5) Visceral Surgery and Medicine,
     staff; however, direct and indirect patient care typically involves   Gastroenterology, Thoracic Surgery, & Pulmonology; (6)
     collaborations between nurses with a broad range of                   Dermatology, Urology, Rheumatology, & Nephrology; (7)
     qualifications.                                                       Hematology & Oncology; (8) Maternity & Gynecology; (9)
     To date, the majority of research about nurse staffing has fit        Pediatrics; and (10) Intensive Care. Full data (2015–2017) were
     into two categories: longitudinal studies conducted over              available for all these departments for the full study period.
     relatively long periods (eg, years) or across locations and
                                                                           Participants
     cross-sectional studies often conducted across multiple locations.
     However, in both cases, large-scale views fail to capture             Patients
     shift-level or daily variations in either supply or demand. This      All inpatients were included. No further specific eligibility
     lack of detail limits the understanding of the association between    criteria were applied.
     staffing, patient turnover, and relevant human and economic
     outcomes [7]. Noting that these limitations severely limit the        Nurses
     value of research findings for staffing guidelines [22], studies      All staff providing direct or indirect nursing care were
     have begun to highlight the advantages of both focusing on            considered in the analysis, independent of educational
     unit-level dynamics and using hospital record data longitudinally     background. We divided nursing staff into five groups: RNs,
     rather than cross-sectionally [21,23,24].                             including nurses in supervisory positions (group 1); LPNs (group

     https://www.jmir.org/2020/4/e15554                                                             J Med Internet Res 2020 | vol. 22 | iss. 4 | e15554 | p. 2
                                                                                                                  (page number not for citation purposes)
XSL• FO
RenderX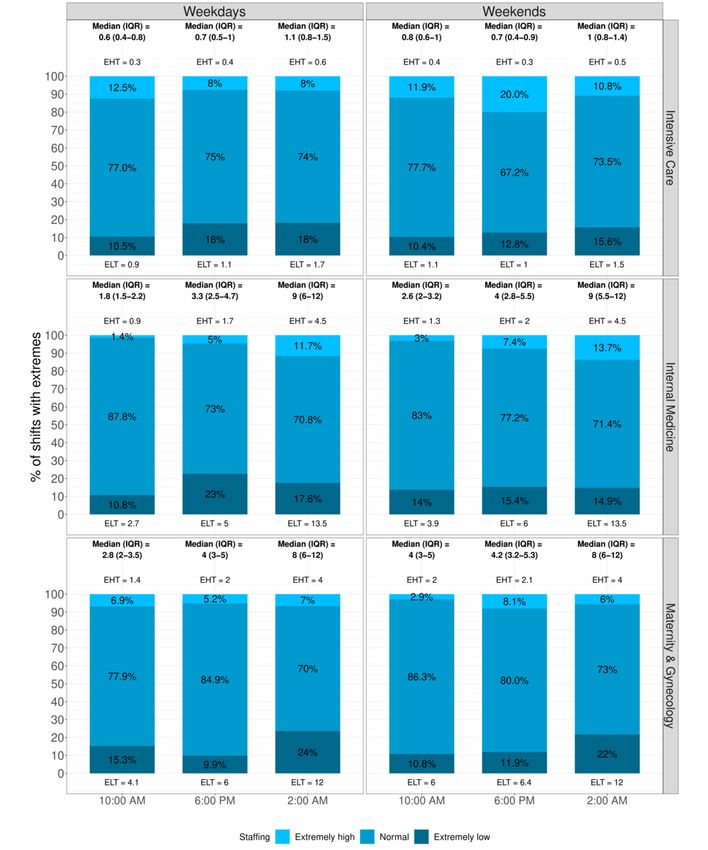
JOURNAL OF MEDICAL INTERNET RESEARCH                                                                                                   Musy et al

     2); others, including unlicensed and administrative personnel       administrative work, teaching duties, and continuous education,
     (group 3); students (group 4); and external nurses (agency staff;   each record specifies the time devoted to each patient’s direct
     group 5). In Switzerland, RNs complete a 3-4–year tertiary          and indirect care. No further details about the type of activity
     professional or university-based education (group 1). Unlike in     such as medication, mobility, or respiratory therapy are currently
     other countries, Switzerland also offers 3 years of                 available. Nurses’ absences such as holidays, illnesses, or
     secondary-level professional training for nursing assistants        accidents are also recorded. Patient turnover information is
     (group 2). Group 3 included unlicensed personnel, including         provided with the nursing unit, date, and time, as well as whether
     nursing aides with minimal education or training, and               inpatient or outpatient services were provided. Finally, medical
     administrative staff. Group 4 included both nursing and medical     discharge data include patient demographics, admission and
     students working as nursing aides.                                  discharge details, and diagnoses. Each data record identifies the
                                                                         relevant unit and includes identifiers for the nurse (and her or
     Data Sources and Variables                                          his contract) and each case (patient) cared for during that shift.
     We extracted our data from two sources: the tacs nurse staffing     Based on these identifiers, the 5 datasheets were linked at the
     system (ie, datasheets organized in a relational database) and      patient, nurse, and unit levels in a single dataset. Then, all
     medical discharges. From tacs, we extracted four care-relevant      patient, nurse, and unit identifiers were deidentified, leaving
     factors: nurses, patients, activities, and care-related working     only department names. Table 1 describes the 17 variables used
     hours. The tacs system records time allocations provided by         in the analysis.
     every nurse at the end of every shift. In addition to

     https://www.jmir.org/2020/4/e15554                                                           J Med Internet Res 2020 | vol. 22 | iss. 4 | e15554 | p. 3
                                                                                                                (page number not for citation purposes)
XSL• FO
RenderX
JOURNAL OF MEDICAL INTERNET RESEARCH Musy et al
Table 1. Description of the 17 variables used for the current analysis, listed in alphabetical order.
Variable and short description Sourcea
Type of activity performed by the nurse
Indirect and direct care Ab
Administrative work A
Teaching assignments A
Continuous education A
Absences (ie, holidays, illnesses, accidents) A
Admission date
Patient’s hospital admission date Pc
Admission time
Patient’s hospital admission time P
Age
Patient’s age at admission Md
Case identifier
Unique code for the patient’s case (deidentified to “Patient1”, “Patient2”, etc) A, P, M
Departments of the Inselspital, Bern University Hospital
Cardiology & Cardiovascular Surgery A, M
Neurology, Neurosurgery, Otolaryngology, Head and Neck Surgery, & Ophthalmology A, M
Intensive Care A, M
Pediatrics A, M
Dermatology, Urology, Rheumatology, & Nephrology A, M
Visceral Surgery and Medicine, Gastroenterology, Thoracic Surgery & Pulmonology A, M
Internal Medicine A, M
Maternity & Gynecology A, M
Orthopedics & Plastic Surgery A, M
Hematology & Oncology A, M
Contract identifier
Unique code for each nursing position/contract (a nurse can have multiple contracts within the hospital involving various A, Ne, Wf, M
qualifications or working units), which was deleted after merging
Date
Working date of the nurse A, W
Discharge date
Patient’s hospital discharge date P, M
Discharge time
Patient’s hospital discharge time P
End time
Time at which the nurse stopped work for the shift or started a break W
Group (classifications of nurse qualifications)
https://www.jmir.org/2020/4/e15554 J Med Internet Res 2020 | vol. 22 | iss. 4 | e15554 | p. 4
(page number not for citation purposes)
XSL• FO
RenderXJOURNAL OF MEDICAL INTERNET RESEARCH Musy et al
Variable and short description Sourcea
Registered nurses N
Licensed practical nurses N
Others (eg, unlicensed and administrative personnel) N
Students N
External nurses N
Main diagnosis
ICD-10-GMg codes for the patient’s main diagnosis M
Nurse identifier
Unique code for a nurse (deidentified to “Nurse1”, “Nurse2”, etc) A, N, W
Start time
Time at which the nurse began work or returned from a break W
Transfer date
Transfer date of the patient within and between departments P
Transfer time
Transfer time of the patient within and between departments P
Unit identifier
Unique code for the unit (deidentified to “Unit1”, “Unit2”, etc within each department) A, N, P
a
Source: nurse staffing system (tacs) or medical discharge data.
b
A: nurse staffing system activity data.
c
P: nurse staffing system patient data.
d
M: medical discharge data.
e
N: nurse staffing system nurse data.
f
W: nurse staffing system working hours data.
g
ICD-10-GM: 10th revision of the International Statistical Classification of Diseases and Related Health Problems, German Modification.
Similarly, each patient’s activity data were merged first with
Ethical Considerations their other data, then with medical controlling data by case
Our acquisition of data from the Inselspital (University Hospital identifier. To maintain consistent patient counts, healthy
of Bern) was outside the purview of the Cantonal Ethic newborn babies in the Maternity & Gynecology department
Commission of Bern based on the Swiss legislation on research were excluded. Patients and units were then deidentified. Finally,
with humans (Req-2016-00618). All data involving patients, the merged nurse and patient data were expanded to allow
nurses, and units were deidentified. assessment of the number of nurses, patients, admissions,
discharges, and transfers in 30-minute increments.
Statistical Analyses
All statistical analyses were conducted using R, version 3.5.1 Descriptive Overview
for Mac OS and Linux [27]. To handle and manipulate the data, For each department, the total numbers of units and patients
we used the purrr [28], dplyr [29], tidyr [30], and data.table [31] were recorded. Mean (SD) and median (interquartile range
packages. To manipulate time and date, we used the lubridate [IQR]) were calculated for patient age. Length of stay (LOS)
[32], chron [33], and padr [34] packages. To create plots, we in days was computed by subtracting the discharge date from
used the ggplot2 [35] and scales [36] packages. the admission date. Median (IQR) was calculated for LOS and
for the number of patients per day per unit. Finally, for each
Linking Procedure
department, we identified the two most common diagnoses by
Data were merged based on 6 key variables: patient identifier, incidence (%).
nurse identifier, contract identifier, unit identifier, time, and
date. First, a subset of activity data was created for data on Number of Patients
inpatient units and direct and indirect care. This subset was then To keep computational complexity to a reasonable limit, patient
divided into nurse and patient activity fields, and any duplicate numbers (ie, demand) were calculated at 30-minute intervals.
records were deleted. Each nurse’s activities were merged first Alternative increments (20, 40, and 60 minutes) had no relevant
with her or his other data, then with the data she or he supplied effect on the results. However, as patients rarely arrive or leave
regarding time use, contract identifier, and date. Contract at shift divisions and some do not stay on the unit for one full
identifiers were deleted, and nurses and units were deidentified. shift, a short interval length ensures precise patient numbers.
https://www.jmir.org/2020/4/e15554 J Med Internet Res 2020 | vol. 22 | iss. 4 | e15554 | p. 5
(page number not for citation purposes)
XSL• FO
RenderXJOURNAL OF MEDICAL INTERNET RESEARCH Musy et al
Unit-level calculations correspond to every 30-minute interval Patient Turnover
(ie, 48 data points per day) totaling 153,792 points per unit For every unit, the numbers of admissions, discharges, and
during the study period. transfers were computed for every 30-minute data point during
Number of Nurses the 3-year study period. Admission corresponds to any entry of
a patient to the hospital and discharge to any exit from the
As with the number of patients, the number of nurses in each
hospital. Transfers, corresponding to movement of admitted
group (ie, supply) was calculated for each 30-minute increment.
patients from one unit to another, were divided into “Transfers
As nurses may work only half shifts or overlapping shifts, this
in” and “Transfers out” of each relevant unit. As the units were
increment length ensured precise numbers. For each of the 48
of different sizes, the numbers of admissions, discharges, and
daily data points for the 3 years covered by the study, the
transfers in and out were divided by the number of patients
numbers of RNs, LPNs, and other staff were calculated.
present at each specific data point. This allowed us to obtain a
Unfortunately, as external nurses and students are not classified
ratio for patient turnover that could be plotted on the same scale
as typical employees, our datasets included no breakdown of
for all the units. Finally, vertical bar charts were created for
their time allocation. As only daily information was available
weekdays and weekends by calculating the mean of the units
for these groups, their total numbers over the 3-year study period
for the departments. The left side of the vertical bar charts
as well as their daily means and medians were calculated to
represents patients leaving the unit (ie, discharges and transfers
provide an image of their effects across each unit.
out), while the bars on the right side represent incoming patients
Patient-to-Nurse Ratio (ie, admissions and transfers in).
The patient-to-nurse ratio was computed by dividing the number
of patients by the number of nurses at every data point. Along Results
with numbers of patients and nurses, patient-to-nurse ratios
Linking Procedure
were plotted separately for each day’s 48 data points and for
each day of the week using each unit’s and each department’s The main activity data were drawn from 688,730 cases and 6834
mean with CIs. nurses in 152 units. After the exclusion of outpatient units and
noncare activities (whether direct or indirect), the activity data
Extreme Mismatch Between Supply and Demand reflected 153,456 cases (153,456/688,730, 22.2%) and 5736
Additionally, for three key time points of each day, namely at nurses (5736/6834, 83.9%) in 70 units (70/152, 46.1%). Of the
2 am, 10 am, and 6 pm, the unit-level median (IQR) remaining 5736 nurses, data from 4633 (80.8%) were usable
patient-to-nurse ratio was calculated for weekdays and weekends for the final analyses. A number of nurses (1270) were excluded
and divided by department. Further, we calculated when 50% for specific days only, as they had recorded no working time
more or less work was required per nurse for every data point data. Those exclusions correspond to 11,251 (1.5%) person-days.
and unit based on the median patient-to-nurse ratio. Two Another main reason for exclusion was that 1109 students and
variables were created: 227 external nurses did not have exact working hours. However,
the data from both groups were usable for our descriptive
extreme lower threshold = median - (median/2)
analyses. Numerous students and external nurses became RNs
extreme higher threshold = median + (median/2) over the 3 years of the study period. This largely explains why
These arbitrary cut-offs were set to illustrate extreme staffing the final number of nurses was higher than 5736. Regarding the
situations. Extreme staffing situations are important to identify number of cases, a total of 128,484 (124,484/153,456, 83.7%)
times where supply and demand do not match (eg, the demand cases were used. Two main factors explain this reduction:
is too high for the given supply or vice versa). This is an outpatients (19,442/153,456, 12.7%) and healthy newborn babies
indicator of whether supply and demand are staying within the (3779/153,456, 2.5%) from the Maternity & Gynecology
“normal” range throughout the year. For the 3-year study period, department. Further details of the linking procedure are shown
the percentages of data points falling far below or far above the in Figure 1. For patient-to-nurse ratios and patient turnover
thresholds were calculated. Medians (IQRs) and extreme higher analyses, we included 10 departments, including 70 inpatient
and lower thresholds (% of data points) were plotted with bar units in which 4633 nurses (>22 million data points) provided
charts to highlight variations in patient-to-nurse ratios. Graphics care to 128,484 cases (>35 million data points).
and calculations were computed separately for nurse groups 1
(RNs), 2 (LPNs), and 3 (others).
https://www.jmir.org/2020/4/e15554 J Med Internet Res 2020 | vol. 22 | iss. 4 | e15554 | p. 6
(page number not for citation purposes)
XSL• FO
RenderXJOURNAL OF MEDICAL INTERNET RESEARCH Musy et al
Figure 1. Process to link the two datasets and variables used for the analysis. Nn: number of nurses; Np: number of patients; PNR: patient-to-nurse
ratio; Na: number of admissions; Nd: number of discharges; Nti: number of transfers in; Nto: number of transfers out; RN: registered nurse; LPN:
licensed practical nurse.
36.5 years (SD 15.4 years) and median age of 33 years (IQR
Descriptive Overview 28-40 years), and in Pediatrics, who had mean and median ages
The number of patient cases in the included units in each of 3.8 years (SD 5 years) and 1 year (IQR 0-7 years),
department over the study period (2015-2017) ranged from 5007 respectively. The Hematology & Oncology, Internal Medicine,
for Hematology & Oncology to 28,377 for Cardiology & and Orthopedics & Plastic Surgery departments had the highest
Cardiovascular Surgery. In almost all departments, mean and median LOS, at 7 days (IQR 4-14 days), 6 days (IQR 3-10 days),
median patient ages were >54 years. The exceptions were and 5 days (IQR 3-9 days), respectively. Cardiology &
patients in Maternity & Gynecology, who had a mean age of
https://www.jmir.org/2020/4/e15554 J Med Internet Res 2020 | vol. 22 | iss. 4 | e15554 | p. 7
(page number not for citation purposes)
XSL• FO
RenderXJOURNAL OF MEDICAL INTERNET RESEARCH Musy et al
Cardiovascular Surgery and Intensive Care had the lowest Cardiology & Cardiovascular Surgery department
median LOS, at 2 days (IQR 1-7 days) and 2 days (IQR 2-3 (24,206/28,377, 85.3%); and traumatic injuries, poisonings, and
days), respectively. The most common diagnoses were tumors, other consequences of external causes, which were highest in
predominantly in the Hematology & Oncology department the Orthopedics & Surgery department (5213/10,489, 49.7%).
(4161/5007, 83.1%); circulatory system diseases, mainly in the Further details are provided in Table 2.
Table 2. Descriptive overview of each department classified by the overall number of patients for 2015-2017.
Department Number of Number of Age Age (years), LOSb, me- Patients/ Top 2 diagnoses, n/N (%)
patients units (years), median dian (IQR) day/unit, me-
mean (SD) (IQRa) dian (IQR)
First Second
Cardiology & Car- 28,377 12 67.3 70 2 10 Circulatory system Traumatic injuries,
diovascular Surgery (14.4) (59-78) (2-5) (7-12) diseases, poisonings, and oth-
24,206/28,377 er consequences of
(85.3) external causes,
1220/28,377 (4.3)
Neurology, Neuro- 27,916 10 58.5 61 4 13 Circulatory system Nervous system dis-
surgery, Otolaryngol- (18.5) (47-73) (3-6) (11-17) diseases, eases, 4327/27,916
ogy, Head & Neck 6421/27,916 (23) (15.5)
Surgery, & Ophthal-
mology
Intensive Care 21,359 8 61.6 64 2 8 Circulatory system Tumors,
(16.6) (52-74) (2-3) (7-10) diseases, 3503/21,359 (16.4)
8095/21,359 (37.9)
Pediatrics 19,543 10 3.8 1 3 11 Some conditions Respiratory system
(5) (0-7) (2-7) (8-14) whose origin is the diseases,
perinatal period, 3479/19,543 (17.8)
3987/19,543 (20.4)
Dermatology, Urolo- 16,381 7 59.6 62 4 12 Genitourinary sys- Tumors,
gy, Rheumatology, (17.3) (48-73) (3-7) (6-17) tem diseases, 3473/16,381 (21.2)
& Nephrology 5160/16,381 (31.5)
Visceral Surgery and 14,250 5 58.2 61 4 17 Digestive system Tumors,
Medicine, Gastroen- (17.1) (48-71) (3-7) (12-21) diseases, 4190/14,250 (29.4)
terology, Thoracic 5073/14,250 (35.6)
Surgery, & Pul-
monology
Internal Medicine 12,506 6 66 70 6 15 Circulatory system Infectious and para-
(18.3) (54-80) (3-10) (13-18) diseases, sitic diseases,
2389/12,506 (19.1) 1163/12,506 (9.3)
Maternity & Gyne- 11,894 3 36.5 33 4 18 Pregnancy, child- Tumors,
cology (15.4) (28-40) (3-5) (14-21) birth, and the puer- 1998/11,894 (16.8)
perium,
7172/11,894 (60.3)
Orthopedics & Plas- 10,489 5 52.9 54 5 14 Traumatic injuries, Diseases of the os-
tic Surgery (19.6) (37-68) (3-9) (12-16) poisoning, and teo-articular system,
some other conse- muscles and connec-
quences of external tive tissue,
causes, 3346/10,489 (31.9)
5213/10,489 (49.7)
Hematology & On- 5007 4 59.2 61 7 11 Tumors, Endocrine, nutrition-
cology (15.5) (51-70) (4-14) (7-18) 4161/5007 (83.1) al, and metabolic
diseases, 225/5007
(4.5)
a
IQR: interquartile range.
b
LOS: length of stay.
https://www.jmir.org/2020/4/e15554 J Med Internet Res 2020 | vol. 22 | iss. 4 | e15554 | p. 8
(page number not for citation purposes)
XSL• FO
RenderXJOURNAL OF MEDICAL INTERNET RESEARCH Musy et al
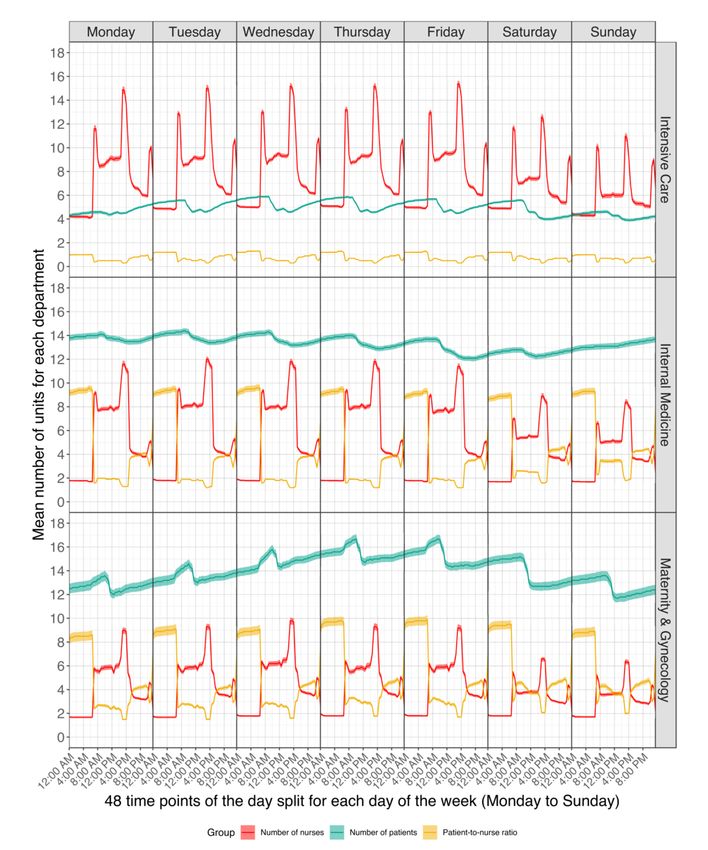
Number of Patients we show only the 3 plots that show the key characteristic
Numbers of patients and nurses and patient-to-nurse ratios were patterns: the RN group (group 1) for the Intensive Care,
plotted against the 48 data points per day for each day of the Maternity & Gynecology, and Internal Medicine departments
week, each of the 10 departments, and each of the 3 nurse (see Figure 2). All plots can be found in Multimedia Appendix
groups. Considering the large number of plots this generated, 1 (group 1, RNs), Multimedia Appendix 2 (group 2, LPNs), and
Multimedia Appendix 3 (group 3, others).
Figure 2. Plots of the number of patients, number of registered nurses, and patient-to-nurse ratio with the CIs.
On the demand side, a number of broad patterns emerged, but also through the week, as shown for the Maternity &
several of which occurred across departments. Demand Gynecology department, where patient numbers peaked on
fluctuated not only throughout the day, with various clear peaks, Thursday and Friday. Overall, patient numbers increased for 6
https://www.jmir.org/2020/4/e15554 J Med Internet Res 2020 | vol. 22 | iss. 4 | e15554 | p. 9
(page number not for citation purposes)
XSL• FO
RenderXJOURNAL OF MEDICAL INTERNET RESEARCH Musy et al
departments (6/10, 60%) from Monday to Thursday or Friday, working time were available for either students or external
and patient numbers peaked daily between 8:00 am and 10:00 nurses. For external nurses and students, the median daily
am, then either stabilized or decreased. On Friday mornings, number of nurses was 0, except in the Internal Medicine
patient numbers decreased in preparation for the weekend. The department, where there was a median of 1 student. The daily
exception was in the Internal Medicine department, where the number of external nurses ranged from 0 to 9 and of students
number of patients increased continuously from Friday evening from 0 to 12. For both, the maxima occurred only once, on a
until Monday morning (see Figure 2). Sunday, during the 3 years.
Number of Nurses Patient-to-nurse Ratio
From the care supply perspective, variation was far less Figure 2 shows the plots, and Figure 3 shows the median (IQR)
pronounced than on the demand side. Three main variations of the patient-to-RN ratio for 3 key time points on weekdays
were apparent. First, fewer nurses were present through the and weekends. For RNs, the ratio was highest at night and lowest
weekends and occasionally on Friday. Second, Sundays in the morning. During the night, the median ratio was 4-11
generally had fewer nurses than on Saturdays. Third, the patients per RN, except in the Intensive Care department, which
numbers of nurses were highest in the morning, then dropped had a ratio of 1.1 patients per RN. In the morning, the ratio
for the afternoon shift and again for the night shifts. These ranged from 0.6 (IQR 0.4-0.8) on weekdays to 0.8 (IQR 0.6-1)
patterns where quite stable throughout the week. In 6 (6/10, on weekends in the Intensive Care department and ranged from
60%) of the departments, gaps of 1 or 2 nurses were clearly 2.8 (IQR 2-3.5) on weekdays to 4 (IQR 3-5) on weekends in
discernible between 11:00 am and 1:00 pm. the Maternity & Gynecology department. For LPNs, the median
number was always 0 (IQR 0-0) at night, while the median
Except for 3 (30%) of the 10 departments with almost no staff
number in the morning ranged from 3 to 8. For nurse group 3
on the weekends, 1-2 LPNs were mainly present between 06:00
(ie, others), a median number of 0 (IQR 0-0) staff members was
am and 5:00 pm. The pattern for nurse group 3 (ie, others) was
generally present during the night shift. In the morning shifts,
similar to that of LPNs, although generally with roughly 1 more
7 departments’ (7/10, 70%) median patient-to-nurse ratios
care staff. All departments increased their staff by 1-3 nurses
increased for group 3 (ie, others) from weekdays (4.3 to 8) to
for all or several of the following times: 7:00 am to 8:00 am,
weekends (6 to 12). In the afternoon shifts, all medians
2:00 pm to 4:30 pm, and 10:00 pm to 12:00 am (see Figure 2).
decreased (see Multimedia Appendix 4).
As mentioned, apart from daily information, no records of
https://www.jmir.org/2020/4/e15554 J Med Internet Res 2020 | vol. 22 | iss. 4 | e15554 | p. 10
(page number not for citation purposes)
XSL• FO
RenderXJOURNAL OF MEDICAL INTERNET RESEARCH Musy et al
Figure 3. Median (interquartile range [IQR]) patient-to-registered nurse ratios for key time points, with the percentages of shifts with an extremely
high threshold (EHT) or an extremely low threshold (ELT). Three departments are displayed split by weekdays and weekends.
shifts with extreme staffing increased from morning to night
Extreme Mismatch Between Supply and Demand and from weekdays to weekends. For RNs, the lowest
Figure 3 shows not only the weekday and weekend medians percentages of extreme understaffing and overstaffing happened
(IQRs) of the patient-to-RN ratios for 3 key time points (namely on 2.5% and 0.1% of weekday and weekend mornings,
2 am, 10 am, and 6 pm) but also the threshold values and respectively. For both extremely high and extremely low
percentages of shifts with extreme supply-and-demand patient-to-nurse ratios, the highest incidence (around 30% of
mismatches. Complete results can be found in Multimedia shifts) occurred in the evening and weekend nights. These ratios
Appendix 4. For 7 departments (7/10, 70%), the percentages of occurred in the Cardiology & Cardiovascular Surgery (lower);
https://www.jmir.org/2020/4/e15554 J Med Internet Res 2020 | vol. 22 | iss. 4 | e15554 | p. 11
(page number not for citation purposes)
XSL• FO
RenderXJOURNAL OF MEDICAL INTERNET RESEARCH Musy et al
Dermatology, Urology, Rheumatology, & Nephrology (lower); Appendix 5. All departments showed reductions in patient
and Hematology & Oncology (higher) departments. The same turnover during the weekends. Entries (admissions and transfers
3 departments had the lowest incidence of shifts with “normal” in) and exits (discharges and transfers out) of patients occurred
staffing levels (below 55%) for weekend nights. On the other at very similar times for all departments: 09:00 am to 11:00 am
hand, more than 80% of all shifts in the Orthopedics & Plastic and 1:00 pm to 3:00 pm. The Intensive Care department had
Surgery department fell within “normal” staffing levels. For the highest percentage of transfers (peaking at almost 13% at
nurse groups 2 (LPNs) and 3 (others), the incidence of extreme 9:30 am). As shown in Figure 3, the numbers of extreme staffing
staffing ranged from very high (49.5%) to very low (1.5%) to mismatches also fluctuated as a result of the number of either
none (0%). Possibly because of these groups’ low nurse nurses or patients present. Figure 4 shows the variation in the
numbers, no clear patterns were apparent. patterns throughout the day that influenced the patient-to-nurse
ratio. For example, if on a given day a peak of discharges occurs
Patient Turnover at 10:00 am with no or few admissions or transfers in, the
Similar to the patient-to-nurse ratio, bar charts for patient patient-to-nurse ratio will decrease, potentially leading to
turnover are displayed for only the Intensive Care, Internal extreme overstaffing. The same is true for the inverse. A peak
Medicine, and Maternity & Gynecology departments (see Figure in admissions or transfers in can increase the patient-to-nurse
4). Bar charts for all 10 departments are displayed in Multimedia ratio, leading to extreme understaffing.
https://www.jmir.org/2020/4/e15554 J Med Internet Res 2020 | vol. 22 | iss. 4 | e15554 | p. 12
(page number not for citation purposes)
XSL• FO
RenderXJOURNAL OF MEDICAL INTERNET RESEARCH Musy et al
Figure 4. Percentages of patient turnover for the 48 data points by weekdays and weekends.
10 departments belonged to the Inselspital (Bern University
Discussion Hospital) and varied by purpose, size, number of units, and
Main Results patient population.
For the first time, we longitudinally analyzed demand for and From the demand side, continuous turnover meant patient
supply of care at 30-minute intervals for 24 hours a day over a numbers fluctuated across each day and varied across units.
period of 3 years in a large university hospital. Data from the Less variation was seen in the supply side, where the change in
nurse staffing system (tacs) and medical discharge records were the number of nurses occurred mainly for each shift (night,
used to explore patient-to-nurse ratios and patient turnover. The morning, evening). RNs accounted for roughly three-quarters
of the nurse workforce, making them the largest staff subgroup
https://www.jmir.org/2020/4/e15554 J Med Internet Res 2020 | vol. 22 | iss. 4 | e15554 | p. 13
(page number not for citation purposes)
XSL• FO
RenderXJOURNAL OF MEDICAL INTERNET RESEARCH Musy et al
involved with patient care. The remaining quarter was comprised This observation underscores the potential volatility of nurse
of others (including unlicensed personnel and administrative workload, even over a single shift, and the need for longitudinal
staff) and LPNs. These smaller groups were mainly present approaches to staffing research to help identify and counteract
during day shifts on weekdays. this volatility [45]. The distribution of extreme shifts also
indicated that individual departments (eg, the Orthopedics &
Simultaneous longitudinal data on patient and nurse numbers
Surgery department, with more than 80% of units and shifts
allowed us to determine which had the greater influence on
staffed within the “normal” range) can maintain their
patient-to-nurse ratios (ie, the effects the variations in the
patient-to-nurse ratio quite effectively. Identifying the most
numbers of nurses and patients had on nurse workload). Most
meaningful thresholds to define extreme staffing will require
published studies have shown that during weekends,
further research.
patient-to-nurse ratios tend to increase [6,7]. We confirmed this
observation, not only because the nursing staff was reduced As illustrated in Figure 4, while patient turnover was continuous,
over weekends but also because in many departments (eg, it was concentrated at various times throughout the day.
Internal Medicine), patient numbers tended to increase on Consistent with previous findings, entries and exits were both
Saturday and Sunday. In fact, we found that the supply side rare during the night [46,47]. Moving patients to the units where
remained quite constant; it was mainly the demand side that they can receive the most appropriate care is essential for their
drove patient-to-nurse ratios. recovery. Also, as demand is independent of available resources,
patient turnover occurs when units are short on either staff or
The ramifications of a demand-driven workload are particularly
beds. For the former, the unit is closed, and the patient is moved
clear regarding weekend staff planning. Reducing staffing for
to a similar unit; for the latter, the patient is placed in an
reduced weekend demand might be justified on Friday nights,
intermediate unit until a bed becomes available [48]. However,
as a surge in discharges Thursday and Friday decreases patient
both cases lead to increased administrative work, and even
numbers. However, patient numbers increased in several
where beds are available and staff sufficient, transfers,
departments over the weekends, as patient entries outnumbered
admissions, and discharges all entail higher volumes of
exits.
administrative requirements and patient care needs. Therefore,
To set the reported patient-to-nurse ratios in context, the our analyses confirmed that patient turnover is one factor for
European cross-sectional study RN4CAST, which was nursing workload [5,47,49].
conducted in 2009-2011 with 35 Swiss acute care hospitals,
The impact of turnover can be greater when entries and exits
reported an average of 7.9 patients per nurse in medical and
occur at the same time, as illustrated in the first row of Figure
surgical units [37,38]. However, the reported ratios were
4 for the Intensive Care department. Between 1.6% and 32.3%
aggregated at the hospital level, ignoring the ratios per shift. In
of nursing time is spent on patient turnover-related activities
2015, the Swiss cross-sectional MatchRN study followed up the [50,51]. Associations between patient turnover and nursing care
same hospitals that participated in RN4CAST [39]. The overall quality have been documented, where higher turnover led to
average patient-to-nurse ratio of the 23 participating hospitals higher nursing workload, possibly compromising nursing care
was 7.8, and the shift averages were 5.9 for the morning shift, quality [13,38,52]. High patient turnover is associated with more
7.3 for the evening shift, and 14.2 for the night shift [40,41]. adverse events, including mortality [53], nosocomial infections
Both cross-sectional studies surveyed only RNs. From our study, [54], and medication errors [52] as well as more readmissions
the median patient-to-nurse ratio for RNs was 2-3 for the [55,56]. The current approach is somewhat unrealistic. Where
morning shift, 3-5 for the evening shift, and 4-10 for the night each patient case or event is rooted in a unique context, much
shift, excluding the Pediatrics, Maternity & Gynecology, and of the current literature treats all patient turnover and patients
Intensive Care departments. The ratios are difficult to compare as the same [47,57]. In contrast, Tierney et al [58] used weighted
with the overall averages from the RN4CAST and MatchRN patient acuity and patient turnover variables to account for
studies. At the shift level, our patient-to-nurse ratios were lower intercase variation. Studies also showed that death was a more
than the MatchRN ratios, suggesting an above-average staffed likely outcome in contexts featuring high patient-to-nurse ratios
hospital. High patient-to-nurse ratios have been associated with and patient turnover [13,59,60].
worse patient outcomes; however, due to conflicting results,
Potential Implications
the relationship remains unclear [42,43]. One main reason for
the lack of conclusive evidence is researchers’ tendency to seek Because of the granularity of the analysis, patient-to-nurse ratios
associations between mean patient-to-nurse ratios and patient were analyzed with patient turnover, as even in cases where the
outcomes [44]. However, this means obscuring sharp changes patient-to-nurse ratio might appear normal, both patient entries
in supply and demand, thereby concealing periods when staffing and exits increase nurse workload. During periods of high
levels are low. As no consensus exists concerning the definition turnover, the time available for patient care can be severely
of an extreme staffing situation, we chose arbitrary cut-offs of reduced. Hospitals or departments that fail to account for this
double or half of the median work per nurse to define extremely additional burden commonly operate with suboptimal nursing
high or low patient-to-nurse ratios, respectively. These cut-offs staff levels [51-53].
showed that our extreme thresholds were commonly crossed Previous research has suggested a relationship between higher
during certain shifts and in certain departments. patient-to-nurse ratios and worse patient outcomes [61-66].
Mandatory minimum patient-to-nurse ratios are often suggested
as an approach to ensure safe staffing levels. As the nursing
https://www.jmir.org/2020/4/e15554 J Med Internet Res 2020 | vol. 22 | iss. 4 | e15554 | p. 14
(page number not for citation purposes)
XSL• FO
RenderXJOURNAL OF MEDICAL INTERNET RESEARCH Musy et al
supply is quite constant at the level of individual shifts, the people also performed tasks not associated with patient care,
question may arise as to whether that supply can realistically such as organizational tasks or teaching. Patient-to-nurse ratios
be changed in response to midshift fluctuations in demand. The were calculated for all persons present in each unit studied.
patient turnover variability illustrated in this study showed that Although we measured variation in nurses’ workload with a
where entries matched exits, patient numbers remained high level of granularity, the significance of the short peaks in
reasonably constant and where imbalances occurred between demand relative to the supply over short periods is hard to judge
entries and exits, patient numbers fluctuated. because nurses’ work involves multitasking and they can
prioritize urgent tasks and delay others without necessarily
However, neither of these cases adequately reflects nurse
harming patients [69]. Minutes of care were also available from
workload. In the first, even while a balanced turnover resulted
the data; however, due to data quality concerns regarding the
in a constant patient-to-nurse ratio, if both sides increased, the
time allocated to each patient, these data were excluded, and
additional work required for each incoming and outgoing case
metadata were included in their place. This may have solved
would represent a considerable burden. In the second, records
the patient care time data limitation by providing the exact time
of patient numbers alone give no indication as to whether the
invested for each patient during working hours.
supply of nurses was adjusted accordingly. These two examples
illustrate the necessity of considering both supply and demand Further, the results were limited by the absence of accurate
data for staffing purposes. working time data for external nurses and students. Even if these
groups had a daily median presence of 0, their assistance might
Certain patterns were clearly associated with routines that
have been crucial when they were present, as for night shift
applied to specific days and times of the week. Defining and
support. This type of task shifting between individuals and
clarifying those periods for each unit would help improve
departments to compensate for staffing shortfalls is a key tool
assessment of staffing levels. Given that some hospital
to handle demand and avoid gaps in supply but was not recorded
departments do not operate on the weekends, further detailed
in the available data.
analysis of weekend work for nurses is needed to determine
how the workload increases. Current research on hospital Our study looked only at nurses, but the hospital environment
staffing is predominantly based on cross-sectional data, which is multidisciplinary. All health care providers play an important
cannot show fluctuations in patient turnover [67]. Lacking role, and their collaboration is crucial for patients [70]. For
longitudinal data, it is extremely difficult to match the rather example, studies showed a positive impact on patients’ outcomes
constant nurse supply to the varying patterns in patient demand. by incorporating or improving nurse-physician or
pharmacist-physician collaborative practices [71-73].
To our knowledge, only one previous study examined the
longitudinal associations between nurse staffing and patient Finally, the study was undertaken in a single hospital, and we
turnover. Its findings indicated large variations in patient explored many sources of variation, but not patient acuity and
turnover [68]. As the demand side is quite volatile, to anticipate severity. Nursing workload depends on not only the amount of
when the nurse supply should be changed to match changes in direct and indirect care, patient turnover, and patient-to-nurse
workload, it is important to identify the times of day, days of ratio but also patient acuity and severity [74,75]. Further
the week, and even months during which specific entry and exit investigation is thus needed.
patterns occur. Armed with this information, staffing levels
might differ across not only units and hospitals but also
Conclusions
countries. Thus, unit-level analysis offers the best chance to To our knowledge, this is the first detailed study to use data on
detect patterns of supply and demand. Identifying the complex patient-to-nurse ratios and patient turnover in time increments
relationships involved and then building more efficient as low as 30 minutes. The goal was to illustrate fluctuations in
predictive models that capture all meaningful variations will these two variables between and within departments and days
require further studies examining longitudinal nurse and patient of the week. The choice of 30 minutes was subjective and based
data. on available computational resources. While the literature
includes references to the fluctuations we observed, no study
Limitations to date has illustrated those fluctuations in such fine detail. The
Certain limitations were encountered during our analyses. One key driver for care was clearly patient demand, which showed
of these concerned the tacs nurse staffing system, as this was high variability even during individual shifts. This volatility
the first time that routine data were used for research and linking challenges health care suppliers to provide safe and reliable care
purposes. During the process, we found that a small minority when demand is high while avoiding overstaffing when it is
of nurses (~ 1%) were not using the system consistently. Also, low. Detecting patterns of variation will help optimize staffing.
due to issues with merging data, a number of nurses and patients This descriptive analysis was a first step towards detecting fluid
were excluded from the analysis. To maximize the data quality variables to be considered in developing a predictive model on
for this and future studies, these issues were discussed with the which to base health care staff planning, possibly including the
nurse staffing system software developers. introduction of innovative working/shift schemes in this
sensitive sector.
Also, while we selected persons providing direct or indirect
care for the analysis, it was impossible to know whether those
https://www.jmir.org/2020/4/e15554 J Med Internet Res 2020 | vol. 22 | iss. 4 | e15554 | p. 15
(page number not for citation purposes)
XSL• FO
RenderXJOURNAL OF MEDICAL INTERNET RESEARCH Musy et al
Acknowledgments
MS and SNM developed the idea for the study. MS, ABL, PG, and CTN contributed to the concept, design, and supervision of
the project. SNM conducted the analysis and contributed to the drafting of the manuscript. All authors contributed to the
interpretation of the data and the critical revision of the manuscript. All authors approved the final version.
We would like to thank Barbara Ammann, Wilco Laan, and Elias Panizza from Wigasoft for helping us to understand the nurse
staffing system and for delivering the additional variables necessary to conduct the analysis. Additionally, we would also like to
thank Chris Shultis for professional editing of the manuscript.
Conflicts of Interest
None declared.
Multimedia Appendix 1
Number of patients and nurses with patient-to-nurse ratios plotted (with confidence intervals) for RN group. The x-axis shows
the 48 time points of the day split for each day of the week (Monday to Sunday); the y-axis represents the mean number of units
for each of the ten departments.
[PDF File (Adobe PDF File), 179 KB-Multimedia Appendix 1]
Multimedia Appendix 2
Number of patients and nurses with patient-to-nurse ratios plotted (with confidence intervals) for LPN group. The x-axis shows
the 48 time points of the day split for each day of the week (Monday to Sunday); the y-axis represents the mean number of units
for each of the ten departments.
[PDF File (Adobe PDF File), 173 KB-Multimedia Appendix 2]
Multimedia Appendix 3
Number of patients and nurses, with patient-to-nurse ratios plotted (with confidence intervals) for Others group. The x-axis shows
the 48 time points of the day split for each day of the week (Monday to Sunday); the y-axis represents the mean number of units
for each of the ten departments.
[PDF File (Adobe PDF File), 175 KB-Multimedia Appendix 3]
Multimedia Appendix 4
Median of patient−to−nurse ratio for key time points, split by weekdays/weekends for each group of nurses, together with
percentages of shifts with extreme patient−to−nurse ratios.
[PDF File (Adobe PDF File), 54 KB-Multimedia Appendix 4]
Multimedia Appendix 5
Patient turnover in percentages for the 48 data points, split for weekdays and weekends.
[PDF File (Adobe PDF File), 65 KB-Multimedia Appendix 5]
References
1. Aiken LH, Clarke SP, Sloane DM, Sochalski J, Silber JH. Hospital nurse staffing and patient mortality, nurse burnout, and
job dissatisfaction. JAMA 2002;288(16):1987-1993. [doi: 10.1001/jama.288.16.1987] [Medline: 12387650]
2. Mark BA, Hughes LC, Belyea M, Chang Y, Hofmann D, Jones CB, et al. Does safety climate moderate the influence of
staffing adequacy and work conditions on nurse injuries? J Safety Res 2007;38(4):431-446 [FREE Full text] [doi:
10.1016/j.jsr.2007.04.004] [Medline: 17884430]
3. Manojlovich M, Sidani S, Covell CL, Antonakos CL. Nurse dose: linking staffing variables to adverse patient outcomes.
Nurs Res 2011;60(4):214-220. [doi: 10.1097/NNR.0b013e31822228dc] [Medline: 21691239]
4. Fasoli DR, Haddock KS. Results of an integrative review of patient classification systems. Annu Rev Nurs Res
2010;28:295-316. [doi: 10.1891/0739-6686.28.295] [Medline: 21639031]
5. Swiger PA, Vance DE, Patrician PA. Nursing workload in the acute-care setting: A concept analysis of nursing workload.
Nurs Outlook 2016;64(3):244-254. [doi: 10.1016/j.outlook.2016.01.003] [Medline: 26944266]
6. Palese A, Petean M, Cerne D. Unexpected deaths in medical wards during night shifts: a narrative analysis of nursing
experiences. J Clin Nurs 2014 Sep;23(17-18):2599-2608. [doi: 10.1111/jocn.12477] [Medline: 24354422]
https://www.jmir.org/2020/4/e15554 J Med Internet Res 2020 | vol. 22 | iss. 4 | e15554 | p. 16
(page number not for citation purposes)
XSL• FO
RenderXJOURNAL OF MEDICAL INTERNET RESEARCH Musy et al
7. Patrician PA, Loan L, McCarthy M, Fridman M, Donaldson N, Bingham M, et al. The association of shift-level nurse
staffing with adverse patient events. J Nurs Adm 2011 Feb;41(2):64-70. [doi: 10.1097/NNA.0b013e31820594bf] [Medline:
21266884]
8. Aspden P, Wolcott J, Bootman J, Cronenwett L. Preventing medication errors: quality chasm series. In: Committee on
Identifying and Preventing Medication Errors. Washington (DC): The National Academies Press; 2007.
9. Blay N, Duffield CM, Gallagher R. Patient transfers in Australia: implications for nursing workload and patient outcomes.
J Nurs Manag 2012 Apr;20(3):302-310. [doi: 10.1111/j.1365-2834.2011.01279.x] [Medline: 22519607]
10. Blay N, Roche MA, Duffield C, Gallagher R. Intrahospital transfers and the impact on nursing workload. J Clin Nurs 2017
Dec;26(23-24):4822-4829. [doi: 10.1111/jocn.13838] [Medline: 28382638]
11. Duffield C, Diers D, Aisbett C, Roche M. Churn: patient turnover and case mix. Nurs Econ 2009;27(3):185-191. [Medline:
19558079]
12. McGillis Hall L, Kiesners D. A narrative approach to understanding the nursing work environment in Canada. Soc Sci Med
2005 Dec;61(12):2482-2491. [doi: 10.1016/j.socscimed.2005.05.002] [Medline: 15964672]
13. Needleman J, Buerhaus P, Pankratz VS, Leibson CL, Stevens SR, Harris M. Nurse staffing and inpatient hospital mortality.
N Engl J Med 2011 Mar 17;364(11):1037-1045. [doi: 10.1056/NEJMsa1001025] [Medline: 21410372]
14. Griffiths P, Maruotti A, Recio Saucedo A, Redfern OC, Ball JE, Briggs J, Missed Care Study Group. Nurse staffing, nursing
assistants and hospital mortality: retrospective longitudinal cohort study. BMJ Qual Saf 2019 Aug;28(8):609-617 [FREE
Full text] [doi: 10.1136/bmjqs-2018-008043] [Medline: 30514780]
15. Huber E, Kleinknecht-Dolf M, Müller M, Kugler C, Spirig R. Mixed-method research protocol: defining and operationalizing
patient-related complexity of nursing care in acute care hospitals. J Adv Nurs 2017 Jun;73(6):1491-1501. [doi:
10.1111/jan.13218] [Medline: 27878843]
16. Welton JM. Measuring Patient Acuity: Implications for Nurse Staffing and Assignment. J Nurs Adm 2017 Oct;47(10):471.
[doi: 10.1097/NNA.0000000000000516] [Medline: 28957863]
17. Halm M, Peterson M, Kandels M, Sabo J, Blalock M, Braden R, et al. Hospital nurse staffing and patient mortality, emotional
exhaustion, and job dissatisfaction. Clin Nurse Spec 2005;19(5):241-51; quiz 252. [doi: 10.1097/00002800-200509000-00007]
[Medline: 16179855]
18. Titler M, Dochterman J, Xie X, Kanak M, Fei Q, Picone DM, et al. Nursing interventions and other factors associated with
discharge disposition in older patients after hip fractures. Nurs Res 2006;55(4):231-242. [doi:
10.1097/00006199-200607000-00003] [Medline: 16849975]
19. Weiss ME, Piacentine LB, Lokken L, Ancona J, Archer J, Gresser S, et al. Perceived readiness for hospital discharge in
adult medical-surgical patients. Clin Nurse Spec 2007;21(1):31-42. [doi: 10.1097/00002800-200701000-00008] [Medline:
17213738]
20. Hripcsak G, Friedman C, Alderson PO, DuMouchel W, Johnson SB, Clayton PD. Unlocking clinical data from narrative
reports: a study of natural language processing. Ann Intern Med 1995 May 01;122(9):681-688. [doi:
10.7326/0003-4819-122-9-199505010-00007] [Medline: 7702231]
21. Diya L, Van den Heede K, Sermeus W, Lesaffre E. The relationship between in-hospital mortality, readmission into the
intensive care nursing unit and/or operating theatre and nurse staffing levels. J Adv Nurs 2012 May;68(5):1073-1081. [doi:
10.1111/j.1365-2648.2011.05812.x] [Medline: 21883408]
22. Griffiths P, Ball J, Drennan J, Dall'Ora C, Jones J, Maruotti A, et al. Nurse staffing and patient outcomes: Strengths and
limitations of the evidence to inform policy and practice. A review and discussion paper based on evidence reviewed for
the National Institute for Health and Care Excellence Safe Staffing guideline development. Int J Nurs Stud 2016
Nov;63:213-225. [doi: 10.1016/j.ijnurstu.2016.03.012] [Medline: 27130150]
23. Welton JM. Nurse staffing and patient outcomes: Are we asking the right research question? Int J Nurs Stud 2016
Nov;63:A1-A2. [doi: 10.1016/j.ijnurstu.2016.08.015] [Medline: 27599693]
24. Clarke S, Donaldson N. Nurse staffing and patient care quality and safety. In: Hughes RG, editor. Patient safety and quality:
An evidence-based handbook for nurses. Rockville (MD): Patient Safety and Quality: An Evidence-Based Handbook for
Nurses; 2008.
25. Yakusheva O, Lindrooth R, Weiss M. Economic evaluation of the 80% baccalaureate nurse workforce recommendation:
a patient-level analysis. Med Care 2014 Oct;52(10):864-869. [doi: 10.1097/MLR.0000000000000189] [Medline: 25215646]
26. Insel Gruppe AG. Leistung: Unsere Spitäler stehen allen offen 2018 URL: https://jahresbericht.inselgruppe.ch/#leistung;
[accessed 2019-05-09]
27. R Core T. Development. 2013. R: A language and Environment for Statistical Computing URL: https://www.r-project.org/
[accessed 2020-02-20]
28. Henry L, Wickham H. R package version 0.2. 2018. purrr: Functional Programming Tools URL: https://cran.r-project.org/
web/packages/purrr/ [accessed 2020-02-21]
29. Wickham H, François R, Henry L, Müller K. R package version 0.7.6. 2018. dplyr: A Grammar of Data Manipulation URL:
https://cran.r-project.org/web/packages/dplyr/ [accessed 2020-02-21]
30. Wickham H. RDocumentation. 2019. tidyr v0.8.3: Easily Tidy Data with 'spread()' and 'gather()' Functions URL: https:/
/www.rdocumentation.org/packages/tidyr/versions/0.8.3 [accessed 2020-02-23]
https://www.jmir.org/2020/4/e15554 J Med Internet Res 2020 | vol. 22 | iss. 4 | e15554 | p. 17
(page number not for citation purposes)
XSL• FO
RenderXYou can also read