Airbnb Offer in Spain-Spatial Analysis of the Pattern and Determinants of Its Distribution - MDPI
←
→
Page content transcription
If your browser does not render page correctly, please read the page content below
Article

Airbnb Offer in Spain—Spatial Analysis of the
Pattern and Determinants of Its Distribution
Czesław Adamiak 1,2,*, Barbara Szyda 3, Anna Dubownik 4 and David García-Álvarez 5
 1 Department of Spatial Planning and Tourism, Faculty of Earth Sciences, Nicolaus Copernicus University,
   87-100 Toruń, Poland; czeslaw.adamiak@umk.pl
 2 Department of Geography, Faculty of Social Sciences, Umeå University, 901 87 Umeå, Sweden

 3 Department of Spatial Planning and Tourism, Faculty of Earth Sciences, Nicolaus Copernicus University,

   87-100 Toruń, Poland; bszyda@umk.pl
 4 Department of Spatial Planning and Tourism, Faculty of Earth Sciences, Nicolaus Copernicus University,

   87-100 Toruń, Poland; a_dubownik@umk.pl
 5 Departamento de Análisis Geográfico Regional y Geografía Física, Facultad de Filosofía y Letras,

   University of Granada, 18072 Granada, Spain; dagaral@ugr.es
 * Correspondence: czeslaw.adamiak@umk.pl; Tel.: +48-56-611-2571

 Received: 28 February 2019; Accepted: 15 March 2019; Published: 22 March 2019

 Abstract: The rising number of homes and apartments rented out through Airbnb and similar peer-
 to-peer accommodation platforms cause concerns about the impact of such activity on the tourism
 sector and property market. To date, spatial analysis on peer-to-peer rental activity has been usually
 limited in scope to individual large cities. In this study, we take into account the whole territory of
 Spain, with special attention given to cities and regions with high tourist activity. We use a dataset
 of about 250 thousand Airbnb listings in Spain obtained from the Airbnb webpage, aggregate the
 numbers of these offers in 8124 municipalities and 79 tourist areas/sites, measure their
 concentration, spatial autocorrelation, and develop regression models to find the determinants of
 Airbnb rentals’ distribution. We conclude that apart from largest cities, Airbnb is active in holiday
 destinations of Spain, where it often serves as an intermediary for the rental of second or investment
 homes and apartments. The location of Airbnb listings is mostly determined by the supply of empty
 or secondary dwellings, distribution of traditional tourism accommodation, coastal location, and
 the level of internationalization of tourism demand.

 Keywords: peer-to-peer accommodation; sharing economy; collaborative economy; Airbnb;
 residential tourism; second homes; Spain

1. Introduction
      Internet platforms enabling short-term rental of private houses or rooms, called peer-to-peer
(P2P) accommodation or homesharing platforms, are an increasingly popular provider of tourist
accommodation. The largest of such platforms is Airbnb, with over 5 million rental offers worldwide
[1]. After 10 years of its existence, Airbnb has become an important subject of research within tourism
and urban studies, as well as within other fields of social sciences. Review papers [2–4] and edited
books [5,6] outline some of the research topics undertaken in these studies. These include competition
between peer-to-peer rentals and traditional hospitality industry [7–11], general contribution to
destinations’ economies [12–14], social impacts [15–18], with special attention given to the impact on
housing markets [19–23], policy and regulations on P2P rental platforms [24–27], costumer
satisfaction of the service provided [28–30] and the impact of these new practices on travel patterns
[31].

ISPRS Int. J. Geo-Inf. 2019, 8, 155; doi:10.3390/ijgi8030155                       www.mdpi.com/journal/ijgi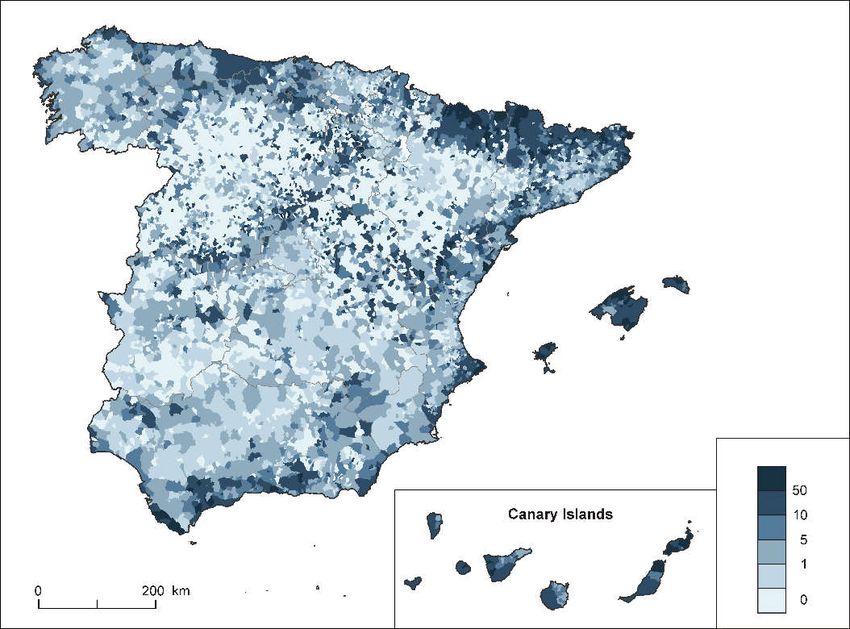
ISPRS Int. J. Geo-Inf. 2019, 8, 155                                                                  2 of 26

      An interesting body of research focuses on the spatial analysis of the available offer [32–35]. It
allows for a geographical understanding of the phenomenon by providing insight about where it is
located and which are the factors that affect its distribution. This knowledge can help to answer the
big research questions that have been posed regarding urban vacation rentals and Airbnb: are P2P
platforms a competition to the traditional hotel sector or do they complement its offer? Are urban
vacation rentals commercialised through P2P platforms contributing to the touristification of city
centres? Is it a phenomenon only affecting tourist cities?
      To date, the majority of the studies analysing the distribution of Airbnb listings have focused on
large cities [23,32–38]. Although the platform itself claims to contribute to the spreading of tourist
activity towards peripheral districts, previously not so much visited by tourists [39], most of the
studies to date agree when stating the concentration of Airbnb listings around major tourist
attractions [32–34,40]. This contributes to further agglomeration of tourism mobility and the potential
displacement of residents from central districts [22,23,41].
      Quattrone et al. [34] prove the correlation between the number of Airbnb listings and the
distance to the city centre in London. They also noticed a relation between the distribution of Airbnb
listings and the socioeconomic profile of the neighbourhoods. According to their conclusions, the
distribution follows a different pattern according to the type of listings considered: room or house.
Airbnb rooms are located in areas populated by highly-educated non-UK born residents, whereas
Airbnb houses are located in areas of high housing prices. High spatial concentration of Airbnb
listings around city centres and major tourist attractions is confirmed by Gutiérrez et al. for Barcelona
[33], Heo et al. for Paris [9] and by Wegmann’s and Jiao’s [27] for five US cities. Other papers support
the idea of the complementary role played by peer-to-peer accommodation with respect to hotel
supply. Gyódi [37] shows that Airbnb listings are concentrated in different areas to hotels in central
districts of Warsaw. In the case of Vienna, Gunter and Önder’s [36] claim that Airbnb rentals
complement hotel supply by providing larger, cheap and centrally located accommodation.
      Only few studies to date extended the spatial analysis of Airbnb phenomenon outside of the
limits of individual cities. There are few comparative studies between cities of Europe [42,43], USA
[44], and global capitals [45]. Cesarani and Nechita [46] provide the description of the distribution of
Airbnb listings in Italy, pointing at their concentration in the largest cities, coastal areas, around lakes
in the north of the country and in rural Tuscany. Strommen-Bakhtiar and Vinogradov [47], and
Larpin et al. [48] show how Airbnb has spread from major cities towards tourist regions in Norway
and Switzerland. Studies that have looked at the role of P2P accommodation in middle-sized and
small towns are also scarce. Di Natale et al. [24] examined Airbnb offer of 237 small cities in Oregon,
showing how the intensity of Airbnb activity and perceptions of its impacts differ between cities.
Adamiak [42] analysed the numbers and structures of Airbnb listings in European cities over 100,000
inhabitants. This study shows the ubiquity of Airbnb activity, its varied role in the structure of
tourism accommodation, and country-specific characteristics of the structures of offers. In addition,
it points at the important role that Airbnb plays in smaller cities, particularly in Southern Europe,
emphasizing the need for further studies of the impacts of Airbnb activity in these locations.
      Together with France and Italy, Spain is one of the most important Airbnb markets in Europe
[49]. In addition, Spain is the second largest international tourist destination [50], with a steady
increase in the number of foreign visitors in the last years [32,51]. P2P accommodation is an important
topic of both academic debate and media discourse in this country [32,33,51–53]. Most attention has
been given to the impacts of peer-to-peer rental platforms on major cities, mostly Barcelona [32,33,54].
Airbnb activity is blamed to cause gentrification of the city centre through the “collective
displacement”, that is the substitution of residential life by tourism [41,55,56]. Segú [57] estimated
that Airbnb has contributed to a 4% increase in housing rents in the city between 2009 and 2016.
However, Blanco-Romero et al. [15] show that tourism rentals are just one of many factors causing
the increase in housing prices.
      Similar conclusions about the impacts of Airbnb on urban space have been presented in cases of
other Spanish cities: Madrid [16,58], Palma de Mallorca [22,59] and Valencia [60]. Spatial analyses of
the Airbnb offer have been conducted for Barcelona [33], Málaga [61], Madrid [58], Valencia [60,62]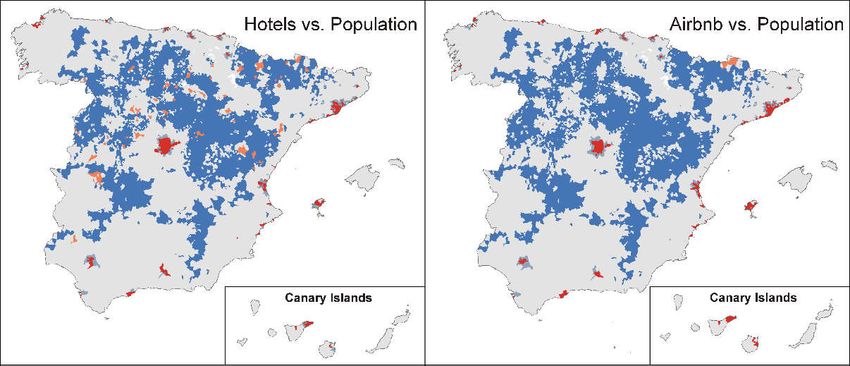
ISPRS Int. J. Geo-Inf. 2019, 8, 155                                                                3 of 26

and in the form of comparative studies including various cities [32,63]. They all agree on the
concentration of the Airbnb offers in the city centres and close to the tourist hotspots.
     Studies analysing the Airbnb offer in areas other than big cities are rare in Spain, just as in other
countries. Coll Ramis et al. [64] studied the Airbnb offer of a small inland municipality of Mallorca
(Lloret de Vistalegre), showing the increase in available tourist accommodation since the appearance
of peer-to-peer online platforms. The study of Yrigoy [65] describes the growth of tourist
accommodation offer on the island of Menorca. It notices a high concentration of Airbnb listings in
urban centres, which contrasts with the concentration of traditional tourist rental houses in tourist
residential areas. Both studies prove that P2P platforms play an important role in the
commercialization of rental apartments in tourist areas. Eugeno-Martin et al. explore the spatial
distribution of Airbnb listings in Canary Islands [66]. They found differences between various kinds
of tourist areas: sun and beach, nature-based and urban.
     In Spanish coastal areas, second homes form an important part of tourism accommodation.
Spain is the country with the highest number of second homes in Europe [67]. They are used for
private purposes by the owners, but they are also rented out to other tourists using P2P platforms. In
this regard, Miranda et al. [68] consider peer-to-peer platforms to be able to offset the negative
impacts of residential tourism in these areas: increase the occupancy of dwellings, reduce seasonality
and dependence of local economies on construction sector. Outside of Spanish major cities and
coastal areas, rural tourism has been growing steadily in the last decades and it is now an important
source of income for rural communities [69]. Rural tourism is mainly based on the rental of rural
houses for vacation use, which can also be mediated through new P2P platforms as Airbnb [70].
     In this paper, we aim to fill the research gaps identified above by providing a spatial analysis of
Airbnb listings for entire Spain. We chose this country because of high importance of tourism for its
economy, and a vivid academic and popular discussion on the impacts of P2P platforms. The analysis
of the entire territory of the country is particularly interesting due to the heterogeneity of models of
tourism developed in different parts of Spain, and possible variety of impacts of P2P accommodation
on different types of tourist areas.
     Our empirical analysis consists of two stages. First, we make a comprehensive description of the
spatiality of Airbnb supply in Spain. We present the distribution of Airbnb listings in autumn 2018
in the whole country, considering three different types of listings: entire homes/apartments, private
rooms and shared rooms. We then compare the distribution of P2P accommodation offer and the
hotel supply, as well as measure the spatial concentration and spatial autocorrelation of the density
of Airbnb listings in comparison to hotel and housing supply.
     In the second stage, we attempt to find the determinants shaping the territorial distribution of
Airbnb supply of various kinds employing regression analysis. To this end, we formulate five
hypotheses about the possible factors influencing the distribution of Airbnb offers:
1.    The location of Airbnb rentals is determined by the number of homes and flats, both used as
      primary dwellings and nonprimary dwellings, including second homes and vacant homes and
      flats. In primary dwellings, residents can rent out parts of their home through Airbnb.
      Nonprimary dwellings can be rented out as entire properties. The higher the number of primary
      and nonprimary dwellings, the higher the potential number of houses and rooms to rent.
      Accordingly, we assume a higher concentration of Airbnb accommodation in larger cities, as
      they have more primary dwellings, and are usually important tourism destinations at the same
      time [71].
2.    Airbnb offer is located in places close to the coastline, which are (apart from major cities)
      principal leisure tourism destinations in Spain [72]. They also have large stocks of second homes
      and vacation rentals [73,74].
3.    Airbnb offer concentrates in areas attractive to tourists and with already established tourism
      sector. Therefore, there is a correlation between Airbnb supply and hotel accommodation
      supply, as proved by other international studies [42].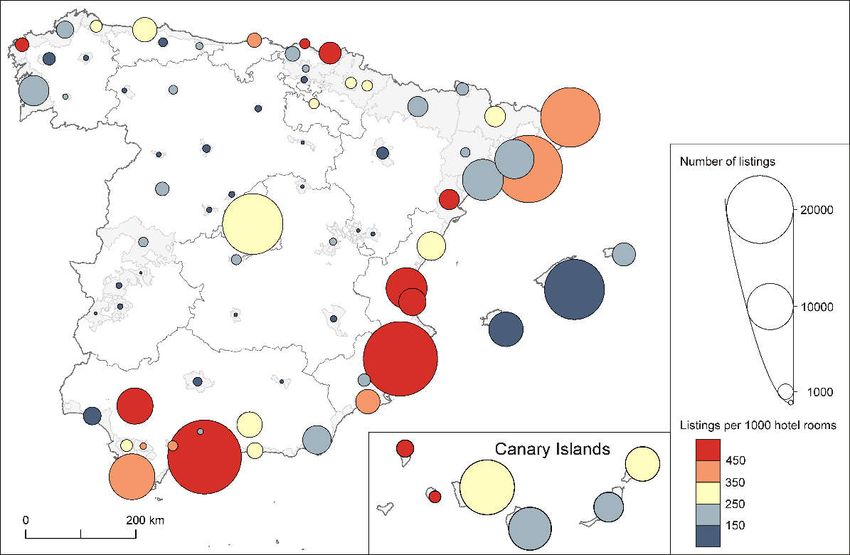
ISPRS Int. J. Geo-Inf. 2019, 8, 155                                                                 4 of 26

4.    Airbnb serves as an additional supply of accommodation in places where the existing
      accommodation capacity does not satisfy the demand due to high growth in tourism arrivals or
      high seasonal variations [42,75].
5.    Airbnb is particularly attractive for international tourists, as it provides a familiar system of
      search and transaction that mitigates the risk of the deal and rates the quality of the product [76].
      Accordingly, Airbnb offer is bigger in areas with a high number of international tourists, or areas
      easily accessible for them because of proximity to airports.
     The remaining part of the paper is structured as follows: in Section 2, we present data and
methods that we used in the analysis. Detailed description of the procedure of collecting data about
Airbnb listings is moved to an appendix. In the next section, we present the results of the analysis:
the distribution of Airbnb listings, measures of concentration and spatial autocorrelation, and models
explaining their location. Detailed statistics for tourist areas/sites, and supplementary tables
describing regression models are placed in appendices. The last part of the paper presents
conclusions and discussion of the results.

2. Materials and Methods

2.1. Data
      Homesharing platforms, including Airbnb, do not provide public data on numbers and
performance of their rentals. However, such information can be obtained from their webpages
through web scrapping. For our analysis, we collected Airbnb data using the script published by Tom
Slee [77]. In Appendix A, we provided a detailed description of the procedure of data collection,
along with the discussion of possible errors, and comparison of various sources of data on Airbnb
listings in Spanish cities (Table A1). We performed the data collection in October 2018, and only
listings available for rent any time in the following months were saved in our dataset. We created a
database containing data on 247,456 Airbnb listings. The scrapped listings are divided into three
groups defined by the platform itself: entire homes/apartments (81.7% of all listings in the database),
private rooms (17.7%) and shared rooms (0.6%).
      To compare Airbnb supply with housing supply and tourism activity, we used data of the
Spanish Statistical Office (INE) [78]. We obtained the numbers of population of each municipality for
the year 2017 from the Spanish municipal register, and the numbers of dwellings in municipalities
from the last population and housing census (2011). We also obtained statistics of the tourist sector
(numbers of hotel rooms and hotel guests) from the hotel occupancy survey. It is a continuous survey
made on monthly basis by INE. We took into account the latest published data for the year period
between October 2017 and September 2018. This data is not available at the municipal level. Hence,
we used the lowest available territorial aggregation for this data: tourist areas and sites.
      As a proxy of the size of hotel accommodation supply at the municipal level, we used the data
obtained from TripAdvisor. This Internet platform aggregates information on hotel offers from
several online travel agencies, and its search engine identifies hotels in administrative borders of
cities (municipalities). We manually extracted numbers of hotels for each municipality in October
2018.

2.2. Describing the Distribution of Airbnb Listings
      Due to the different availability of data, we performed analysis of the distribution of Airbnb
listings at two territorial levels: municipalities and tourist areas/sites. In the first approach, we used
8124 Spanish municipalities as units of analysis. They are varied in both area (between 1 km2 and 1751
km2) and population (between 5 persons and 3.2 million inhabitants). We counted Airbnb listings in
each municipality using base map of administrative division [79]. At the municipal level, we used
TripAdvisor data about the number of hotels as an indicator of tourism accommodation supply.
      The second spatial unit of analysis are the tourist areas and sites defined by the Spanish
Statistical Office (INE). They are areas with high concentration of tourist activity. Tourist sites are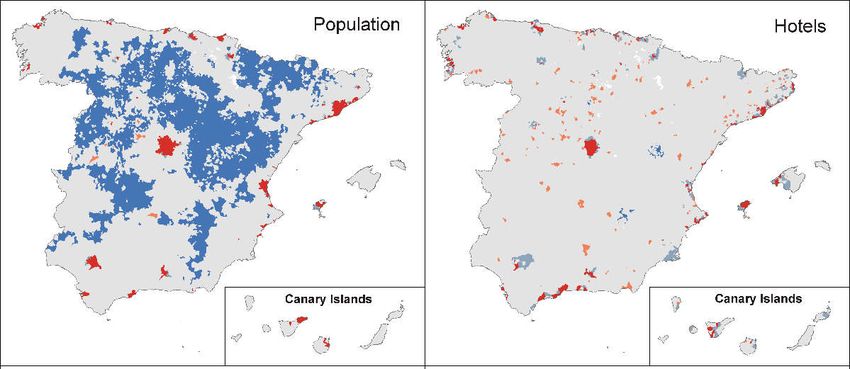
ISPRS Int. J. Geo-Inf. 2019, 8, 155                                                                 5 of 26

single municipalities, whereas tourist areas consist of multiple municipalities [80]. They do not cover
the entire territory of Spain (see Figure A1 in Appendix C). We considered all 37 tourist areas defined
by INE. Out of 106 tourist sites covered by INE statistics, we included 42 in our sample. We excluded
those which are located within tourist areas, as well as those with small numbers of hotels for which
data was protected by INE because of statistic secrecy. In the end, we took into account 79 tourism
areas/sites in total.

2.3. Measuring Concentration and Spatial Autocorrelation of Airbnb Listings, Population and Hotel Supply
     In order to numerically describe the level of spatial concentration of the supply of housing, hotel
and peer-to-peer accommodation in Spanish municipalities, we employed the Hoover index. It is a
widely used metric of spatial concentration, popular in population studies [81,82]. It is calculated as
half of the sum of differences between shares of accommodation of each territorial unit (pi, where i is
the index of territorial unit) in total supply of accommodation in the country (P), and shares of area
of each territorial unit in total area of the country (ai and A respectively):
                                          H = ½∑i|piP−1 − aiA−1|                                        (1)
     The value of the index equals 0 if the distribution of tourist accommodation is even across the
country, and approaches 1 when it is concentrated in one small area. The value of the index can be
interpreted as the share of the tourist accommodation that needs to be relocated to other units in
order to obtain full uniformity of its distribution.
     In an attempt to find out if municipalities with high concentrations of population, hotel and
Airbnb offer cluster in specific areas, we used Moran I statistics of global univariate (formula (2)) and
local univariate (formula (3)) spatial autocorrelation:
                                        I = NS0−1(ΣiΣjwijzizj)(Σizi2)−1                                 (2)

                                                 Ii = ziΣjwijzj                                         (3)
where N represents the number of spatial units, i and j are their indexes, z is the deviation from mean
(zi = xi − x̄), and wij are spatial weights which sum up to S0 (S0 = ΣiΣjwij) [83,84]. The calculation of
Moran I depends of the way the spatial weights matrix is defined. In our study, we used the row-
standardised queen-style contiguity weights matrix. Seven municipalities were excluded from the
spatial autocorrelation analysis, as they do not have any neighbours.
      For large samples, univariate global Moran I values higher than 0 indicate positive spatial
autocorrelation, i.e., a tendency to cluster together high values in certain areas, and low values in
other areas. Calculating univariate local Moran I for each territorial unit enables to produce maps of
clusters based on the deviations of the variable values in given territorial unit and neighbouring units
from the mean. High-high clusters are those where values for both given unit and neighbouring units
are significantly higher than the mean, low-low clusters are the opposite. High-low outliers are areas
with relatively high values surrounded by areas with low values, and low-high are the opposite.
      Bivariate global and local Moran I enable to find out if the values of one variable in given spatial
unit are correlated to the values of the second variable (lagged variable) in neighbouring spatial units.
The general formula for global multivariate spatial correlation enables one to compute a variable by
variable correlation coefficient matrix M based on data matrix Z including standardised values for n
locations by m variables, its transpose ZT, and spatial weights matrix W [85]:
                                                 M = ZTWZ                                               (4)
     Bivariate local Moran I is calculated similarly to univariate local Moran I, but instead of the
values zi and zj of the same variable for different locations, zk,i is calculated based on the value of one
variable (xk) in location i, while zl,j is based on the value of the second, lagged, variable (xl) in
neighbouring location j [86]:
                                               Ikl,i = zk,iΣjwijzl,j                                    (5)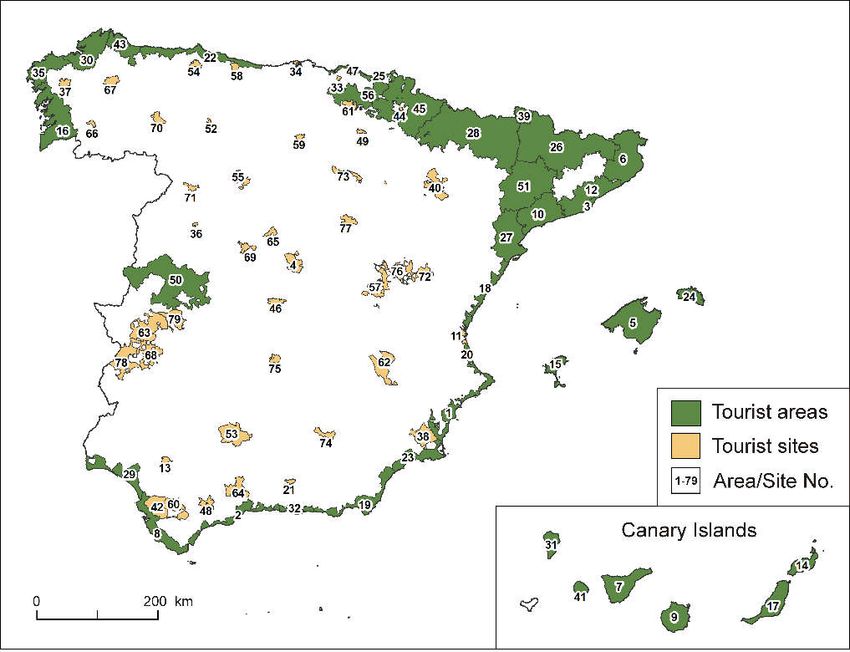
ISPRS Int. J. Geo-Inf. 2019, 8, 155                                                                          6 of 26

    To calculate spatial autocorrelation measures, we used densities of population, hotels and
Airbnb listings per km2. We performed this part of the analysis using GeoDa software [83].

2.4. Finding Factors That Explain the Distribution of Airbnb Listings
     In order to identify the factors affecting the distribution of Airbnb listings in Spain, we
developed a series of regression models. We built eight models: for each territorial unit of analysis
(municipality and tourist areas/sites) and for each type of Airbnb listings (total listings, entire
homes/apartments, private rooms, and shared rooms). In municipality models, we used densities of
Airbnb listings of given type per square kilometre as explained variables, which helped to deal with
data on municipalities of very diverse sizes. In the models for tourist areas/sites absolute numbers of
Airbnb listings of given type served as explained variables. To each of the five hypotheses listed in
Section 1, we assigned one or more explaining variables in regression models (Table 1). The
descriptive statistics for all explained and explaining variables used in the models are presented in
Appendix B.

                                 Table 1. Explaining variables used in regression models.

                                      Variables Used in Models for         Variables Used in Models for
                                      Municipalities                       Tourist Areas/Sites
   Hypothesis
                                      (Explained Variables:                (Explained Variables:
                                      Numbers of Listings per km2)         Numbers of Listings)
                                      Number of primary dwellings per      Number of primary dwellings
   1. Supply of homes                 km2 (Census, 2011)                   (Census, 2011)
   and flats                          Number of nonprimary dwellings       Number of nonprimary dwellings
                                      per km2 (Census, 2011)               (Census, 2011)
                                      Coastal location (1 for              Coastal location (1 for tourist
   2. Coastal location                municipality which borders sea       area/site which borders sea coast,
                                      coast, 0 for other municipalities)   0 for other tourist areas/sites)
   3. Supply of hotel                 Number of hotels in TripAdvisor      Number of hotel rooms (Hotel
   accommodation                      search engine per km2 (2018)         occupancy survey, 2018)
                                                                           Occupancy of hotel rooms
                                                                           (percent, average monthly value
                                                                           between XI 2017 and X 2018;
                                                                           Hotel occupancy survey)
   4. Shortage of hotel
                                                                           Seasonality ratio (ratio between
   capacity
                                                                           the highest and the lowest
                                                                           monthly number of hotel guests
                                                                           between X 2017 and IX 2018;
                                                                           Hotel occupancy survey)
                                                                           Distance to the nearest airport
                                                                           (for areas: average distance for all
                                      Distance to the nearest airport
                                                                           municipalities acknowledging the
   5. Access and                      (straight line in 100 km between
                                                                           role of the extent of area; for sites:
   presence of                        airports with at least 50,000
                                                                           as for municipalities)
   international tourists             passengers (2017) [87] and
                                                                           Share of international tourists
                                      municipality border)
                                                                           (percent among hotel guests;
                                                                           Hotel occupancy survey)

     Because of the strongly asymmetric distribution of all explained variables, as well as some
explaining variables, we used natural logarithms of their values in the models (Tables A2 and A3). In
each model, we first introduced all explaining variables, and then performed their backward
selection: we excluded insignificant factors until obtaining the best quality model measured by the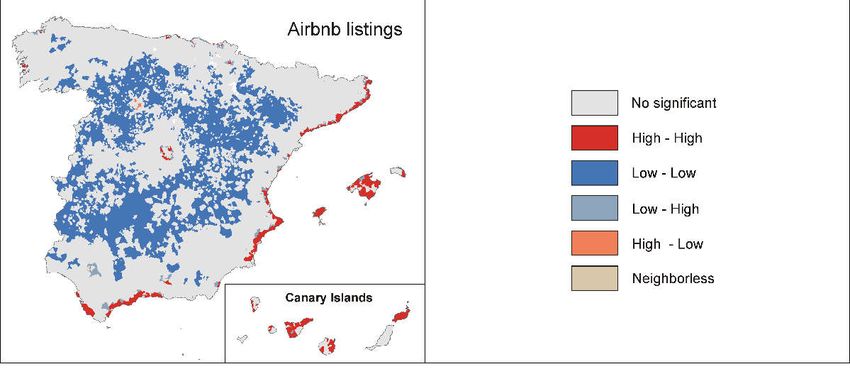
ISPRS Int. J. Geo-Inf. 2019, 8, 155                                                                7 of 26

maximum value of adjusted R2 or minimum value of the Akaike Information Criterion (AIC). As
several explaining variables in our model tend to be correlated, we also checked for multicollinearity
by calculating variance inflation factors (VIF).
     The values of Airbnb supply in municipalities are spatially autocorrelated (see Section 3.2). To
remove the effect of spatial autocorrelation from model results, we included spatially lagged values
of dependent variable as an explaining variable, thus creating spatial lag models [88,89] (also termed
spatial autoregressive models [90]):
                                                    y = ρWy + Xβ + ε                                   (6)
     Apart from simple linear model elements: dependent variable y, matrix of independent variables
X, parameters vector β, and error term ε, the formula includes spatial weights matrix W (from row-
standardised queen-style contiguity weights matrix), and spatial autoregressive parameter ρ
(positive values denote a positive autocorrelation independent of explaining variables). In spatial lag
models, we also excluded 7 municipalities which do not have any neighbours. We developed the
models using R software with spdep [91] and regclass [92] packages.
     For tourist areas/sites, we developed simple linear models not including the spatial effects. We
did so because it was impossible to create a meaningful spatial weights matrix both based on
neighbourhood (40 out of 79 units have no neighbours) and distance (sizes of units are very diverse,
and geodesic distance may differ considerably from actual accessibility, e.g., in the case of islands).

3. Results

3.1. Distribution of Airbnb Listings
      Out of 8124 Spanish municipalities, 4882 (60.1%) have at least one Airbnb listing, but most of
municipalities have only a few of them. Airbnb offers are most numerous in large cities, as well as in
municipalities located on the Mediterranean coast and in the Canary and Balearic Islands. In raw
numbers, there are 1500 municipalities with 10 listings or more, 178 municipalities with at least 250
listings, and 45 municipalities with 1000 listings or more (Table 2).

                              Table 2. Numbers of Airbnb listings in Spanish municipalities.

                                Number of Listings          Number of Municipalities
                                  14,520–16,509                        2
                                   2000–6616                          14
                                   1000–1999                          29
                                     500–999                          59
                                     250–499                          74
                                     100–249                          136
                                      10–99                          1186
                                       1–9                           3382
                                        0                            3242

     Map of the distribution of Airbnb listings (Figure 1) shows their concentration in large cities and
in the areas with high tourist activity. A strip of municipalities with high numbers of listings stretches
along the entire Mediterranean coast of Spain, as well as the coast of Cádiz. Apart from the largest
coastal cities (Barcelona and Valencia), the quantity of listings is particularly high in the regions of
Costa Brava (Catalonia), Costa Blanca (Valencia) and Costa del Sol (Málaga), as well as in the
archipelagos: Canary Islands and Balearic Islands. All of them are popular sun-and-beach tourism
destinations. In the northern part of Spain, the concentration of Airbnb listings is remarkable in
traditional tourist areas of Sansenxo (Galicia) and San Sebastián (Basque Country).
     Beyond coastal areas, Airbnb listings concentrate in mountain tourist destinations: Pyrenees,
Sierra de Guadarrama, Sierra Nevada and Picos de Europa. All these areas are protected as national
parks. The total numbers of offers are not as big there as in the cities and coastal municipalities, but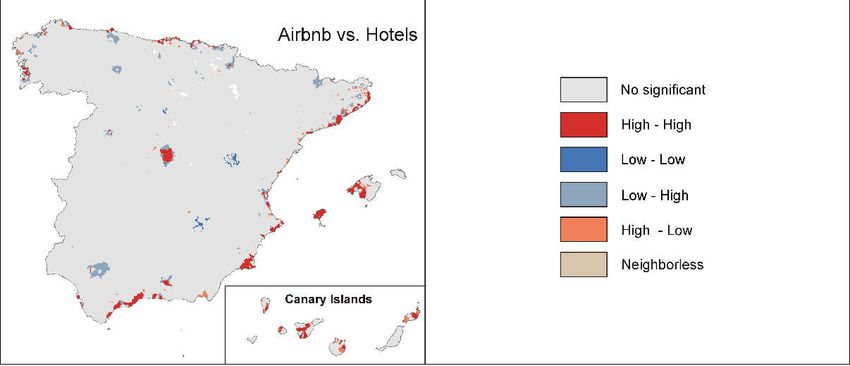
ISPRS Int. J. Geo-Inf. 2019, 8, 155                                                                8 of 26

they sprawl over large areas. The common form of accommodation in these places are spatially
dispersed rural houses. Besides coastal and mountain areas, Airbnb offers are located in cities,
particularly the largest ones: Barcelona, Madrid, Valencia, Sevilla and Málaga (Appendix C).
Significant numbers of listings are also located in interior cities with important administrative and
economic functions (e.g., Zaragoza), and in smaller cities with high numbers of tourist visits (e.g.,
Salamanca, Toledo).

                           Figure 1. Distribution of Airbnb listings in Spanish municipalities.

      There are some differences in the distribution of Airbnb listings of different types. Private rooms
are particularly numerous in cities. In Barcelona, there is almost the same number of private rooms
as entire properties. Traditional university cities, such as Salamanca or Santiago de Compostela, also
have high proportion of private rooms. On the other hand, entire homes or apartments dominate in
leisure tourist areas, especially in those areas where the tourist model has been historically oriented
to second homes. In these cases, entire properties usually represent more than 90% of all listings
(Appendix C). Similar structure characterises rural and mountain areas.
      The distribution of absolute numbers of Airbnb listings may be misleading, since it is highly
correlated with the distribution of population and housing. In Figure 2, we present the number of
Airbnb listings per 1000 inhabitants in Spanish municipalities. These values are not the highest in the
largest cities anymore. High numbers of listings per capita characterise coastal, mountain and rural
leisure tourism areas. In Madrid and other major urban areas, the numbers of Airbnb listings per
capita are similar or lower than the values for Pyrenees, Sierra Nevada, Sierra de Guadarrama
mountains located north-west from Madrid metropolitan area, and eastern Asturias with popular
tourist areas: Picos de Europa and Llanes. These regions, as well as many coastal areas, have low
density of permanent population and their economies are highly reliant on tourism. High per capita
numbers of Airbnb listings in such areas show that P2P rental accommodation is not only important
for urban tourism.
      The analysis of the distribution of Airbnb offers in tourist areas/sites shows the same distribution
patterns as the municipal study (Figure 3, Table A4 in Appendix C). This territorial aggregation also
allows us to compare the numbers of Airbnb listings with the capacity of hotel accommodation. In
all tourist areas/sites combined, there are 218,222 Airbnb listings, which supplement the capacity of
765,532 hotel rooms. There are on average 285 listings per 1000 hotel rooms. In fact, the capacity of
Airbnb properties is higher than this ratio suggests, as one listing can accommodate 4.83 persons on
ISPRS Int. J. Geo-Inf. 2019, 8, 155 9 of 26
average (based on our web-scrapped database on listings), while hotel rooms house 2.09 persons on
average (based on INE hotel occupancy survey). On the other hand, Airbnb places are probably less
frequently occupied than hotel rooms.
Figure 2. Number of Airbnb listings per 1000 inhabitants in Spanish municipalities.
The results show that the ratio of Airbnb listings per hotel rooms is high along the coasts, both
in the Cantabrian and Mediterranean coasts. Costa del Sol (Málaga) and Costa Blanca (Comunitat
Valenciana), both important residential tourism areas, are characterised by exceptionally high values
of this proportion (over 500 Airbnb listings per 1000 hotel rooms). In the archipelagos, particularly in
the Balearic Islands, Airbnb listings represent a lower share in the total accommodation capacity, due
to very high numbers of hotels rooms. The exceptions are the islands of La Palma and La Gomera in
Canary Islands, with high numbers of Airbnb listings compared to hotel rooms. In inland Spain, the
proportion is usually lower than in coastal areas, even in the case of Madrid (323.6 Airbnb listings
per 1000 hotel rooms).ISPRS Int. J. Geo-Inf. 2019, 8, 155 10 of 26
Figure 3. Number of Airbnb listings in Spanish tourist areas/sites.
3.2. Concentration and Spatial Autocorrelation of Airbnb Listings, Population and Hotel Supply
The Hoover index values prove the spatial concentration of population, hotel capacity and
Airbnb listings in certain areas of the country (Table 3). The degree of concentration of traditional
tourism accommodation is higher than of population. Nonprimary dwellings are more dispersed
than primary dwellings across the country, because of a high number of nonpermanently inhabited
rural houses, being a relic of historical, more dispersed distribution of population. Hotels and Airbnb
listings have a similar degree of concentration. Nevertheless, there are some differences in the levels
of concentration of different types of listings. Shared rooms are much more concentrated that entire
homes/apartments, and private rooms are relatively dispersed.
Table 3. Level of spatial concentration of population, hotels, and Airbnb listings in Spanish
municipalities.
Variable Hoover Index
Population 0.688
Primary dwellings 0.682
Nonprimary dwellings 0.573
Hotels (from TripAdvisor) 0.815
Airbnb listings: total 0.802
Airbnb listings: entire homes/apartments 0.811
Airbnb listings: private rooms 0.801
Airbnb listings: shared rooms 0.920
Values of univariate global Moran I calculated for densities of population, two types of
dwellings, hotels and Airbnb listings show that all of them have a significant tendency to cluster in
certain areas (Table 4). Population and the distribution of primary dwellings are most strongly
spatially autocorrelated. The lowest value of Moran I for the density of hotels is a result of a high
number of municipalities with no hotels. The locations of clusters of high population, hotel and
Airbnb listing density differ between each other (Figure 4). Population is clustered in major
metropolitan areas, with low population clusters in large areas of inland Spain, including some
mountainous areas like the Pyrenees. Hotel clusters are also located in major metropolitan areas asISPRS Int. J. Geo-Inf. 2019, 8, 155 11 of 26
well as in important tourist coastal destinations, such as the Costa del Sol. Airbnb listings are
clustered in the coastal strips of municipalities, and the archipelagos, i.e., the main sun and beach
destinations of Spain. Nevertheless, important urban and metropolitan destinations, such as Madrid
or Granada, are also marked as Airbnb listing clusters.
Table 4. Values of univariate global Moran I.
Variable Moran I Z-Value
Population 0.429 69.011 ***
Primary dwellings 0.419 68.017 ***
Nonprimary dwellings 0.355 54.481 ***
Hotels (from TripAdvisor) 0.088 15.929 ***
Airbnb listings: total 0.314 49.352 ***
Airbnb listings: entire homes/apartments 0.327 49.631 ***
Airbnb listings: private rooms 0.276 60.996 ***
Airbnb listings: shared rooms 0.107 19.769 ***
*** Significant at p = 0.001. Randomisation with 999 permutations.
Figure 4. Cluster maps of univariate local Moran I.
The values of bivariate Moran I inform if the values of one variable are correlated with spatially
lagged values of another variable. Table 5 shows that the distribution of hotels is spatially correlated
with the distribution of population, and the distribution of Airbnb listings is spatially correlated with
the distribution of both population and hotels. Cluster maps based on bivariate local Moran I make
it possible to find out clusters of co-occurrence and outliers of spatial disparity between the variables
(Figure 5). They confirm our previous observations. Hotels tend to be located in the same
metropolitan clusters as the population, but many positive outliers (high density of hotels
surrounded by low population density) are located in middle-size cities. Clusters of co-occurrence ofISPRS Int. J. Geo-Inf. 2019, 8, 155 12 of 26
Airbnb listings with population are present in metropolitan areas and some coastal parts of the
country. Positive outliers (high density of Airbnb listings surrounded by low population density) are
located in the Pyrenees, and negative outliers (low density of Airbnb listings surrounded by high
population density) are present in suburban municipalities near big cities. Comparison between
Airbnb listing density and spatially lagged hotel density shows that these two variables form
common clusters. Still, there are many municipalities in the coastal regions, which have relatively
high density of Airbnb listings, and are surrounded by areas with low density of hotels.
Table 5. Values of bivariate global Moran I.
Variable Lagged Variable Moran I Z-Value
Hotels (from TripAdvisor) Population 0.143 26.954 ***
Airbnb listings: total Population 0.199 38.228 ***
Airbnb listings: total Hotels (from TripAdvisor) 0.142 27.841 ***
*** Significant at p = 0.001. Randomisation with 999 permutations.
Figure 5. Cluster maps of bivariate local Moran I.
3.3. Factors Affecting the Distribution of Airbnb Listings
After developing four simple regression models at the municipal level, the majority of the
explaining variables proved to significantly affect the dependent variables (Table A5 in appendix D).
This is partially a result of a large sample size. Despite correlation between various explaining
variables, VIF values below 5 (Table A6 in Appendix D) show that multicollinearity does not bias our
models [93]. Spatial lag models reveal the high impact of spatial autocorrelation (positive and
statistically significant ρ values). Initial spatial lag models are presented in Table A7, and final models
in Table 6.
Table 6. Final spatial lag models for municipalities (N = 8117).ISPRS Int. J. Geo-Inf. 2019, 8, 155 13 of 26
Total Entire Private Shared
Listings Homes/Apartments Rooms Rooms
(Intercept) −0.144 *** −0.117 *** −0.054 *** −0.001
Primary dwellings (per km2, ln) −0.042 *** −0.055 *** 0.004 * -
Nonprimary dwellings (per km2, ln) 0.133 *** 0.129 *** 0.023 *** 0.001 *
Coastal location 0.515 *** 0.530 *** 0.075 *** 0.008 ***
Number of hotels (per km2, ln) 1.965 *** 1.802 *** 1.391 *** 0.159 ***
Distance to nearest airport (100 km) - - 0.007 * -
ρ 0.553 *** 0.555 *** 0.506 *** 0.150 ***
AIC −1080 −1518.5 −11497 −35,598
AIC for linear model 2413.9 1793.5 −9033.5 −35,491
Dependent variables: ln(listings/km2). Significance scores: *** p < 0.001, ** p < 0.01, * p < 0.05, ˙ p < 0.1.
The results confirm the hypotheses of the impact of supply of apartments not used as primary
dwellings, proximity to the principal tourism amenity of the sea coast, and presence of traditional
tourism accommodation (hotels). Positive impact of the accessibility for international tourists
measured by proximity to airports, which is visible in simple linear models (negative coefficient
means that the further from the airport, the lower the number of Airbnb listings), was hidden under
the autocorrelation effect in spatial lag models. An unexpected outcome is the negative and
significant independent impact of the number of primary dwellings (though weaker than the positive
impact of the number of nonprimary dwellings). This can be attributed to the influence of urban and
suburban municipalities with high population, prevalence of primary dwellings and low tourism
interest.
The municipal model for entire properties reflects the results of the one for total number of
listings. In the model for private rooms, the number of primary dwellings becomes an independent
factor positively affecting the results, which corroborates the hypothesis about the influence of supply
of permanent residences on the number of rooms rented on Airbnb. According to the third model,
numbers of hotels and nonprimary dwellings significantly positively affect the density of shared
rooms.
Models for tourist areas/sites allow taking into account several new variables based on the data
extracted from the hotel occupancy survey made by INE: number and occupancy of hotel rooms,
seasonality of tourism and share of international tourists. Initial models with all variables included
proved the need for limiting their sets in order to rid explaining variables with no significant effects
(Table A8 in Appendix D). We should note, however, that besides low effect sizes, the much smaller
sample in this set of models increased the significance thresholds for variables. Log-transformed
numbers of primary and nonprimary dwellings are highly correlated (r = 0.911) causing VIF values
reach 11.6. To avoid the problem of multicollinearity, we chose only one of these two variables (the
one with higher absolute t value) for each model. After that, VIF analysis shows that coefficient
estimates should not be biased by multicollinearity (Table A9 in Appendix D).
Final models for tourist areas/sites confirm the results obtained using data for municipalities
(Table 7). The total number of listings is significantly positively affected by the amount of available
nonprimary houses, coastal location, number of hotel rooms and the proximity to airports. Out of
two variables added to the models to verify the hypothesis about the shortage of hotel capacity as a
driver of Airbnb presence, neither tourism seasonality, nor occupancy ratio have an independent
significant effect. New models confirmed that the number of Airbnb listings is positively affected not
only by the accessibility for international tourist measured as negative distance to the nearest airport,
but also by the actual share of international tourists in overall number of tourists.
Table 7. Final linear models for tourist areas/sites (N = 79).
Total Entire Private Shared
Listings Homes/Apartments Rooms Rooms
(Intercept) −2.549 *** −2.888 *** −3.640 *** −3.264 ***
Primary dwellings (ln) - - 0.257 ** -ISPRS Int. J. Geo-Inf. 2019, 8, 155 14 of 26
Nonprimary dwellings (ln) 0.213 ** 0.171 ˙ - -
Coastal location 0.558 *** 0.781 *** - 0.366
Number of hotel rooms (ln) 0.737 *** 0.788 *** 0.715 *** 0.671 ***
Occupancy of hotel rooms - - −0.019 * -
Seasonality ratio (ln) - - −0.231 ˙ −0.316 *
Distance to nearest airport (100 km) −0.340 * −0.251 −0.421 ** −0.538 *
Share of international tourists (ln) 0.278 ˙ 0.254 0.394 * -
Residual standard error 0.496 0.580 0.549 0.816
Adjusted R2 0.920 0.900 0.877 0.675
F-statistic 179.0 *** 141.0 *** 93.2 *** 41.5 ***
Significance scores: *** p < 0.001, ** p < 0.01, * p < 0.05, ˙ p < 0.1.
There are differences in the sets of factors affecting the distribution of each of the three kinds of
Airbnb accommodation in tourist areas/sites. As we expected, private rooms are more numerous in
the areas of high supply of permanent dwellings. Unlike in the municipalities model, the effect of the
number of primary dwellings is stronger than the effect of the number of nonprimary dwellings.
Coastal location strongly affects the distribution of entire properties, but not private rooms. The
model for private rooms includes occupancy of hotel rooms and seasonality (the latter variable is also
present in the model for shared rooms), but the effect is the opposite of what we assumed: low
occupancy and seasonality lead to the increase in private room supply. Proximity to airport
significantly affects the distribution of private rooms, while its impact on the number of entire
homes/apartments does not reach the statistical significance threshold. A similar pattern can be
observed in case of the share of international tourists. These differences stem from the fact that entire
properties are more concentrated in vacation coastal locations, while rooms tend to be more often
located in cities.
4. Discussion and Conclusions
The research shows that the distribution of about 250,000 properties offered for rent through the
Airbnb platform in Spain follows the general patterns of the distribution of population and hotel
accommodation. Airbnb listings are mostly concentrated in major cities, coastal areas and in the
Balearic and Canary Islands. Therefore, tourist accommodation offered through P2P platforms does
not contribute to the territorial deglomeration of tourist activity at the country scale, as it does not
contribute to the territorial deglomeration of tourist activity at the local scale in urban areas and
nature-based tourism areas [32,33,66]. On the contrary, the possible revenue from Airbnb rental
encourages the growth of the tourist accommodation offer in places of high demand, which
contributes to the concentration of tourism activity in already existing hotspots.
Airbnb listings, mostly entire homes and apartments, concentrate in tourism areas which follow
the model of sun-and-beach residential tourism development [94,95]. This is supported by the results
of the regression analysis: the number of Airbnb rentals is positively affected by coastal location, high
number of nonprimary dwellings and hotel accommodation supply. In these areas, P2P
accommodation platforms provide a new way of commercializing tourist accommodation in homes
or apartments already used for touristic purposes either privately (second homes) or commercially.
In coastal tourist areas, numbers of Airbnb listings are much higher than the numbers of legally
registered holiday dwellings, according to the Holiday Dwellings Occupancy Survey [78]. It is
difficult to say to what degree Airbnb is used to commercialise the already existing, either registered
or not, stock of holiday dwellings. The lack of such data hampers the full understanding of the impact
of P2P platforms on the development of tourism destinations. In any case, this new way of
commercialisation of vacation dwellings can increase the intensity of use of the accommodation stock
and open new business opportunities for the tourism sector [68,96].
The above conclusions apply to the entire homes/apartments rented trough Airbnb platform,
which are the majority (81.7%) of listings. The supply of private and shared rooms has different
characteristics. It does not concentrate in residential tourism areas, but mainly in big and medium-
sized cities. Therefore, it is more related to the housing market dynamics of these cities and to urbanISPRS Int. J. Geo-Inf. 2019, 8, 155 15 of 26
and cultural tourism models. The two types of Airbnb offer (entire homes/apartments and private
rooms) should be treated separately, as they have different distribution and exert different impacts
on the territory and the society. Whereas P2P platforms are mainly a way to commercialise vacation
rentals and second homes in residential tourism areas, in cities, the use of these platforms appears to
be slightly closer to the original “sharing economy” model, where owners rent out a room in their
houses, obtaining an extra income in exchange for the service provided. However, we do not know
if all private and shared rooms offered on Airbnb are parts of houses inhabited by their owners, or
they are rather parts of houses or apartments in which all rooms are rented out. Further research
should explore these issues in detail. Also, urban Airbnb rentals can not only serve tourist demand
(short rentals), but may be also used to supply housing for permanent or temporal residents.
Although Airbnb listings mostly concentrate around tourist hotspots, our research has shown
that Airbnb supply is spread over the entire Spanish territory, including mountain and rural areas.
Airbnb is far from being only an urban phenomenon, despite the urban focus of most studies on the
topic to date [32–38]. More studies assessing the impact of P2P accommodation platforms on
nonurban areas are needed. The distinction of different kinds of location of Airbnb rental activity (big
cities, coastal tourist areas, rural areas) is useful in designing policy response to this phenomenon.
Significant differences in the size, structure, and role of peer-to-peer rental supply in various types of
settlements and tourist destinations must lead to different impacts on the housing and tourism
markets. These impacts should be addressed by policies adjusted to the regional and local conditions.
Such policies need to be informed by studies focused on specific local environments and should
address multiple issues, such as the competition of P2P rentals with other tourism accommodation
providers, the effects on housing supply and demand or the effects on employment and
entrepreneurship.
Our study does not provide an unambiguous answer to the question whether P2P
accommodation competes with or complements the tourism accommodation offered by hotels and
other traditional establishments. As stated above, many Airbnb offers in residential tourism
destinations might be homes and apartments that have already been used privately for tourism
purposes, or offered for rent to tourists using other distribution channels. This applies particularly to
the coast of Andalucía and Comunitat Valenciana, with the highest stocks of vacation rentals [97],
and not so much to the archipelagos, where the numbers of hotel beds are much higher than those
located in holiday apartments. Second homes also form a significant part of tourism accommodation
in rural tourism areas [98], and our results suggest that such homes are also being commercialised
through P2P platforms. Still, the numbers of Airbnb listings in these areas are low compared to the
numbers of hotel rooms. Accordingly, no serious competition can be seen yet between P2P platforms
and traditional commercial tourist accommodation offer in this kind of areas.
We have not proven positive correlation between the number of Airbnb listings and the shortage
of hotel capacity, which would suggest that Airbnb capacity supplements the supply of tourism
accommodation in places where it is most needed. The spatial correlation between the location of
Airbnb listings and hotel accommodation is high, though not perfect. Their numbers differ in some
residential tourism areas with low supply of hotel accommodation, and in some cities which are not
important leisure tourism destinations, where the size of Airbnb offer is much smaller than hotel
capacity. In such places, P2P platforms and the traditional hotel sector play a complementary role,
which is consistent with the conclusions of previous studies in the field [7,9]. Previous studies at the
local scale conclude that even if P2P accommodation locates in the same areas as hotels [33,60,99],
their offer may be targeted to different customers. In fact, Airbnb seems to compete mostly against
hotels and other accommodation services of lower categories, but not against high-end hotels
[10,13,58].
The interpretation of the study results has several limitations. First, we used data on Airbnb,
which is the largest, but only one of several platforms that enable peer-to-peer rental of flats for tourist
purposes. Comparative data show high correlation in territorial distribution of offers on various
platforms [100], yet some differences may exist. Airbnb is a platform used often by international and
urban tourists [52,101,102], while domestic tourists may use other platforms as well. Rural tourismISPRS Int. J. Geo-Inf. 2019, 8, 155 16 of 26
establishments traditionally use other web portals [103,104], which may also be used to
commercialise rental houses in these areas. Second, we measured only the supply of Airbnb
accommodation, which reflects the homeowners’ decisions to rent out a property, but not their actual
use. We do not use the numbers of reviews obtained by individual listings, but other authors have
tested using this data as a proxy for the intensity of the use of P2P accommodation establishments
[57,58]. Finally, the web scrapping technique that we have employed omitted some of the Airbnb
listings, which could lead to the underrating of the absolute numbers of listings (see Appendix A).
However, it is unlikely that it has distorted the proportions of listings across types and locations.
Future directions of spatial studies on peer-to-peer accommodation should include other
platforms and look for spatial regularities in other characteristics than the size of supply, like
occupancy, ratings and prices. Such studies are already performed on lower, particularly urban
spatial scales, but large-scale analysis on country or international levels will be more fruitful in
finding determinants of spatial variability, including type of environment and cultural and political
factors. Advanced techniques of spatial analysis, and the use of geometric spatial units of analysis,
should also be moved from urban and regional scale to larger areas of interest.
Our research is an example of a study based on nonconventional sources of spatial statistical
data. Such approaches are increasingly popular in studies on population and tourism. Data obtained
from online sources, such as online travel agencies [72], social media [105] or search engines [106],
are used to describe and predict tourist activity with higher spatial and temporal precision than it is
possible based on conventional statistical data provided by public statistical institutions. Keeping in
mind that Airbnb data does not reflect the entire tourism mobility (as shown in the paper, it
exaggerates the role of international tourism), it can also be used as a tool enabling comparative
studies on spatial patterns of tourism activity on the international scale. Thanks to the data on the
numbers of reviews, it can also serve to investigate the temporal variability of tourism activity with
a high level of geographic detail.
Finally, the analysis contributes to wider debates on the nature of tourist accommodation and
tourism itself from a geographical perspective. Together with second homes, VFR (visiting friends
and relatives) tourism, cruise tourism or recreational vehicles, peer-to-peer accommodation is located
at the peripheries of the notion of tourist accommodation, the centre of which is occupied by hotels.
Hotels are fixed in space, (relatively) constant in time, often located based on the negotiations
between public and private institutions realised through the planning process, and designed
following globalised trends and the pursuit of comfort and organisational efficiency. Peer-to-peer
accommodation platforms oppose this model in many ways: such tourism accommodation
establishments are “invisible”, volatile in time and space and flexibly adjust to market situations,
offering variety and uniqueness, which are primary qualities sought after by customers. Dealing with
dispersed, volatile, or mobile, forms of accommodation is challenging for spatial studies, but
necessary to understand the complex nature of tourism mobility.
Author Contributions: Conceptualization, Czesław Adamiak; methodology, Czesław Adamiak; formal
analysis, Czesław Adamiak, Barbara Szyda and Anna Dubownik; investigation, Czesław Adamiak, Barbara
Szyda, Anna Dubownik and David García-Álvarez; writing—original draft preparation, Czesław Adamiak and
David García-Álvarez; writing—review and editing, Czesław Adamiak, Barbara Szyda, Anna Dubownik and
David García-Álvarez; visualization, Barbara Szyda; supervision, Czesław Adamiak; project administration,
Czesław Adamiak.
Funding: The last author is grateful to the Spanish Ministry of Economy and Competitiveness and the European
Social Fund for the funding of his research activity (Ayudas para contratos predoctorales para la formación de
doctores 2014).
Conflicts of Interest: The authors declare no conflict of interest.
Appenix A. Web Scrapping Procedure
We collected data on Airbnb listings using a Python script published by Tom Slee [77]. The script
accesses the Airbnb website, searching for the listings located within a given set of coordinates andISPRS Int. J. Geo-Inf. 2019, 8, 155 17 of 26
saves the following information about the resulting offers in a database: listing type, approximate
address, number of reviews and average review score, capacity, numbers of bedrooms and
bathrooms, price, and coordinates.
Some of the listings have wrong coordinates in the platform and appear to be located offshore
or outside of Spain, despite having a Spanish address. We have cleaned the database of such falsely
located listings, ruling out those listings which were not located in the Spanish territory. After this
step, we gathered 247,456 records.
We evaluated the completeness of our data collection by comparing it with the information from
three other services gathering data on Airbnb offer: Inside Airbnb, DataHippo and AirDNA (Table
A1). Inside Airbnb is a nonprofit website that publishes datasets with information on Airbnb listings
for various cities of the world, including the Barcelona, Madrid, Málaga and Sevilla in Spain [107].
DataHippo is another nonprofit project that gathers data on offers of Airbnb and three other P2P
rental platforms for Spain, Portugal and Andorra [100]. It has been collecting data continuously for a
year, which results in a large list of offers, including listings that are not available for rent anymore.
Finally, AirDNA is a commercial service offering information on Airbnb market that uses advanced
technology for web monitoring, which enables one to filter out inactive Airbnb offers [108].
The author of the script states that the data collection method may underrate the number of
listings by up to 20% [77]. Indeed, the number of Airbnb records we have gathered is on average 7%
lower than the most recent data of Inside Airbnb and a 29% lower than the one scrapped by
DataHippo. The difference between our data and data of AirDNA is very low on average, although
the numbers for individual cities differ by up to 9%.
Table A1. Comparison of numbers of Airbnb listings in Spanish cities according to various sources.
Authors DataHippo (September AirDNA
City Inside Airbnb
(October 2018) 2017–September 2018) (November 2018)
Barcelona 16,509 18473 (10 October 2018) 27,503 18,093
Madrid 14,520 17303 (10 October 2018) 24,976 15,229
Valencia 6616 - 9394 6420
Sevilla 5252 4746 (18 October 2018) 7423 5583
Málaga 4927 5549 (29 September 2018) 6419 5002
Marbella 4677 - 6234 3945
Alacant 3561 - 4522 3444
Arona 2607 - 3457 2693
Granada 2559 - 3748 2742
Torrevieja 2531 - 3335 2397
Appendix B. Descriptive Statistics of the Variables Used in Regression Models
Table A2. Descriptive statistics of the variables used in models for municipalities (N = 8124).
Variable Min Median Mean Max SD Transformation
Total listings per km2 0 0.025 0.665 163.57 4.352 ln(x + 1)
Entire homes/apartments per km2 0 0.017 0.548 101.56 3.581 ln(x + 1)
Private rooms per km2 0 0 0.113 79.768 1.147 ln(x + 1)
Shared rooms per km2 0 0 0.003 2.372 0.044 ln(x + 1)
Primary dwellings per km2 0.102 6.022 66.704 10189.7 348.95 ln(x + 1)
Nonprimary dwellings per km2 0 5.272 23.821 1840.1 88.664 ln(x + 1)
Coastal location 0 0 0.058 1 0.233 x
Number of hotels per km2 0 0 0.015 6.350 0.133 ln(x + 1)
Distance to nearest airport (100 km) 0 0.653 0.728 2.757 0.468 x
Table A3. Descriptive statistics of the variables used in models for tourist areas/sites (N = 79).
Variable Min Median Mean Max Sum SD Transformation
Total listings 25 582 2762 21,921 218,222 4858 ln(x)
Entire homes/apartments 18 422 2275 20,130 179,757 4108 ln(x)You can also read