Marine mammal hotspots in the Greenland and Barents Seas
←
→
Page content transcription
If your browser does not render page correctly, please read the page content below
Vol. 659: 3–28, 2021                MARINE ECOLOGY PROGRESS SERIES
                                                                                                   Published February 4
https://doi.org/10.3354/meps13584                 Mar Ecol Prog Ser

                                                                                                     OPEN
FEATURE ARTICLE                                                                                      ACCESS

          Marine mammal hotspots in the Greenland
                    and Barents Seas
Charmain D. Hamilton1,12,*, Christian Lydersen1, Jon Aars1, Martin Biuw2, Andrei N. Boltunov3,
       Erik W. Born4, Rune Dietz5, Lars P. Folkow6, Dmitri M. Glazov7, Tore Haug2,
      Mads Peter Heide-Jørgensen4, Lisa E. Kettemer6, Kristin L. Laidre4, 8, Nils Øien9,
  Erling S. Nordøy6, Audun H. Rikardsen6,10, Aqqalu Rosing-Asvid4, Varvara Semenova3,
   Olga V. Shpak7, Signe Sveegaard5, Fernando Ugarte4, Øystein Wiig11, Kit M. Kovacs1
                                   1
                                     Norwegian Polar Institute, Fram Centre, 9296 Tromsø, Norway
                               2
                                Institute of Marine Research, Fram Centre, 9296 Tromsø, Norway
                          3
                           Marine Mammal Research and Expedition Center, Moscow 117218, Russia
                               4
                                 Greenland Institute of Natural Resources, 3900 Nuuk, Greenland
                                 5
                                  Dept of Bioscience, Aarhus University, 4000 Roskilde, Denmark
             6
              Department of Arctic and Marine Biology, UiT - the Arctic University of Norway, 9019 Tromsø, Norway
           7
            A. N. Severtsov Institute of Ecology and Evolution, Russian Academy of Sciences, Moscow 119071, Russia
                            8
                             Applied Physics Lab, University of Washington, Seattle, WA 98105, USA
                                        9
                                         Institute of Marine Research, 5005 Bergen, Norway
                      10
                        The Norwegian Institute of Nature Research, Fram Centre, 9296 Tromsø, Norway
                                11
                                   Natural History Museum, University of Oslo, 0562 Oslo, Norway
                         12
                          Present address: Fisheries and Oceans Canada, St. John's, NL A1C 5X1, Canada

ABSTRACT: Environmental change and increasing
levels of human activity are threats to marine mam-
mals in the Arctic. Identifying marine mammal hot-
spots and areas of high species richness are essential
to help guide management and conservation efforts.
Herein, space use based on biotelemetric tracking
devices deployed on 13 species (ringed seal Pusa
hispida, bearded seal Erignathus barbatus, harbour
seal Phoca vitulina, walrus Odobenus rosmarus, harp
seal Pagophilus groenlandicus, hooded seal Cysto-
phora cristata, polar bear Ursus maritimus, bowhead
whale Balaena mysticetus, narwhal Monodon mono-
ceros, white whale Delphinapterus leucas, blue
whale Balaenoptera musculus, fin whale Balaeno-
ptera physalus and humpback whale Megaptera
                                                                  Getis–Ord Gi* plots highlight marine mammal hotspots in
novaeangliae; total = 585 individuals) in the Green-              the Barents region—walruses were one of 13 species studied
land and northern Barents Seas between 2005 and                   (using new custom-GPS tags) Photo: Kit M. Kovacs and
2018 is reported. Getis−Ord Gi* hotspots were calcu-                    Christian Lydersen; Image: C. D. Hamilton; NPI
lated for each species as well as all species combined,
and areas of high species richness were identified
for summer/autumn (Jun−Dec), winter/spring (Jan−                  populations, including denning areas for polar bears
May) and the entire year. The marginal ice zone                   and foraging areas. The hotspots identified herein
(MIZ) of the Greenland Sea and northern Barents                   are also important habitats for seabirds and fishes,
Sea, the waters surrounding the Svalbard Archipel-                and thus conservation and management measures
ago and a few Northeast Greenland coastal sites                   targeting these regions would benefit multiple
were identified as key marine mammal hotspots and                 groups of Arctic animals.
areas of high species richness in this region. Individ-
ual hotspots identified areas important for most of the           KEY WORDS: Ice-associated marine mammals · Sea-
tagged animals, such as common resting, nursing,                  sonal migrants · Marginal ice zone · Svalbard · East
moulting and foraging areas. Location hotspots iden-              Greenland · Climate change · Arctic · Biotelemetry
tified areas heavily used by segments of the tagged
                                                                  © The authors 2021. Open Access under Creative Commons by
*Corresponding author: charmain.d.hamilton@gmail.com              Attribution Licence. Use, distribution and reproduction are un-
                                                                  restricted. Authors and original publication must be credited.
                                                                  Publisher: Inter-Research · www.int-res.com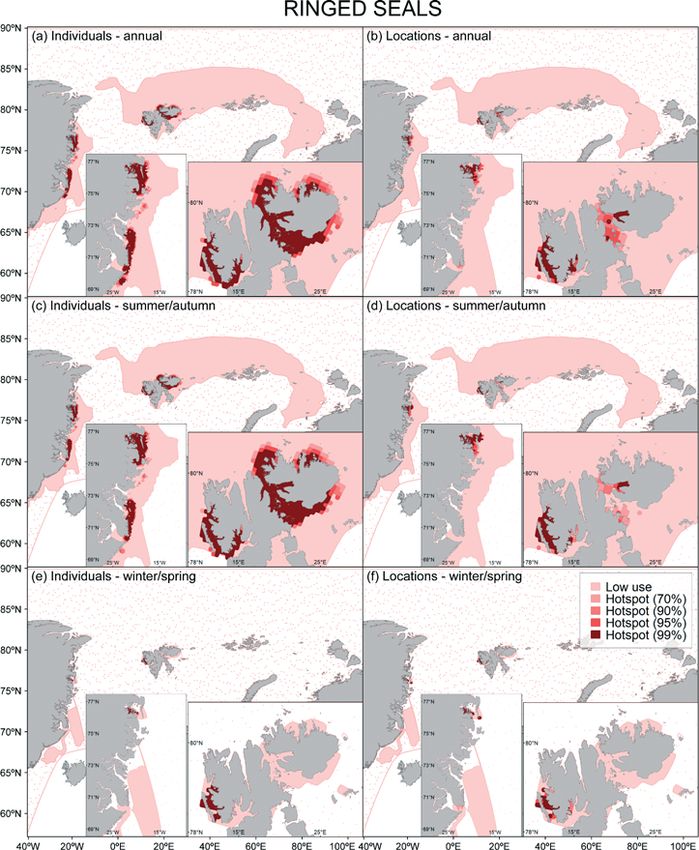
4                                        Mar Ecol Prog Ser 659: 3–28, 2021

                1. INTRODUCTION                            Svalbard (Lydersen & Kovacs 2010). A variety of
                                                           cetacean species also use the Greenland and Barents
   The climate is changing faster in the Arctic than       Seas primarily during the summer and autumn as a
in any other area on Earth, with air temperatures          foraging ground, including the killer whale Orcinus
increasing at a rate 2−3 times the global average and      orca, the blue whale Balaenoptera musculus, the fin
sea-ice extent declining at an alarming rate (IPCC         whale Balaenoptera physalus, the humpback whale
2018, Meredith et al. 2019). Arctic endemic marine         Megaptera novaeangliae, the minke whale Balaeno-
mammals are all strongly ice-affiliated and hence are      ptera acutorostrata, the sperm whale Physeter
seriously threatened by these changes (see Laidre et       macrocephalus, the harbour porpoise Phocoena pho-
al. 2008, Kovacs et al. 2011, Meredith et al. 2019 for     coena and the white-beaked dolphin Lagenorhyn-
details). Numerous consequences of climate change          chus albirostris (Kovacs et al. 2009, Storrie et al.
have already been documented for this species              2018).
group. Declines in Arctic sea ice and associated envi-        Sea-ice extent is changing rapidly in the Green-
ronmental changes have been linked to shifts in spe-       land and Barents Seas, with the duration of sea-ice
cies distributions (e.g. Higdon & Ferguson 2009,           cover declining faster in the northern Barents Sea
Hamilton et al. 2015, 2019a, Rode et al. 2015, Lone et     than in any other Arctic region (41.8 d decade−1;
al. 2018), changes in trophic relationships (e.g. Watt     Laidre et al. 2015a). Environmental conditions in
et al. 2016, Hamilton et al. 2017, Yurkowski et al.        Svalbard and the Barents Sea changed dramatically
2018) and increased risks of disease (e.g. Van             in the winter of 2005−2006, with the altered condi-
Wormer et al. 2019). Concomitantly, levels of human        tions persisting to the present day. The amount of
activity, including shipping, tourism, commercial          land-fast ice forming in Svalbard’s fjords declined
fishing, and oil and gas exploration and production,       sharply, especially along the west coast, and the loca-
have increased and are likely to continue to do so in      tion of the MIZ shifted northward (Hamilton et al.
Arctic regions as sea-ice declines reduce logistical       2015, Pavlova et al. 2019). These changes were due
challenges for these industries (Reeves et al. 2014,       in part to an increase in the temperature of Atlantic
Meredith et al. 2019). Thus, there is an acute need to     Water, in combination with more frequent penetra-
identify important areas for marine mammals to             tion of Atlantic Water across the polar front, which,
allow for proper management and conservation of            among other effects, has led to a ‘borealization’ of the
these species in the context of these multiple stres-      fish and invertebrate communities in the Barents Sea
sors (e.g. Kovacs et al. 2011, Reeves et al. 2014,         (Fossheim et al. 2015, Tverberg et al. 2019). Levels of
Yurkowski et al. 2019).                                    human activity in the Greenland and Barents Seas
   Numerous marine mammal species inhabit the              are increasing concomitant with the ongoing envi-
Greenland Sea and the northern Barents Sea. Three          ronmental changes. The Barents Sea (including the
cetacean species (bowhead whale Balaena mystice-           Svalbard Archipelago) is one of the most heavily traf-
tus, narwhal Monodon monoceros and white whale             ficked regions in the High Arctic (Reeves et al. 2014).
[beluga whale] Delphinaterus leucas) and the polar         For example, the number of cruise vessels docking in
bear Ursus maritimus are Arctic endemic species that       Longyearbyen, the main settlement in Svalbard,
reside in these areas throughout the year (Kovacs et       tripled between 2007 and 2019 (Port of Longyear-
al. 2009, 2011). This region of the North Atlantic Arc-    byen 2020). Fishing activity is also expanding further
tic also contains 6 pinniped species. Three of these       north as sea ice recedes and currently occurs up to
species (ringed seal Pusa hispida, bearded seal Erig-      the northern ice edge, north of Svalbard (Reeves et
nathus barbatus and Atlantic walrus Odobenus ros-          al. 2014, ICES 2019). Hydrocarbon provinces are
marus rosmarus) are endemic to the Arctic and live         found throughout the Barents Sea and along the
in close association with sea ice throughout the year.     coast of East Greenland. Noise from air guns is al-
The harp seal Pagophilus groenlandicus and hooded          ready heard throughout the year in the western Fram
seal Cystophora cristata are also dependent on sea         Strait (Ahonen et al. 2017). Offshore oil and gas
ice. These species use the marginal ice zone (MIZ) in      exploration and land-based mining are currently in
the Greenland Sea for pupping, nursing and moult-          the planning stage in East Greenland; some of these
ing during the spring but are generally found in open      planned activities would involve extensive year-
water areas during the rest of the year (Kovacs et al.     round shipping (Reeves et al. 2014).
2009, 2011). The harbour seal Phoca vitulina is gen-          The large-scale environmental changes and in-
erally considered to be a temperate seal species, but      creasing levels of human activities in the Northeast
a population resides year round on the west coast of       Atlantic Arctic create a need to identify marine mam-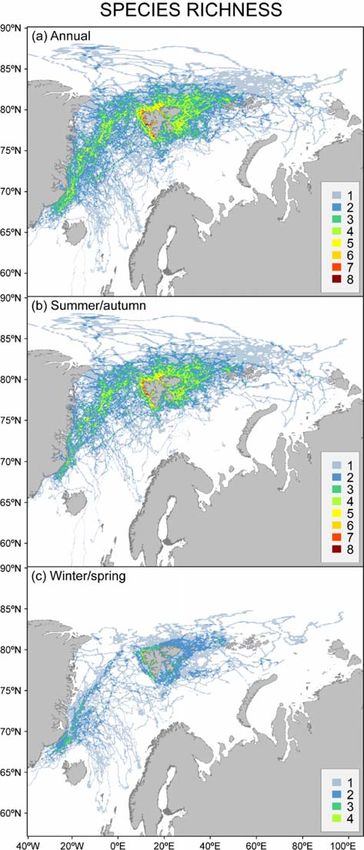
Hamilton et al.: Marine mammal hotspots                                    5

mal hotspots to help guide management and conser-          zone with large intra- and inter-annual variability in
vation efforts. Observational data are limited from        both its location and extent; it varies from being a few
these areas due to a combination of factors, including     kilometres wide up to hundreds of kilometres wide.
few human communities, large expanses of sea ice,          The summer productivity pulse makes the MIZ an
low levels of light up to 6 mo of the year and the cryp-   important foraging area for many species (Sakshaug
tic, dispersed nature of many marine mammal spe-           et al. 2009), including a variety of marine mammals.
cies. In this study, data from 585 biotelemetry instru-
ments deployed on 13 species of marine mammals
(2005−2019) in the Greenland and northern Barents                         2.2. Tagging information
Seas (by 11 scientific institutes) were collated in
order to investigate the occurrence of marine mam-            Five hundred and eighty-five biotelemetry devices
mal hotspots and areas of high species richness. Dis-      were deployed on animals from 13 species between
crepancies between a species’ range and hotspot            2005 and 2019 in and around Svalbard and Northeast
coverage serve as a gap analysis that will help iden-      Greenland (see Table 1, Fig. 2 and the text in the
tify regions and species where more research effort is     Supplement at www.int-res.com/articles/suppl/m659
required. Threats to marine mammals within identi-         p003_supp.pdf for capture and instrumentation de-
fied hotspots areas are also discussed.                    tails). The data include tags deployed on 10 species
                                                           that are resident in this area throughout the year
                                                           (ringed seal Pusa hispida, bearded seal Erignathus
          2. MATERIALS AND METHODS                         barbatus, harbour seal Phoca vitulina, walrus Odobe-
                                                           nus rosmarus, harp seal Pagophilus groenlandicus,
                   2.1. Study area                         hooded seal Cystophora cristata, polar bear Ursus
                                                           maritimus, bowhead whale Balaena mysticetus, nar-
   Biotelemetry data were collected from marine            whal Monodon monoceros and white whale Delphi-
mammals tagged around the Svalbard Archipelago,            napterus leucas) and 3 seasonally resident species
in the northern Barents Sea, Fram Strait and along         (blue whale Balaenoptera musculus, fin whale Bal-
the northeast coast of Greenland (northwards of            aenoptera physalus and humpback whale Megaptera
68°N) during the last 15 years (2005−2019). The final      novaeangliae; see Table 1 & Fig. 2 for more details).
area shown in the maps was from 58 to 90°N and                Positions were calculated by the Argos satellite
40°W to 100°E (Fig. 1).                                    system (CLS 2016) or transmitted via the Argos or
   The Greenland Sea (including the Fram Strait,           Iridium satellite systems (Iridium Satellite Communi-
Denmark Strait and the continental shelf of East           cations) in the case of GPS data (Table 1). The single
Greenland) and the Barents Sea form the connection         exception was walrus GPS data from Svalbard,
between the Northeast Atlantic Ocean and the Arctic        which were transmitted to logging stations posi-
Ocean (Fig. 1). The Barents Sea is moderately              tioned at 7 terrestrial haul-out sites. All pinnipeds,
shallow (average depth: 230 m; maximum depth:              except walruses, transmitted haul-out data either as
~500 m) whereas the Greenland Sea is deeper (aver-         the start and end times of individual haul-out events
age depth: 1444 m; maximum depth: 4846 m). The             (tags produced by Sea Mammal Research Unit In-
Barents Sea is also more exposed to warm Atlantic          strumentation, University of St Andrews, St Andrews,
Water than the Greenland Sea. The West Spitsbergen         Scotland) or as the proportion of time hauled out
Current (a branch of the North Atlantic Current)           each hour (tags produced by Wildlife Computers,
flows northwards along the west coast of Svalbard, on      Redmond, WA). All tracking data from the summer of
the eastern edge of the Greenland Sea, transporting        2005 until 31 December 2018 were included in the
warm Atlantic Water into the Arctic Ocean (Ingvald-        analyses herein.
sen & Loeng 2009). The East Greenland Current                 Animal handling and tagging procedures in Nor-
transports cold Arctic Water and sea ice southwards        wegian territories were approved by the Norwegian
through the Fram Strait over the continental shelf of      Animal Research Authority (before 2015) or the Nor-
the east coast of Greenland (Rudels et al. 2002). The      wegian Food Safety Authority (from 2015), and for
sea-ice maximum and minimum in this region occur           animals captured in Svalbard, permits were also
in April and September, respectively (Fig. 1). The         issued by the Governor of Svalbard. Animal handling
MIZ is defined as the area between the open ocean          and tagging procedures in Greenland were approved
and the pack-ice with sea-ice concentrations be-           by the Greenland Institute of Natural Resources and
tween 15 and 80% (Fig. 1). It is a highly dynamic          the Government of Greenland.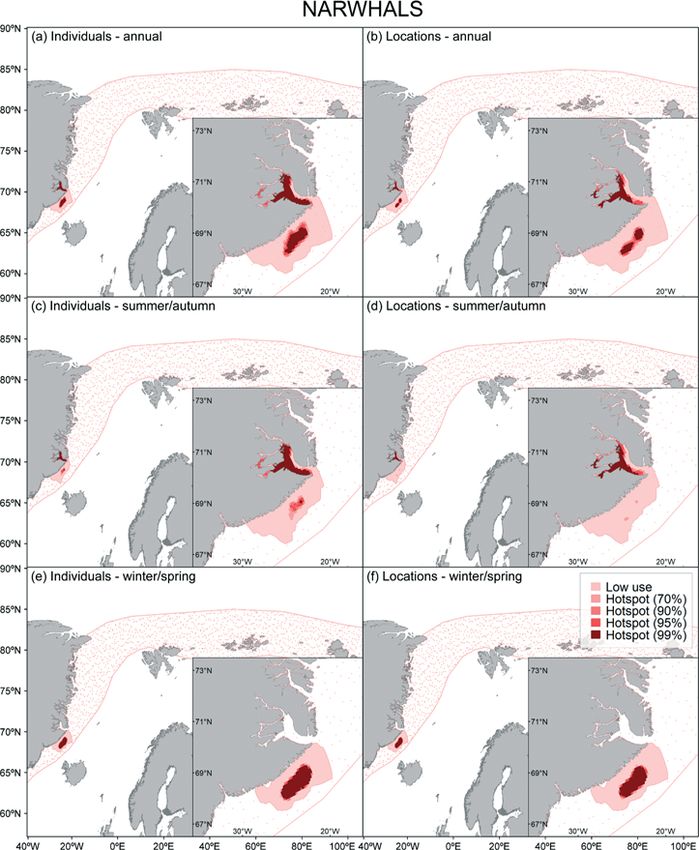
6 Mar Ecol Prog Ser 659: 3–28, 2021
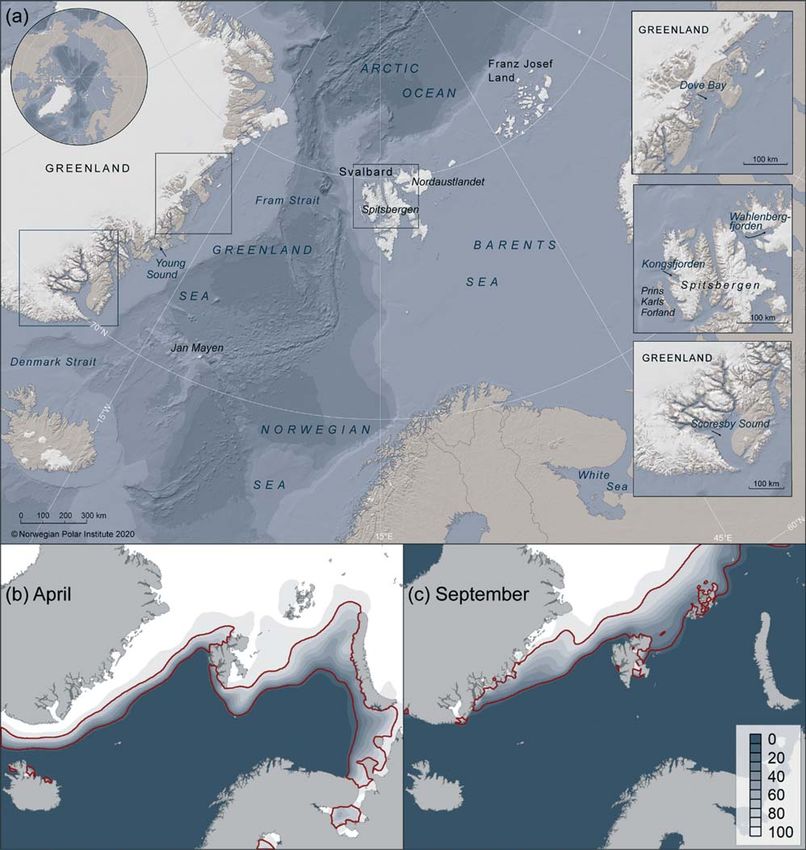
Fig. 1. Map of the study area showing (a) the major place names, ocean areas (in italic font), islands and fjords mentioned in
the main text and (b,c) mean sea-ice concentrations (0−100%) for April and September from 2005 to 2018. The 2 red lines indi-
cate the margins of the 15% and 80% sea-ice concentrations (i.e. they encompass the marginal ice zone). Sea-ice data were
not available for some coastal areas in this region, shown in dark grey
2.3. Location filtering Freitas et al. 2008) for all species, except for wal-
ruses, blue whales, bowhead whales and fin whales.
All data handling and statistical analyses were per- Walruses from Svalbard transmitted GPS locations
formed using R version 3.5.3 (R Core Team 2019). and walruses from East Greenland had Argos loca-
Argos positions were filtered using the SDA filter tions that were filtered using the Douglas Argos filter
(argosfilter package; Table S1 in the Supplement; (Douglas et al. 2012). SDA filter results for blue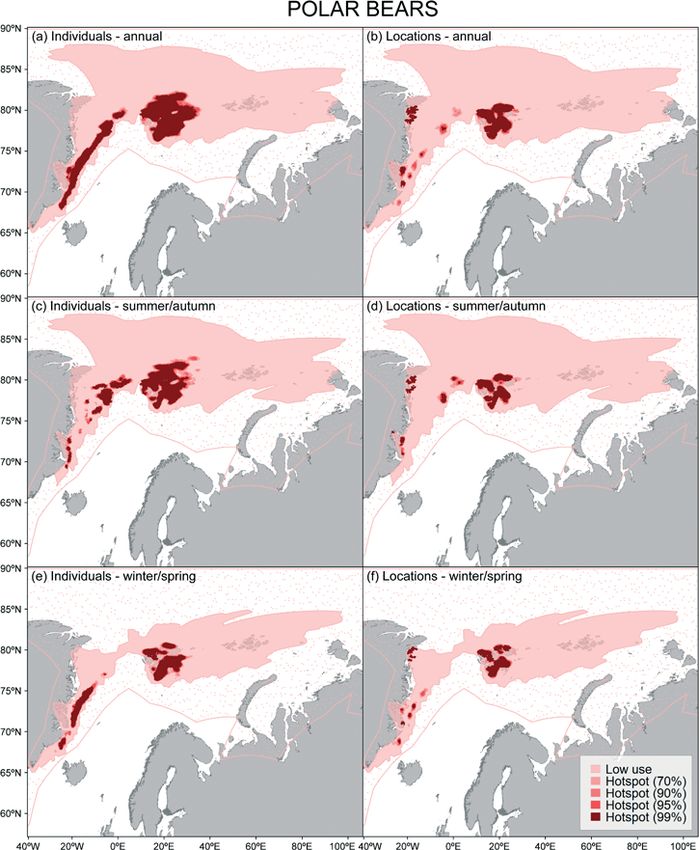
Hamilton et al.: Marine mammal hotspots                                                7

Table 1. Overview of the species included in the hotspot analyses including the number of tags deployed and number of ani-
mals tagged in different tagging locations, time period of tracking, seasonal coverage, age classes, tag manufacturers, position
type (Argos, GPS or both) and sources (including references for published data sets) for marine mammals tagged around Sval-
bard and Northeast Greenland. Age classes include pups (P), sub-adults (S) and adults (A). Note: some polar bears were
tagged multiple times in Svalbard; 1 ringed seal in Svalbard was also tagged 2 times. Tag manufacturers include Sea Mammal
Research Unit Instrumentation (SMRU), Wildlife Computers (WC), Sirtrack, Telonics and Advanced Telemetry Systems (ATS)

 Species          Tagging      No. of   No. of Time period Seasonal         Age         Tag    Position Source
                  location    tags de- animals             coverage        classes     manu-    type
                               ployed tagged                                          facturer

 Ringed seals     Svalbard      53        52      2010−2018     Jul−May      S/A      SMRU       Both    Hamilton et al.
                                                                                                         2015, 2016
                  Northeast     20        20      2017−2018 Aug−May          S/A     SMRU/WC Both        Supplement
                  Greenland
 Bearded seals    Svalbard      20        20      2005−2013 Jun−May          P/A      SMRU       Both    Hamilton et al.
                                                                                                         2018, 2019b
 Harbour seals    Svalbard      60        60      2009−2011 Jun−May         P/S/A     SMRU       Argos   Blanchet et al.
                                                                                                         2014, 2016
 Walruses         Svalbard      33        33      2014−2018 Jun−May           A       Sirtrack   GPS     Supplement
                  Northeast     18        18      2008−2010 Jul−Jan           A         WC       Argos   Supplement
                  Greenland
 Harp seals       Greenland     20        20      2017−2018 Jun−May           P      SMRU/WC Both        Supplement
                  Sea
 Hooded seals     Greenland     20        20      2007−2009 Jun−May         P/S/A     SMRU       Argos   Vacquié-Garcia
                  Sea                                                                                    et al. 2017a
 Polar bears      Svalbard      214      142      2005−2019 Jun−May          S/A   Telonics, GPS         Lone et al. 2018
                                                                                 Sirtrack, ATS
                  Northeast     21        21      2007−2009 Jun−May          S/A    Telonics GPS         Laidre et al. 2013,
                  Greenland                                                                              2015b
 Bowhead          Greenland/    23        23        2010,   Jun−May           A         WC       Argos   Lydersen et al. 2012,
 whales           Fram Strait                     2017−2019                                              Kovacs et al. 2020b
 Narwhals         Northeast     39        39      2010−2017 Jun−May           A         WC       Both    Heide-Jørgensen
                  Greenland                                                                              et al. 2015
 White whales     Svalbard      18        18      2013−2017     Jul−Feb       A       SMRU       Argos   Vacquié-Garcia et
                                                                                                         al. 2018
 Blue whales      Svalbard      10        10      2014−2018 Aug−Dec           A         WC       Argos   Supplement

 Fin whales       Svalbard       6         6      2015−2018    Sep−Dec        A         WC       Argos   Supplement

 Humpback         Barents Sea 10          10      2018−2019    Sep−Dec        A         WC       Argos   Supplement
 whales
 Total (13 species)             585      512      2005−2019 Jun−May

whales, bowhead whales and fin whales were deemed                 locations over 5 d long were removed from the data-
to be too conservative, despite trying different maxi-            set. The narwhal data had duty cycles of varying
mum movement speeds and turning angles, so loca-                  lengths beginning in either September or October
tions for these 3 species were filtered by removing               (see Heide-Jørgensen et al. 2015 for details); loca-
quality Z locations (i.e. invalid locations) and manu-            tions were used only from days when transmissions
ally removing large location spikes resulting from                occurred.
Argos error. All species and location types (Argos                   A land shapefile for the NE Atlantic was made by
and GPS) were subsequently filtered using the con-                combining 3 sources: (1) the Global Self-consistent,
tinuous-time correlated random walk model (CTCRW                  Hierarchical, High-resolution Geography Database
model, crawl package; Johnson et al. 2008) with a                 (GSHHG) full-resolution coastline shapefile (version
stopping model incorporated to account for time                   2.3.7; Wessel & Smith 1996); (2) a coastline shapefile
spent hauled out for all pinnipeds except walruses.               for Svalbard (Norwegian Polar Institute; www.npolar
Locations every second hour were interpolated from                .no); and (3) a coastline shapefile for Greenland
the CTCRW model for each animal. Interpolated                     (Danish Geodata Agency; www.eng.gst.dk). On-land
locations that occurred during gaps in transmitted                locations were moved to the closest ‘in water’ loca-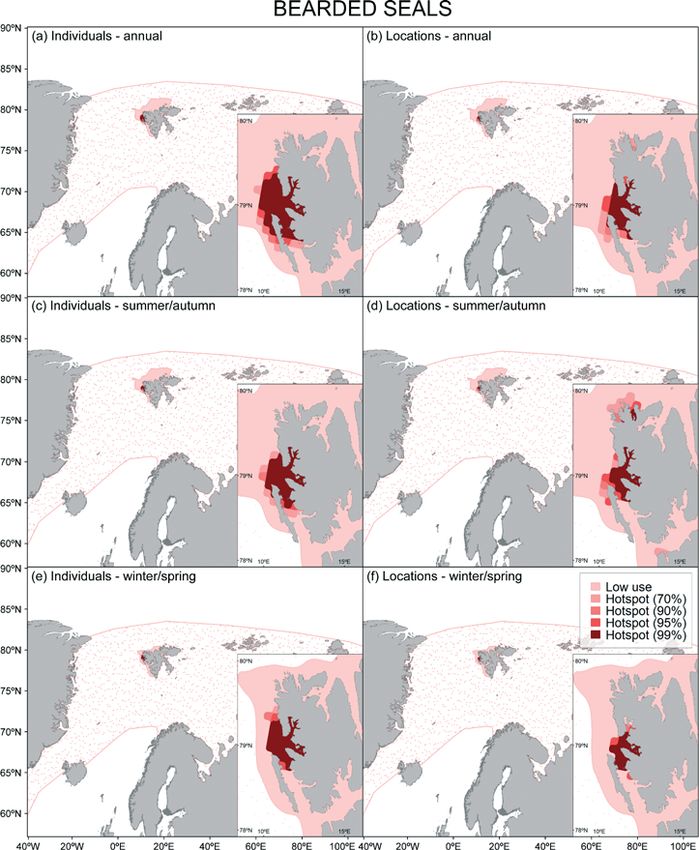
8                                            Mar Ecol Prog Ser 659: 3–28, 2021

Fig. 2. Capture locations for 13 marine mammal species (including 3 seasonally resident whale species) used in the analysis of
marine mammal hotspots in the Greenland and northern Barents Seas. (a) Ringed seals, harp seals and harbour seals;
(b) bearded seals, white whales, hooded seals and narwhals; (c) walruses, bowhead whales and seasonally-resident whales;
                                                      (d) polar bears

tion (in time) for each individual (except for polar             intra-annual variation in sea-ice extent (Fig. 1) and
bears). Locations were subsequently rasterized into a            species’ movement and behaviour patterns on a sea-
10 × 10 km grid, and the number of individuals of                sonal basis. Various hotspot methods were explored
each species (individual hotspots analysis), the num-            including the percent volume method (Citta et al.
ber of locations for each species (location hotspots             2018), the lattice-based density estimator (Barry & Mc-
analysis) and the number of species (species rich-               Intyre 2011), the kernel home range method (package
ness) in each grid cell were calculated. A 10 × 10 km            adehabitatHR; Calenge 2006) and the Getis−Ord Gi*
grid was chosen as a compromise between showing                  method (Getis & Ord 1992, Ord & Getis 1995). The
large-scale patterns across the Greenland and Bar-               Getis−Ord Gi* method was chosen because it includes
ents Seas and showing patterns within small fjords in            values of neighbouring points, has a rapid computa-
Svalbard and Greenland (e.g. Kongsfjorden, a fjord               tional run time and excludes land areas.
in Svalbard with high tagging effort, is ~5 × 20 km).               Individual and location hotspots, based on the num-
                                                                 ber of individuals and locations in grid cells, were
                                                                 calculated using the Getis−Ord Gi* statistic (Getis &
            2.4. Marine mammal hotspots                          Ord 1992; e.g. Queiroz et al. 2016, Yurkowski et al.
                                                                 2019). The Getis−Ord Gi* statistic identifies local
  Marine mammal hotspots were calculated in order                spatial patterns in a dataset by measuring the con-
to identify areas that are heavily used by different             centration of a variable around a point. It compares
marine mammal species in the Greenland and north-                the local sum of values within a specified distance of
ern Barents Seas. Hotspot analyses were run for the              a point (i.e. a point and its neighbours) to an
whole year as well as for summer/autumn (Jun−Dec)                expected local sum (drawn without replacement
and winter/spring (Jan−May) periods to account for               from all points in the dataset). If the calculated local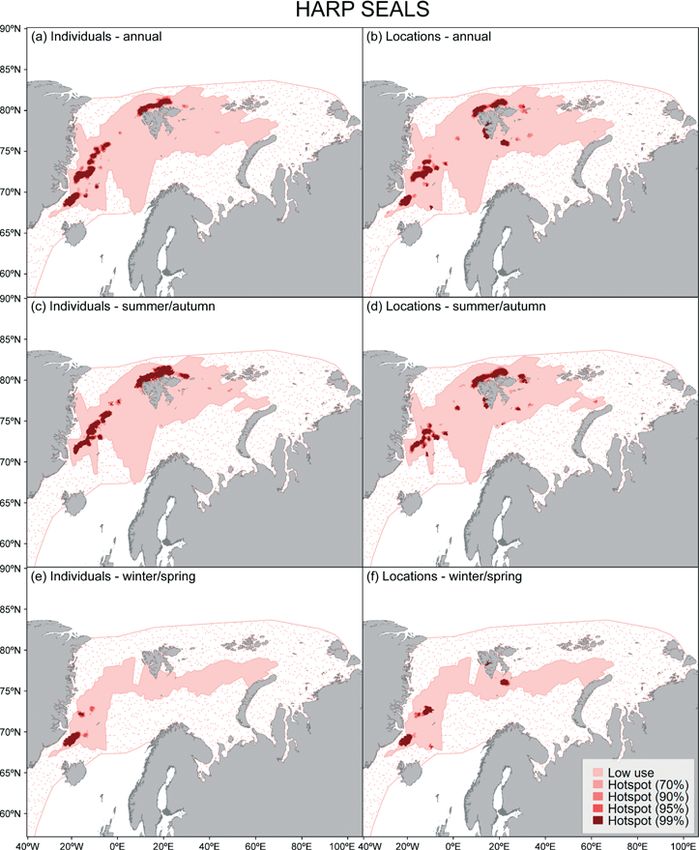
Hamilton et al.: Marine mammal hotspots                                         9

sum is larger than the expected local sum, and the                Four hotspot levels were plotted: 99% (z ≥ 2.58, p ≤
difference is too large to be the result of random              0.01), 95% (z ≥ 1.96, p ≤ 0.05), 90% (z ≥ 1.65, p ≤ 0.1)
chance, a statistically significant positive z-score is         and 70% (z ≥ 1.15, p ≤ 0.3), following Getis & Ord
assigned to that point (Getis & Ord 1992, Ord & Getis           (1992). Low-use areas (z < 1.15, p > 0.3) were plotted
1995). Individual hotspots identify areas used by the           as a continuous polygon that encompassed all areas
majority of the tagged animals, while location hot-             used by each species. Coldspots (i.e. areas with sig-
spots identify areas heavily used, sometimes by only            nificant negative autocorrelation) were not plotted as
a small portion of the tagged animals.                          they indicate areas infrequently used by tracked ani-
   All individuals and locations were given equal               mals, not necessarily areas infrequently used by the
weighting in the hotspot analysis conducted for each            species. The range for each species was downloaded
species. The equal-weighting option was chosen to               from the International Union for the Conservation of
avoid relying on potentially erroneous assumptions              Nature (IUCN) Red List of Threatened Species
about the representativeness of the data in different           (IUCN 2020) and plotted to show the hotspots in the
locations and time intervals. Ringed seal, walrus and           context of where each species is likely to be found in
polar bear hotspots were calculated separately for              the study area. The amount of overlap between high
animals tagged in Svalbard and Northeast Green-                 hotspot levels (i.e. 95% and 99%) and high levels of
land due to these areas having separate populations;            species richness (≥ 4 species for annual and sum-
sample sizes also differed in the 2 areas (see Figs.            mer/autumn, ≥ 2 species for winter/spring) was also
S1−S3 in the Supplement for hotspot results when                calculated.
analyses were run for Svalbard and Northeast                      Null models were created for the Getis−Ord Gi*
Greenland combined). For the ‘all species’ hotspot              statistic for each species and all species combined
analysis, each species was given an equal weight                to represent where individual and location hotspots
when calculating the number of individuals and loca-            would be expected given the tagging locations
tions in each grid cell. The localG function in the             and movement patterns of each species (see
spdep package (Bivand & Wong 2018) was used to                  Queiroz et al. 2016, Yurkowski et al. 2019). The
calculate the Getis−Ord Gi* statistic. The number of            basis for the null models comprised simulated cor-
neighbours for each grid cell was defined as the                related random walks created for each species
number of grid cells within the distance that maxi-             using Weibell distributed step lengths and Von
mized spatial autocorrelation for each species, found           Mises distributed turning angles. The step lengths
by calculating the global Getis−Ord Gi* statistic in            and turning angles for each species were used to
10 km increments from 10 to 200 km (globalG.test                create the relevant distributions for the simulated
function in spdep package, Table S2 in the Supple-              tracks. The maximum step length for each species
ment; Ord & Getis 1995, Bivand & Wong 2018).                    was used to set an upper limit on the step lengths

Table 2. Total, mean (± SD) and maximum tracking duration (d) and the month of tagging for animals in each of the 13 marine
                             mammal species tagged around Svalbard and Northeast Greenland

 Species            Total tracking       Tracking duration       Maximum tracking         Tagging month
                     duration (d)         (d; mean ± SD)           duration (d)

 Ringed seals          12 452                171 ± 66                   305               Jul−Aug
 Bearded seals          3625                 181 ± 106                  367               Pups: May
                                                                                          Adults: Jul−Aug
 Harbour seals         11 369                189 ± 107                  392               Pups: Jun−Jul
                                                                                          Sub−adults/adults: Aug−Sep
 Walruses              12 033                236 ± 351                 1485               Jul−Aug
 Harp seals             3559                 178 ± 143                  400               Apr
 Hooded seals           3280                 164 ± 128                  424               Mar & Jul
 Polar bears           72 710                309 ± 236                 1192               Mar−Apr & Aug
 Bowhead whales         3164                 144 ± 152                  613               Jun & Sep
 Narwhals               5577                 143 ± 88                   420               Aug−Sep
 White whales           1585                  88 ± 59                   191               Jul−Aug
 Blue whales              244                 27 ± 19                    61               Aug−Oct
 Fin whales              193                  32 ± 22                    64               Sep
 Humpback whales         894                  89 ± 31                   118               Sep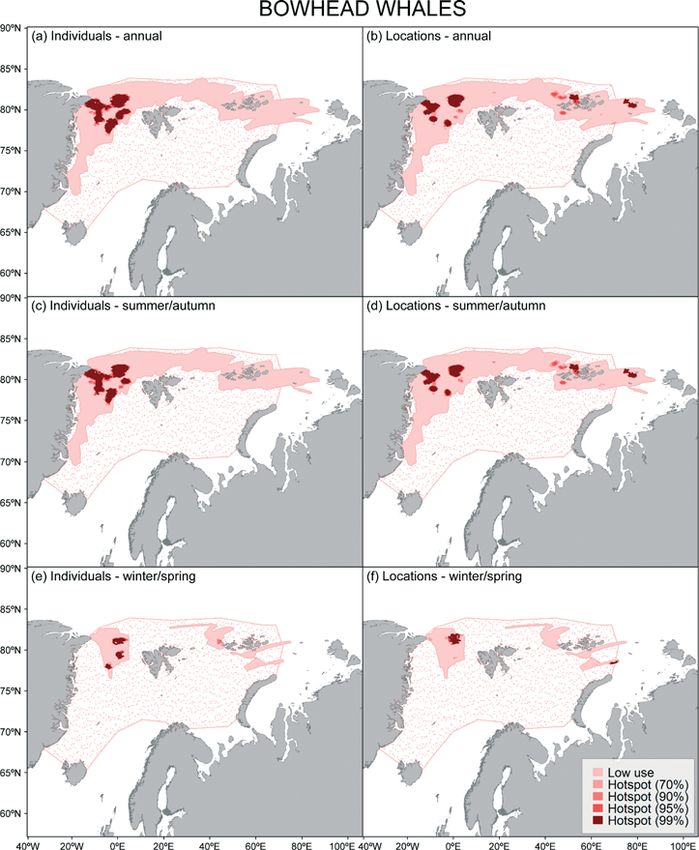
10                                            Mar Ecol Prog Ser 659: 3–28, 2021

Fig. 3. Getis−Ord Gi* (a,c,e) individual hotspots and (b,d,f) location hotspots for 73 ringed seals tagged in Svalbard and North-
east Greenland over (a,b) the entire year, (c,d) during the summer/autumn and (e,f) during the winter/spring. Inset maps show
hotspots in East Greenland (left) and northern Svalbard (right). Increasing intensities of red indicate hotspots of different
levels of statistical significance; the pink dotted polygon shows the species’ range. The analysis was run for ringed seals
                                     tagged in Svalbard and Northeast Greenland separately

selected for the simulations. One correlated random                                       3. RESULTS
walk was simulated for each individual in each
species; the simulated track had the same starting                                3.1. Species distributions
location and the same number of steps as the indi-
vidual’s observed track. The simulated tracks for                    3.1.1. Ringed seals Pusa hispida. Ringed seals
each species (except for polar bears) were con-                    mainly occupied coastal areas in Northeast Green-
strained to the ocean. A null model for species                    land and Svalbard (Fig. 3, Tables 1 & 2), though some
richness was also made from the simulated corre-                   ringed seals from Svalbard took trips offshore in the
lated random walks. The amount of overlap be-                      summer and autumn, ranging as far east as the Kara
tween high marine mammal hotspot levels and                        Sea and as far north as the Arctic Ocean north of the
high null model hotspot levels (i.e. 95% and 99%)                  Fram Strait. Some of the ringed seals from Northeast
was also calculated.                                               Greenland also used offshore areas on the East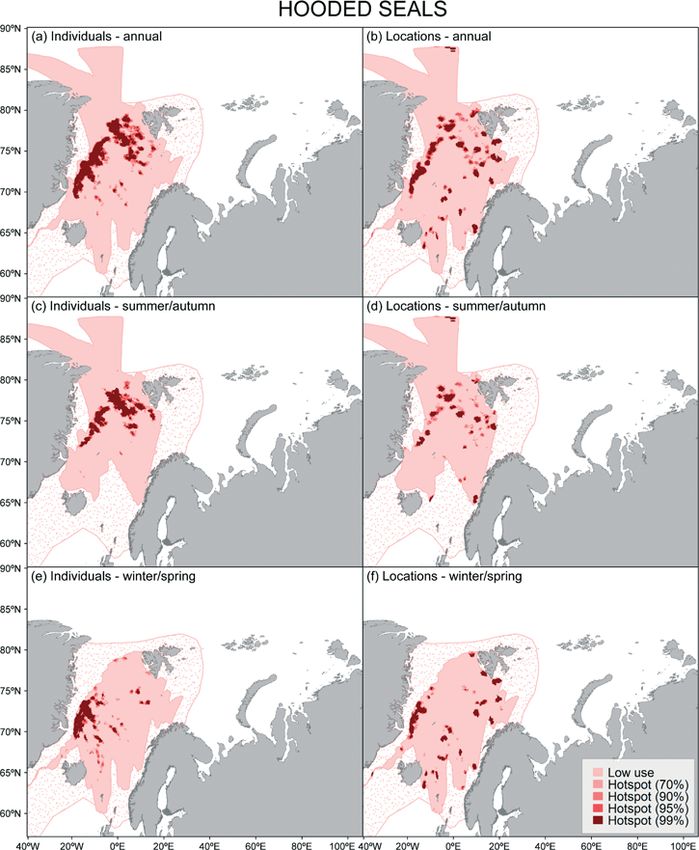
Hamilton et al.: Marine mammal hotspots                                         11

Fig. 4. Getis−Ord Gi* (a,c,e) individual hotspots and (b,d,f) location hotspots for 20 bearded seals tagged in Svalbard over
(a,b) the entire year, (c,d) during the summer/autumn and (e,f) during the winter/spring. Inset maps show hotspots in north-
                                          western Svalbard. Details as in Fig. 3 legend

Greenland continental shelf. Ringed seals had wider               3.1.2. Bearded seals Erignathus barbatus. Beard-
distributions in the summer/autumn than in the                  ed seals were located in shallow areas along the
winter/spring (Fig. 3). Hotspots (both individual and           western and northern coasts of Svalbard and
location) were found in coastal regions of Svalbard             hotspots (both individual and location) were located
and Northeast Greenland (Fig. 3). Null model                    in north-western Svalbard (Fig. 4, Tables 1 & 2). Null
hotspots for ringed seals were in northwestern Sval-            model hotspots for bearded seals were also located in
bard, in Wahlenbergfjorden (a fjord in Nordaust-                north-western Svalbard, near the area where the
landet, NE Svalbard) and in Dove Bay (Greenland),               animals were tagged (Figs. 2b, S4c,d). Highly signif-
in the vicinities where tagging took place for this             icant null model hotspot levels (95% and 99%) over-
species (Fig. 2a, Fig. S4a,b in the Supplement).                lapped bearded seal hotspots (95% and 99%) by
Highly significant null model hotspot levels (95%               81% and 90% for individual and location hotspots,
and 99%) overlapped ringed seal hotspots (95% and               respectively (Table 3).
99%) by 21% and 59% for individual and location                   3.1.3. Harbour seals Phoca vitulina. Harbour seals
hotspots, respectively (Table 3).                               were located mainly in western Svalbard, both in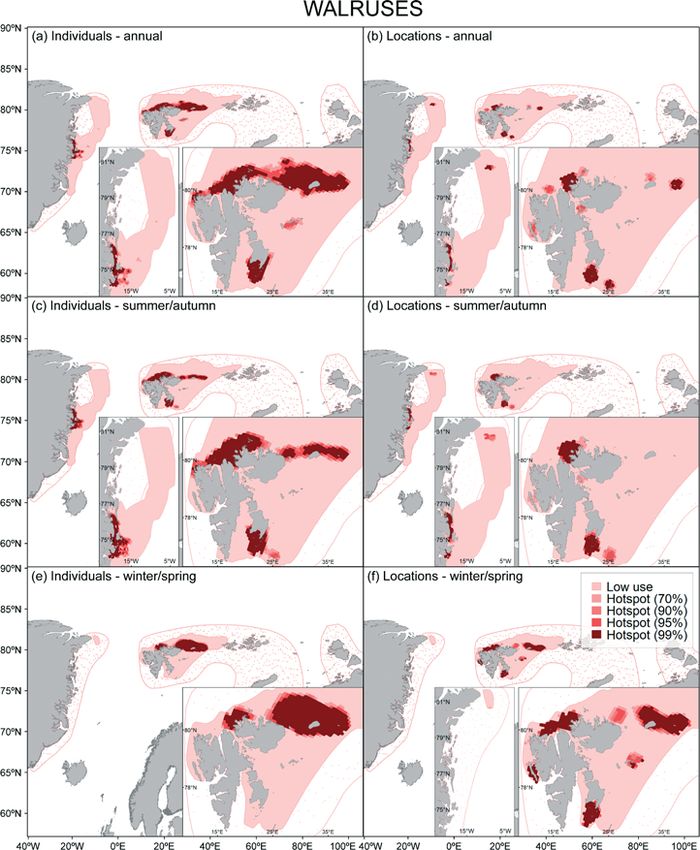
12                                          Mar Ecol Prog Ser 659: 3–28, 2021

Fig. 5. Getis−Ord Gi* (a,c,e) individual hotspots and (b,d,f) location hotspots for 60 harbour seals tagged in Svalbard over
(a,b) the entire year, (c,d) during the summer/autumn and (e,f) during the winter/spring. Inset maps show hotspots in north-
                                          western Svalbard. Details as in Fig. 3 legend

coastal areas and over the continental shelf. Some              65% and 60% for individual and location hotspots,
harbour seals travelled to northern Svalbard and                respectively (Table 3).
south as far as Bjørnøya (Fig. 5, Tables 1 & 2). Hot-             3.1.4. Walruses Odobenus rosmarus. Walruses
spots (both individual and location) were located in            were located in coastal areas of Northeast Greenland
north-western Svalbard. Individual hotspots and                 and in the northern Barents Sea. Hotspots (both indi-
winter/spring hotspots covered a larger area than               vidual and location) were located along the north-
location hotspots and summer/autumn hotspots                    eastern coast of Greenland between 74 and 81° N, in
(Fig. 5). Null model hotspots for harbour seals were            southern and northern Svalbard, and in Russian
located in western Svalbard, west of their tagging              waters between Svalbard and Franz Josef Land
area in Forlandsøyene, just west of Prins Karls For-            (Fig. 6, Tables 1 & 2). Individual hotspots covered a
land (Fig. 2a, Fig. S4e,f in the Supplement). Highly            wider geographical area than location hotspots
significant null model hotspot levels (95% and 99%)             (Fig. 6). Location hotspots were also located in North-
overlapped harbour seal hotspots (95% and 99%) by               east Greenland (i.e. in the Northeast Water Polynya)
Hamilton et al.: Marine mammal hotspots 13
Fig. 6. Getis−Ord Gi* (a,c,e) individual hotspots and (b,d,f) location hotspots for 51 walruses tagged in Svalbard and Northeast
Greenland over (a,b) the entire year, (c,d) during the summer/autumn and (e,f) during the winter/spring. Inset maps show
hotspots in East Greenland (left) and Svalbard (right). There were no individual hotspots during the winter/spring for walruses
tagged in East Greenland. Details as in Fig. 3 legend. The analysis was run for walruses tagged in Svalbard and
Northeast Greenland separately
Table 3. Amount (%) that null models of Getis−Ord Gi* hotspots (95% and 99%) overlapped hotspots (95% and 99%) made
from tracks of 13 marine mammals (including 3 seasonally resident whale species) in the Greenland and Barents Seas
Overlap (%) Overlap (%)
Species Individual Location Species Individual Location
hotspots hotspots hotspots hotspots
Ringed seals 21 59 Polar bears 31 70
Bearded seals 81 90 Bowhead whales 5 2
Harbour seals 65 60 Narwhals 43 34
Walruses 20 39 White whales 13 9
Harp seals 18 9 Seasonally resident whales 26 29
Hooded seals 20 18 All species 30 3414 Mar Ecol Prog Ser 659: 3–28, 2021 Fig. 7. Getis−Ord Gi* (a,c,e) individual hotspots and (b,d,f) location hotspots for 20 harp seals tagged in the Greenland Sea over (a,b) the entire year, (c,d) during the summer/autumn and (e,f) during the winter/spring. Details as in Fig. 3 legend in the summer/autumn, in western Svalbard in the model hotspot levels (95% and 99%) overlapped winter/spring and covered a wider distributional walrus hotspots (95% and 99%) by 20% and 39% area in the winter/spring around the Svalbard Archi- for individual and location hotspots, respectively pelago than in the summer/autumn (Fig. 6). A lack of (Table 3). hotspots for walruses in Northeast Greenland in the 3.1.5. Harp seals Pagophilus groenlandicus. Harp winter/spring is due to only 2 of the 18 walruses seals occupied the Greenland Sea and the northern transmitting location data after December, with both Barents Sea (Fig. 7, Tables 1 & 2). Hotspots (both of these data streams terminating in January. Null individual and location) were concentrated in the model hotspots for walruses were mainly situated MIZ in the Greenland Sea and in northern Svalbard. around northern and south-eastern Svalbard and Location hotspots were also found in western and around Young Sound in East Greenland, near the southern Svalbard (Fig. 7). Summer/autumn hotspots area where the walruses were tagged (Fig. 2c, covered a larger area in the Barents Sea than Fig. S5a,b in the Supplement). Highly significant null winter/spring hotspots. Null model hotspots for harp
Hamilton et al.: Marine mammal hotspots                                           15

Fig. 8. Getis−Ord Gi* (a,c,e) individual hotspots and (b,d,f) location hotspots for 20 hooded seals tagged in the Greenland Sea
  over (a,b) the entire year, (c,d) during the summer/autumn and (e,f) during the winter/spring. Details as in Fig. 3 legend

seals were situated in the Greenland Sea near the                 west and south of Svalbard and close to the Norwe-
areas where they had been tagged (Fig. 2a,                        gian coast (Fig. 8). Null model hotspots for hooded
Fig. S5c,d in the Supplement). Highly significant null            seals were located in the Greenland Sea in the vicin-
model hotspot levels (95% and 99%) overlapped                     ity of where they had been tagged (Fig. 2b, Fig. S5e,f
harp seal hotspots (95% and 99%) by 18% and 9%                    in the Supplement). Highly significant null model
for individual and location hotspots, respectively                hotspot levels (95% and 99%) overlapped hooded
(Table 3).                                                        seal hotspots (95% and 99%) by 20% and 18% for
  3.1.6. Hooded seals Cystophora cristata. Hooded                 individual and location hotspots, respectively
seals were mainly located in the Greenland Sea and                (Table 3).
off the west coast of Svalbard (Fig. 8, Tables 1 & 2).               3.1.7. Polar bears Ursus maritimus. Polar bears
Hotspots (both individual and location) were mainly               were found in the Greenland Sea, northern Barents
in the deep areas of the Greenland Sea. Location                  Sea and Arctic Ocean (Fig. 9, Tables 1 & 2). Hotspots
hotspots were also found on the continental shelf                 (both individual and location) were found in coastal
16                                           Mar Ecol Prog Ser 659: 3–28, 2021

Fig. 9. Getis−Ord Gi* (a,c,e) individual hotspots and (b,d,f) location hotspots for 235 polar bears tagged around Svalbard and
Northeast Greenland over (a,b) the entire year, (c,d) during the summer/autumn and (e,f) during the winter/spring. Details
         as in Fig. 3 legend. The analysis was run for bears tagged in Svalbard and Northeast Greenland separately

and offshore areas of Northeast Greenland and                    year-round in coastal regions and show strong site
around the Svalbard Archipelago (Fig. 9). Most of the            fidelity (Boertmann & Mosbech 2012, Laidre et al.
coastal hotspots in Northeast Greenland corre-                   2015b, 2018). Null model hotspots for polar bears
sponded to denning locations identified in Laidre et             were situated around the Svalbard Archipelago and
al. (2015b). Summer−autumn hotspots covered a                    in the Greenland Sea (Fig. 2d, Fig. S6a,b in the Sup-
wider area around the Svalbard Archipelago and                   plement). Highly significant null model hotspot lev-
were found further north in the MIZ in the Green-                els (95% and 99%) overlapped polar bear hotspots
land Sea compared to winter/spring hotspots (Fig. 9).            (95% and 99%) by 31% and 70% for individual and
Note that most of the biotelemetry data from North-              location hotspots, respectively (Table 3).
east Greenland were from bears tagged in offshore                  3.1.8. Bowhead whales Balaena mysticetus. Bow-
areas; of the 21 bears tagged in 2007 and 2008, only             head whales were located mainly in the northern
5 were instrumented on coastal land-fast ice in fjords.          Barents and Greenland Seas, within the MIZ (Fig. 10,
Many polar bears in Northeast Greenland reside                   Tables 1 & 2). Hotspots were located in Northeast
Hamilton et al.: Marine mammal hotspots 17
Fig. 10. Getis−Ord Gi* (a,c,e) individual hotspots and (b,d,f) location hotspots for 22 bowhead whales tagged in the marginal
ice zone in the Fram Strait and off of north-eastern Greenland over (a,b) the entire year, (c,d) during the summer/autumn
and (e,f) during the winter/spring. Details as in Fig. 3 legend
Greenland (both individual and location hotspots) within Scoresby Sound (summer hotspots) and at the
and around Franz Josef Land (mainly location edge of the continental shelf outside of the fjord
hotspots; Fig. 10). Summer/autumn hotspots covered (winter hotspots) (Fig. 11, Tables 1 & 2). Null model
a larger geographical area than winter/spring hotspots for narwhals were found in Scoresby Sound,
hotspots (Fig. 10). Null model hotspots for bowheads the main area where the animals had been tagged
were found in Northeast Greenland and in the Fram (Fig. 2b, Fig. S6e,f in the Supplement). Highly signif-
Strait (Fig. 2c, Fig. S6c,d in the Supplement). Highly icant null model hotspot levels (95% and 99%) over-
significant null model hotspot levels (95% and 99%) lapped narwhal hotspots (95% and 99%) by 43%
overlapped bowhead whale hotspots (95% and 99%) and 34% for individual and location hotspots, respec-
by 5% and 2% for individual and location hotspots, tively (Table 3).
respectively (Table 3). 3.1.10. White whales Delphinapterus leucas.
3.1.9. Narwhals Monodon monoceros. Narwhal White whales were found in coastal regions of Sval-
hotspots (both individual and location) were found bard (Fig. 12, Tables 1 & 2). Hotspots (both individual18 Mar Ecol Prog Ser 659: 3–28, 2021
Fig. 11. Getis−Ord Gi* (a,c,e) individual hotspots and (b,d,f) location hotspots for 39 narwhals tagged in Northeast Greenland
over (a,b) the entire year, (c,d) during the summer/autumn and (e,f) during the winter/spring. Inset maps show hotspots
in Northeast Greenland. Details as in Fig. 3 legend
and location) were found in both south-eastern and Hotspots were located around the Svalbard Archi-
south-western Svalbard (Fig. 12). Location hotspots pelago and near Jan Mayen (Fig. 13). Location
were also found in northern Svalbard fjords (Fig. 12). hotspots were also found within Svalbard fjords,
Null model hotspots for white whales were in west- while individual hotspots were found mainly in
ern Svalbard, extending over the continental shelf coastal areas (Fig. 13). Null model hotspots for sea-
break into the Greenland Sea (Fig. 2b, Fig. S7a,b in sonally resident whales were found in western Sval-
the Supplement). Highly significant null model bard and south-east of Nordaustlandet, near the
hotspot levels (95% and 99%) overlapped white areas where these species had been tagged (Fig. 2c,
whale hotspots (95% and 99%) by 13% and 9% for Fig. S7c,d in the Supplement). Highly significant null
individual and location hotspots, respectively (Table 3). model hotspot levels (95% and 99%) overlapped
3.1.11. Seasonally resident whales. Seasonally seasonally resident whale hotspots (95% and 99%)
resident whales were found in the Barents Sea, Green- by 26% and 29% for individual and location hot-
land Sea and Norwegian Sea (Fig. 13, Tables 1 & 2). spots, respectively (Table 3).Hamilton et al.: Marine mammal hotspots 19
Fig. 12. Getis−Ord Gi* (a,c,e) individual hotspots and (b,d,f) location hotspots for 18 white whales tagged in Svalbard over
(a,b) the entire year, (c,d) during the summer/autumn and (e,f) during the winter/spring. Inset maps show hotspots around
the Svalbard Archipelago. Details as in Fig. 3 legend
Fig. 13. Getis−Ord Gi* (a) individual hotspots and (b) location hotspots for blue, fin and humpback whales (total n = 26 sea-
sonally resident whales) tagged around Svalbard. These species were only present in the study area during the
summer/autumn. Inset maps show hotspots around the Svalbard Archipelago. Details as in Fig. 3 legend20 Mar Ecol Prog Ser 659: 3–28, 2021
Fig. 14. Getis−Ord Gi* (a,c,e) individual hotspots and (b,d,f) location hotspots for the 13 species tagged around Svalbard and
Northeast Greenland over (a,b) the entire year, (c,d) during the summer/autumn and (e,f) during the winter/spring. Details
as in Fig. 3 legend
3.2. All species hotspots and species richness for location hotspots compared to individual hotspots
and for the winter/spring period compared to sum-
Hotspots (both individual and location) for all 13 mer/autumn and annual data (Table S3 in the Sup-
marine mammal species were found around the Sval- plement). Null model hotspots for all species were
bard Archipelago, in coastal areas of Northeast found mainly around western and south-eastern
Greenland and in the MIZ of the Greenland and Svalbard and in the Greenland Sea, near the tagging
northern Barents Seas (Fig. 14). These areas coin- areas for the different species (Fig. 2, Fig. S7e,f in the
cided with areas that had the greatest species rich- Supplement). Highly significant null model hotspot
ness (Figs. 15, 16). Up to 90% of the highest values of levels (95 and 99%) overlapped all species hotspots
species richness occurred within high individual (95 and 99%) by 30% and 34% for individual and lo-
hotspot levels (95% and 99%; Table S3 in the Sup- cation hotspots, respectively (Table 3). The highest
plement). Overlap between high values of species values for the species richness null model were also
richness and high hotspot levels was generally less located west of Svalbard (Fig. S8 in the Supplement).Hamilton et al.: Marine mammal hotspots 21
4. DISCUSSION
The MIZ of the Greenland Sea and the northern
Barents Seas and coastal areas in Northeast Green-
land and around the Svalbard Archipelago were
found to be hotspots for a wide range of marine mam-
mal species in the Northeast Atlantic Arctic, as well
as being areas of high species richness. The individ-
ual versus location hotspots results identified a few
important differences. Individual hotspots identified
areas important to the majority of tagged individuals.
Examples of individual hotspot areas include com-
mon resting, moulting, breeding and foraging areas.
Prins Karls Forland and the adjacent continental
shelf are the main breeding, moulting, resting and
foraging locations for harbour seals Phoca vitulina in
Svalbard (Lydersen & Kovacs 2010). Similarly, drift
ice areas within the MIZ are used for breeding,
moulting and resting by harp seals Pagophilus
groenlandicus and hooded seals Cystophora cristata
(Folkow et al. 2004, Vacquié-Garcia et al. 2017a).
Walruses Odobenus rosmarus predominantly forage
near terrestrial haul-out sites (Lowther et al. 2015),
and ringed seals Pusa hispida are found throughout
the year in close association with tidewater glacier
fronts (Hamilton et al. 2016). In contrast, location
hotspots identified areas that are used heavily, in
some cases by only a few of the tagged individuals.
Location hotspots were similar to individual hotspots
for some species, including ringed seals, harbour
seals and harp seals. However, differences in indi-
vidual versus location hotspots were also found,
revealing a discrepancy for some species and regions
between areas frequented by many animals (i.e.
individual hotspots) and areas that are highly used
(not necessarily by the majority of tagged individu-
als; i.e. location hotspots). For these species, areas
where tagged animals congregate (e.g. pupping,
nursing and breeding locations) may not be the same
locations in which individuals spend the majority of
their time. In general, individual and location hotspot
results differed for species where individuals or small
groups forage in different locations across a wide
geographic area or for species that perform impor-
tant life-history behaviours in different locations Fig. 15. Species richness (number of species in each grid
across their range. For example, location hotspots cell) for the 13 species of marine mammals tagged around
identified areas that were previously identified as Svalbard and Northeast Greenland over (a) the entire year,
being foraging areas for hooded seals and bowhead (b) during the summer/autumn and (c) during the winter/
spring
whales Balaena mysticetus (Vacquié-Garcia et al.
2017a, Kovacs et al. 2020a). Previous analyses of the were also found further north in the Svalbard Archi-
polar bear Ursus maritimus data show that many pelago than individual hotspots for white whales and
location hotspots in Northeast Greenland are den- bearded seals, and further west for walruses, indica-
ning sites (Laidre et al. 2015b). Location hotspots ting that these areas were used heavily by only a few22 Mar Ecol Prog Ser 659: 3–28, 2021
Fig. 16. Areas where overlap occurs between high values of Getis−Ord Gi* hotspots (95% and 99%) and areas of high species
richness (4−8 species for annual and summer/autumn analyses and 2−4 species for winter/spring analyses) for (a,c,e) individ-
ual hotspots and (b,d,f) location hotspots over (a,b) the entire year, (c,d) during the summer/autumn and (e,f) during the
winter/spring
of the tagged animals. Location hotspots also covered the population (i.e. location hotspots), particularly for
a smaller geographic area than individual hotspots rare species. Identifying the environmental features
for many species, meaning that areas heavily used underlying important foraging or denning areas will
(i.e. location hotspots) in total covered a smaller geo- allow plans to be expanded to additional foraging
graphic area than regions visited by the majority of and denning areas that were likely used by untagged
tagged animals (i.e. individual hotspots). members of the population. Such measures will be
Both individual and location hotspot results are important for species that forage over large areas
highly relevant for the development of conservation either as single animals or in small groups. Denning
and management plans. In addition to areas impor- areas of polar bears may only be used by small seg-
tant for the majority of the population (i.e. individual ments of the population, but it is important to man-
hotspots), conservation and management plans also age disturbance risks in order to maximize survival of
need to target areas important for small segments of female bears with cubs of the year.Hamilton et al.: Marine mammal hotspots 23 Species richness values overlapped significantly and duration have occurred in coastal regions of with high individual hotspot levels. This overlap was Svalbard over recent decades (Meredith et al. 2019, generally higher around the Svalbard Archipelago Pavlova et al. 2019). Additionally, the number of tide- than in coastal areas of Northeast Greenland. A few water glacier fronts, which are important hotspots for coastal hotspots in Northeast Greenland resulted many Arctic marine mammals, have also decreased from heavy use by a few marine mammal species. in Svalbard (Błaszczyk et al. 2009). Retreat of tidewa- Expanded biotelemetry data collection in Northeast ter glaciers onto land will likely reduce the amount of Greenland, especially on species where biotelemetry upwelling-derived nutrients, and advection towards data are currently lacking (e.g. bearded seals), inner fjords of production arising elsewhere, leading would likely increase the overlap between high spe- to decreases in productivity and accessibility of con- cies richness and hotspot levels in this region. Over- centrated food supplies to higher trophic levels in lap between high values of species richness and these regions (Meredith et al. 2019). Numerous hotspot levels was also higher for individual hotspots changes have already occurred in the distribution, than for location hotspots. Regions important for the behaviour, predator−prey relationships and breed- majority of a tagged population are more likely to ing ecology of Arctic marine mammal species in rela- also be important regions for additional species, in tion to these changes in their habitat (e.g. Hamilton contrast to areas heavily used by smaller segments of et al. 2016, 2017, 2019a, Vacquié-Garcia et al. 2018, a population. Kovacs et al. 2020b). How hotspot locations may shift Similarities and differences among identified in the coming decades and how species will ulti- hotspot areas for individual species highlight the mately fare as the climate continues to warm are cur- ecological niches they each occupy. Bearded seals rently unknown. However, the future breeding suc- and walruses are both benthic foragers that feed in cess of bearded seals and ringed seals in relation to shallow, coastal regions (Lowther et al. 2015, Hamil- earlier melting of the sea ice and reduced opportuni- ton et al. 2018, 2019b), and thus they would be ties for the latter species to build snow lairs are seri- expected to have similar hotspots in regions where ous concerns for the continued existence of these both species are found. Similarities would also be Arctic seals. expected among species with tight coastal distribu- The MIZ was identified as a marine mammal tions (e.g. ringed seals and white whales Delphi- hotspot and an area of high species richness in the napterus leucas in Svalbard; Hamilton et al. 2016, Greenland Sea and northern Barents Sea, confirming Vacquié-Garcia et al. 2018); species that are heavily results from previous studies (e.g. Boertmann & Mos- dependent on sea ice (e.g. ringed seals and polar bech 2012, Laidre et al. 2015b, Vacquié-Garcia et al. bears in the MIZ; Lone et al. 2018, 2019); and species 2017b, Lone et al. 2018). The MIZ has long been rec- that dive to intermediate depths in open ocean areas ognized as a unique and important habitat for many (e.g. harp seals and hooded seals; Folkow et al. 2004, marine mammals (as well as birds and fishes) (e.g. Vacquié-Garcia et al. 2017a). However, it is impor- Stirling 1997). The spatial area covered by the MIZ is tant to note that species can have quite different highly dynamic both intra- and inter-annually (Vinje habitat and movement patterns in different areas of 2009), which has a large influence on where marine their range, which could impact the breadth and mammal hotspots occur in both space and time. location of hotspots. Hotspots for marine mammals found in the MIZ (e.g. Fjords and coastal areas around the Svalbard polar bears, harp seals and hooded seals) were gen- Archipelago were identified as hotspots for the erally found further north in the summer/autumn majority of the marine mammals included in these than in the winter/spring, reflecting intra-annual analyses, and as areas of high species richness in the variations in sea-ice extent. Polynyas and openings Northeast Atlantic Arctic, confirming work done on in the sea ice are also extremely important for marine individual species and small species groups (e.g. mammals (Stirling 1997). Polynyas situated in the Blanchet et al. 2014, Hamilton et al. 2017, 2018, Vac- mouths of fjords and adjacent to the coast in North- quié-Garcia et al. 2018). Fjords and coastal areas of east Greenland (e.g. Northeast Water Polynya, Northeast Greenland were also identified as marine polynya outside Scoresby Sound) and adjacent to mammal hotspots that were used heavily by a variety islands in the northern Barents Sea are important of marine mammal species (e.g. Dietz et al. 1994, over-wintering areas for many species (Born & Knut- Boertmann & Mosbech 2012, present study). Rapid sen 1992, Boertmann & Mosbech 2012, Lowther et al. changes are occurring in these important coastal 2015, Kovacs et al. 2020a). These regions were iden- hotspot areas. Large decreases in land-fast ice extent tified as hotspots for bowhead whales Balaena mys-
24                                       Mar Ecol Prog Ser 659: 3–28, 2021

ticetus, walruses and narwhals Monodon monoceros           regions following decreases in sea-ice extent (Storrie
in the present study.                                      et al. 2018, Hansen et al. 2019); these ‘boreal’ species
   Sea ice serves multiple functions for different Arc-    are likely to be climate ‘winners’ in the coming
tic marine mammal species. It is a pupping, nursing        decades with resultant increases in their numbers
and resting habitat for Arctic seals; a hunting plat-      and the number of areas that are hotspots for this
form and transport corridor for polar bears; a forag-      species group in Arctic areas. However, not all spe-
ing habitat for the majority of Arctic marine mammal       cies are adapting to using open ocean areas. Ringed
species; and it provides protection for ice-adapted        seals continue to use their ‘traditional’ habitats, and
Arctic marine mammals from aquatic predators and           polar bears are dependent on sea ice when in off-
storm events (see Kovacs et al. 2011 for details).         shore areas as well as when they are moving
There is thus a large conservation concern for marine      between areas (transit corridors), particularly when
mammals given the ongoing declines in sea-ice              accompanied by young cubs (Hamilton et al. 2015,
extent and volume. The extent to which Arctic mar-         2019a, Lone et al. 2018, 2019).
ine mammals can simply shift their ranges north is            Human activities are increasing in Arctic regions
currently unknown, as this would involve shifting          as declines in sea ice make these regions more acces-
their distributions from over the productive Arctic        sible. These activities pose risks to marine mammals
continental shelf seas to over the less productive,        if activities overlap with identified hotspot regions.
deep Arctic Ocean Basin for many species. There is         Oil and gas exploration and production are shifting
considerable uncertainty regarding how the levels of       northward in the study region, and levels of ship traf-
primary and secondary productivity and the pres-           fic are increasing (Reeves et al. 2014). Noise-induced
ence of fish and invertebrate stocks will change in        behavioural disturbance and auditory masking from
the Arctic Ocean Basin as sea-ice declines continue        oil and gas exploration and production and boat traf-
(see e.g. Haug et al. 2017, Meredith et al. 2019).         fic can potentially occur over large distances (Reeves
However, the northward shift of the MIZ and general        et al. 2014, Halliday et al. 2017, Bröker 2019). Ships
decrease in sea-ice extent are already having nega-        disrupting sea-ice habitat could have serious impacts
tive consequences for many marine mammal species,          on breeding and moulting groups of harp seals and
including range shifts, increased foraging costs,          hooded seals in the Greenland Sea, as has been
changes in habitat use patterns and changes in ter-        demonstrated in the White Sea (Chernook & Boltnev
restrial denning locations of polar bears (Derocher et     2008). Tourism is also increasing in the Svalbard
al. 2011, Hamilton et al. 2015, Laidre et al. 2015b,       Archipelago (www.mosj.no) and in Greenland
Lone et al. 2018). Ongoing distributional shifts will      (www.stat.gl). Tourist activities have the potential to
undoubtedly impact the location of marine mammal           have negative impacts on marine mammals (Rode et
hotspots in the coming decades.                            al. 2018), although appropriate regulations manag-
   Not all marine mammals in the Greenland and the         ing tourism activities can help minimize impacts on
Barents Sea had hotspots solely in the MIZ or coastal      marine mammals (Øren et al. 2018).
regions of Northeast Greenland and Svalbard. Open
ocean hotspots were important for some species,
especially for harp seals, hooded seals, harbour seals                  4.1. Biases and research gaps
and seasonally resident whales. Harp seals and
hooded seals make extensive use of open ocean                 The hotspot analyses herein identified areas that
areas for foraging in the summer and autumn                are important for individual species and species
(Folkow et al. 2004, Vacquié-Garcia et al. 2017a),         groups within this Arctic region. The strongest bias
while the shelf edge is important for harbour seals        to the hotspot results is undoubtedly tagging loca-
and migratory whales around Svalbard (Blanchet et          tion(s). Areas with less tagging effort are underrep-
al. 2014, Storrie et al. 2018). Some species seem to be    resented in the hotspot analysis. Ideally, tags should
showing signs of adjusting to making greater use of        be deployed evenly over the total distribution area of
waters off the immediate coastline in fjords as sea-ice    each species within the study area (Queiroz et al.
extent declines, including white whales and harbour        2016). The number of individuals tagged in different
seals (Vacquié-Garcia et al. 2018, Hamilton et al.         locations should also be weighted by the representa-
2019a, Norwegian Polar Institute’s Marine Mammal           tive population sizes of a species in each area. How-
Sightings Database, contact K.M.K. for more infor-         ever, the costs of this research limit the number of
mation). Seasonally resident whales have also              tags and locations where deployments take place,
expanded their distributional areas in northern            and population size information is lacking for most
You can also read