Invasive Species Management Plan for the Saginaw Chippewa Indian Tribe - Michigan Natural Features Inventory
←
→
Page content transcription
If your browser does not render page correctly, please read the page content below
Invasive Species Management Plan for the
Saginaw Chippewa Indian Tribe
Informed by an Invasive Species Treatment Prioritization Model

 Prepared By:
 Ashley A. Cole-Wick, Rachel A. Hackett, Helen D. Enander, Clay M. Wilton, Joshua G. Cohen
 Michigan Natural Features Inventory
 Michigan State University Extension
 P.O. Box 13036
 Lansing, MI 48901

 Prepared For:
 Saginaw Chippewa Indian Tribe

 03/31/2021
Suggested Citation:
Cole-Wick, AA, RA Hackett, HD Enander, CM Wilton, and JG Cohen. 2021. Invasive Species
Management Plan for the Saginaw Chippewa Indian Tribe. Michigan Natural Features
Inventory, Report No. 2021-03, Lansing, MI.
Copyright 2021 Michigan State University Board of Trustees. MSU Extension programs and ma-
terials are open to all without regard to race, color, national origin, gender, religion, age,
disability, political beliefs, sexual orientation, marital status or family status.
Cover: Tawas Lake wild rice beds (Zizania aquatica.) on Saginaw Chippewa Indian Tribal
property in Iosco County, Michigan. Photograph by Ashley Cole-Wick, 2019.
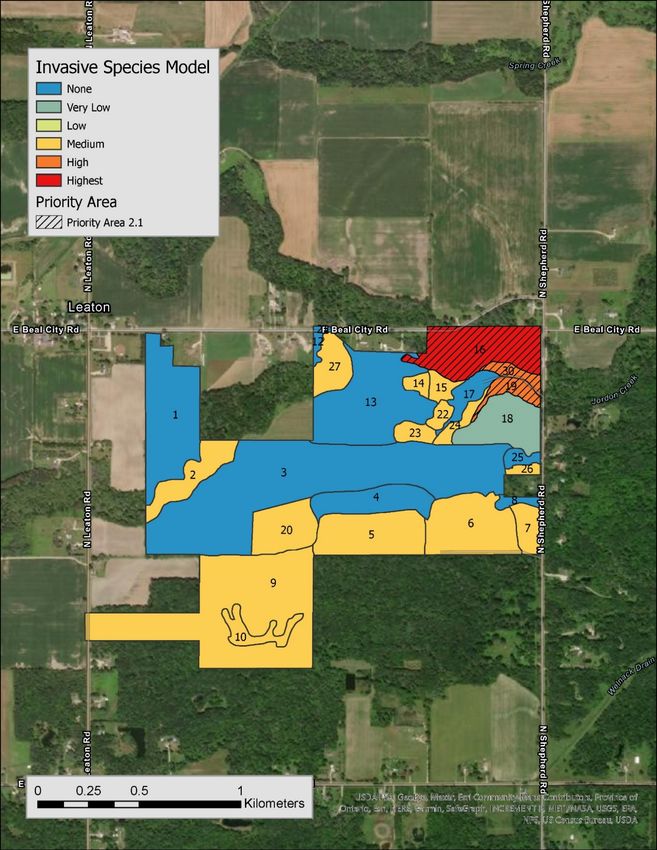
Table of Contents

Introduction ................................................................................................................................ 9
Methods ....................................................................................................................................11
Results and Discussion .............................................................................................................14
Arenac County (Compartment 4) ..............................................................................................16
 Priority 1.1 Whites Beach (Compartment 4, Stands 26-43, 45-47) .........................................18
Isabella County (Compartments 1-3).........................................................................................20
 Priority 2.1 Jordon Creek (Compartment 1: Stands 16, 19, 30) ..............................................20
 Priority 2.2 Little Elk Drive Forests (Compartment 3: Stands 68, 72, 73, 79) ..........................21
 Priority 2.3 Remus Road Forests (Compartment 3: Stands 8, 37) .........................................22
Iosco County (Compartment 5) .................................................................................................26
 Priority 3.1 Northern Tawas Forests (Stands 6, 19, 21) .........................................................26
 Priority 3.2 Southeast Tawas Forests (Stands 33, 34, 35) .....................................................27
 Priority 3.3 Tawas Lake Shoreline (Stands 25-28, 39-40) ......................................................27
Conclusion ................................................................................................................................29
Acknowledgments .....................................................................................................................30
Literature Cited .........................................................................................................................30
Appendices ...............................................................................................................................32
 Appendix 1. Definition of Terms and Abbreviations................................................................32
 Appendix 2: Additional Metric Scoring Data ...........................................................................33
 Appendix 3. Invasive Plant Species Treatment and Timing ...................................................37
 Resources .............................................................................................................................42

 i
List of Tables

Table 1. Invasive Species Treatment Prioritization Model metrics .............................................13
Table 2. Management terminology ............................................................................................15
Table 3. Management goals for priority areas. ..........................................................................15
Table 4. Summary of rare species found on Tribal properties in Arenac County .......................16
Table 5. Summary of rare species found on Tribal properties in Isabella County ......................20
Table 6. Summary of rare species found on Tribal properties in Iosco County ..........................26
Table 1 - 1. Additional definitions of terms and abbreviations ....................................................32

Table 2 - 1. List of invasive plant species and their score..........................................................33
Table 2 - 2. Scoring for natural community metrics developed ..................................................35
Table 3 - 1. Possible treatments of invasive species detected on SCIT property ....................... 37

 ii
List of Figures

Figure 1. Lands owned and managed by the Saginaw Chippewa Indian Tribe ........................... 9
Figure 2. Invasive Species Treatment Prioritization Model summary figure ...............................11
Figure 3. Invasive Species Treatment Prioritization Model results for Tawas Lake as viewed on
ArcGIS Online Map Feature. .....................................................................................................14
Figure 4. Invasive Species Treatment Prioritization Model results for stands in Arenac County 17
Figure 5. Invasive Species Treatment Prioritization Model results focusing on priority area 1.1 in
Arenac County. .........................................................................................................................19
Figure 6. Invasive Species Treatment Prioritization Model results for stands in Isabella County
.................................................................................................................................................23
Figure 7. Invasive Species Treatment Prioritization Model results focusing on priority area 2.1 in
Isabella County .........................................................................................................................24
Figure 8. Invasive Species Treatment Prioritization Model results focusing on priority areas 2.2
and 2.3 in Isabella County .........................................................................................................25
Figure 9. Invasive Species Treatment Prioritization Model results for stands in Iosco County ...28

 iii
Introduction
The Saginaw Chippewa Indian Tribe of Michigan is a federally recognized Tribe headquartered
on the Isabella Reservation, Isabella County, Michigan. The Tribe continually works towards the
conservation, restoration, and protection of its properties comprising various natural and
developed areas in three Michigan counties: Isabella, Iosco, and Arenac (Figure 1). These lands
contain ecosystems that support wildlife habitat, contain culturally important natural resources,
harbor native biodiversity, and provide ecosystem services. To ensure the continuation of these
ecosystem functions and services for future generations, long-term, comprehensive
conservation planning is needed.

Figure 1. Lands owned and managed by the Saginaw Chippewa Indian Tribe in Michigan, USA.

Conservation planning is an iterative process focused on natural resource management with the
following steps: 1) assessment, 2) planning, 3) implementation, 4) analyzing and adapting, and
5) sharing management successes and failures. In 2020, Michigan Natural Features Inventory
(MNFI) completed a project that addressed the first two steps of conservation planning by
completing a baseline assessment and biological inventory on Saginaw Chippewa Tribal lands
in Michigan (Cole-Wick et al. 2020). Through this project, Tribal properties were delineated into
stands. Each stand comprised a discrete polygon that represents a relatively homogeneous

 9

area of a similar vegetative covertype, natural community, and land-use history. These stands
and aggregation of stands are units that can be the basis of subsequent planning. From this
baseline, conservation goals, objectives, monitoring plans, and operational plans may be
developed to preserve and restore natural resources.
The 2020 report identified threats to Tribal properties, with invasive species as the leading
threat impacting the ecological integrity of natural communities. Invasive plants are non-native
species that spread, largely unchecked by ecological processes, and outcompete native
species. These aggressive species are a leading threat to biodiversity and ecological integrity
across the lands we surveyed, and their impact is exacerbated by the additive effects of other
pressures such as deer herbivory, hydrological alterations, habitat fragmentation, disease, and
fire suppression. Invasive plants degrade native biodiversity by displacing native species,
interrupting food webs, compromising pollination services, changing microclimates, and altering
soils, hydrology, and disturbance regimes (Pimental et al. 2005, Ehrenfield 2010).
Development of multifaceted and successful invasive species management plans with finite
resources is complicated. Therefore, we have adopted MNFI’s Invasive Species Treatment
Prioritization Model (Cohen et al. 2019) to inform long-term natural community management
focusing on invasive plant species. High-quality and degraded natural areas are susceptible to
invasive plant species and present complex decisions about where to invest management
resources. The model facilitates the identification of areas to prioritize monitoring, treatment,
and containment of invasive plant species. The primary products generated from this model are
geospatial stand-level data files attributed with general stand characteristics (e.g., area, natural
community) and invasive species treatment priority scores.
Output from this modelling effort can be used to address important conservation planning
questions like “Where should invasive species management be prioritized?” In this report we
briefly describe the methods and variables used to develop the model. We then provide
interpretation of the model to answer the next pressing question “What methods can be used to
protect high-quality natural areas?” We offer management recommendations to control
infestations of the most pernicious species affecting Tribal Lands by identifying seven “priority
areas” for treatment. For each priority area, we describe the characteristics that most
contributed to its prioritization and management actions appropriate for the area. In addition to
this document, we are also providing Tribal Natural Resource Staff with the spatial results of the
Invasive Species Treatment Prioritization Model to be used for future planning endeavors, as
well as resources on invasive species treatment (e.g., Table 3 – 1).

 10
Methods
We developed this Invasive Species Treatment Prioritization Model by adapting the methods of
recent work completed by MNFI (Cohen et al. 2019). The purpose of the model is to identify
stands of the highest priority for invasive species management that have ecosystem integrity,
support native biodiversity, are resilient to disturbance, provide ecosystem services, and have a
high threat of invasion.
The foundational units of the model are vegetative covertype stands created by MNFI as part of
the baseline inventory (Cole-Wick et al. 2020). Each stand is attributed with a Michigan Forest
Inventory (MiFI) covertype as well as an MNFI natural community type. For each stand, we
generated an intersection with spatial data layers with information on infrastructure (Center for
Shared Solutions 2017, MDNR 2018a, MNDNRb), invasive species presence (Chase Stevens
pers. comm., Cole-Wick et al. 2020, MISIN 2020), circa 1800 vegetation (Comer et al. 1995),
climate resilience (Anderson et al. 2018), and rare species and natural community element
occurrences (MNFI 2021). For each stand a suite of thirteen metrics were scored, weighted and
summed using GIS-based multicriteria decision analysis, which combines spatially referenced
data and multi-attribute criteria in a problem-solving environment (Malczewski 2006, Malczewski
et al. 2020; Figure 2). A subset of these metrics (i.e., natural community rarity, natural
community richness, natural community resilience, and ecosystem services) are defined by
natural community type and the classification of each stand to a natural community type
facilitates the scoring for these variables.

Figure 2. Invasive Species Treatment Prioritization Model summary figure. This model gauges
each stand’s priority for invasive species treatment based on an array of spatial variables. For
each stand, multiple metrics or input variables were evaluated, scored, and weighted to
generate an overall priority score. Each metric was binned into one of four factors or categories
(i.e., integrity, biodiversity, resiliency, and ecosystem services).

 11
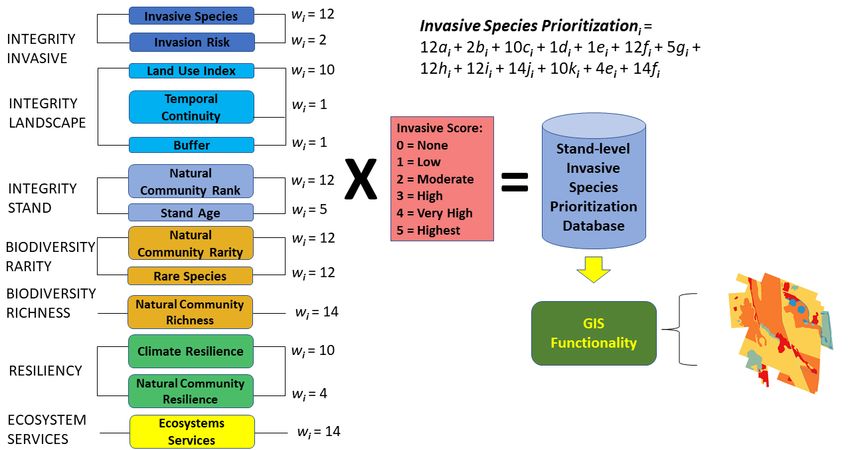
Each of the metrics (mi) in the model had a possible score ranging from 0 to 5, with 0
representing no/lowest priority and 5 representing the highest priority. Each metric was
multiplied by an assigned weight (wi) based on expert opinion. The stand prioritization score
was a summation of all thirteen weighed metrics, then rescaled from 0 to 5. To visualize the
scoring, the scores were assigned colors on a blue to red color gradient with higher scores
corresponding to reds and displayed within a GIS. For the final score, we adjusted some stands
to emphasize stands with invasive species present. Stands that did not have any invasive
species present had their priority scores reduced by 2 as long as the final score remained
greater than zero (Cohen et al. 2019).
We included thirteen metrics in the prioritization model to measure or represent aspects of
integrity (I), biodiversity (B), resiliency (R), and ecosystem services (ES; Table 1). Only metrics
with customized source data or calculations that differ from Cohen et al. (2019) are described in
greater detail below (i.e., invasive species and rare species element occurrence). For detail on
the development and scoring of the remaining 11 metrics, please refer to Invasive Species
Treatment Prioritization Model (Cohen et al. 2019).
For the invasive species metric, geospatial presence data was compiled from three sources:
2019 surveys conducted by MNFI (Cole-Wick et al. 2020), observations in the Midwest Invasive
Species Information Network (MISIN) data repository, and long-term mapping and data
collection efforts by Tribal Natural Resources staff (Chase Stevens pers. comm.). Geospatial
data fully contained in a single stand was surmised as present. In cases where geospatial data
overlapped multiple stands, the species was considered present in the stand if the invasive
plant species covered greater than 10% of the stand.
We assigned each invasive plant species a score based on multiple characteristics of the
species (e.g., reproductive methods, fertility, habitat restrictions) using the United States
Department of Agriculture’s Weed Risk Assessment scoring schema (Plant Epidemiology and
Risk Analysis Laboratory, 2019; Table 2 - 1). The sum of the invasive species scores per stand
were rescaled to 0 to 5 for the model.
The rare species element occurrence (EO) metric was given a ranking of 5 if the stand
contained rare species EO records last observed since the year 2000 and a ranking of 1 if the
stand contained rare species EO records last observed before the year 2000. We gave a higher
ranking to rare species records from the last 21 years, since these records generally have
higher geospatial accuracy and there is a greater likelihood that the represented species are still
present.

 12
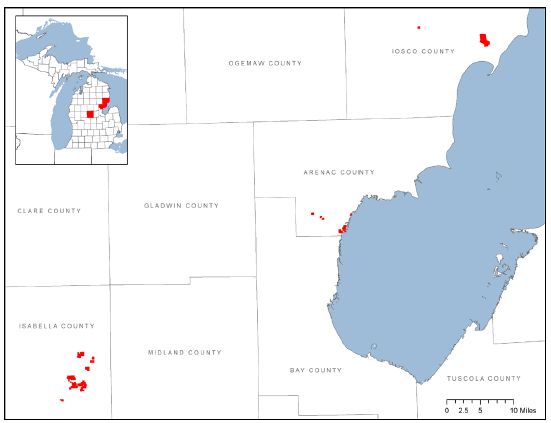
Table 1. Invasive Species Treatment Prioritization Model metrics with weighting, summary
description, and source data. Each metric was categorized (Cat.) as a proxy for one of the
following: Integrity (I), Biodiversity (B), Resiliency (R), or Ecosystem Services (ES). Model
weights for each variable are listed. All metrics used information derived from the baseline
ecological assessment of Cole-Wick et al. (2020).
 Cat. Metric (weight) Description Additional resource(s)
 I Invasion Risk or Distance Distance to nearest physical invasive • Center for Shared Solutions and
 to Invasion Vector species vector (e.g., road, powerlines) Technology Partnerships 2017
 ( 1 = 2) • MDNR N.D. a,b
 • MDNR 2018 a,b
 I Invasive Species Sum of invasive species scores (Table 2 • Chase Stevens, pers. comm.
 ( 2 = 12) - 1) • MISIN 2020
 I Unchanged Landcover Percent of stand area with the same • Comer et al. 1995
 ( 3 = 1) covertype as circa 1800 land cover • NOAA 2016
 R Climate Resilience Rank determined by The Nature • Anderson et al. 2018
 ( 4 = 10) Conservancy’s (TNC) climate resilience
 model
 B Natural Community Rarity Rank based on community rarity in the • Cohen et al 2019
 ( 5 = 12) state of the natural community type
 assigned to a stand (Table 2 - 2)
 R Natural Community Rank by expert based on natural • Cohen et al 2019
 Resilience community resilience of the natural
 ( 6 = 4) community type of stand (Table 2 - 2)
 I Natural Community EO Greater than 10% of stand intersecting • MNFI 2020
 Rank with natural community that was ranked
 ( 8 = 12) according to size, quality, and landscape
 of natural community by expert
 B Rare Species EO Rank based on presence and year of last • MNFI 2020
 ( 9 = 12) observation of intersecting rare species
 EO with recent EOs weighted heavier
 than historic
 I Land Use Index Proportion of intensive land cover to • Faber-Langendoen et al. 2016
 ( 10 = 10) natural land cover in buffer surrounding • Cohen et al. 2019
 stand based on NatureServe’s landscape
 scale ecological integrity metric
 I Buffer or Natural Edge Percentage of perimeter with • Roberts and Cooper 1989
 ( 11 = 1) undeveloped/natural land cover
 I Stand Age Recent tree core(s) of dominate tree
 ( 13 = 5) species in forested stands
 B Natural Community Rank based on average species richness • Cohen et al 2019
 Richness and diversity of the natural community
 ( 14 = 14) type assigned to a stand (Table 2 - 2)
 ES Community Ecosystem Rank by expert based on contribution to • Cohen et al 2019
 Services provisioning, regulating, supporting, and
 ( 15 = 14) cultural services (e.g., pollinator habitat,
 recreation, water filtration) of the natural
 community type assigned to a stand
 (Table 2 - 2)

 13
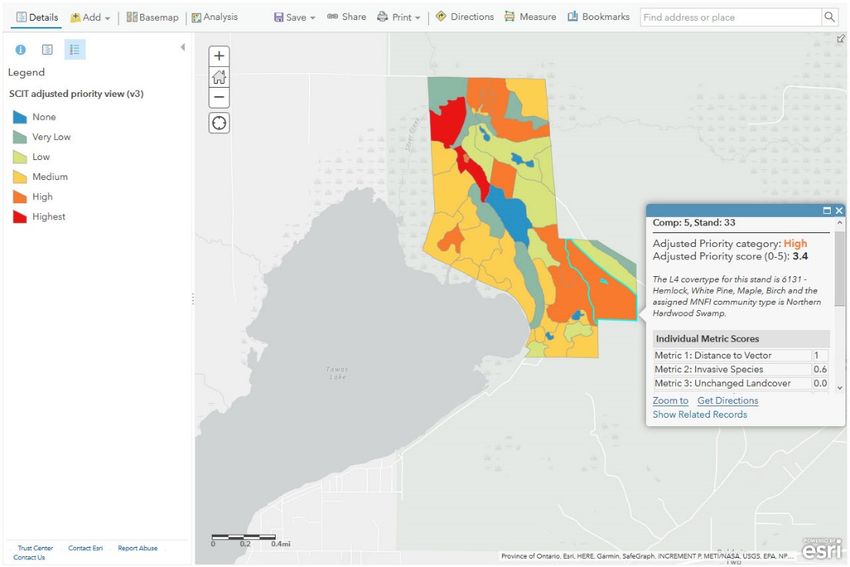
Results and Discussion
The Invasive Species Management Prioritization Model can be used to aid in decision-making
regarding invasive species management. The model is available for download online through an
ArcGIS Online map (Figure 3). The final priority layer is called “SCIT adjusted priority view (v3)”.
To view the resulting variables for a particular stand, clicking on the stand will bring up some
stand characteristics (e.g., area, covertype), each metric and its score as described in Table 1,
and the overall adjusted priority score from 0 to 5.

Figure 3. Invasive Species Treatment Prioritization Model results for Tawas Lake as viewed on
ArcGIS Online Map Feature.

This model is a tool and should be used as one part of the decision-making process.
Interpretation of the model may rely on stand or landscape characteristics that were not
quantified across the model. Examples of such characteristics are nearby or bordering EO
records (e.g., those that do not overlap the stand but may provide habitat), hydrological
interactions, and field-knowledge that may not be captured in stand-level attributes (Cole-Wick
et al. 2020). Additionally, stands with very low numbers of invasive species may rank as higher
priority in the model because eradication is feasible and simple, whereas stands that have large
numbers of invasive species may not rank as highly because containment/control is resource-
intensive, or the land is greatly altered from its natural state (e.g., forest to abandoned field).
Our model did not include the Indian Lake parcel (Goedecke Property). This small parcel is
surrounded by the Huron Manistee National Forest and we documented no invasive species

 14
during surveys in 2019. We recommend regular monitoring and using Early Detection and Rapid
Response (EDRR) at this property if invasive species are documented. Cooperation with the
Forest Service to determine and monitor nearby infestations may be beneficial.
Below we present seven priority areas for invasive management, divided by county. These
priority areas vary in size and the degree of invasive species present. We present terminology
for suggested management actions (Table 2) and summarize management goals and actions
for stands in each priority area (Table 3). To assist in implementation of invasive species
management, we have included a table describing treatments used to control invasive species
present in SCIT lands (Appendix Table 3 – 1).

Table 2. Management terminology used to describe management goals.
 Term Description
 Early Detection/Rapid Surveillance technique to monitor and treat emerging pest infestations.
 Response (EDRR)
 Monitoring On-going surveillance and documentation of infested or non-infested areas for
 pest populations at a regular frequency.
 Eradication Population is small and isolated enough that complete eradication of all plants
 and reproductive propagules is possible with little chance of re-introduction.
 Elimination/Zero Population is of high enough priority or small enough size to eliminate from a
 Density designated area, but re-introduction is likely from surrounding areas or vectors.
 Outlier Control When populations are present as large infestations, the first priority is to
 eliminate small outlier populations away from the larger infestation.
 Perimeter Control When populations are present as large infestations, once outlier populations
 have been eliminated, management focus switches to control around the
 perimeter of the larger infestation moving from the fringes towards the center.
 Sustained Control The species is so widespread that elimination is unlikely due to population size
 and pressure of continual reintroduction from neighboring areas. Control areas
 would most likely focus on specific high priority areas impacted from the
 species with a long-term commitment expected.

Table 3. Management goals for priority areas.
 Primary Management Goal
 Outlier control
 Monitoring /

 Eradication

 Elimination

 Sustained
 Perimeter

 Priority
 Control

 Control
 EDRR

 County Compartment: Area
 (acres) Priority Area Stand (acres)
 Arenac 1.1 Whites Beach 4: 26-43, 45-47 113.7 X X X X
 (345)
 Isabella 2.1. Jordon Creek 1: 16, 19, 30 21.9 X X X X
 (1606) 2.2 Little Elk Drive 3: 68, 72, 73, 79 47.1 X X X
 Forests
 2.3 Remus Road 3: 8, 37 92.5 X X X X
 Forests
 Iosco 3.1 Northern Tawas 5: 6, 19, 21 68.8 X X X
 (932) Forests
 3.2. Southeast Tawas 5: 33, 34, 35 135.6 X X
 Forests
 3.3 Tawas Lake 5: 25-28, 39-40 133.3 X X X X
 Shoreline

 15
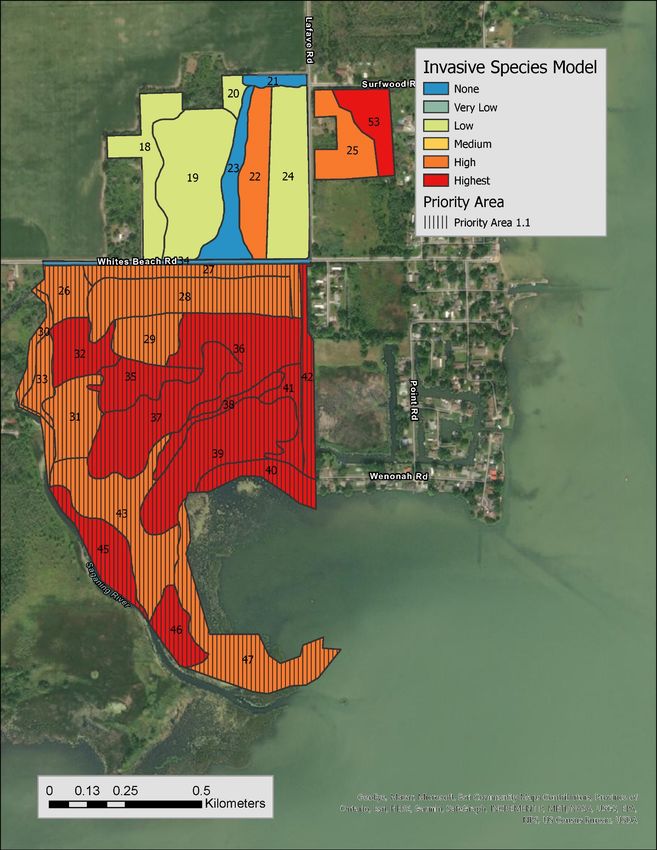
Arenac County (Compartment 4)
Situated along the shoreline of Lake Huron, Tribal properties in Arenac County comprise several
disjunct parcels that were historically wet prairie and Great Lakes marsh along the lakeshore,
transitioning into swamp forests further inland. Wetlands along the lake contain diverse
vegetative zones including submergent marsh, emergent marsh, wet meadow, and shrub
swamp. Fluctuation of Great Lakes water levels is an important influence on these systems. As
lake levels change, vegetative zones shift inland or lakeward, which is a natural process.
However, with ecosystem fragmentation and lakeshore hardening, these shifts are often no
longer possible. Today, the legacy of farming, declining water quality, and invasive species have
contributed to the degradation of these ecosystems. The property is the site of several recent
and historic observations of rare species and natural communities (Table 4). Due to the large
size and ecological importance of Whites Beach, this compartment has one invasive species
priority area (Figure 4).
Table 4. Summary of rare species found on Tribal properties in Arenac County from Michigan’s
Natural Heritage Database. EO ID is a unique identifier assigned to each EO record in the
Natural Heritage Database.
 Last year
 Common Name Scientific Name observed EO ID Status
 Bald eagle Haliaeetus leucocephalus 2019 23067 State special concern
 Black sandshell Ligumia recta 1932 17673 State endangered
 Blanding’s turtle Emydoidea blandingii 2017 23697 State special concern
 Butler’s garter snake Thamnophis butleri 2013 23698 State special concern
 Common gallinule Gallinula galeata 2019 23895 State threatened
 Least bittern Ixobrychus exilis 2019 23894 State threatened
 Marsh wren Cistothorus palustris 2019 17406 State special concern
 Great Lakes Marsh 2005 7139 NA

 16
Figure 4. Invasive Species Treatment Prioritization Model results for stands in Arenac County
(Compartment 5)

 17
Priority 1.1 Whites Beach (Compartment 4, Stands 26-43, 45-47)
This large priority area comprises all stands bordered by Whites Beach Road to the north,
Saganing River to the west, a drainage ditch to the east, and Lake Huron to the south and east
(Figure 5). These wetlands provide habitat for a variety of wildlife, including commercially
important fish, freshwater mussels, bald eagles, and secretive marsh birds (Table 4). Several
stands surveyed in 2019 were recorded as ‘open water’ (e.g., stands 40, 46, 47). This area was
not underwater until recently, as evident by standing dead paper birch and other shrubs, which
were under several feet of water. Invasive Phragmites (Phragmites australis subsp. australis)
and invasive cattails (Typha angustifolia, Typha x glauca) occur infrequently in these open water
stands as the water levels are currently too high for these species to establish or thrive. Woody
vegetation becomes more prominent as the habitat transitions from emergent marsh to lowland
shrub and young, low density swamp forest near Whites Beach Road. As the habitat changes,
so do the primary invasive species, with autumn olive (Elaeagnus umbellata) and honeysuckles
(Lonicera spp.) replacing Phragmites and cattails. We also observed European frog’s-bit in the
Saganing River at the border of Tribal property near Worth Road.
Whites Beach stands rank high in the model due to several metrics, including unchanged
landcover, rare species, natural edge, natural community rarity, and community ecosystem
services.

Actions
 - Outlier control of Phragmites and cattails (stands 35, 36, 37, 38, 39, 41, 43, 45, 46)
 - Elimination of new Phragmites and cattails infestations (stands 29, 40, 42, 47)
 - Elimination of low-density European frog’s-bit in aquatic habitat along the Saganing
 River
 - Perimeter control of autumn olive and honeysuckle populations starting with smaller
 infested areas (stand 36) and working toward Whites Beach Road in the north and
 Saganing River in the west (stands 26, 27, 28, 29, 30, 31, 33, 42)
 - Monitor currently flooded stands (stands 40, 46, 47) for new infestations as a result of
 fluctuating Great Lakes levels in 1-to-5-year frequency

 18
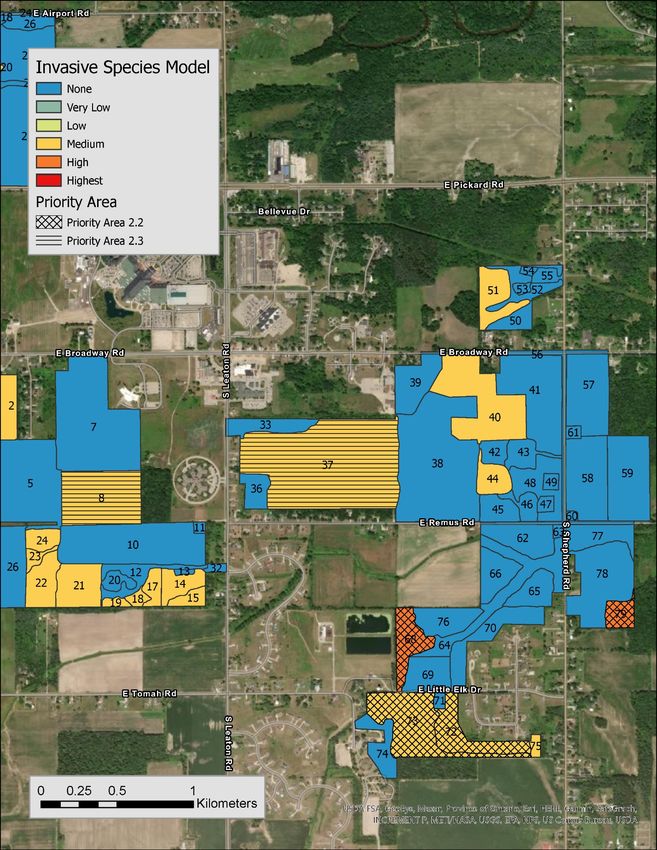
Figure 5. Invasive Species Treatment Prioritization Model results focusing on priority area 1.1 in
Arenac County.

 19
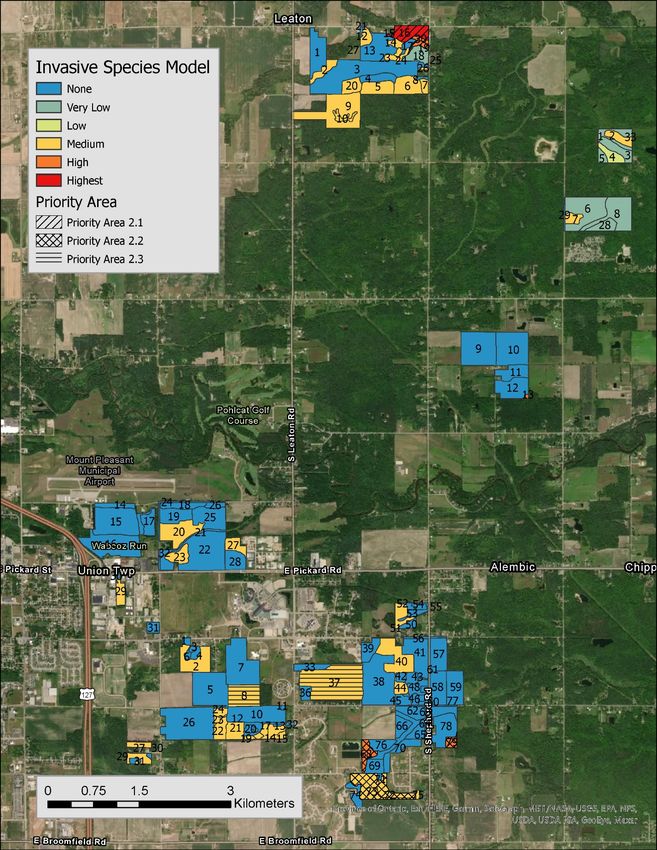
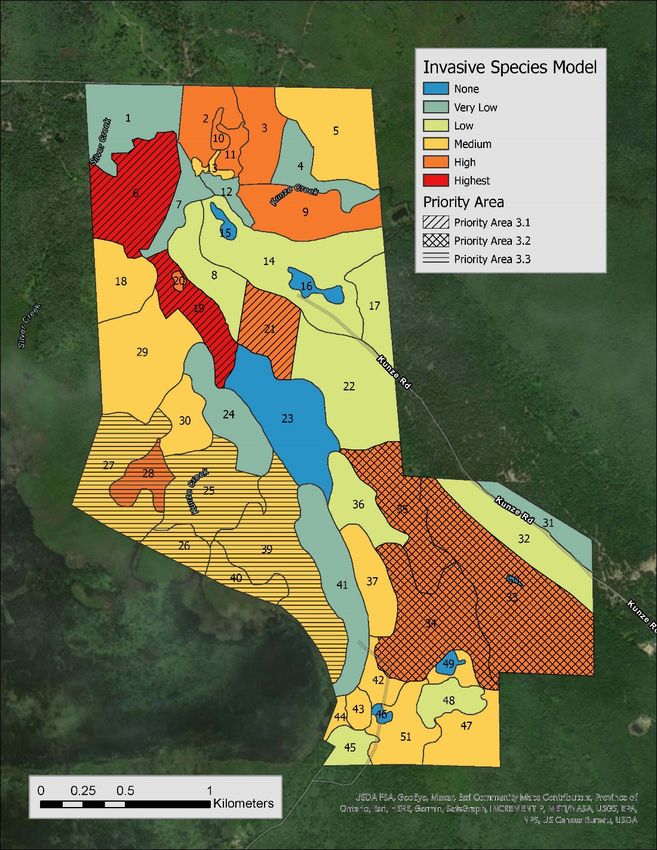
Isabella County (Compartments 1-3)
Historically, much of what is now Isabella County was mesic southern forest, mesic northern
forest, hardwood-conifer swamp, and rich conifer swamp (Comer et al. 1995). Much of the
conifer component of these forests was significantly reduced due to logging practices in recent
centuries, resulting in hardwood-dominated swamp forests with some remaining conifer
component. No herbaceous-dominated habitats rank as high priority on the model because no
prairies and barrens habitat has been documented here, therefore it is assumed that most
herbaceous-dominated open areas are not natural, but rather land that was cleared for
development, forestry, or agriculture. Tribal lands and nearby properties contain several recent
and one historic observations of rare species (Table 5).
Tribal properties in Isabella County comprise several disjunct parcels located throughout the city
of Mount Pleasant and Chippewa, Denver, and Union Townships. The parcels were grouped
into three compartments, with one invasive species priority area in Compartment 1 and two in
Compartment 3 (Figure 6).
Table 5. Summary of rare species found on Tribal properties in Isabella County from Michigan’s
Natural Heritage Database. EO ID is a unique identifier assigned to each EO record the
Database.
 Last year
 Common Name Scientific Name observed EO ID Status
 Slippershell Alasmidonta viridis 2019 23690 State threatened
 Slippershell Alasmidonta viridis 2019 23689 State threatened
 Slippershell Alasmidonta viridis 2019 23691 State threatened
 Rainbow Villosa iris 2019 23694 State special concern
 Rainbow Villosa iris 2019 23693 State special concern
 Rainbow Villosa iris 2019 23692 State special concern
 Ellipse Venustaconcha 2019 23695 State special concern
 ellipsiformis
 Dickcissel Spiza americana 2007 16589 State special concern
 Northern flying squirrel Glaucomys sabrinus 1965 22856 State special concern

Priority 2.1 Jordon Creek (Compartment 1: Stands 16, 19, 30)
This priority area comprises floodplain forest and mesic southern forest along Jordon Creek,
which is characterized by numerous canopy gaps created by ash (Fraxinus sp.) die-off. The
canopy is primarily cottonwood (Populus deltoides) with some remaining live ash. The canopy
also contains aspen as well as culturally important species like basswood (Tilia americana;
Figure 7). Canopy gaps created by ash die-off are often filled with ruderal native species such
as boxelder (Acer negundo) and hawthorn species (Crataegus spp.). Invasive multiflora rose
(Rosa multiflora) is the primary treatment priority here, with lower abundance of autumn olive,
purple loosestrife (Lythrum salicaria), and invasive glossy and common buckthorns (Frangula
alnus, Rhamnus cathartica, respectively).
These stands rank high in the model based on the presence of rare species, natural community
rarity, natural edge, and ecosystem services. A 2019 survey recorded eight species of mussels
in Jordon Creek, including the state threatened slippershell (Alasmidonta viridis), and two
species of special concern, rainbow (Villosa iris) and ellipse (Venustaconcha ellipsiformis; Table

 20
5; Cole-Wick et al. 2020). Excessive sedimentation can impact native mussel populations and
the fish hosts they rely on for reproduction. Given the relationship between fish and mussel
species, protection of fishes in the Jordon Creek is critical for the continued survival of these
rare mussels. To maintain high-quality habitat for these listed species in Jordan Creek, invasive
species management in adjacent stands should minimize erosion and runoff.
Actions:
 - Eliminate low density multiflora rose along Jordon Creek (stands 19, 30)
 - Outlier control to perimeter control of medium density multiflora rose (stand 16)
 - Outlier control to perimeter control of autumn olive, buckthorn (stands 16, 19, 30)
 - Outlier control of invasive species autumn olive, common buckthorn, honeysuckle,
 multiflora rose populations in adjacent stands (14, 15, 18, 22, 23, 24) as a preventative
 measure in priority area
 - Monitor and protect stream water quality, thus rare mussel species and host fish, from
 disturbance, sediment, runoff, and invasive species. Management may extend beyond
 borders of the priority area. When disturbance occurs near creek, actively revegetate

Priority 2.2 Little Elk Drive Forests (Compartment 3: Stands 68, 72, 73, 79)
This priority area of woodlands is located east of Tomah Road on either side of East Little Elk
Drive (Figure 8). These stands differ in composition, but they share similar invasive species
threats, and are located near each other, although they are not contiguous. Stands 73 and 79
are high-quality mesic southern forest with abundant spring ephemeral plants and culturally
important species [e.g., bloodroot (Sanguinaria canadensis)]. Within both of these stands,
invasions are limited mostly to the stand margins. Stand 68 is floodplain forest with abundant
maple (Acer spp.) and swamp white oak (Quercus bicolor) along with beech (Fagus grandifolia)
and elm (Ulmus spp.). This site also contains culturally important species, as well as a variety of
established paths throughout, which has facilitated the dumping of trash along the streams.
Stand 68 is degraded on the boundaries but improves towards the center. Stand 72 was
historically beech-maple forest but today presents as degraded oak-pine barren, and
improvement of this stand will help to buffer nearby high-quality forest (stand 73) from invasions.
These stands rank high in the model based on community biodiversity, ecosystem services,
natural community resilience, and land use index.

Actions:
 - Elimination of low-density or small infestations of autumn olive, honeysuckles,
 buckthorns, and black locust (Robina pseudoacacia) in stand interior (stands 73, 79)
 - Elimination of invasive species in stand borders where infestations threaten high-quality
 interior with a focus on multiflora rose, autumn olive, buckthorns, and honeysuckles
 (stand 73)
 - Sustained control of white sweet clover (Melilotus albus; stands 68, 72) and garlic
 mustard (Alliaria petiolata, stand 68)
 - Monitor stand borders for new infestations [e.g., autumn olive, common buckthorn,
 glossy buckthorn, honeysuckle, multiflora rose, Scotch pine (Pinus sylvestris)] from
 adjacent stands (75, 76)
 - Manage deer population with hunting to improve forest understory where culturally
 important plants are presen

 21
Priority 2.3 Remus Road Forests (Compartment 3: Stands 8, 37)
This priority area contains high-quality forested stands in Mount Pleasant located near Remus
and Leaton Roads (Figure 8). This area is mostly mesic-southern forest with some component
of dry-mesic southern forest. Stand 8 is a maturing second-growth forest. Stand 37 is a large
forest with excellent oak (Quercus spp.) and ash regeneration, interspersed with speciose
vernal pools. Stands in this priority area contain few invasive species, restricted mostly to the
margins.
Stands 8 and 37 ranked high in the model due to land use index, natural community
biodiversity, and ecosystem services. While several other stands were scored similarly by the
model, we selected these stands because they have the highest potential for restoration. Other
medium scoring stands were more degraded and heavily invaded by invasive shrub species
(e.g., buckthorns) These stands would require a more expensive restoration endeavor,
however, by exploring the stand attributes in the model, land managers can easily expand
priority areas using this data-driven approach.
Actions:
 - Elimination of multiflora rose, honeysuckles, and autumn olive infestations in the forest
 interior (stands 8, 37)
 - Outlier control to perimeter control to elimination along stand margins (stands 8, 37)
 - Monitor for new infestations in 1-to-5-year frequency (stands 8, 37)
 - Sustained control of autumn olive, common buckthorn, honeysuckles, multiflora rose, St.
 John’s-Wort (Hypericum perfoliatum), and sweet clover (Melilotus spp.) in adjacent
 stands (7, 10, 33, 36, 38) near priority area boundaries
 - Manage deer population with hunting to improve forest understory where culturally
 important plants are present

 22
Figure 6. Invasive Species Treatment Prioritization Model results for stands in Isabella County
(Compartments 1-3)

 23
Figure 7. Invasive Species Treatment Prioritization Model results focusing on priority area 2.1 in
Isabella County (Compartments 1-3)

 24
Figure 8. Invasive Species Treatment Prioritization Model results focusing on priority areas 2.2
and 2.3 in Isabella County (Compartments 1-3)

 25
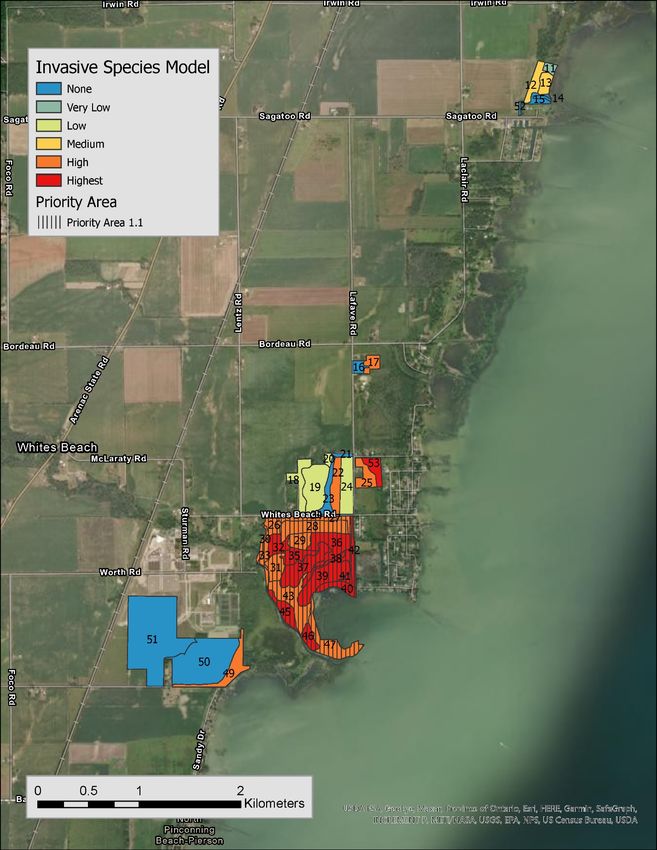
Iosco County (Compartment 5)
Located along Tawas Lake, the 902-acre Amesbury property historically contained a mix of
pine-dominated dry northern forest, hardwood-conifer swamp, conifer swamp dominated by
cedar (Thuja occidentalis), northern shrub thicket, and emergent marsh. In the 1930s the jack
pine-red pine forests and cedar swamps were still largely forested. This property is notable due
to its lakefront on Tawas Lake, which contains one of the largest extant wild rice beds in
Michigan’s Lower Peninsula and for recent observations of other rare species (Table 6). Tawas
Lake is currently experiencing high lake levels, which may result in changes in invasive species
abundance. As lake levels fluctuate in the future, management goals and actions may need to
be adjusted accordingly. Tawas Lake has three invasive species priority areas (Figure 9).
Table 6. Summary of rare species found on Tribal properties in Iosco County from Michigan’s
Natural Heritage Database. EO ID is a unique identifier assigned to each EO record the
Database.
 Last year
 Common Name Scientific Name observed EO ID Status
 Red-shouldered hawk Buteo lineatus 2019 23688 State threatened
 Bald eagle Haliaeetus leucocephalus 2017 11330 State special concern
 American bittern Botaurus lentiginosus 2019 18569 State special concern
 Common loon Gavia immer 2019 23318 State threatened
 Marsh wren Cistothorus palustris 2019 23317 State special concern
 Eastern massasauga Sistrurus catenatus 1999 14202 Federally threatened,
 state special concern
 Blanding’s turtle Emydoidea blandingii 2010 6156 State special concern
 Wild rice Zizania aquatica 2019 23318 State threatened

Priority 3.1 Northern Tawas Forests (Stands 6, 19, 21)
This priority area is represented by two stands of high-quality rich conifer swamps (stands 6, 19)
along with one hardwood-conifer swamp (stand 21; Figure 9). Although not detected in the most
recent surveys, Blanding’s turtle and eastern massasauga rattlesnake (Sistrurus catenatus),
and possibly other rare herptiles with low detectability, are likely extant. Stands 6 and 19
represent some of the highest-quality forests on the property. Stand 21 scores lower on the
model than stands 6 and 19 but active invasive species management will improve this habitat.
Stand 6 represents an exemplary occurrence of rich conifer swamp. Very little effort can ensure
that this stand remains high quality while the forest continues to mature. Several small patches
of Japanese barberry (Berberis thunbergii) and reed canary grass (Phalaris arundinacea)
persist in the stand 6 as the only serious invasive plant threats.
These stands score high on the model because of unchanged landcover, natural community
richness, ecosystem services, and the presence of rare species (Table 6).
Actions:
 - Elimination of interior Japanese barberry and reed canary grass infestations (stands 6,
 19)
 - Perimeter control of Phragmites (stand 21)
 - Monitor forest interior for new invasions (stands 6, 19)
 - Monitor adjacent stands for new infestations with 1-to-3-year frequency (stands 7, 8)

 26
- Perimeter control of Phragmites in stands adjacent to 8 and 21 (stands 2, 18, 23)
 - Manage deer population with hunting to increase regeneration of cedar and other forest
 understory species

Priority 3.2 Southeast Tawas Forests (Stands 33, 34, 35)
These stands remain relatively intact, as they were historically recorded as cedar swamp and
today support swamp forests comprising both conifers and hardwoods (Figure 9). There is also
an upland mesic northern forest component, primarily towards the north and east near Kunze
Road. These stands contain bald eagle nests that are likely still active (Table 6). The two-track
that leads from Kunze Road to Tawas Lake through stands 33 and 34 is a high-risk vector for
invasive species, such as Phragmites.
These stands ranked high in the model due to the presence of rare species and natural edge,
with lesser contributions from natural community rarity, natural community resilience, and
ecosystem services.
Actions:
 - Eliminate low density infestations of Japanese barberry, honeysuckles, Phragmites
 (stands 33, 34, 35)
 - Monitor for new infestations along two-track between Kunze Road and Tawas Lake
 - Manage deer population with hunting to increase regeneration of cedar and other forest
 understory species

Priority 3.3 Tawas Lake Shoreline (Stands 25-28, 39-40)
This priority area comprises the western and southwestern portion of the property along Lake
Tawas (Figure 9). These stands transition from open water to emergent wetland, then to
northern shrub thickets. Several rare and culturally important species (e.g., wild rice) are
present in these stands and in the adjacent lake (Table 6). An active vector for invasive species
in this area is a two-track running parallel to the lake.
The model ranked most of these stands with medium priority scores. However, because of the
cultural value of Tawas Lake (not a metric in the model), the ecosystem service value of the
wetlands, and the presence of numerous rare species we have identified this area as a high
priority (Table 6). Stand 28 ranks higher as this was classified as northern wet meadow, a rarer
community type than northern shrub thicket. The lower ranking for the remainder is likely due to
the commonality and typically lower biodiversity of the northern shrub thicket communities that
presently comprise much of the shoreline.
Actions:
 - Eliminate invasive Phragmites and cattails along the shoreline where wild rice occurs
 (stands 26, 27, 39, 40)
 - Outlier control to perimeter control of Phragmites infestation along the two-track leading
 from Kunze Road to Tawas Lake
 - Monitor Tawas Lake shoreline for new infestations as lake levels fluctuate in 1-to-5-year
 frequency

 27
Figure 9. Invasive Species Treatment Prioritization Model results for stands in Iosco County
(Compartment 5)

 28
Conclusion
Invasive species management is critical for promoting wildlife habitat, sustaining culturally
important natural resources and native biodiversity, and enhancing ecosystem services. In this
report we demonstrated the application of the Invasive Species Treatment Prioritization Model
to inform invasive species management on natural areas owned and managed by the Saginaw
Chippewa Indian Tribe in Michigan. This model provides a framework to identify high priority
stands for management based on ecosystem integrity, biodiversity, resilience, ecosystem
services, and threat of invasion. The model is a tool we have developed not to provide definitive
answers, but instead to foster informed discussion about allocation of finite resources. We used
the model to identify seven priority areas for invasive species management. For each priority
area, we detailed invasive species management goals and actions. Tribal natural resource
managers can combine their knowledge of sites with these recommendations at their discretion
to make future decisions about land management beyond the priority areas we identified.
This model, as all models, has its limitations. At the time of this report, we selected thirteen
variables to describe and quantify ecosystem characteristics in relation to the goal of developing
long-term, comprehensive conservation planning for invasive species to ensure the continuation
of ecosystem services for future generations. We believe these variables were the best fit for
the model that could be derived from the information available at this time.
This model framework could be used to prioritize other management actions. For instance,
without the invasive species data the model can provide information to inform where to focus
other management actions (e.g., deer management, fire management, habitat creation). The
model currently provides useful information about where to focus EDRR at a stand-level that
may be isolated from identified priority areas.
This modelling framework can be adjusted to incorporate additional factors, as they become
available, for the analyzing and adapting process of conservation planning. Future iterations of
the model could incorporate a hydrological importance factor or a variable related to culturally
important plants, whereby stands with hydrological resources or culturally valuable species
would receive increased scores. Upon a change of management goal, organizational vision,
newly available or developed data, or an improved resolution of data, this model may be revised
in the future to best meet the needs of the Tribe.

 29
Acknowledgments
This project was made possible with funds provided by the Saginaw Chippewa Indian Tribe. We
thank everyone from the Tribe, and in particular the Tribal Natural Resource staff who provided
information for this project: Chase Stevens and Carey Pauquette. We also thank the Michigan
Department of Natural Resources for use of their Michigan Forest Inventory protocol and
database and supporting the initial development of the Invasive Species Treatment Prioritization
Model. Administrative support was provided by Ashley Adkins, Sarah Carter, Debra Richardson,
and Tyler Tulloch.

Literature Cited
Anderson, M.G., M.M. Clark, M.W. Cornett, K.R. Hall, A. Olivero Sheldon, and J. Prince. 2018.
 Resilient Sites for Terrestrial Conservation in the Great Lakes and Tallgrass Prairie
 Region. The Nature Conservancy, Eastern Conservation Science and North America
 Region.
Center for Shared Solutions and Technology Partnerships. 2017. Michigan Geographic
 Framework Base Spatial Data. Version 17. Lansing, MI. https://gis-
 michigan.opendata.arcgis.com/datasets?page=2&q=MGF [Accessed 2018 Jul].
Cohen, J.G., C.M. Wilton, and H.D. Enander. 2019. Invasive Species Treatment Prioritization
 Model. Michigan Natural Features Inventory. Report Number 2019-27, Lansing, MI. 21
 pp.
Cole-Wick, A., L. Rowe, P. Badra, T. Bassett, Y. Lee, C. Ross, J. Paskus, and M. Monfils. 2020.
 Natural Features Inventory of Saginaw Chippewa Indian Tribe Lands. Michigan Natural
 Features Inventory, Report Number 2020-13, Lansing, MI, USA.
Comer, P.J., D.A. Albert, H.A. Wells, B.L. Hart, J.B. Raab, D.L. Price, D.M. Kashian, R.A.
 Corner, and D.W. Schuen. 1995. Michigan’s presettlement vegetation, as interpreted
 from the General Land Office Surveys 1816-1856. Michigan Natural Features Inventory,
 Lansing, MI. Digital map.
Ehrenfield, J.G. 2010. "Ecosystem consequences of biological invasions," Annual Review of
 Ecology, Evolution, and Systematics, vol. 41, pp. 59–80, Dec.
Faber-Langendoen, D., W. Nichols, J. Rocchio, K. Walz, and J. Lemly. 2016. An Introduction to
 NatureServe’ s Ecological Integrity Assessment Method. NatureServe, Arlington,
 Virginia, USA.
Malczewski, J. 2006. GIS-based multicriteria decision analysis: a survey of the literature.
 International Journal of Geographical Information Science, 20: 703–726.
 doi.org/10.1080/13658810600661508.
Malczewski, J.; P. Jankowski. 2020. Emerging trends and research frontiers in spatial
 multicriteria analysis. International Journal of Geographical Information Science, 34:
 1257–1282. doi.org/10.1080/13658816.2020.1712403.

 30
MDNR [Michigan Department of Natural Resources]. N.D.a. A Michigan DNR Non-Motorized
 Trails. https://gis-michigan.opendata.arcgis.com/datasets/midnr:non-motorized-trails-1
 [Accessed 2020 Mar].
MDNR [Michigan Department of Natural Resources]. N.D.b. Michigan EIA pipeline polyline
 features. MDNR internal dataset. [Accessed 2020 Nov].
MDNR [Michigan Department of Natural Resources]. 2018a. Michigan DNR Point Base Feature
 Service. Created 2018-10-09.
 https://www.arcgis.com/home/item.html?id=e987b0878eff4d7e9cb642b862dc22d8
 [Accessed 2020 Nov]
MDNR [Michigan Department of Natural Resources]. 2018b. Michigan DNR Base Features
 polyline. MDNR Internal dataset. [Accessed 2020 Nov]
MNFI [Michigan Natural Features Inventory]. 2021. Biotics 5 - Michigan’s Natural Heritage
 Database. [Accessed 2021 Jan].
MISIN [Midwest Invasive Species Information Network]. 2020. Species Information Pages.
 Michigan State University. Website https://www.misin.msu.edu [Accessed 2020 Dec].
NOAA [National Oceanic and Atmospheric Administration] Coastal Services Center. 2016.
 NOAA's Coastal Change Analysis Program (C-CAP) 2016 Regional Land Cover Data –
 Michigan. https://coast.noaa.gov/digitalcoast/tools/lca
Pimental, D., R. Zuniga, and D. Morrison. 2005. Update on the environmental and economic
 costs associated with alien-invasive species in the United States. Ecological Economics,
 52(3): 273–288,
Plant Epidemiology and Risk Analysis Laboratory. 2019. Guidelines for the USDA-APHIS- PPQ
 Weed Risk Assessment. United States Department of Agriculture. TP E-300, v.2.3,.
 Raleigh, North Carolina, USA.
Roberts, D.W., and S.V Cooper. 1989. Concepts and techniques of vegetation mapping. Land
 Classifications Based on Vegetation: Applications for Resource Management, 90–96.
 USDA Forest Service GTR INT-257, Ogden, Utah, USA.
Stevens, Chase. 2021. Chastevens@sagchip.org. Saginaw Chippewa Indian Tribe.

 31
Appendices
Appendix 1. Definition of Terms and Abbreviations

Table 1 - 1. Additional definitions of terms and abbreviations used in report.
 Term Description
 Element Occurrence (EO) A presence record of a listed species or natural community in a Natural
 Heritage Database
 Metric A measurement proxy calculated or attributed to a characteristic
 Natural Community An assemblage of interacting plants, animals, and other organisms that
 repeatedly occur under similar environmental conditions across the
 landscape and is predominantly structured by natural processes rather
 than modern anthropogenic disturbances, such as timber harvest,
 alterations to hydrology, and fire suppression. Historically, indigenous
 peoples were an integral part of Michigan’s natural communities with
 many natural community types being maintained by native management
 practices such as prescribed fi re.
 Natural Heritage Database A repository of records documenting location, status, and characteristics
 of rare plant populations, animal populations, and natural communities in
 a designated region
 Stand Polygons representing a relatively homogeneous area of a similar
 covertype and age

 32
Appendix 2: Additional Metric Scoring Data
These rankings were developed in Cohen et al. (2019). Additional species added for this project
are denoted with an *.
Table 2 - 1. List of invasive plant species and their score calculated using the United States
Department of Agriculture’s Weed Risk Assessment scoring schema (Plant Epidemiology and
Risk Analysis Laboratory, 2019). Most scores were developed for Cohen et al. (2019) and used
to calculate the Invasive Species metric (Table 1)
 Scientific name Common name Score Scientific name Common name Score
 Acer platanoides Norway maple 2 Cynanchum Louise's swallow- 4
 Achyranthes Japanese chaff 4 louiseae wort
 japonica flower Cynanchum European swallow- 4
 Aegopodium Bishop's goutweed 3 rossicum wort
 podagraria Cynoglossum Hound’s-tongue 4
 Ailanthus altissima Tree of heaven 5 officinale
 Daucus carota Wild carrot, Queen- 3
 Alliaria petiolata Garlic mustard 5
 Anne's-lace
 Alnus glutinosa Black/European 3 Dioscorea Chinese yam 3
 alder oppositifolia
 Amorpha fruticosa False indigo 4 Dipsacus laciniatus Cut-leaf teasel 4
 Ampelopsis Turquoise berry 2 Elaeagnus Autumn olive 4
 brevipedunculata umbellata
 Arctium minus Common burdock 3 Euonymus alatus Wahoo/burning 2
 Barbarea vulgaris Garden 3 bush (Invasive)
 yellowrocket Euonymus Spindle tree 2
 Berberis spp. Barberry 4 europaeus
 Berberis thunbergii Japanese barberry 4 Euonymus fortunei Wintercreeper 3
 Berberis vulgaris Common barberry 3 Euphorbia esula Leafy spurge 5
 Berteroa incana Hoary alyssum 3 Fallopia japonica Japanese knotweed 4
 Buddleja davidii Butterfly Bush 3 Fallopia Giant knotweed 4
 sachalinensis
 Butomus Flowering Rush 3 Frangula alnus Glossy buckthorn 5
 umbellatus
 Campsis radicans Trumpet vine 1 Galeopsis tetrahit Hemp-nettle 2
 Cardamine Narrow-leaved bitter 4 Galium odoratum Sweet woodruff 1
 impatiens cress Glechoma Ground-ivy, 2
 Carex kobomugi Asiatic sand sedge 3 hederacea creeping Charlie
 Celastrus Oriental bittersweet 5 Glyceria maxima Reed manna grass 4
 orbiculatus Gypsophila Baby's breath 3
 Centaurea jacea Brown knapweed 4 paniculata
 Centaurea stoebe Spotted knapweed 5 Heracleum Giant hogweed 3
 mantegazzianum
 Cirsium arvense Canada thistle 5 Hesperis matronalis Dame's rocket 4
 Cirsium palustre European swamp 4 Hydrocharis European frog-bit 3
 thistle morsus-ranae
 Cirsium vulgare Bull thistle 4 Hypericum Common St. 5
 Conium maculatum Poison hemlock 4 perforatum John’s-wort
 Convolvulus Field bindweed 5 Impatiens Himalayan balsam 3
 arvensis glandulifera

 33
Scientific name Common name Score Scientific name Common name Score
Iris pseudacorus Pale yellow iris 3 Poa pratensis Kentucky bluegrass 3
Lespedeza bicolor Shrubby lespedeza 3 Poa spp. Poa species 4
Lespedeza Japanese bush 3 Populus alba White poplar 2
thunbergii clover Populus nigra Lombardy poplar 2
Leucanthemum Ox-eye daisy 3
 Potentilla recta Sulphur cinquefoil 3
vulgare
Leymus arenarius Lymegrass 2 Prunella vulgaris Self-heal, heal-all 2
Ligustrum Border privet 2 Prunus avium Sweet cherry 2
obtusifolium Pueraria lobata Kudzu 3
Ligustrum spp. Privet (spp.) 2 Pueraria montana Kudzu 3
Ligustrum vulgare Common privet 2 Ranunculus repens creeping buttercup 4
Lonicera maackii Amur honeysuckle 3 Rhamnus cathartica Common buckthorn 4
Lonicera morrowii Morrow 3 Rhamnus frangula Glossy buckthorn 5
 honeysuckle
Lonicera spp. Lonicera species 3 Rhamnus utilis Chinese buckthorn 3
Lonicera tatarica Smooth Tartarian 3 Rhodotypos Jetbead 2
 honeysuckle scandens
Lonicera x bella Hybrid honeysuckle 3 Robinia hispida Bristly locust 2
Lonicera xylosteum European fly 3 Robinia Black locust 3
 honeysuckle pseudoacacia
Lotus corniculatus Bird's-foot trefoil 4 Rosa multiflora Multiflora rose 4
Lupinus polyphyllus Bigleaf lupine 3 Rumex acetosella Sheep sorrel 5
Lysimachia Moneywort 3 Salix fragilis Crack willow 2
nummularia Salix x rubens Hybrid crack willow 2
Lythrum salicaria Purple loosestrife 5 Saponaria officinalis Bouncing bet, 1
Melilotus alba White sweet clover 5 soapwort
Melilotus albus White sweet clover 5 Securigera varia* Crown vetch 4
Melilotus officinalis Yellow sweet clover 5 Senecio jacobaea stinking willie 4
Microstegium Japanese stiltgrass 5 Solanum dulcamara Bittersweet 2
vimineum nightshade
Myriophyllum Eurasian water- 3 Tamarix parviflora Tamarisk 3
spicatum* milfoil Taraxacum Common dandelion 3
Nitellopsis obtusa* Starry stonewort 4 officinale
Pastinaca sativa Wild parsnip 2 Torilis japonica Hedge-parsley 2
Persicaria perfoliata Mile-a-minute weed 4 Trifolium pratense Red clover 3
Petasites hybridus Butterbur 2 Trifolium repens White clover 3
Phalaris Reed canary grass 5 Typha angustifolia Narrow-leaved 5
arundinacea cattail
Phleum pratense Timothy 5 Typha x glauca Cattail 5
Phragmites Phragmites (exotic) 4 Ulmus pumila Siberian Elm 2
australis subsp. Verbascum thapsus Common mullein 2
australis Vincetoxicum Black swallow-wort 4
Pinus sylvestris Scotch pine 2 nigrum
Poa compressa Canada bluegrass 4 Vincetoxicum Pale swallow-wort 4
 rossicum

 34
Table 2 - 2. Scoring for natural community metrics developed by Cohen et al. (2019). All
Michigan natural community types are listed with their assocaited global and state ranks (G-rank
and S-rank,) assigned by NatureServe and MNFI to rank the rarity and vulnerability of natural
community types. See Table 1 for descriptions of Natural Community Rarity, Resilience,
Richness, and Ecosystem Services metrics.
 Natural Natural Natural
 Com- Commun- Natural Community
 G- S- munity ity Community Ecosystem
 Natural Community Type RANK RANK Rarity Resilience Richness Services
 Alvar G2? S1 5 2 4 2
 Bog G3G5 S4 2 4 2 3.5
 Boreal Forest GU S3 3 4 2 3.5
 Bur Oak Plains G1 SX 5 0 0 0
 Cave G4? S1 4 5 1 1
 Clay Bluff GNR S2 4 1 1 1
 Coastal Fen G1G2 S2 4 2.5 3 3
 Coastal Plain Marsh G2 S2 4 1 5 3
 Dry Northern Forest G3? S3 3 3 2 3
 Dry Sand Prairie G3 S2 4 2 3 2.5
 Dry Southern Forest G4 S3 3 2 3 3
 Dry-mesic Northern Forest G4 S3 3 3 3 3
 Dry-mesic Prairie G3 S1 4 1 4 2
 Dry-mesic Southern Forest G4 S3 3 2 3 3.5
 Emergent Marsh GU S4 2 2 1 2.5
 Floodplain Forest G3? S3 3 2 5 5
 Granite Bedrock Glade G3G5 S2 4 2.5 2 2
 Granite Bedrock Lakeshore G4G5 S2 4 3 1 1
 Granite Cliff G4G5 S2 4 5 1 0.5
 Granite Lakeshore Cliff GU S1 5 5 1 0.5
 Great Lakes Barrens G3 S2 4 2 2 2.5
 Great Lakes Marsh G2 S3 3 1.5 4 5
 Hardwood-Conifer Swamp G4 S3 3 3 4 3
 Hillside Prairie G3 S1 4 1 3 2.5
 Inland Salt Marsh G1 S1 5 2 1 1
 Interdunal Wetland G2? S2 4 3 2 1.5
 Intermittent Wetland G2 S3 3 3 2 2
 Inundated Shrub Swamp G4 S3 3 4 1 1.5
 Lakeplain Oak Openings G2? S1 5 1 3 3
 Lakeplain Wet Prairie G2 S1 5 1 4 4
 Lakeplain Wet-mesic G1? S1 5 1 5 4
 Prairie
 Limestone Bedrock Glade G2G4 S2 4 2 2 2
 Limestone Bedrock G3 S2 4 2.5 1 1
 Lakeshore
 Limestone Cliff G4G5 S2 4 5 1 1
 Limestone Cobble Shore G2G3 S3 3 2.5 1 1
 Limestone Lakeshore Cliff G4G5 S1 4 5 1 1
 Mesic Northern Forest G4 S3 3 3 4 3
 Mesic Prairie G2 S1 5 1 5 2

 35
You can also read