Predictability of leaf traits with climate and elevation: a case study in Gongga Mountain, China
←
→
Page content transcription
If your browser does not render page correctly, please read the page content below
Tree Physiology 41, 1336–1352
https://doi.org/10.1093/treephys/tpab003

Research paper

Predictability of leaf traits with climate and elevation:
a case study in Gongga Mountain, China

                                                                                                                                                                             Downloaded from https://academic.oup.com/treephys/article/41/8/1336/6094892 by guest on 22 September 2021
Huiying Xu 1,2 , Han Wang1,2,8 , I. Colin Prentice1,3,4 , Sandy P. Harrison1,5 , Genxu Wang6,7 and
Xiangyang Sun7

1
  Ministry of Education Key Laboratory for Earth System Modeling, Department of Earth System Science, Tsinghua University, Shuangqing Road, Haidian District, Beijing
100084, China; 2 Joint Center for Global Change Studies (JCGCS), Shuangqing Road, Haidian District, Beijing 100875, China; 3 Department of Life Sciences, Imperial College
London, Silwood Park Campus, Buckhurst Road, Ascot SL5 7PY, UK; 4 Department of Biological Sciences, Macquarie University, Balaclava Road, North Ryde, NSW 2109,
Australia; 5 School of Archaeology, Geography and Environmental Sciences (SAGES), University of Reading, Reading Berkshire RG6 6AH, UK; 6 Institute of Mountain Hazards
and Environment, Chinese Academy of Sciences, Renmin South Road, Wuhou District, Chengdu, China; 7 State Key Laboratory of Hydraulics and Mountain River Engineering,
Sichuan University, Renmin South Road, Wuhou District, Chengdu 610065, China; 8 Corresponding author (wang_han@mail.tsinghua.edu.cn)

Received August 17, 2020; accepted January 4, 2021; handling Editor Annikki Mäkelä

Leaf mass per area (M a ), nitrogen content per unit leaf area (N area ), maximum carboxylation capacity (V cmax ) and the
ratio of leaf-internal to ambient CO2 partial pressure (χ) are important traits related to photosynthetic function, and they
show systematic variation along climatic and elevational gradients. Separating the effects of air pressure and climate
along elevational gradients is challenging due to the covariation of elevation, pressure and climate. However, recently
developed models based on optimality theory offer an independent way to predict leaf traits and thus to separate the
contributions of different controls. We apply optimality theory to predict variation in leaf traits across 18 sites in the
Gongga Mountain region. We show that the models explain 59% of trait variability on average, without site- or region-
specific calibration. Temperature, photosynthetically active radiation, vapor pressure deficit, soil moisture and growing
season length are all necessary to explain the observed patterns. The direct effect of air pressure is shown to have a
relatively minor impact. These findings contribute to a growing body of research indicating that leaf-level traits vary
with the physical environment in predictable ways, suggesting a promising direction for the improvement of terrestrial
ecosystem models.

 Keywords: deciduous LMA prediction, elevation gradients, leaf functional traits, leaf nitrogen prediction, optimality-based
 models, trait–climate relationships.

Introduction
                                                                                        of photosynthetic capacity also incurs a substantial carbon cost
A number of leaf traits are diagnostic of photosynthetic pro-                           in the form of leaf respiration to support protein synthesis.
cesses. The ratio of leaf-internal to external CO2 (χ ) reflects the                    Leaf mass per unit area (Ma ) determines the total carbon cost
stomatal regulation of CO2 uptake, which has to be balanced                             of leaf construction (Wright et al. 2004). Nitrogen is required
against water loss (Wang et al. 2017b). The maintenance of                              for both metabolic processes and leaf construction (Lambers
transpiration involves a carbon cost, in the form of respiration                        and Poorter 1992, Onoda et al. 2004). Leaf nitrogen content
by living parenchyma cells, to maintain active water transport                          per unit area (Narea ) thus provides a combined measure of the
tissues. The maximum capacity of carboxylation at a standard                            metabolic and structural costs.
temperature of 25 ◦ C, V cmax25 , is a measure of the control of                           Empirical analyses of large trait data sets have shown that
photosynthesis by the amount of the enzyme (Rubisco) respon-                            variation in each of these traits is related to climate, and indeed
sible for carbon fixation (Wang et al. 2020). The maintenance                           specific climate variables can be shown to influence individual

© The Author(s) 2021. Published by Oxford University Press.
This is an Open Access article distributed under the terms of the Creative Commons Attribution License (http://creativecommons.org/licenses/by/4.0/),
which permits unrestricted reuse, distribution, and reproduction in any medium, provided the original work is properly cited.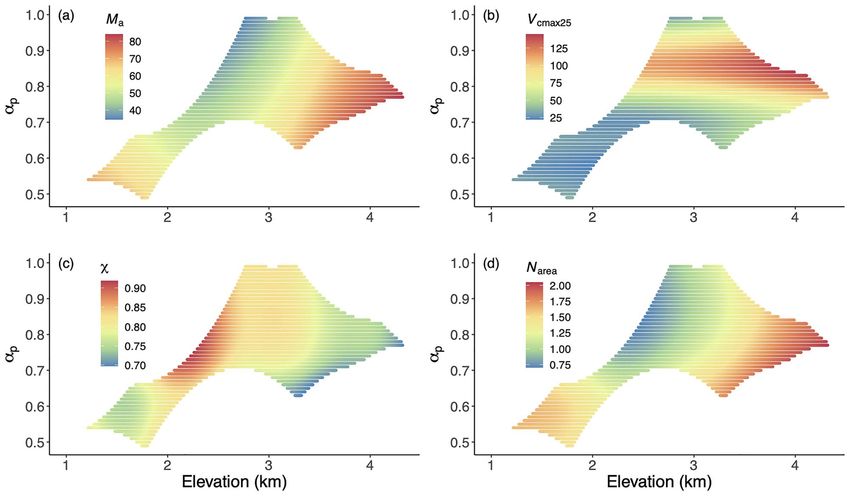
Predictability of leaf traits with climate and elevation 1337

processes (Wright et al. 2005, Ordoñez et al. 2009, Meng                  impacts of climate and elevation on photosynthesis. Optimal-
et al. 2015). The V cmax25 is primarily determined by the amount          ity theory is predicated on the idea that through evolution-
of Rubisco, while the activity of Rubisco varies with the leaf            ary processes (including selection for plasticity as well as
temperature (Devos et al. 1998, Rokka et al. 2010). Vapor                 environmental filtering of lineages) plants are adapted to the
pressure deficit represents the atmospheric moisture demand: it           environmental conditions under which they live. The values
is the difference between the saturated vapor pressure of water           of photosynthetic parameters are then predicted as the result
(a function of temperature) and the actual vapor pressure, which          of trade-offs between competing requirements, such as the
depends on the atmospheric pressure and moisture content.                 need to balance CO2 uptake against water loss. The balance
Vapor pressure deficit influences stomatal behavior and thereby           between maintaining carboxylation capacity and transpiration
induces variation in χ (Wang et al. 2017b). The amount of                 capacity can be described in terms of the least-cost hypothesis
light reaching the leaves influences Ma and Narea within the              (Wright et al. 2003, Prentice et al. 2014), which states that

                                                                                                                                               Downloaded from https://academic.oup.com/treephys/article/41/8/1336/6094892 by guest on 22 September 2021
canopy (Werger and Hirose 1991, Peltoniemi et al. 2012). Both             plants minimize the combined costs of maintaining these capac-
also vary with latitude because this determines total incident            ities. This hypothesis allows us to predict χ . The coordination
radiation and day length (Forsythe et al. 1995). Analyses have            hypothesis (Chen and Reynolds 1997, Maire et al. 2012, Wang
shown that the variability in each of these traits is largely             et al. 2017b) indicates that carbon gain is maximized through
independent of variability in the others (Yang et al. 2019).              balancing light and Rubisco limitations on photosynthesis. This
   Elevational transects provide examples of trait variability            hypothesis allows us to predict V cmax25 (Smith et al. 2019). The
along environmental gradients (Jian et al. 2009, Asner and                need to allocate nitrogen to structural and metabolic processes
Martin 2016, Asner et al. 2017, Pfennigwerth et al. 2017).                allows us to predict Narea as a function of V cmax25 and Ma
Although this variability is partly related to the changes in climate     (Dong et al. 2017). According to the optimal leaf longevity
with elevation, the impact of changing elevation on air pressure          (LL) hypothesis (Kikuzawa 1991), plants maximize the time-
is also thought to be significant (Gale 1972, Terashima et al.            averaged net carbon gain of leaves, taking into account the con-
1995, Wang et al. 2014, Wang et al. 2017a). Reduction in                  struction costs (amortized over the leaf lifetime) and the decline
air pressure at higher elevations lowers the partial pressure of          in photosynthetic capacity with increasing age. This hypothesis
oxygen. All else being equal, it also decreases the water vapor           allows Ma to be predicted from LL. The LL of deciduous species
pressure and increases the atmospheric transmissivity to solar            is constrained by growing season length (gsl); thus, Ma of
radiation. The reduction in partial pressure of oxygen increases          deciduous species should be predictable fromgsl.
the affinity of Rubisco for CO2 , which reduces photorespiration.             In this study, we draw on these theoretical developments
The effects of decreasing water vapor pressure and increasing             to predict trait variability in response to climate and elevation
transmissivity are often countered by decreasing temperature              gradients in the Gongga Mountain region, China. We develop a
and increasing cloudiness. Nonetheless, their contribution (com-          new optimality model to predict Ma of deciduous species and a
pared with the situation at constant elevation) is to increase the        simplified optimality approach to predict Narea . These optimality
vapor pressure deficit—because atmospheric pressure automat-              models were developed independently of the observations used
ically declines with elevation, while the saturated vapor pressure        in this study and require no calibration. We show that these
does not—resulting in higher water transport costs and lower χ ,          models capture observed variations in photosynthetic traits at
and to increase absorbed light, resulting in increased V cmax25 ,         sites in the Gongga Mountain region. We then use these models
Ma and Narea (Wang et al. 2017a).                                         to quantify the relative contribution of different factors to the
   It is difficult to disentangle the effects of air pressure and         observed changes in trait values at these sites.
climate along elevation gradients because of their covariation.
Attempts to separate out climate and elevation empirically by             Materials and methods
comparing low-elevation sites at higher latitude with high-
elevation sites at lower latitude (Körner et al. 1991) have               Study sites
distinguished the impacts of temperature from air pressure                We collected photosynthetic trait data from 18 sites in
but have not addressed specific climate influences. However,              the Gongga Mountain region of Sichuan Province, China
understanding the relative importance of air pressure effects             (Figure 1a and b). The study area extends from 29◦ 22 to 29◦
on photosynthesis could be important in the face of projected             55 N and from 101◦ 1 to 102◦ 9 E. The sampled sites span an
climate changes, in particular, given the apparent sensitivity of         elevation gradient from 1143 to 4361 m, and as a result, there
high-elevation sites to these changes (Stocker et al. 2013,               is a considerable gradient in growing season temperature (see
Settele et al. 2015).                                                     Table S1 available as Supplementary data at Tree Physiology
   Recent progress in the application of optimality theory to             online). Sites from the western part of the Gongga Mountain
predict trait variation (Prentice et al. 2014, Dong et al. 2017,          region tend to be drier than the sites at a corresponding
Wang et al. 2017b) offers an alternative way to examine the               elevation in the eastern part, and thus, our data set also

                                                                         Tree Physiology Online at http://www.treephys.oxfordjournals.org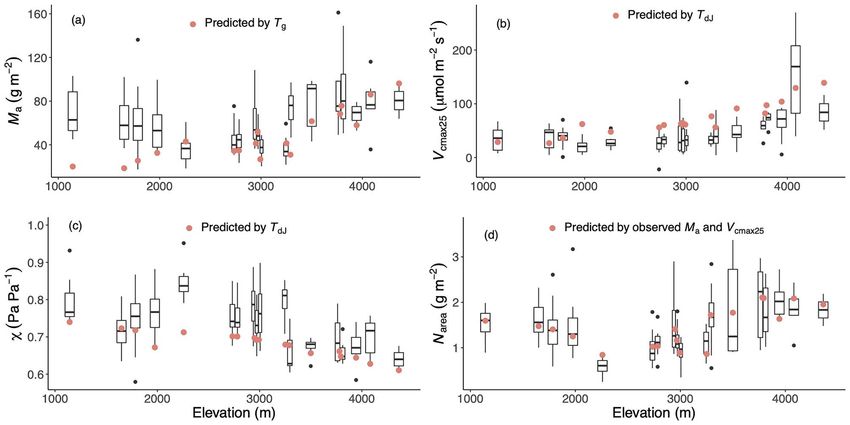
1338 Xu et al.

                                                                                                                                                           Downloaded from https://academic.oup.com/treephys/article/41/8/1336/6094892 by guest on 22 September 2021
Figure 1. The study area. (a) The location of the Gongga Mountain region in China, (b) spatial distributions of the sampled sites in the Gongga
Mountain region, shown by red dots, and (c) the daytime temperature in July (T dJ ) and the ratio of annul actual evapotranspiration to annual potential
evapotranspiration (α p ) at the sampled sites. The background to plots (a) and (b) shows elevation.

samples a large moisture gradient (see Table S1 available as                  Measurements were made on the young but fully expanded
Supplementary data at Tree Physiology online). The vegetation                 leaves attached to the cut branch.
at lower elevations is deciduous broad-leaved forest dominated                   Our analyses focus on four leaf traits: (i) leaf mass per
by Betulaceae, Urticaceae, Caprifoliaceae and Rosaceae, and it is             unit area (Ma , g biomass m−2 ), (ii) the maximum capacity of
replaced by evergreen needle-leaved forest and subsequently by                carboxylation at 25 ◦ C (V cmax25 , μmolC m−2 s−1 ), (iii) the ratio
deciduous shrubland dominated by Pinaceae and/or Rosaceae                     of leaf-internal to ambient CO2 partial pressure (χ , unitless)
and Ericaceae (see Table S2 available as Supplementary data at                and (iv) leaf nitrogen content per unit area (Narea , g m−2 ). (see
Tree Physiology online) with increasing elevation. Although ever-             Table 1 for definitions of parameters and other abbreviations
green woody species are present at all of the sites (see Table S2             frequently used in the text.) The Ma was obtained from the
available as Supplementary data at Tree Physiology online), and               measurements of leaf area and dry weight following standard
trait measurements were made on these species, our subse-                     protocols (Cornelissen et al. 2003). Leaf area was taken as the
quent analyses of photosynthetic traits focused entirely on the               projected area of a leaf, or leaflet for compound leaves, using
deciduous species because of the difficulty of obtaining reliable             a LiDE 220 Scanner (Canon Inc., Huntington, NY, USA). Dry
estimates of leaf age based on a single sampling of a site.                   weight was obtained after air-drying for several days and then
                                                                              after oven-drying at 75 ◦ C for 48 h to constant weight. The
Sample collection and analysis                                                Ma value of one species at each site was the average of three
Trait data were measured in late July 2018 and early August                   measurements made on leaves from multiple individuals. Leaf
2019 during the active growing season in the Gongga Mountain                  nitrogen content was measured using an Isotope Ratio Mass
region. We used a stratified sampling strategy at each site in                Spectrometer (Thermo Fisher Scientific Inc., Carlsbad, CA, USA).
order to sample the dominant species in each canopy stratum.                  The Narea was calculated from Ma and leaf nitrogen content. Leaf
In forest sites, we sampled a minimum of five tree, five shrub                nitrogen content (for Narea ) and stable carbon isotope (δ 13 C, for
and five forb species at each site and also sampled graminoids,               χ ) measurements were made on pooled samples of leaves from
lianas and climbers, and pteridophytes when present (see                      multiple individuals.
Table S2 available as Supplementary data at Tree Physiology                      We used a portable infrared gas analyzer system (LI-6400;
online). At the highest elevation sites (3794, 3943, 4081                     Li-Cor Inc., Lincoln, NE, USA) to make the leaf gas-exchange
and 4361 m), where shrubs form the upper canopy, we only                      measurements. Sunlit terminal branches from the upper canopy
sampled shrubs and forbs (and at the highest site one pteri-                  were collected and re-cut under water immediately prior to mea-
dophyte), but again, we sampled a minimum of five species in                  surement. Measurements were made in the field with relative
each category. All samples were taken from the outer canopy.                  humidity and chamber block temperature close to that of the

Tree Physiology Volume 41, 2021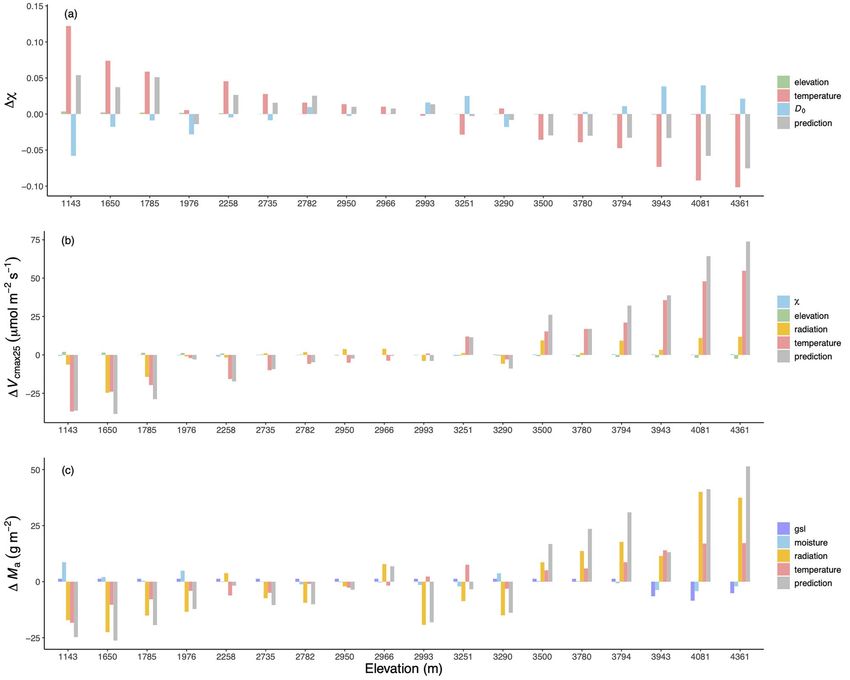
Predictability of leaf traits with climate and elevation 1339

Table 1. Parameters and abbreviations frequently used in the text. The table provides information on the meaning and units

Parameters and abbreviations             Unit                                     Description
                                                −1
χ                                        Pa Pa                                    The ratio of leaf-internal to ambient CO2 partial pressures
Ma                                       g biomass m−2                            Leaf mass per area
Narea                                    g m−2                                    Leaf nitrogen content per area
V cmax                                   μmolC m−2 s−1                            The maximum capacity of carboxylation
V cmax25                                 μmolC m−2 s−1                            The maximum capacity of carboxylation at standard 25 ◦ C
                                         molC m−2 day−1                           Used when calculating b in Ma section
Tg                                       ◦C                                       Mean temperature during the growing season (mean daily
                                                                                  temperature above a baseline of 0 ◦ C)
D0                                       kPa                                      Mean vapor pressure deficit during the growing season
R0                                       μmol photon m−2 s−1                      Mean photosynthetically active radiation during the growing

                                                                                                                                                   Downloaded from https://academic.oup.com/treephys/article/41/8/1336/6094892 by guest on 22 September 2021
                                                                                  season
RLAI                                     mol photon m−2 day−1                     Mean leaf-area-index-weighted photosynthetically active
                                                                                  radiation during the growing season
f                                        day day−1                                The ratio of gsl to the number of days in the year
MAP                                      mm                                       Mean annual precipitation
αp                                       mm mm−1                                  The ratio of annual actual evapotranspiration to annual
                                                                                  potential evapotranspiration
T dJ                                     ◦C                                       Mean daytime temperature of July
∗                                       Pa                                       The photorespiratory compensation point
ca                                       Pa                                       Ambient CO2 partial pressure
ci                                       Pa                                       Internal CO2 partial pressure
β                                        unitless                                 The ratio at 25 ◦ C of the unit costs of maintaining
                                                                                  carboxylation and transpiration capacities (estimated as 146)
K                                        Pa                                       The effective Michaelis–Menten coefficient of Rubisco
Kc                                       Pa                                       The Michaelis–Menten coefficients of Rubisco for carboxylation
c                                        unitless                                 A constant proportional to the unit carbon cost for the
                                                                                  maintenance of electron transport capacity (0.41)
LL                                       day                                      Leaf longevity
b                                        day                                      The potential age when leaves can no longer photosynthesize
                                                                                  and assimilate CO2
k                                        g biomass mol C−1                        Scaling factor
Iabs                                     mol photon m−2 day−1                     The photosynthetically active radiation absorbed by leaves
CC                                       gC gC−1                                  A constant representing the construction carbon cost per unit
                                                                                  leaf mass carbon
Aa                                       g biomass m−2 day−1                      Daily carbon assimilation rate per unit leaf area
ϕ0                                       μmol C μmol−1 photon                     The intrinsic quantum efficiency of photosynthesis
                                         mol C mol−1 photon                       Used in Eq. (12) of the Ma section
Nrubisco                                 g m−2                                    Nitrogen content in Rubisco enzymes
Nstructure                               g m−2                                    Nitrogen content in leaf structure

                                                                                                                 f  ∗
ambient air at the time of measurement and with a constant                                              +          ca    – as
airflow rate (500 μmol s−1 ). The V cmax was calculated from the                                   χ=                            ,          (1)
                                                                                                            b    – as
light-saturated rate of net CO2 fixation at ambient CO2 using the
one-point method (De Kauwe et al. 2016) and was adjusted to
a standard temperature of 25 ◦ C (V cmax25 ) using the method             where as , b and f  are the fractionations associated with
of Bernacchi et al. (2003). The V cmax value of one species               diffusion in air (4.4‰), Rubisco carboxylation (30‰) and pho-
at each site was obtained from one individual only due to the             torespiration (16‰), respectively.  ∗ is the photorespiratory
time-consuming nature of the measurement.                                 compensation point and ca is the ambient CO2 partial pressure.
   Carbon isotopic values (δ 13 C) were measured using an Iso-
tope Ratio Mass Spectrometer (Thermo Fisher Scientific Inc.,              Climate data
Carlsbad, CA, USA). Estimates of χ were made using the sim-               In situ climate data were only available for five (1785, 2782,
plified method of Ubierna and Farquhar (2014) to calculate iso-           2993, 3251 and 3943 m) of the 18 sampled sites. We
topic discrimination () from δ 13 C by considering discrimination        therefore estimated the climate at each site consistently by
during stomatal diffusion, carboxylation and photorespiration,            interpolation between a larger set of weather stations in the
thus following the relationship:                                          region (17 stations, see Figure S1 available as Supplementary

                                                                          Tree Physiology Online at http://www.treephys.oxfordjournals.org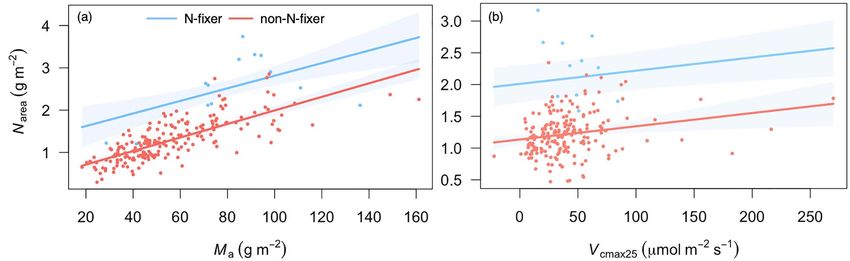
1340 Xu et al.

data at Tree Physiology online) for the period from January             (RDA: Legendre and Legendre 2012) to determine the main
2017 to December 2019 (http://data.cma.cn/data/cdcdetail/               patterns of trait variation using species average values from
dataCode/SURF_CLI_CHN_MUL_MON.html) to create seasonal                  each site, assess how much of this variation is explained by
climatologies of monthly maximum and minimum temperatures,              environmental factors and determine the correlations between
fraction of sunshine hours, water vapor pressure and pre-               traits and environment. The RDA was performed using the vegan
cipitation. These 17 stations range in elevation from 422 to            package in R (Oksanen et al. 2017). In order to compare the trait
3951 m. We then used the elevationally sensitive ANUSPLIN               variability within and across sites, we calculated the coefficient
interpolation scheme (Hutchinson and Xu 2004) to provide                of variation (CV: Brown 1998), a standardized measure of the
estimates of these meteorological variables at each of the sites.       dispersion of a frequency distribution, for the data set as a whole
The monthly estimates at each site were converted to daily              and at each site, for each of the traits independently.
values by linear interpolation in order to calculate the bioclimatic       We used generalized additive models (GAMs) to analyze

                                                                                                                                              Downloaded from https://academic.oup.com/treephys/article/41/8/1336/6094892 by guest on 22 September 2021
variables required as inputs to our models, specifically, growing       trait variability with α p and elevation. The GAMs (Hastie and
season mean daytime temperature (T g ), growing season mean             Tibshirani 1990) allow flexible relationships between response
vapor pressure deficit (D0 ) and growing season mean photo-             and predictor variables to be fitted to the data, avoiding the
synthetically active radiation (R0 ), where the growing season          need to assume the form of the function in advance. Convex
was defined as the period when the daily temperature is above           hulls were used to exclude areas of the fitted surface that were
0 ◦ C. We also calculated the ratio of gsl to the number of days        not well constrained by observations. The GAMs were fitted
in the year (f ) and the leaf-area-index-weighted R0 (RLAI ) to         using the mgcv package (Wood 2001), and α-convex hull was
represent the effect of light interception by different layers in the   produced using alphahull package in R (Rodríguez Casal and
canopy (Dong et al. 2017). The average leaf area index during           Pateiro López 2010).
July and August (i.e., the months the trait data were collected)
                                                                        Trait prediction
in 2018 and 2019 was derived from the MODIS leaf area index
product (MCD15A3H: https://modis.gsfc.nasa.gov/). An annual             We used existing optimality based models of χ and V cmax25 and
moisture index (α p , an estimate of the ratio of annual actual         new models of Ma and Narea to predict the distribution of traits
evapotranspiration to annual potential evapotranspiration) was          with climate and elevation across the sites. We used gsl as a
calculated from the monthly temperature, precipitation and              proxy for the LL of deciduous plants. Specific photosynthetic
fraction of sunshine hours at each site using the simple process-       traits adjust to the environmental conditions over different
led algorithms for simulating habitats (SPLASH) model (Davis            timeframes (Xu and Baldocchi 2003, Jiang et al. 2020), so
et al. 2017). Given the large difference between daytime and            we tried two alternative measures of temperature (T g and T dJ )
night-time temperatures at high elevations, we also calculated          as predictors. The models for χ and V cmax25 apply for both
the mean daytime temperature of July (T dJ ) by approximating           deciduous and evergreen species.
the daily temperature cycle with a sine curve:
                                                                        The model for χ This model is based on the assumption of
              ⎧        1 ⎫          ⎧                ⎫                evolutionary optimality in the trade-off between the costs of
              ⎨1  1 – x2 2 ⎬          ⎨ 1 1 – x2  12 ⎬                transpiration and carbon gain. The least-cost hypothesis predicts
  TdJ = Tmax    +              + Tmin    –               ,
             ⎩ 2 2 cos – 1 x ⎭        ⎩ 2 2 cos – 1 x ⎭                 that plants minimize the total costs of photosynthesis, i.e.,
                                                               (2)      the requirement to maintain capacities for both carboxylation
where T max is the mean daily maximum air temperature, T min is         and transpiration (Wright et al. 2003, Prentice et al. 2014).
the mean daily minimum air temperature and x = − tan ϕ tan              Using the standard photosynthesis model due to Farquhar et al.
δ, where ϕ is site latitude and δ is the average solar declination      (1980), Wang et al. (2017b) showed that χ could be predicted
in July.                                                                by:
   Comparison of the interpolated bioclimate variables with the                                                    ∗
                                                                                               ∗   ξ 1 – ca
values calculated using in situ data at the five sites where such                           χ=    +     √     ,                        (3)
data are available (see Figure S2 available as Supplementary                                   ca    ξ + D0
data at Tree Physiology online) suggests that the ANUSPLIN              where
interpolation provides robust estimates of the patterns of varia-
tion in climate across sites although, except for July temperature,                                   β (K +  ∗ )
                                                                                               ξ=                  ,                   (4)
the absolute values differ.                                                                              1.6η

Trait data analysis                                                     and

Analyses of the trait data focused on the predominant deciduous                                               Po
                                                                                               K = Kc 1 +              .               (5)
component of each community. We used redundancy analysis                                                      Ko

Tree Physiology Volume 41, 2021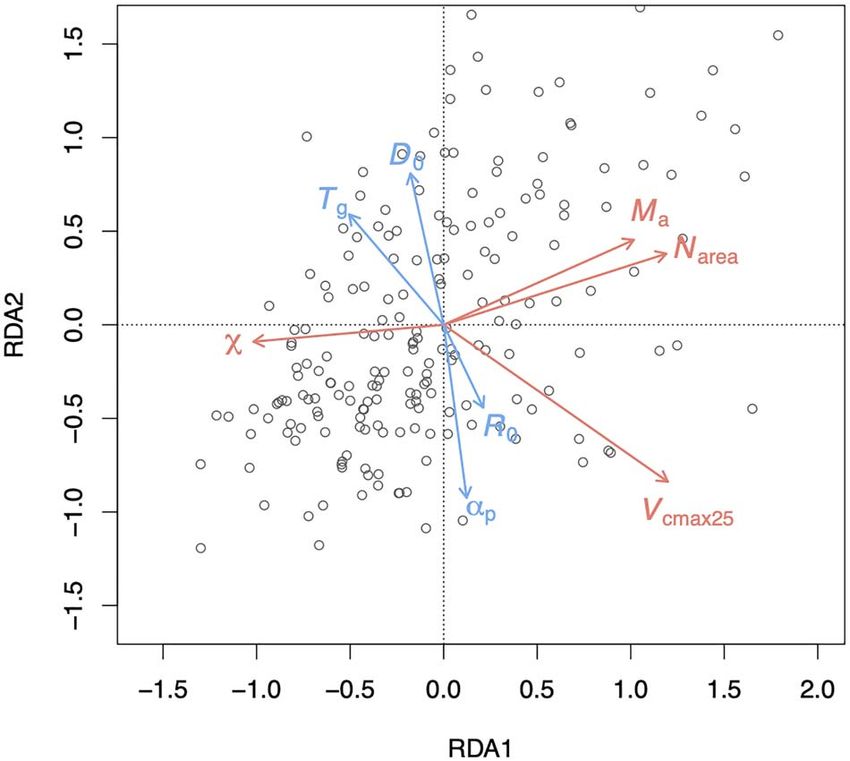
Predictability of leaf traits with climate and elevation 1341

   Here  ∗ is the photorespiratory compensation point, and                 A new model for Ma The Ma contributes to determining how
ca is the ambient CO2 partial pressure. The η is the viscosity              much leaf area can be displayed for a given amount of carbon
of water relative to its value at 25 ◦ C. The β is the ratio at             allocated to above-ground tissues (Cui et al. 2019). There is
25 ◦ C of the unit costs of maintaining carboxylation and tran-             a universal trade-off between Ma and LL across growth forms,
spiration capacities. Based on a global compilation of leaf 13 C            plant functional types (PFTs) and biomes, known as the ‘leaf
measurements, Wang et al. (2017b) estimated β = 146. The                    economics spectrum’ (Wright et al. 2004). The spectrum runs
K is the effective Michaelis–Menten coefficient of Rubisco. The             from a ‘fast’ to a ‘slow’ economic strategy. Plants adopting a fast
K c and K o are the temperature-dependent Michaelis–Menten                  economic strategy have rapid returns on investment (low Ma )
coefficients for carboxylation and oxygenation, with reference              and short longevity (low LL), while plants adopting the slow
values at 25 ◦ C of 39.97 Pa and 27.48 kPa, respectively                    strategy have high Ma and high LL.
(Bernacchi et al. 2001). The Po is the ambient partial pressure                Here we propose a novel model for Ma , which combines

                                                                                                                                                      Downloaded from https://academic.oup.com/treephys/article/41/8/1336/6094892 by guest on 22 September 2021
of O2 . The composite variable ξ determines the sensitivity of χ            three optimality-based predictions. We start from the model
to D0 . This dependence is influenced by temperature (via  ∗ , K           proposed by Kikuzawa (1991). By assuming that the average
and η) and O2 pressure (via K) according to Eqs (4) and (5).                net carbon gain by a leaf during its lifetime is maximized, this
                                                                            model provides an optimality-based prediction of the trade-off
The model for Vcmax25 The coordination hypothesis states that               between Ma and LL:
plants coordinate light-limited and Rubisco-limited photosynthe-
sis rates so as to be equal under average daytime conditions                                                2b ∗ CC ∗ Ma
(Chen et al. 1993). This coordination ensures that the use                                         LL =                  .                   (10)
                                                                                                                 Aa
of absorbed light is maximized without incurring additional
maintenance costs for V cmax . The V cmax acclimated to growth
                                                                               Here b (day) is the potential age at which leaves can no longer
temperature can be predicted from the universal model of
                                                                            photosynthesize, CC (gC gC−1 ) is the construction cost per unit
carbon uptake proposed by Wang et al. (2017b):
                                                                            mass of leaf carbon and Aa (g biomass m−2 day−1 ) is the daily
                                                                           carbon assimilation rate per unit leaf area. The Ma can be written
                                ci + K                 c   2
                                                           3                as a function of LL, b and Aa from Eq. (10). Consequently,
            Vcmax = ϕ0 R0                         1–           ,   (6)
                              ci + 2 ∗                m                    understanding the environmental responses of these three traits
                                                                           is the key to predicting Ma .
                                 ci –  ∗
                        m=                        ,                (7)         Second, Xu et al. (2017) showed that b is approximately
                                ci + 2 ∗
                                                                            proportional to Ma and inversely proportional to V cmax25 :
where ϕ 0 is the intrinsic quantum efficiency of photosynthesis
(0.085 μmol C μmol−1 photon), and ci is the leaf-internal                                                     u Ma
CO2 partial pressure, which is the product of observed χ and                                           b=             .                      (11)
                                                                                                            k Vcmax25
ca . The c is a constant proportional to the unit carbon cost
for the maintenance of electron transport capacity (a value                     Here u ≈ 8889 (dimensionless), estimated from a meta-
of 0.41 was estimated from an independent global data set                    analysis of data on 49 species across temperate and tropical
on photosynthetic capacities). The m represents the effect of                biomes (Xu et al. 2017), and k is a scaling factor (30 g biomass
subsaturating CO2 on the light-limited rate of photosynthesis.               mol C−1 ).
    The kinetic response of Rubisco to temperature allows                       Third, the coordination hypothesis allows optimal values of
V cmax25 to be estimated from V cmax at growth temperature                   V cmax to be predicted by equating the Rubisco-limited assimila-
(T g ), by the following relationship:                                       tion rate with the electron transport limited rate under typical
                                                                             daytime conditions that include temperature, vapor pressure
                        Vcmax = Vcmax25 fv ,                         (8)     deficit, ambient CO2 and the photosynthetically active radiation
                                                                             absorbed by leaves (Iabs ). The model has the mathematical
                                                      –
                                       1+e (298.15S     H d )/(298.15R)     form of a ‘light–use efficiency model’: that is, modeled total
fv = eHa (Tg – 298.15/(298.15Tg R)) ×                 –                  ,
                                         1+e    (Tg S   H d )/(Tg R)        photosynthesis over any period is proportional to the total light
                                                                     (9)     absorbed during that period, which is consistent with classical
where Ha is the activation energy (71,513 J mol−1 ), R is the                studies on crop growth (Wang et al. 2017b). For this derivation,
                                        −1   −1
universal gas constant (8.314 J mol K ), Hd is the deacti-                   we made the simplifying assumption that the maximum rate of
vation energy (200,000 J mol−1 ) and S is an entropy term                   electron transport (Jmax ) is large enough that the square-root
(J mol−1 K−1 ) calculated using a linear relationship with T g , with        term in Eq. (6) can be neglected. We substituted Eqs (8) and
a slope of 1.07 J mol−1 K−2 and intercept of 668.39 J mol−1 K−1              (9) into (11) to predict b from Ma and V cmax , which is then
(Kattge and Knorr 2007).                                                     predictable from ϕ 0 , Iabs , ci ,  ∗ and K. In this way, we obtained

                                                                           Tree Physiology Online at http://www.treephys.oxfordjournals.org
1342 Xu et al.

a theoretical prediction of Ma :                                        for Ma was:

                                     (ci –  ∗ ) (ci + K)               ln (Ma ) = 1.22 ln (RLAI ) + 0.78 ln(f) – 0.06 Tg – 0.60 ln (αp)
           Ma = ϕ0 Iabs LL k                               .   (12)
                                   (2uCCfv ) (ci + 2 ∗ )2                        + 1.70.                                            (15)

   In addition to the implied proportionality of Ma with both           A simple model for Narea The Narea represents the sum of
absorbed light and LL, Eq. (12) indicates the existence of a            nitrogen in both metabolic and structural components of a leaf.
composite temperature effect due to the temperature depen-              Dong et al. (2017) proposed a model to predict Narea from
dencies of χ ,  ∗ , K and f v . In order to separate these depen-      Ma and V cmax25 by assuming (based on previously published
dencies, estimate the net effect of temperature more easily and         analyses) that (i) V cmax25 is proportional to nitrogen in Rubisco
account for the moisture effect detected in the China Plant Trait       and (ii) non-photosynthetic nitrogen is almost proportional to

                                                                                                                                             Downloaded from https://academic.oup.com/treephys/article/41/8/1336/6094892 by guest on 22 September 2021
database (Wang et al. 2018), we obtained the partial derivative         Ma . The model of Dong et al. (2017) is as follows:
of ln(Ma ) in Eq. (12) with respect to temperature (T g ) and
evaluated the result under standard environmental conditions.                           Narea = 9.5Nrubisco + Nstructure ,           (16)
This predicts a decline in ln(Ma ), for a given LL and Iabs , of ≈3%
per degree increase in growth temperature (T g ). In addition, all
the constants (ϕ 0 , u, k, CC and reference values of f v , K, ci and                     Nstructure = 10 – 2.67 Ma 0.99             (17)
 ∗ at 25 ◦ C) are combined into a single parameter C 1 to reduce       and
the complexity of the model. A linearized equation for predicted
Ma can then be derived as:                                                               Nrubisco = 0.003135Vcmax25 .                (18)

                                                                           The coefficient of Nrubisco in Eq. (16) reflects the allocation
     ln (Ma ) = ln (Iabs ) – 0.03 Tg + ln (LL) + ln (C1 ) ,    (13)     of total metabolic nitrogen to Rubisco, which however, varies
                                                                        among species. We used the observed Ma and V cmax25 in this
where C 1 is a free parameter. For deciduous species, there is an       study to estimate Nstructure and Nrubisco in Eqs (17) and (18),
additional constraint on LL by gsl in Eq. (13), thus we obtained        then fitted a regression of metabolic nitrogen (estimated as
the equation for deciduous species:                                     the difference between Narea and Nstructure ) against Nrubisco to
                                                                        estimate this coefficient for the deciduous species from the
      ln (Ma ) = ln (Iabs ) – 0.03 Tg + ln(f) + ln (C2 ) ,     (14)     Gongga sites. We obtained a value for the coefficient of Nrubisco
                                                                        of 7.2, which is within the predicted range given in Dong et al.
where f is the ratio of gsl to the number of days in the year.          (2017).
Thus, information on the number of days in a year is considered            However, there is considerable uncertainty in Eq. (18), which
in the free parameter (ln(C 2 ) = ln(C 1 ) + ln(365)), resulting in     describes the maximal catalytic turnover rate of Rubisco at
changing of C 1 to C 2 . The C 1 and C 2 are unknown a priori but       25 ◦ C (von Caemmerer et al. 1994, Harrison et al. 2009) as
could be estimated from observations.                                   well as in Eqs (16) and (17). To simplify the calculations and
   Although not included in this theoretical derivation, a strong       avoid these uncertainties, we adopted an alternative method to
negative effect of increasing moisture availability on Ma has           estimate Narea directly by regression as a linear combination of
been reported (Meng et al. 2015). We used the ratio of actual           all observed Ma and V cmax25 (without intercept) in this study,
to potential evapotranspiration (α p ) as an index of moisture          yielding a simpler model that applies to non-nitrogen-fixing
availability in order to estimate this effect from the data. Thus,      plants:
parameter C 2 is further replaced by C 3 to denote the parameter
                                                                                       Narea = 0.02Ma + 0.003V cmax25                (19)
difference in Eq. (14) and Eq. (15) after the moisture effect is
included.                                                               .
   We used an independent data set of ln(Ma ) for 621 decid-               We used this simple model to predict Narea first from
uous species from the China Plant Trait database (Wang et al.           observed—and then from predicted—V cmax25 and Ma . In this
2018) to estimate the parameter C 3 . Using RLAI to represent           way, we could first test whether Narea is indeed predictable from
the averaged light absorbed by leaves, we regressed the obser-          V cmax25 and Ma in our data set and then test whether Narea is
vations of ln(Ma ) against ln(RLAI ), T g , ln(f ) and ln(α p ) and     predictable from the climate data alone. In order to examine the
obtained an estimate of ln(C 3 ) of 1.70. The predictors in this        impact of nitrogen fixation on this relationship, we also included
analysis explained 53% of the variation in Ma , and the fitted          ‘N-fixer’ as a factor in this linear model. Partial residuals from
slopes of RLAI , T g and ln(f ) were quantitatively consistent with     the regression model for Narea were plotted using the visreg
their theoretical values as given in Eq. (14). Thus, the final model    package (Breheny and Burchett 2017).

Tree Physiology Volume 41, 2021
Predictability of leaf traits with climate and elevation 1343

Estimating the contribution of individual predictor
variables The contribution of each predictor variable to trait
variation was calculated in three steps. At Step 1, we created
a baseline by averaging the values of each predictor variable
across the 18 sites to create a data set for an ‘average’ site.
We used this average site data to calculate baseline trait values.
At Step 2, we changed one predictor variable at a time to the
actual value at that site, keeping all the other variables constant
at the average site value. We then calculated trait values using
these new inputs. At Step 3, the contribution of each predictor
variable was calculated as the difference between the traits

                                                                                                                                                        Downloaded from https://academic.oup.com/treephys/article/41/8/1336/6094892 by guest on 22 September 2021
simulated at Step 2 and the baseline value of the traits from
Step 1. This procedure allowed us to separate out the individual
influences of changes in air pressure with elevation, T dJ and D0
on χ , the influence of changes in air pressure with elevation, T dJ
and R0 on V cmax25 , as well as the impact of χ itself on V cmax25 .
It also allowed us to separate the effects of T g and RLAI on Ma
and the effects of LL (indexed by gsl) and moisture (indexed by          Figure 2. Climate-related trait dimensions from redundancy analysis
                                                                         (RDA). The climate variables (shown by blue arrows) are mean tem-
the ratio of annual actual evapotranspiration to annual potential        perature during the growing season, defined as days above a baseline
evapotranspiration) on Ma .                                              of 0 ◦ C (T g ), mean vapor pressure deficit (D0 ), mean photosynthetically
                                                                         active radiation (R0 ) and a moisture index (α p ) defined as the ratio of
                                                                         annual actual evapotranspiration to annual potential evapotranspiration.
Uncertainty of the model predictions The uncertainty of trait            The traits (shown by red arrows) are leaf mass per area (Ma ), leaf
prediction can come from two sources: parameter values and               nitrogen content per area (Narea ), the maximum capacity of carboxylation
input data. To evaluate the parameter uncertainty, we calculated         standardized to 25 ◦ C (V cmax25 ) and the ratio of leaf-internal to ambient
                                                                         CO2 partial pressures (χ). The gray circles are species average values
the uncertainty of each parameter separately and combined
                                                                         from each site.
them using the standard error propagation formula:

                                        2                              Results
                                   ∂m
                  u (y) =
                    2                          2
                                              u (ni ) ,       (20)
                               i   ∂ni                                   Trait variation related to climate
                                                                         The four climate variables together accounted for 22.2% of the
where u(y) is the standard uncertainty of the trait, ∂m/∂ni is           trait variation as shown in the RDA. The first axis explained
the sensitivity to variable ni (obtained by differentiating the          16.9% of the variability in the observations. On this axis,
individual equations) and u(ni ) is the standard uncertainty of ni .     variability was negatively related with temperature and positively
The uncertainty of predicted Ma and Narea values arises from             related with R0 (Figure 2). The second axis reflected gradients
the uncertainties in the coefficients fitted by regression and           in moisture (α p and vapor pressure deficit). Variability in χ
additional observed Ma and V cmax25 for Narea . The uncertainty of       was shown to be controlled by moisture, although with a small
χ and V cmax25 arises from the values of the various ecophys-            influence from temperature. The V cmax25 varied positively with
iological quantities in the prediction equations and additional          radiation, and negatively with temperature and moisture, in the
observed χ for V cmax25 , which show some degree of variation            opposite direction from χ . Temperature had a small positive
among species.                                                           influence on Ma but moisture had a negative impact, reflecting
                                                                         the fact that leaves were thicker in hotter and drier environments.
Model evaluation
                                                                         The Narea was mainly controlled by radiation and moisture and
We evaluated model performance by comparing the observed                 covaried with Ma and V cmax25 .
mean trait value at each site with predictions of each trait, using
r and root mean square error (RMSE) between the observed                 Observed and predicted trait variation with elevation
and predicted values across the sites. We compared the R2                All observed traits showed non-linear relationships with eleva-
explained by the optimality models and statistical models. To test       tion (Figure 3). Trait distributions in climate space also showed
whether the optimality-based models can capture the climate              non-linear relationships. (Figure 4). These non-linear relation-
variability, we also fitted multiple linear regressions of the site-     ships arose because although temperature (as measured by
mean trait values against the driving climate data which serve           either T g or T dJ ) decreased monotonically with elevation, the
as a statistical benchmark. All statistics were performed in             moisture-related variables in the Gongga Mountain region had
R3.1.3.                                                                  non-linear relationships with elevation (Figure 1c): the lowest

                                                                        Tree Physiology Online at http://www.treephys.oxfordjournals.org
1344 Xu et al.
Downloaded from https://academic.oup.com/treephys/article/41/8/1336/6094892 by guest on 22 September 2021
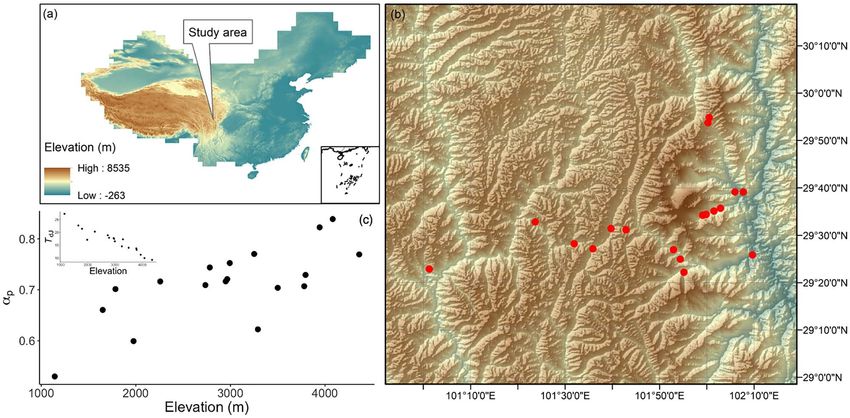
Figure 3. The observed and predicted values of traits along the altitudinal gradient. The traits are leaf mass per area (Ma ), leaf nitrogen content
per unit area (Narea ), the maximum capacity of carboxylation standardized to 25 ◦ C (V cmax25 ) and the ratio of leaf-internal to ambient CO2 partial
pressure (χ). Only the observed trait values of deciduous plants are shown in black with box plots. The best versions of each predicted trait are
shown as red dots: predicted Ma using mean temperature during the growing season, defined as days above a baseline of 0 ◦ C (T g ), predicted
V cmax25 and χ driven by daily temperature in July (T dJ ) and predicted Narea using observed Ma and V cmax25 .
and uppermost sites had lower mean annual precipitation (MAP) elevation (Table 2). The models also captured χ and V cmax25
and α p than the sites at intermediate elevations (see Table S1 variations for evergreen species, with r values of 0.68 and 0.67,
available as Supplementary data at Tree Physiology online). respectively (see Figure S4 available as Supplementary data at
The combination of these different trends in individual climate Tree Physiology online). However, predicted Ma using T dJ , χ
variables led to a complex pattern of trait variability. The Ma using T g and predicted Narea using Nstructure and Nrubisco were
and Narea were large under dry conditions and high elevation. underestimated, and V cmax25 using T g was overestimated (see
The V cmax25 increased along elevation and moisture gradients. Figure S5 available as Supplementary data at Tree Physiology
The χ was lower under dry conditions and low elevation. online). Using T dJ instead of T g improved the predictions of
Nevertheless, Ma , V cmax25 and Narea tended to increase over- V cmax25 and χ but degraded the prediction for Ma (Figure 5, see
all with elevation, while χ showed an overall decrease with Figure S6 available as Supplementary data at Tree Physiology
elevation. There was no trend in the CV of any of the traits online). The predicted χ values using T dJ were better than
with elevation (see Figure S3 available as Supplementary data those using T g , and the best-fit model could predict the values
at Tree Physiology online). Within-site CV values were larger across the sites with r = 0.71 and RMSE = 0.06 despite the
than across-site CV values at nearly half of the sites for Ma , χ bias, with median values of χ underpredicted at most sites
and Narea , while most of the within-site CV values were smaller (Figure 3). The uncertainties of predicted V cmax25 and Narea
than across-site CV values for V cmax25 . However, within-site were much narrower than the observed ranges. All parameters
variability differed between the traits. The V cmax25 was the most in the Narea models contributed almost equally to the uncertainty,
and χ was the least variable trait. while the parameter c was the major source of uncertainty for
The models captured the overall patterns of variability of the V cmax25 . The large uncertainty of Ma and χ mainly resulted
four traits between sites, with most of predicted values falling from the intercept and the parameter β, respectively (see
within the range of the observed values. The observed and Figure S7 available as Supplementary data at Tree Physiology
predicted site-mean values followed the 1:1 line (Figure 5), and online).
the average of the r values for the four traits was 0.75. Mean The Narea was shown to be strongly correlated with both Ma
RMSE values showed that differences between observations and V cmax25 (P < 0.001) (Figure 6, see Figure S8 available as
and predictions accounted for close to 30% of the mean trait Supplementary data at Tree Physiology online). However, there
values. The R2 values produced by the optimality models were was a significant effect of including nitrogen fixation (‘N-fixer’)
generally higher, except for Ma , due to its underestimation at low as a factor. At any given Ma or V cmax25 , Narea was slightly higher
Tree Physiology Volume 41, 2021
Predictability of leaf traits with climate and elevation 1345

                                                                                                                                                          Downloaded from https://academic.oup.com/treephys/article/41/8/1336/6094892 by guest on 22 September 2021
Figure 4. The distribution of predicted trait values in a climate space defined by elevation and a moisture index (α p ) using GAMs. The traits are (a)
leaf mass per area (Ma ), (b) the maximum capacity of carboxylation standardized to 25 ◦ C (V cmax25 ), (c) the ratio of leaf-internal to ambient CO2
partial pressure (χ) and (d) leaf nitrogen content per unit area (Narea ). Trait values are indicated by the color scale.

Table 2. The comparison between R2 of statistical models (multiple            Contribution of climate and elevation to trait variations
linear regressions of the site-mean trait values against the driving
climate data) and optimality models. For Ma , V cmax25 and χ, ‘T g ’ in
                                                                              Vapor pressure deficit and temperature were shown to be the
parentheses represents the predicted traits using mean temperature            most important factors influencing the variation in χ between
during growing season, ‘T dJ ’ represents the predicted traits using          sites at different elevations in the Gongga Mountain region,
daytime temperature in July. For Narea , ‘Ma + V cmax25 ’ represents the      but with opposing effects. Elevation made little contribution
predicted Narea using observed Ma and V cmax25 in Eq. (19).
                                                                              to the variation of χ . The V cmax25 was influenced most by
Traits                     Statistical model      Optimality model            temperature and radiation, but elevation also had a small impact
Ma (T g )                          0.55                    0.33               on V cmax25 . The effects of all the predictors were important for
V cmax25 (T dJ )                   0.45                    0.60               Ma (Figure 7).
χ (T dJ )                          0.49                    0.51
Narea (Ma + V cmax25 )             0.65                    0.84
                                                                              Discussion
                                                                              Optimality models have shown skill in predicting the trait
in the nitrogen-fixing species. The prediction of Narea directly              variations along the elevation gradient in the Gongga Mountain
from Ma and V cmax25 with our simple method (Eq. 19) was                      region, without site- or region-specific calibration of parameters.
marginally closer to the data than the prediction from Ma and                 The r of optimality models was generally higher than statistical
V cmax25 via Nstructure and Nrubisco (see Figure S5 available as              models (Table 2). The r of the optimal Ma model was 0.73
Supplementary data at Tree Physiology online). The predicted                  when four predictions at low elevation were excluded. This
site-mean Narea with our new method but from predicted Ma and                 finding suggests that the optimality models considering the
V cmax25 was also not significantly different from the observed               underlying mechanisms are better than the statistical models
Narea (P = 0.08). These ‘fully predicted’ Narea values were within            and supports the general validity of these models. The
the range of observations at most sites but were underestimated               new model for Ma —calibrated using an independent set of
at low elevation due to the underestimation of predicted Ma (see              measurements—correctly predicted patterns in the community-
Figure S5 available as Supplementary data at Tree Physiology                  mean Ma of deciduous plants at the Gongga Mountain sites.
online).                                                                      When the coefficients of Iabs , f , T g and α p were calibrated

                                                                              Tree Physiology Online at http://www.treephys.oxfordjournals.org
1346 Xu et al.
Downloaded from https://academic.oup.com/treephys/article/41/8/1336/6094892 by guest on 22 September 2021
Figure 5. Site-mean values of traits. The traits are (a) leaf mass per area (Ma ), (b) the maximum capacity of carboxylation standardized to 25 ◦ C
(V cmax25 ), (c) the ratio of leaf-internal to ambient CO2 partial pressure (χ) and (d) leaf nitrogen content per unit area (Narea ). Observations are
site-mean values and predictions are the best versions of different driven data at each site: predicted Ma using mean temperature during the growing
season (T g ), predicted V cmax25 and χ driven by daily temperature in July (T dJ ) and predicted Narea using observed Ma and V cmax25 . The solid line is
the 1:1 line.
Figure 6. Partial residual plots showing leaf nitrogen content per unit area (Narea ) as a function of leaf mass per area (Ma ) and the maximum capacity
of carboxylation standardized to 25 ◦ C (V cmax25 ) with nitrogen-fixer as an interaction term. (a) The Narea as a function of Ma and (b) Narea as a
function of V cmax25 . Blue, nitrogen-fixing plants (N-fixer); red, non-nitrogen-fixing plants (non-N-fixer).
Tree Physiology Volume 41, 2021Predictability of leaf traits with climate and elevation 1347
Downloaded from https://academic.oup.com/treephys/article/41/8/1336/6094892 by guest on 22 September 2021
Figure 7. The modeled contributions of individual climate variables for each trait at each site. The traits are (a) the ratio of leaf-internal to ambient CO2
partial pressures (χ), (b) the maximum capacity of carboxylation standardized to 25 ◦ C (V cmax25 ) and (c) leaf mass per area (Ma ). The gray bars
show the changes in predicted trait values compared with the reference level driven by site-mean environment. The green bars show the elevation
effect on χ and V cmax25 due to the changes in air pressure. The red bars show the effects of average daytime temperature in July on χ and V cmax25
and the effect of growing season mean temperature on Ma , respectively. The blue bars show the effect of vapor pressure deficit (D0 ) on χ and
then the effect of χ on V cmax25 . The yellow bars show the effect of growing season mean radiation on V cmax25 and the effect of leaf-area-index-
weighted growing season mean radiation on Ma , respectively. The effects of LL (indexed by gsl) and moisture (indexed by the ratio of annual actual
evapotranspiration to annual potential evapotranspiration) on Ma are shown in purple and blue.
with the sampled data, the values obtained were 0.99, 0.52, We have developed a simplified approach to predict Narea .
−0.03 and − 0.75, which were not significantly different from This approach produced results close to those obtained using
the values obtained using the China Plant Trait database but the two-step approach put forward by Dong et al. (2017). The
were closer to the values for Iabs and T g deduced from the agreement between predictions using the two methods sug-
theory. We did not apply the new model to evergreen species gests that the hypothesis underpinning both, namely that Narea
because we had no information about their LL. Leaf longevity can be predicted as the sum of a photosynthetic component
is strongly related to Ma (Kikuzawa 1991, Reich et al. 1997, related to V cmax25 and a non-photosynthetic component propor-
Wright and Westoby 2002, Wright et al. 2004). According to tional to Ma (Evans 1989, Lambers and Poorter 1992, Onoda
the leaf economics spectrum, the LL and Ma of deciduous plants et al. 2004), is reasonable. However, our simpler approach
are smaller than those of evergreen plants (Wright et al. 2004). does not require explicit specification of the relative allocation to
However, LL cannot be reliably estimated in the field without the metabolic and structural components and, by removing the
monitoring over a long period (Cornelissen et al. 2003). If such intermediate steps, reduces the uncertainties and improves the
data were available, it would be possible to extend the Ma model predictions. We have shown that Ma and V cmax25 are predictable
to evergreen species. from climate and that fully predicted Narea values lie within the
Tree Physiology Online at http://www.treephys.oxfordjournals.org1348 Xu et al.
range of observations at most sites (see Figure S5 available as V cmax25 adapts to environmental conditions during the previous
Supplementary data at Tree Physiology online). This interpreta- few weeks. Several studies have shown that photosynthetic traits
tion differs from some previous studies in which leaf nitrogen can acclimate quickly to temperature changes (Smith and Dukes
availability, implicitly assumed to be related to soil nitrogen 2017, Smith et al. 2017) by regulating intrinsic biochemical
availability, is used to predict V cmax25 (Luo et al. 2004). There characteristics, such as Rubisco content or catalytic turnover
is evidence that soil nutrients, particularly phosphorus rather rate (Cavanagh and Kubien 2014). Our model data comparison
than nitrogen, can influence Narea and V cmax25 (He et al. 2014, also suggests that χ acclimates to T dJ rather than T g . The
Gvozdevaite et al. 2018). However, there is growing evidence least-cost hypothesis underlying the model of χ considers the
(i) that LMA exerts a major control on Narea (Dong et al. 2017) total cost of maintaining plant carboxylation and transpiration.
and (ii) that climate variables are the dominant drivers of V cmax . Both metabolic processes function mainly in the daytime and
Smith et al. (2019) found that climate variables accounted for can be adjusted rapidly. Therefore, the regulation of χ is also
Downloaded from https://academic.oup.com/treephys/article/41/8/1336/6094892 by guest on 22 September 2021
about two-thirds of global variation in V cmax ; soil fertility indices expected to acclimate to daytime temperature at a weekly
accounted for about one-third. Liang et al. (2020), in a meta- to monthly scale, consistent with our finding that χ is better
analysis of soil nitrogen enhancement experiments, showed a 2– predicted using T dJ than T g . The χ is highly plastic compared
4 times greater effect on the leaf area and biomass (i.e., whole- with Ma (Dong et al. 2017), and seasonal variations in χ for
plant carbon allocation responses) than on leaf-level Narea and deciduous species have been observed in many studies (Chen
V cmax . In other words, consistent with optimality theory, plants and Chen 2007, Ma et al. 2010, McKown et al. 2013); however,
react to nutrient deficiency more by reducing leaf area, and the correlation of leaf phenology with seasonal changes in
increasing below-ground carbon investment, than by developing the growth environment of deciduous leaves indicates a need
suboptimal leaves. Thus, a key implication of our results is that to disentangle their effects in the future. Given that different
leaf nitrogen content can be predicted from climate alone. No processes have different timescales for acclimation/adaptation,
global analysis of Narea is yet available, but the consistency model inputs should be selected to reflect this.
of results for Australia (Dong et al. 2017), Peru (Peng et al. We have focused on predicting community-mean trait values.
2020) and this study strongly supports the idea. Moreover, Although between-site variation is larger than within-site varia-
further work should focus on improving Ma prediction since fully tion for all traits, nevertheless, there is considerable variability
predicted Narea is underestimated at low elevation due to the at each site. This variability presumably reflects the within-
underestimation of Ma . We have also shown that R0 is positively canopy heterogeneity in bioclimate and in particular in radiation.
related to Narea —consistent with widespread observations that There are large differences in the photosynthetic traits between
leaf nitrogen is higher at the top of the canopy (Hirose and sunlit and shaded leaves, and it has also been shown that
Werger 1987, Chen et al. 1993) and the optimality hypothesis sunflecks contribute greatly to the photosynthesis of shaded
that nitrogen is unequally allocated within the canopy so as leaves. Our model for Ma is sensitive to radiation inputs. By
to maximize photosynthesis at each canopy level (Werger and using RLAI to estimate the average light level absorbed by the
Hirose 1991, Peltoniemi et al. 2012). leaves within the canopy to drive the Ma model, we were able
Our analyses provide insights into the timescales on which to obtain relatively good predictions of the community-mean
leaf trait acclimation and adaptation operate. Since optimality values except at the lowest sites, which may be attributable
models implicitly consider acclimation and adaptation in physi- to disturbance, since many people live at lower elevations in
ological processes, the use of climate inputs at the appropriate this region. This approach would be insufficient to model within-
timescale—which resulted in better predictions—might provide canopy variability. However, site-based radiation measurements
insight on the corresponding adaptation/acclimation timescale could be used in order to test whether this optimality-based
of a trait. We showed that T g was a better predictor than model could predict within-site variation, given appropriate
T dJ for Ma , suggesting that Ma adapts to the whole growing inputs. The within-canopy heterogeneity of other bioclimatic
season environment. The adaptation of Ma to long-term tem- factors may also be important in the choice of appropriate
perature is consistent with the fact that deciduous leaves are model inputs (Blonder et al. 2018) and for testing the appli-
built at the beginning of the growing season with one-time cability of optimality-based models to explain the within-site
carbon investment from the previous year and maximize average variability.
carbon gain per day, and in turn, net carbon gain during the The comparison between the observed and simulated traits
whole growing season (Kikuzawa 1991). However, although allows us to identify mechanisms that are missing from the
predictions of V cmax25 have commonly been made using long- current optimality framework. For example, our analysis empha-
term temperature inputs such as T g (Wang et al. 2017a, Smith sizes the importance of soil moisture constraints. The RDA
et al. 2019), our results show this can lead to a mis-estimation showed that V cmax25 was positively associated with soil mois-
of V cmax25 . Using T dJ (i.e., daytime during the month the ture, indexed by α p . We found significant relationships between
plants were sampled) gives a better prediction, suggesting that α p and the residuals of predicted χ and V cmax25 . Some hydraulic
Tree Physiology Volume 41, 2021You can also read