AGRICULTURE IN THE NORTHERN WHEATBELT: RURAL LANDHOLDER SOCIAL BENCHMARKING REPORT 2021 - HANABETH LUKE & CLAIRE BAKER WITH CATHERINE ALLAN, SIMON ...
←
→
Page content transcription
If your browser does not render page correctly, please read the page content below
AGRICULTURE IN THE NORTHERN WHEATBELT:
RURAL LANDHOLDER SOCIAL BENCHMARKING
REPORT 2021

HANABETH LUKE & CLAIRE BAKER

WITH

CATHERINE ALLAN, SIMON MCDONALD & MATHEW ALEXANDERSON
RESEARCH COMMISSIONED BY:

SOIL COOPERATIVE RESEARCH CENTRE, WEST MIDLANDS GROUP

All rights reserved. The contents of this publication are copyright in all countries subscribing to the Berne
Convention. No parts of this book may be reproduced in any form or by any means, electronic or mechanical, in
existence or to be invented, including photocopying, recording or by any information storage and retrieval system,
without the written permission of the authors, except where permitted by law.

 Luke, H., Baker, C., Allan, C., McDonald, S., & Alexanderson, M. (2021).
 Agriculture in The Northern Wheatbelt: Rural Landholder Social Benchmarking Report 2021. Southern Cross
 University, NSW, 2480.

 ISBN 978-0-6450707-1-2

Cover photos supplied by Hanabeth Luke and David Minkey.

Contact Details

Dr Hanabeth Luke
Email: Hanabeth.Luke@scu.edu.au

Disclaimer

The views expressed in this report are solely the authors’, and do not necessarily reflect the views of Southern Cross
University, the Soil Cooperative Research Centre or the people consulted during the research project.

                                                      2 | AGRICULTURE IN THE NORTHERN WHEATBELT:
                                              RURAL LANDHOLDER SOCIAL BENCHMARKING REPORT 2021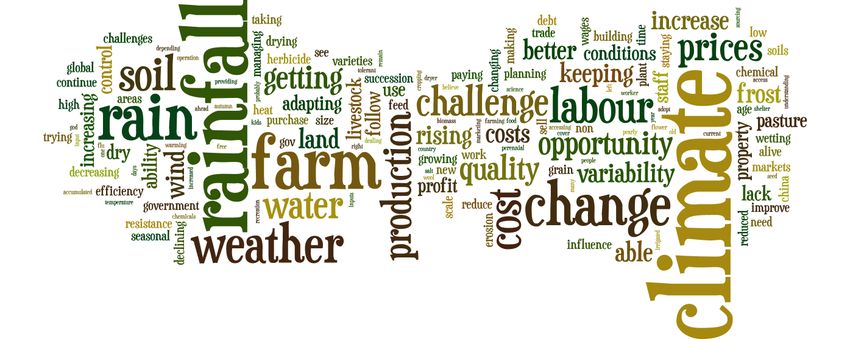
Table of Contents
      TABLE OF FIGURES ......................................................................................................................4
      LIST OF TABLES ............................................................................................................................4
THE CONTEXT ......................................................................................................................................7
   DEVELOPING THE SURVEY .............................................................................................................7
EXECUTIVE SUMMARY......................................................................................................................10
   PROFILE OF FARMING IN THE NORTHERN WHEATBELT ...........................................................10
      VALUES ........................................................................................................................................10
      FARMER ENGAGEMENT .............................................................................................................11
   DATA MANAGEMENT AND USE .....................................................................................................12
   FARMING PRACTICES, RISK AND RESILIENCE ...........................................................................12
      REGIONAL AND ON-FARM CHALLENGES .................................................................................12
      RISK AND OPENNESS TO CHANGE ..........................................................................................13
      BELIEFS ABOUT CLIMATE CHANGE..........................................................................................13
   THE FUTURE OF FARMING IN THE NORTHERN WHEATBELT....................................................13
      LONG-TERM PLANS ....................................................................................................................14
INTRODUCTION..................................................................................................................................15
   STUDY FRAMEWORK .....................................................................................................................15
   SURVEY DEVELOPMENT ...............................................................................................................16
   SURVEY ADMINSTRATION AND RESPONSE RATE .....................................................................17
   DATA ANALYSIS .............................................................................................................................17
SECTION A: PROFILE OF FARMING IN THE NORTHERN WHEATBELT .........................................19
   AN AGRICULTURAL LANDSCAPE ..................................................................................................19
   FARM MANAGEMENT AND LANDHOLDER PROFILE ...................................................................19
   VALUES, BELIEFS AND DECISION-MAKING .................................................................................21
   FARMER ENGAGEMENT ................................................................................................................24
      ACCESS TO INFORMATION........................................................................................................24
      RESULT FOCUS: LOCAL SUPPORT ...........................................................................................26
SECTION B: DATA MANGEMENT AND USE ......................................................................................29
   DATA MANAGEMENT .....................................................................................................................29
SECTION C: FARMING PRACTICES, RISK & RESILIENCE...............................................................32
   FARMING PRACTICES: KNOWLEDGE, VIEWS, PRACTICE AND RISK ........................................32
   REGIONAL AND ON-FARM CHALLENGES ....................................................................................35
   RISK AND OPENNESS TO CHANGE ..............................................................................................37
   BELIEFS ABOUT CLIMATE CHANGE .............................................................................................38

                                                            3 | AGRICULTURE IN THE NORTHERN WHEATBELT:
                                                    RURAL LANDHOLDER SOCIAL BENCHMARKING REPORT 2021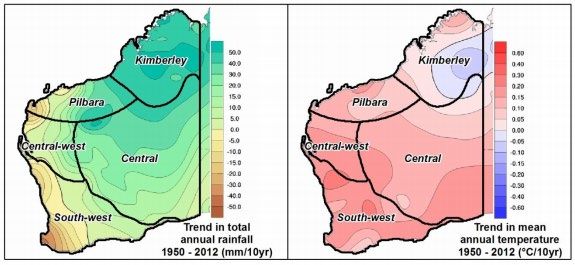
SECTION D: THE FUTURE OF FARMING ..........................................................................................42
   AGE DIFFERENCES ........................................................................................................................42
   LONG-TERM PLANS .......................................................................................................................45
CONCLUSION .....................................................................................................................................46
APPENDIX 1 – DATA TABLES ............................................................................................................47
APPENDIX 2 – SURVEY .....................................................................................................................59

TABLE OF FIGURES
Figure 1: Developing the survey priorities at Dandaragan ......................................................................8
Figure 2: The mind-mapped priorities covered during the workshop with the West Midlands Group.......8
Figure 3: Diagram showing distribution of farmer type by local government area, 2020 .......................21
Figure 4: Views on local support groups from full-time and part-time farmers, 2020. ............................26
Figure 5: Self-assessed knowledge of data use by farmer type, 2020 (n = 145). ..................................29
Figure 6: Full-time farmer practices over time 2020 (n = 126 to 142). ...................................................32
Figure 7: Top five most important regional issues by farmer type (n= 139 to 146), with the issues related
to climate change in the region highlighted by the use of the colour green. ..........................................35
Figure 8: Top five property-level issues by farmer type, 2020 (n= 111 to 145). Orange colour indicates
soil-related items common across farmer types. * relates to factors potentially influenced by accelerated
climate-change (see section below). ....................................................................................................36
Figure 9: WordleTM word-cloud representation of responses to the open question: 'In the next 10 years,
what would you see as likely being your biggest challenge and/or opportunity?', with each word
emphasised in relation to times used in responses. .............................................................................37
Figure 10: Trends in mean temperature and rainfall, 1950–2012 (source BoM) in: Department of Water
(2015), Selection of future climate projections for Western Australia, Water Science Technical Series,
report no. 72, Department of Water, Western Australia. .......................................................................39
Figure 11: Landholder beliefs about climate change, 2020 (n = 171 to 179). ........................................39
Figure 12: Beliefs about climate change by farmer type, 2020 (n = 137 to 144). ..................................40
Figure 13: Items with levels of self-assessed knowledge that are significantly different between age
groups, 2020. .......................................................................................................................................43
Figure 14: Management practices that show a significant difference between age groups, 2020. ........ 44
Figure 15: Intended management practices that show a significant difference by age group, 2020. ..... 44
Figure 16: Progress of succession planning by farmer type, 2020 (n = 87)...........................................45

LIST OF TABLES
Table A: Key attributes summary table ................................................................................................11
Table B: Attached Values ....................................................................................................................23
Table C: Principles that guide your life, both overall and by farmer type)..............................................24
Table D: Information sources and modes of information for all full-time and part-time farmers ............. 25
Table E: Views and experiences overall and by Farmer Type. .............................................................26
Table F: Group membership for full-time and part-time farmers. ..........................................................27
Table G: Group membership by LGA. ..................................................................................................27
Table H: Implementation of data management practice compared with related knowledge and confidence
in the practice for full-time and part-time farmers .................................................................................30

                                                            4 | AGRICULTURE IN THE NORTHERN WHEATBELT:
                                                    RURAL LANDHOLDER SOCIAL BENCHMARKING REPORT 2021
Table I: Self-assessed sound or very sound knowledge by farmer type................................................33
Table J: View statement agreement overall and by farmer type ...........................................................34
Table K: Issues affecting local region ...................................................................................................38
Table L: Practices related to climate change issues overall and by farmer type. ..................................40
Table M: Long-term plans related to climate change for all landholder types. .......................................41

                                                        5 | AGRICULTURE IN THE NORTHERN WHEATBELT:
                                                RURAL LANDHOLDER SOCIAL BENCHMARKING REPORT 2021
ACKNOWLEDGEMENTS

This Cooperative Research Centre for High Performance Soils (Soil CRC) research project involves a partnership
between the Agricultural Innovation and the West Midlands Group, the Liebe Group, Wheatbelt NRM, Southern
Cross University (SCU) and Charles Sturt University (CSU). The Soil CRC is funded by the Australian Government's
Cooperative Research Centre Program.

The authors thank Nathan Craig of the West Midlands Group, David Minkey of WANTFA, Katrina Venticinque of
the Liebe Group and Felicity Gilbert of Wheatbelt NRM for their contributions to this project and their valuable
contributions to the research process. We are grateful to the local Councils of Moora, Dandaragan, Coorow,
Dalwallinu, and Wongan-Ballidu for providing us with access to mailing lists. We also thank Michael Crawford (CEO
of the Soil CRC) for his comments on the draft survey instrument.

Finally, we would like to thank all the landholders who took the time to complete the survey. A summary of this
report will be prepared and distributed by our local partners in 2021.

LIST OF ACRONYMS

SCU – Southern Cross University
CSU – Charles Sturt University
GIS – Geographic Information System
LGA – Local Government Area
WMG – West Midlands Group
NRM – Natural Resource Management
Soil CRC – Soil Cooperative Research Centre
WANTFA - Western Australian No-Tillage Farmers Association

LEGEND

### = Significant difference by Farmer Type

*** = Significant difference by Rainfall Zone

FTF = Full-time Farmer

PTF = Part-time Farmer

HF = Hobby Farmer

NF = Non-farmer

                                               6 | AGRICULTURE IN THE NORTHERN WHEATBELT:
                                       RURAL LANDHOLDER SOCIAL BENCHMARKING REPORT 2021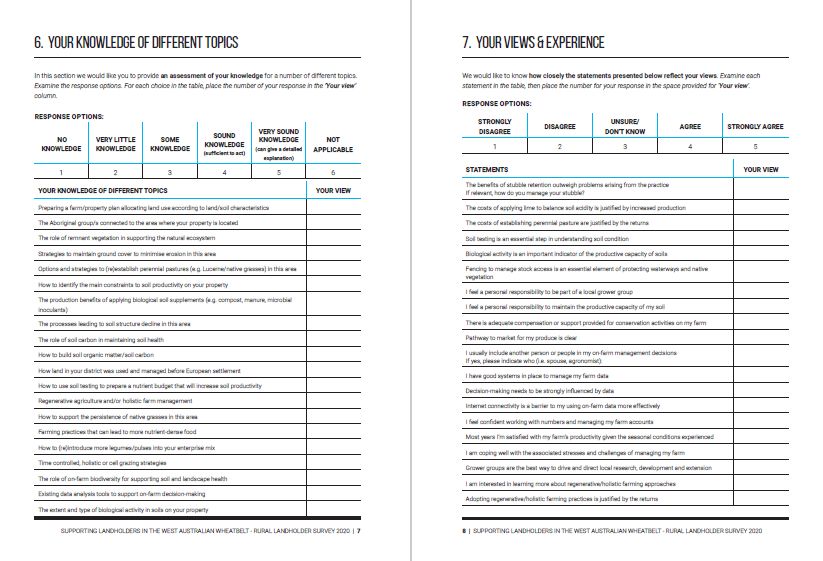
THE CONTEXT
The Soil CRC national survey project, Surveying On-Farm Practices, was initiated in 2019 to implement
surveys in all six states, in partnership with local farming organisations. The regions were selected to
represent a range of different farming systems and bioregions, with a major factor being the willingness
of local groups to partner with the survey team to develop the survey and support its implementation.
The purpose of the survey was to gain a broad understanding of the drivers of on-farm decision making
across, and in-depth understanding within, Australian farming systems.

The 2020 Northern Wheatbelt social benchmarking survey is part of this national Soil CRC project led by
Dr Hanabeth Luke of Southern Cross University (SCU), jointly funded by the Soil CRC, and the West
Midlands Group. Data gathered will contribute to wider Soil CRC research efforts. For example, Soil CRC
researchers will be able to explore farmer knowledge of soil heath and management; the impact of farmer
participation in soil health groups; and the implementation of best practice soil management by farmers.

The overall survey design was developed in the early stages of the national social benchmarking survey
project, building on the work of Professor Allan Curtis 1. The general approach is that surveys are
physically mailed landholdings in a region over ten hectares (10 ha) in size, to either a random selection
or, in low population areas, to all. The surveys include questions on farmers’ actual and intended
practices, their challenges, and aspirations. Important background information is also collected on farm
management styles and farmer values, as well as items that focus on self-assessed knowledge of, and
confidence in, best practice, and perceptions of risk.

The overarching Soil CRC project will ultimately collate a dataset of national significance, showing both
breadth and depth of information on factors involved in on-farm decision-making for Australian farmers.
The key strength of this project is that the general survey approach is customised through collaboration
with regional partners to ensure regional relevance. Whilst a core of questions remains to enable cross-
survey comparisons and the development of the national dataset, each region has different priorities
which are built into the survey instrument. In this way, each survey report can directly inform strategic
planning and decisions around present and future directions, whilst providing clear pathways toward
better engagement between the Soil CRC partners’ regional farmer base in their activities

DEVELOPING THE SURVEY
The Soil CRC survey project leader Dr Hanabeth Luke first visited the Wheatbelt in October 2019. During
that visit, the West Midlands Group, WANTFA and Wheatbelt NRM all agreed to participate as local
partners in the West Australian component of this national Soil CRC project. The Liebe Group joined
shortly after. Workshops were run with both WANTFA and the West Midlands Group to identify key topics
to inform survey development. First, we were invited by David Minkey to run a workshop with WANTFA
in their Perth office, where a list of priorities was developed and distilled into two main areas:

1) Building a profile of growers in the Wheatbelt, including their needs and aspirations, their trusted
sources of information and levels of coping in times of stress.

1Curtis, A., & Luke, H. (2019). Social benchmarking for natural resource management: 2019 North Central Victoria.
Southern Cross University, NSW, 2480.

                                               7 | AGRICULTURE IN THE NORTHERN WHEATBELT:
                                       RURAL LANDHOLDER SOCIAL BENCHMARKING REPORT 2021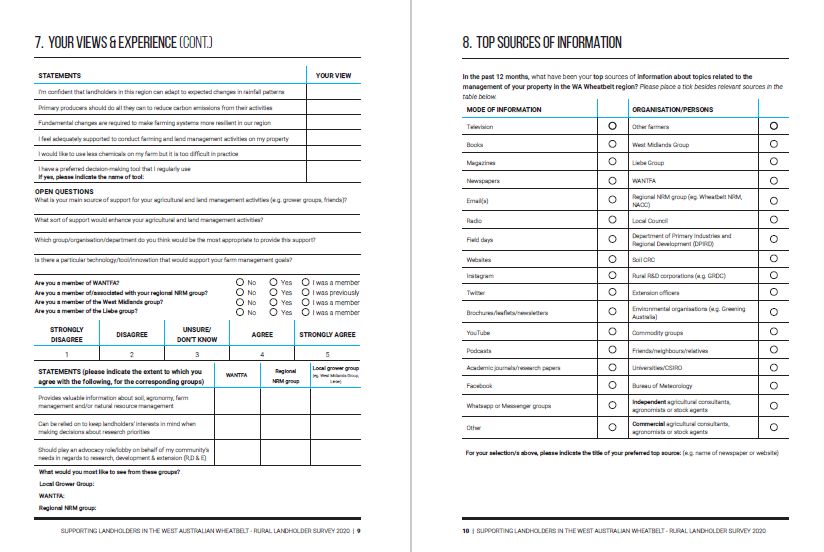
2) Identifying opportunities for building resilience across the farming systems, including uptake of
conservation/sustainable/regenerative agricultural practices; use of legumes; precision agriculture;
increased biodiversity on farms and new pathways to market. Also, the impact of factors such as
temperature extremes on crops; compaction, herbicide resistance; chemical use; and corporate farming
models.
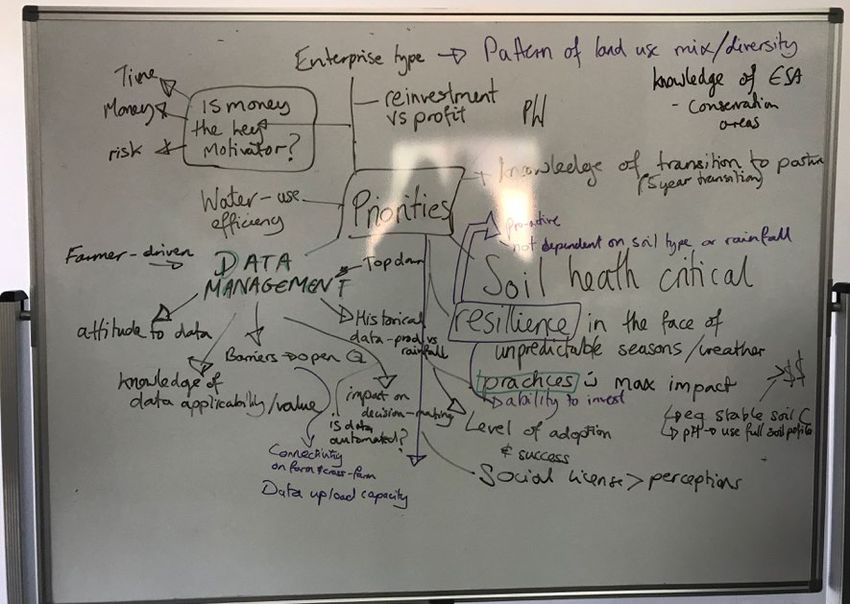
Figure 1: Developing the survey priorities at Dandaragan
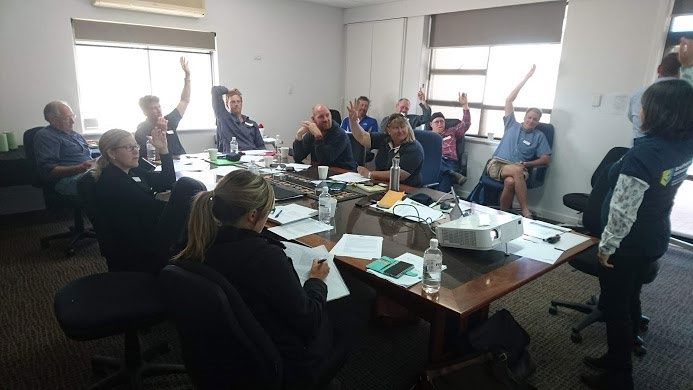
Following this, Dr Nathan Craig organised for some of the research team to attend a strategy meeting
where key areas of focus for the West Midland Group’s present and future efforts were to be identified
and discussed. While Nathan drew up a list of topics for their purposes, Hanabeth mind-mapped the main
areas of interest (Figure 2).
Figure 2: The mind-mapped priorities covered during the workshop with the West Midlands Group
8 | AGRICULTURE IN THE NORTHERN WHEATBELT:
RURAL LANDHOLDER SOCIAL BENCHMARKING REPORT 2021
Each of the topics raised was voted on by the group, using a methodology where hands were raised,
with arms’ length indicating extreme importance, while a hand on the table indicated no importance to
them, with a sliding scale in between (shown in Figure 1). These processes helped to distil the topics into
four main areas used to develop the Northern Wheatbelt survey. A draft survey was developed and
Hanabeth returned in February 2020 to meet with local partners to check and refine the survey. Following
further refinement, the survey was finalised, drawing on the following areas of focus:

A)   Profile of farming in the Northern Wheatbelt, including farmer engagement
B)   Data management and use
C)   Farm management practices, risk and resilience
D)   The future of farming in the Northern Wheatbelt

A draft survey was pre-tested, including with a small group of rural landholders. A copy of the final 16-
page survey booklet is included as an appendix to this report.

The survey was posted to all rural property owners (properties of 10 ha and above) identified using
spatially referenced landholder contact lists for the Northern Wheatbelt region provided by the local
governments of Dandaragan, Moora, Coorow, Wongan-Ballidu and Dalwallinu Surveys were posted to
980 property owners. After removing return-to-sender, duplicate ownerships, properties that had been
sold, owners who were ill or overseas and others who took the option to opt-out of the survey, there were
756 possible respondents. A total of 163 surveys were completed. Of these, 31 were completed online
and linked to the spatial property identifier, which enables these responses to be included in the total. A
24% response rate was thus recorded. It is also useful to note that the median number of landholdings
per respondent was two. Thus, it can be estimated that our sample represents about half of landholdings
in the region.

Checks for non-response bias included a comparison of the mean property size of respondents and non-
respondents, which found a bias towards respondents with larger properties. This may have been due to
part of the process during list-cleaning, when landholders with multiple properties were connected to their
property with the largest area.

In addition to the collection of background personal and property information (e.g. property size, absentee
ownership) and data on land use/enterprise mix, the survey gathered information about respondents’
values; beliefs (e.g. in climate change, the primacy of private property rights); issues of concern (i.e.
threats to those values); knowledge of best practice; confidence in best-practices; implementation of
best-practice; preferred sources of information and modes of engagement with farming and NRM
organisations, platforms and processes; and long-term plans for the property, including the progress of
succession planning where relevant. With more than 130 survey items across these topics, the report
summarises a large data set. The focus in the Executive Summary is on directly responding to the four
objectives listed above and identifying key lessons or conclusions.

                                             9 | AGRICULTURE IN THE NORTHERN WHEATBELT:
                                     RURAL LANDHOLDER SOCIAL BENCHMARKING REPORT 2021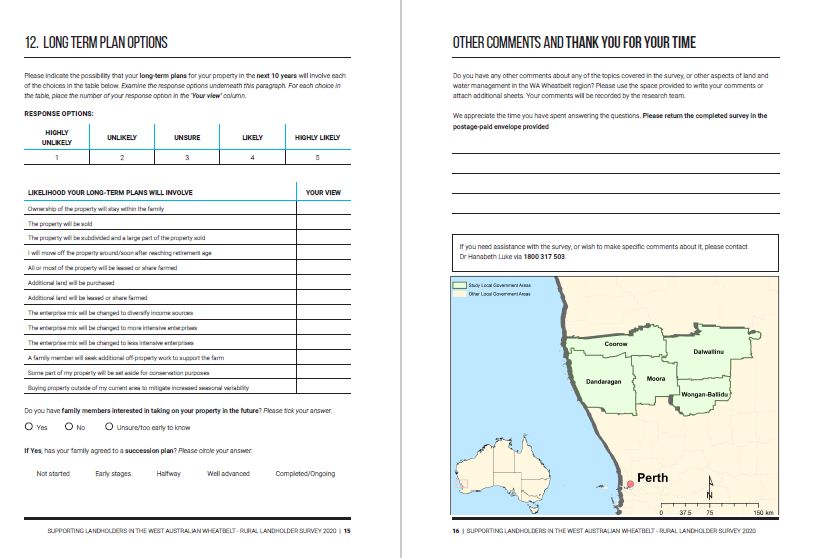
EXECUTIVE SUMMARY
This research employed a survey of all rural landholders in the Northern Wheatbelt with a land holding
greater than 10 hectares. Soil CRC researchers from Southern Cross University partnered with local
groups WANTFA, West Midlands Group, Wheatbelt NRM and the Liebe Group to develop and undertake
the survey. The analysis was focussed on areas highlighted as being of particular importance to our local
research partners.

PROFILE OF FARMING IN THE NORTHERN WHEATBELT
The Northern Wheatbelt was confirmed to be a primarily agricultural landscape, dominated by full and
part-time farmers. Based on established methodology, survey participants self-identified into one of four
groups based on their engagement with farming:

   •   Full-time farmers: 72%
   •   Part-time-farmers: 10%
   •   Hobby farmers: 8%
   •   Non-farming land holders: 10%

The most common land use was for cereal cropping (73%), pastures (54%), legumes (46%), and sheep
for wool (45%) and meat (45%). For all landholders the median land holding was 3227 hectares across
a median of two properties. For full-time farmers, this increased to 3902 hectares. Overall, 83% of
respondents reside on their Wheatbelt property, rising to 91% of full-time farmers, with the median length
of land ownership by the respondent’s family reported as 55 years. Across all respondents, the median
age was 55 years and 92% of those who completed the survey were male.

VALUES
The Northern Wheatbelt encompasses landholders with a range of intersecting values, some of which
are intrinsic or ‘held’, while others relate to their landholding. When looking across the whole sample,
there is a fairly even spread among the top four ways in which the property is valued by landholders.
These were the property representing the ability to pass on a healthier environment to future generations
(84%), as an asset that is an important part of family wealth (83%), a great place to raise a family (82%),
and the property as a source of accomplishment from building and maintaining a viable business (82%).
When looking at intrinsic values that guide landholders’ lives, there was a strong dominance of the
principle ‘Looking after my family /loved-ones and their needs’ across all landholder types’ (99%),
representing a strong focus on the family unit.

Key attributes of the survey sample are summarised in Table A, with a further breakdown of key attributes
and issues by LGA in Table X1, in the Appendix.

                                            10 | AGRICULTURE IN THE NORTHERN WHEATBELT:
                                     RURAL LANDHOLDER SOCIAL BENCHMARKING REPORT 2021
Table A: Key attributes summary table 2020 (n=116 to 176)
For all respondents 2020
Key attributes
(median unless indicated)
Property size (area owned) 3227ha (mean 4712ha)
Bought additional land in region in past 20 years 56%
Subdivided or sold part of property past 20 years 27%
Property leased, share farmed or agisted by others (mean) Median 225.8ha (mean 27.5ha)
Property leased, share farmed or agisted from others (mean) 1500ha
Age of respondent 60 years (mean 70 years)
Farmer by occupation (i.e. Full-time Farmer) 72%
Gender of respondent (n=142) 8% female
Resident on property 83%
Length of family ownership 55 years (mean 90 years)
Other family members working on property 73%
Paid off-property work last 12 months (n=121) mean score 47 days (mean 20 Days)
Hours work on-property per week (n= 160) 46 hours (mean 46 hours)
Income from agriculture in Wheatbelt region 2018/19 89%
% all survey respondents net profit from agriculture >$50k 74%
2% primary respondent
Received net off-property income 2018/19 34% spouse
23% both
% all survey respondents net income from off-property >$50k 42%
WANTFA member 9% (16% was)
Regional NRM group member 14% (11% was)
West Midlands member 18% (6% was)
Liebe member 18% (8% was)
19% primary respondent
Completed short course related to property management
3% partner
past 5 years
10% both
Property management or whole farm plan 47%
Attended a field day/farm walk/ demonstration on soil health
55% yes
last 12 months
55% yes
Proportion of land lost to production due to soil problems
Area: 310ha
FARMER ENGAGEMENT
Survey respondents were asked what their top sources of information were in regards to topics related
to the management of their property. For full and part-time farmers, field days and magazines were the
most nominated way of sourcing information (both 59%), with Farm Weekly and Elders Weekly
nominated as popular publications. The most popular source of knowledge was other farmers (76%),
followed by independent advisors such as agronomists and agricultural consultants (60%).
More than half of all full- and part-time farmers (54%) agree that grower groups are the best way to drive
and direct local research, development and extension. 66% of full-time farmers and 40% of part-time
farmers had attended field days/farm walks/demonstrations focused on soil health and productivity in the
11 | AGRICULTURE IN THE NORTHERN WHEATBELT:
RURAL LANDHOLDER SOCIAL BENCHMARKING REPORT 2021past 12 months. In terms of group membership, there was a relatively equal spread of membership rates
amongst full- and part-time farmers for local grower groups West Midlands Group and Liebe (both 20%),
and associated with the local NRM group (17%), with 10% of the sample being members of WANTFA. It
is important to note that membership of the grower groups was largely linked to LGA given the
geographical distribution of the groups, with Dandaragan, Moora and Coorow covered by West Midlands
Group, and Wongan-Ballidu and Dalwallinu covered by Liebe. Table X1 provides further useful details
by LGA.
DATA MANAGEMENT AND USE
The majority of full-time farmers agreed that data is an important part of farm management yet more than
half (51%) reported internet connectivity to be a barrier to using on-farm data more effectively. 71% of
full-time farmers agreed that decision-making needs to be strongly influenced by data and 61% reported
to already having good systems in place to manage farm data. Soil testing was perceived as an integral
part of data gathering, with 92% of full-time farmers agreeing that it is an essential step in understanding
soil condition.
On-farm management was reported to be largely collaborative, with 86% of full-time farmers (79%
overall) including another person or people in their management decisions. Most often, this was a
spouse/partner, family or an advisor such as an agronomist.
FARMING PRACTICES, RISK AND RESILIENCE
Soil testing stands out as the most common best-management practice in the reported period 2015 –
2020, at a rate of 82%. This was followed by the application of lime (76%), and the planting of legumes
or pulses (70%). While some topics had a sound level of self-reported knowledge, particularly ‘strategies
to maintain ground cover to minimize erosion in this area’, many other topics have low reported
knowledge levels. Part-time farmers’ knowledge tends to be much lower than that of full-time-farmers
across most topics, and to be relatively low overall.
Overall, the data indicates a strong level of personal responsibility to maintain the productivity of soil and
soil testing as an essential step, particularly amongst full-time farmers. Full-time farmers show strong
support across most of the soil management items.
REGIONAL AND ON-FARM CHALLENGES
On the regional scale, items seen as relating to climate change featured in the top five issues across all
landholder types. Given the dominance of full-time farmers in the sample, particularly when combined
with part-time farmers, it is useful to look across these two groups as the dominant group of landholders.
When combined, the top three issues for the region were changes in weather patterns (86%), water
security (77%), and public support/opposition for agricultural practices (77%).
At the property-scale, soil issues represented less than half of the most important issues for full-time
farmers. The top two issues relate to productivity and profitability concerns, in particular the impacts of
temperature extremes on farm productivity (74% of full-time-farmers), and the impact of uncertain or low
returns on their capacity to invest in the property (73%). When looking to the dominant group of full- and
part-time farmers combined, none of the top three issues were soil-related. Rather, the top three property-
level issues were the impact of temperature extremes on farm productivity (73%), uncertain/low returns
limiting capacity to invest in my property (69%), and the impact of weeds or over-abundant native plant
species on productivity (62%).
12 | AGRICULTURE IN THE NORTHERN WHEATBELT:
RURAL LANDHOLDER SOCIAL BENCHMARKING REPORT 2021RISK AND OPENNESS TO CHANGE
Overall there was a very high level of openness to new ideas, with 91% of all respondents agreeing that
they were open to new ideas about farming and land management, including 95% of full-time farmers.
However, this was complicated by low levels of agreement on other measures, such as ‘Financially, I
can afford to take a few risks and experiment with new ideas’ (45% overall, 50% of full-time farmers), ‘I
am usually an early adopter of new agricultural practices and technologies’ (44% overall, 50% of full-time
farmers), and ‘I have sufficient time available to consider changing my practices’ (38% overall, 42% of
full-time farmers). This suggests that whilst farmers have an open mindset, there are financial and time
constraints upon adoption.
BELIEFS ABOUT CLIMATE CHANGE
Changes in weather patterns emerged as the number one issue across all landholder types, and water
security was in the top four issues for all farmer types. When asked what the biggest challenge and/or
opportunity might be over the next ten years, the most common answer was climate change and weather
variability. Together, this demonstrates strong concern in relation to the lived impacts of climate change.
There is strong data that both records and predicts increasing impacts of climate change in the Wheatbelt
region. Survey respondents appeared to be largely cognisant of these risks, with only 11% of
respondents disagreeing that climate change poses a risk to the region, with 70% agreeing and 19%
unsure. 61% of all respondents agreed that human activities are influencing changes in climate and 57%
agreed that landholders in the region should do all they can to reduce carbon emissions. More than half
(55%) of all respondents agreed that if nothing is done, climate change will have dire consequences.
There was a high level of confidence that local landholders in the region can adapt to changes in weather
patterns (67%), yet less than half of respondents (47%) agreed that fundamental changes are required
to make the region’s farming systems sustainable.
THE FUTURE OF FARMING IN THE NORTHERN WHEATBELT
The responses from full-time and part-time farmers was initially broken down into three age categories,
as determined by established definitions of generations: Generation Y (born 1981-1996), Generation X
(born 1965-1980) and Baby Boomer and older (born prior to 1965, referred to as Baby Boomer+).
However, there were not enough of the youngest age group to allow for analysis (n=8), reflecting the
broader age demographics of the respondents, so the groups were amalgamated into two groups, with
Generation Y and Generation X combined into one group (aged 56 years and below), with the Baby
Boomer and older generation (57 years and above) retained.
As may be expected, there was clear evidence of trends toward extensification and/or intensification
amongst the younger group, and slight trends of de-escalation amongst the older group. The younger
cohort managed significantly more land, with an average of 2166 hectares compared to the older cohort
average of 968 hectares. 81% of the younger group had purchased additional land in the region in the
previous 20 years (compared to 57% of older group), with the reverse being true for the older group, who
had an average of 318 hectares managed by others (compared with 31 hectares of the younger group).
The younger group reported to work an average of 56 hours per week on the farm, compared to 47 hours
per week for the older group. The area in which the most differences emerged was in the levels of self-
assessed knowledge between the groups, with the younger generation indicating a higher level of self-
assessed knowledge across a number of knowledge topics.
13 | AGRICULTURE IN THE NORTHERN WHEATBELT:
RURAL LANDHOLDER SOCIAL BENCHMARKING REPORT 2021LONG-TERM PLANS
With only 9% of full-time farmers indicating that they intend to sell the property, ownership turnover of
farmlands is intended to be low. 43% of full-time farmers indicated that they intended to purchase
additional land, which is in line with broader industry trends to larger holding sizes, and around a quarter
indicated they would lease additional land (26%) and intended to change the enterprise mix to diversify
income (27%) or move toward intensive enterprises (20%).
Overall, 72% of respondents indicated that ownership of the property would stay within the family,
including 80% of full-time farmers. However, only 52% of full-time farmers had a family member
interested in taking on the property in the future. When asked what the biggest challenge and/or
opportunity might be over the next ten years, after climate change and weather variability, succession
planning was noted as an issue. This emerged in the figures, with very low levels of succession planning
in train, however full-time farmers are the most likely to have commenced succession planning.
14 | AGRICULTURE IN THE NORTHERN WHEATBELT:
RURAL LANDHOLDER SOCIAL BENCHMARKING REPORT 2021INTRODUCTION
The 2020 Northern Wheatbelt social benchmarking survey is part of a Soil CRC project led by Dr
Hanabeth Luke of Southern Cross University (SCU), jointly funded by the Co-operative Research Centre
for High Performance Soils (Soil CRC) and the West Midlands Group. Data gathered will support the
activities of local Soil CRC partners, while contributing to the wider Soil CRC research portfolio. For
example, Soil CRC researchers will be able to explore farmer knowledge of soil heath and management;
the impact of farmer participation in soil health groups; and the implementation of best practice soil
management by farmers. Similar surveys funded by the Soil CRC have taken place or are in development
in Victoria, South Australia, New South Wales, Queensland and Tasmania.
The research team includes social scientists from Southern Cross University and Charles Sturt
University. The survey methodology draws on a widely accepted approach to social benchmarking for
regional land and natural resource management developed by Allan Curtis 2. This survey-based
methodology has previously been applied across Australia, including as part of the Australian
Government’s National Action Plan for Salinity and Water Quality, with case studies in Victoria, New
South Wales and Queensland.
STUDY FRAMEWORK
The conceptual framework underpinning this study further builds on the work of Curtis and Luke 3. The
framework recognises that changing human behaviour can be difficult, and engaging rural property
owners in practice change is no exception. There is a large set of possible factors influencing decisions
and these vary according to each technology, property owner, social context and intervention over
seasons and years. Without strong and well-understood drivers to support the implementation of best-
practice farm and land management, supporting practice change can be hampered by a range of factors.
This may involve everything from inconsistent governance frameworks, weather, and rising property
prices, to demographic factors, including what farmers view as important, their knowledge of ‘best-
practice’ and how they perceive their own role as landholders.
While it is possible that values, beliefs and personal norms (i.e. accepted behaviour and decision-making
patterns) may mediate or moderate some of these other factors, it is difficult to change these deep-seated
personal attributes in the short or medium term. Nevertheless, it is essential to understand the values
and beliefs of landowners if they are to be effectively engaged. Values-Belief-Norm Theory (VBN) is a
theoretical approach that has been developed and applied to explain the relationship between values
and behaviour, particularly in regards to human-environment interactions and land management. It is an
important theory that underpins much contemporary social research, including the Rural Landholder
Social Benchmarking Report 2021.
In short, landholder values and beliefs may be difficult to change but are extremely important for effective
engagement. The two main elements of this we explore in the survey are: ‘assigned values’ and ‘held
values’, both of which are deemed as important for guiding personal action 4 .‘Held’, or intrinsic values are
2 Curtis, A., Byron, I., & MacKay, J. (2005). Integrating socio-economic and biophysical data to underpin
collaborative watershed management. Journal of the American Water Resources Association, 41(3), 549-563.
3 Curtis, A., & Luke, H. (2019). Social benchmarking for natural resource management: 2019 North Central Victoria.
Southern Cross University, NSW, 2480.
4 Lockwood, M. (1999). Humans Valuing Nature: Synthesising Insights from Philosophy, Psychology and Economics.
15 | AGRICULTURE IN THE NORTHERN WHEATBELT:
RURAL LANDHOLDER SOCIAL BENCHMARKING REPORT 2021ideas or principles that people hold as important to them and may be abstract and conceptual 5 whereas
we describe ‘assigned’ or ‘attached values’ as how landholders relate to, or assign value to, their land
and farm.
Value orientations are the position a person takes when a particular set of held values are more important
to them than other held values 6. It is important to note that individuals can hold more than one value
orientation simultaneously 7. Beyond knowledge of these values, how should researchers and
practitioners proceed? And what topics should be included in a survey setting out to inform engagement
of rural property owners in the Northern Wheatbelt region?
Effective applications or adoption of best-practice and new innovations can be improved by identifying a
number of ‘levers’ to effect change. If a landholder does not have knowledge of a best-practice approach,
then it is unlikely that they will adopt it. If they have some knowledge of it, but little confidence in its
effectiveness, then they are unlikely to adopt it. If they view it as too expensive or time consuming to
implement, they are also unlikely to take it up. Therefore, the survey must identify both knowledge of,
and confidence in, relevant best-practice land and farm management7.
It is also helpful to identify personal ‘norms’, or the level of personal responsibility that landholders feel
towards managing their soil, land and farm. Personal norms in relation to risk-taking have also been
found to be extremely important, with a predisposition to take risks being an important driver of practice
change 8.
The next step is identifying the most effective ‘extension’ or information-sharing approaches, processes
or platforms for engaging rural property owners in learning, dialogue and action. In identifying these
approaches, it is also important to gain an understanding of how landholders perceive and trust their key
local and regional organisations, for trust is a key builder of confidence in knowledge-sharing
organisations 9.
SURVEY DEVELOPMENT
The Soil CRC survey project leader Dr Hanabeth Luke first visited the Wheatbelt in October 2019. During
that visit, the West Midlands Group, WANTFA and Wheatbelt NRM all agreed to participate as local
partners in the South Australian component of this national Soil CRC project. The Liebe Group joined
shortly after. Workshops were run with both WANTFA and the West Midlands Group to identify key topics
to inform survey development. Processes helped to distil the topics into five main areas used to develop
the Northern Wheatbelt survey. The survey drafts were developed and Hanabeth returned in February
2020 to meet with local partners to check and refine the survey which was then pre-tested with a small
Environmental Values, 8(3), 381-401.
5 McIntyre, N., Moore, J., & Yuan, M. (2008). A place-based, values centred approach to managing recreation on
Canadian crown lands. Society & Natural Resources, 21, 657-670.
6 Axelrod, L. J. (1994). Balancing personal needs with environmental preservation: identifying the values that guide
decisions in ecological dilemmas. Journal of Social Issues, 50(3), 85-104.
7 Lockwood, M. (1999). Humans Valuing Nature: Synthesising Insights from Philosophy, Psychology and Economics.
Environmental Values, 8(3), 381-401; Stern, P. C. (2000). Toward a coherent theory of environmentally significant
behaviour. Journal of Social Issues, 56(3), 407-424.
8 Curtis, A., & Luke, H. (2019). Social benchmarking for natural resource management: 2019 North Central Victoria.
Southern Cross University, NSW, 2480.
9 Luke, H. (2017). Social resistance to coal seam gas development in the Northern Rivers region of Eastern
Australia: Proposing a diamond model of social license to operate. Land Use Policy, 69, 266–280.
16 | AGRICULTURE IN THE NORTHERN WHEATBELT:
RURAL LANDHOLDER SOCIAL BENCHMARKING REPORT 2021group of farmers by Nathan Craig. Following further refinement, the survey was finalised, drawing on the
following areas of focus:
A) Profile of farming in the Northern Wheatbelt, including farmer engagement
B) Data management and use
C) Farm management practices, risk and resilience
D) The future of farming in the Northern Wheatbelt
Following the workshop, the project team built these topics into the existing core survey instrument, with
sections on major issues faced by landholders, their values, practices, experience and understanding of
various topics, as well as confidence in a range of best practices in soil, farm and land management. The
draft survey was sent to all workshop participants for comment and input.
SURVEY ADMINSTRATION AND RESPONSE RATE
In advance of the survey, in mid-August 2020, notices were sent to all Northern Wheatbelt properties
over ten hectares, which included a link to an online survey posted on the Soil CRC website. In mid-
September, the comprehensive survey booklets and reminder notes were mailed out to all relevant
landholders in the five partner local government areas. Forty-two online surveys were completed, with
31 linked to the spatial property identifier, which enables these responses to be included in the total. 980
paper surveys were sent out, with 224 return to senders and opt-outs. A 24% response rate was recorded
from 756 surveys once the online responses from LGAs outside the target region were removed from the
sample. It is useful to note that the median number of landholdings per respondent was two. Thus, it can
be estimated that our sample may represent almost half of landholdings in the region. The data was
spatially referenced, which means that we can show social, economic and environmental trends spatially
across the region. We can also cross-reference our findings with other spatial data such as soil type and
rainfall.
DATA ANALYSIS
Descriptive statistics such as frequencies, means and medians were used to summarise responses to
all survey items (“not applicable” and missing responses were removed from the analysis of means).
Further analyses include examination of data for statistically significant differences between different
groups (e.g. full-time farmer, part-time farmer, hobby farmer and non-farmer). Kruskal Wallis Rank Sum
Tests were used to test for differences on a continuous variable or a Likert scale variable (e.g. age or
agreement with an issue) based on a grouping variable (e.g. farmer identity cohorts). Chi-squared test
were used to examine dependence between two grouping variables. Similarly, Pearson’s Chi-squared
test with simulated values was used to test for differences on a Yes/No (i.e. nominal data as for Landcare
participant) based on a grouping variable (e.g. the farmer identity cohorts).
To explore relationships between variables in the survey, pairwise comparisons were conducted between
each item and all other items in the survey. Kruskal Wallis Rank Sum Tests were used to test for
relationships between Likert-type response and a grouping variable (e.g. full-time farmer, part-time
farmer, hobby farmer and non-farmer) (results in an H value). Chi-squared test were used to examine
dependence between two categorical (or grouping) variables (e.g. between Yes/No for management
action implemented and WMG member/non-membership).
Pairwise comparisons tested for relationships (positive and negative) between variables expected to
influence adoption (i.e. independent variables) of best-practice management (i.e. the dependent
variables). Those practices consisted of sustainable or regenerative agricultural practices and ecological
17 | AGRICULTURE IN THE NORTHERN WHEATBELT:
RURAL LANDHOLDER SOCIAL BENCHMARKING REPORT 2021management. Most practices were thought to be relevant to most property contexts. However,
respondents were given the opportunity to choose Don’t know/ Not applicable. As might be expected,
the proportion selecting this option varied across the best-practice items.
In all analyses the p statistic represents the significance level where a value below 0.05 is considered to
be statistically significant. A p-value below 0.05 means that it is unlikely (probability of less than five
percent) that the observed relationship or difference has occurred purely by chance. All statistical
analyses were performed using SPLUS software and Microsoft Excel.
Interpretation of the results of the pairwise comparisons (e.g. to eliminate significant relationships that
were irrelevant/nonsense) allowed the research team to identify a small number (approximately 27) of
independent variables to include in the modelling for each best-practice. Some variables were included
in most models. The selected variables were then entered in a stepwise modelling process using Akaikes
Information Criterion (AIC) as the step criteria.
Logistic regression modelling was used to explore the extent a small number of independent variables
contribute to the presence or absence of best-practice implementation. For logistic regression modelling,
a model is considered useful if it correctly predicts at least 70% of responses to the dependent variable
(i.e. each best-practice), thus only models with predictive capacity of greater than 70% have been
included in the reporting.
Regression modelling also addresses the thorny question of multicollinearity between independent
variables (i.e. where two variables essentially have the same impact). However, experiences with social
benchmarking data suggests that those efforts may lead to important variables being excluded from
models. For example, pairwise comparisons may reveal a significant relationship between
implementation of a best-practice and both participation in a soil health group and property size. If
participation in a soil health group and property size are also correlated, regression modelling may
exclude one of these variables. There are sophisticated statistical techniques that can help to further
tease out causality but these are beyond the scope of this research project.
The following results sections A-D provide information related to these topics under section headings,
though some of the topics are addressed across multiple sections.
18 | AGRICULTURE IN THE NORTHERN WHEATBELT:
RURAL LANDHOLDER SOCIAL BENCHMARKING REPORT 2021SECTION A: PROFILE OF FARMING IN THE NORTHERN
WHEATBELT
AN AGRICULTURAL LANDSCAPE
The Northern Wheatbelt as being primarily an agricultural landscape was confirmed in the survey, with
89% of all respondents earning an income from their property in 2018/2019. This highlights agriculture
as being a central element of the regional economy, with 74% of respondents earning more than $50,000
from these activities, which sits above the national average of 69% of agricultural enterprises that have
a turnover of $50,000 or above 10.
The most prevalent land use was cereal cropping (73%), pastures (54%), legumes (46%), and sheep for
wool (45%) and meat (45%).
Overall, 83% of respondents reside on their Wheatbelt property, rising to 91% of full-time farmers, with
the median length of land ownership by the respondent’s family reported as 55 years, and the average
90 years. Across all respondents, the median age was 55 years and 92% of respondents were male.
This is very close to the national median farmer age of 54 years, which itself sat well above the national
general workforce median age of 40 years, and suggested lower female participation (at least in terms
of respondent gender) that the national average of 32% female agricultural workers 11.
FARM MANAGEMENT AND LANDHOLDER PROFILE
56% of enterprises had bought additional land in the region in the last twenty years and just over a quarter
(27%) had subdivided or sold part of their property in the last twenty years. Across all farmer types, the
average number of hours of on-farm work was 60 hours per week and 73% of respondents had another
family member working on the farm, most of which (53%) were a spouse or partner. Off-property income
was received by 23% of both respondents and their partners, and 34% of partners only. 42% of this off-
farm income was above $50,000 in the 2018/2019 financial year. 76% had completed secondary school
or higher, with 29% holding tertiary education qualifications.
Farmer types present a useful way to see how different priorities influence landholder management
practices. This typology was developed by Groth et al. (2014), has been published in peer-reviewed
academic journals 12 and used in previous phases of this Soil CRC project 13. Survey participants self-
identify into one of four groups based on their engagement with farming:
10 National Farmers Federation, (2017), Food, Fibre & Forestry Facts — A Summary of Australia’s Agriculture
Sector. NFF https://nff.org.au/wp-content/uploads/2020/01/171116-FINAL-Food-Fibre-Food-Facts.pdf
11 Binks, B., Stenekes, N., Kruger, H., & Kancans, R. (2018), Snapshot of Australia’s Agricultural Workforce,
Australian Bureau of Agricultural and Resource Economics and Sciences.
12 Groth, T. M., Curtis, A., Mendham, E., & Toman, E. (2014). Farmer identity in multifunctional landscapes: using
a collective identity construct to explore the nature and impact of occupational identity. Australian Geographer,
45(1), 71-86; Groth, T., Curtis, A., Mendham, E. A., & Toman, E. (2016). The utility of a collective identity construct
to explore the influence of farming identity on natural resource management. Society and Natural Resources 29(5)
508-602; Groth, T., and Curtis, A. (2017). Mapping farmer identity. Why? How? What it tells us? Australian
Geographer, 48:3, 365-383.
13 Curtis, A., & Luke, H. (2019). Social benchmarking for natural resource management: 2019 North Central Victoria.
Southern Cross University, NSW.
19 | AGRICULTURE IN THE NORTHERN WHEATBELT:
RURAL LANDHOLDER SOCIAL BENCHMARKING REPORT 2021• Full-time farmers: 72%
• Part-time-farmers: 10%
• Hobby farmers: 8%
• Non-farming land holders: 10%
Full-time farmers represent the majority of respondents (72%) and 95% of these respondents were
male, with an average age of 58 years. Full-time farmers had the largest holdings, with an average
holding size of 3902 hectares, and they were the only group to have additional land under their
management, with an average of 1712 hectares of additional land being managed. They also had the
highest rates of residency (91%) and had the longest association with their land, with an average family
ownership of 64 years. This group was most likely to have a family member working on the farm (84%),
with 60% of this number a spouse/partner, 38% a child of the respondent, 18% a parent and 15% a
sibling. Their most likely land use was for cereal cropping (89%), pasture (66%) and legumes (59%).
77% of this group have completed secondary school or higher and 31% of them hold a tertiary
qualification.
The remaining landholder types were fairly equally distributed. Part-time farmers represented 10% of
all respondents and all of these respondents were male. The average age of part-time farmers was 64
years, and they held an average of 865 hectares, with less than half (42%) residing on the property. On
average, their family had owned the land for 31 years. Part-time farmers were most likely to use their
land for farming beef (46%), areas of remnant vegetation (31%) and area set aside for living or recreation
(31%). In terms of education, this was the most highly educated group, with 64% having completed high
school and almost half (46%) holding tertiary qualifications.
Hobby farmers made up 8% of all respondents. This group had the highest level of female respondents
(27%), and an average age of 59 years. 73% of hobby farmers live on their property, which had an
average size of 141 hectares and had been owned by their family for an average of 33 years. This group
used their land for farming sheep (42%), pasture (33%) and areas of remnant native vegetation (33%).
73% of hobby farmers had completed secondary school or higher, with 27% holding tertiary qualifications.
Non-farmers were the second most common type of landholder, comprising 10% of respondents. This
group had an average age of 67 years and 20% of the respondents were female. This group held an
average of 562 hectares and 60% were resident on the farm. Their family ownership of the property
spanned an average of 37 years and they were the group most likely to set aside an area for living and
recreation (40%), yet 53% reported that they have cereal crops. 64% of non-farmers had completed high
school or higher and 14% hold tertiary qualifications.
For all landholders the median land holding was 3227 hectares across a median of two properties. For
full-time farmers, this increased to 3902 hectares, which is closer to the national average of 4,331
hectares 14. When taken in consideration with the fact that full-time farmers were the only group to have
additional land under their management, with an average of 1712 hectares of additional land being
managed, full-time farmers on the Wheatbelt tend to manage an area of land greater than this national
average. (For a further breakdown of land use and enterprise type, see Table X2 in Appendix 1).
14 Jackson, T., Zammit, K., & Hatfield-Dodds, S. (2020), Snapshot of Australian Agriculture 2020, Australian Bureau
of Agricultural and Resource Economics and Sciences, Canberra.
20 | AGRICULTURE IN THE NORTHERN WHEATBELT:
RURAL LANDHOLDER SOCIAL BENCHMARKING REPORT 2021Figure 3: Diagram showing distribution of farmer type by local government area, 2020
VALUES, BELIEFS AND DECISION-MAKING
A key element of the conceptual basis for this social research is that farmer behaviour is derived from
“core elements of personality and belief structures” 15, where these can be seen through underlying
values, beliefs and norms. Prior research has shown the usefulness of this Values-Belief-Norm (VBN)
theory of understanding environmental behaviours, by suggesting that individuals were more likely to act
when something that they value may be threatened 16. In this section, we explored both values connected
to the property by the landholder (‘attached values’) and underlying values and principles held by the
landholder (‘held values’). This informs understanding of the complex priorities and considerations that
landholders contend with, and that may in turn drive land management behaviours, by showing what is
considered to be important.
The results show that different types of landholders attach different values to the land that they own and
manage. The Wheatbelt is dominated by full- and part-time farmers (together making up 82% of
15 Curtis, A., & Luke, H. (2019). Social benchmarking for natural resource management: 2019 North Central Victoria.
Southern Cross University, NSW, p28.
16 Ibid, p28.
21 | AGRICULTURE IN THE NORTHERN WHEATBELT:
RURAL LANDHOLDER SOCIAL BENCHMARKING REPORT 2021You can also read