Work from Home & Productivity: Evidence from Personnel & Analytics Data on IT Professionals - Michael Gibbs, Friederike Mengel, and Christoph ...
←
→
Page content transcription
If your browser does not render page correctly, please read the page content below
WORKING PAPER · NO. 2021-56

Work from Home & Productivity:
Evidence from Personnel & Analytics Data
on IT Professionals
Michael Gibbs, Friederike Mengel, and Christoph Siemroth
JULY 2021

                                                           5757 S. University Ave.
                                                               Chicago, IL 60637
                                                              Main: 773.702.5599
                                                                bfi.uchicago.edu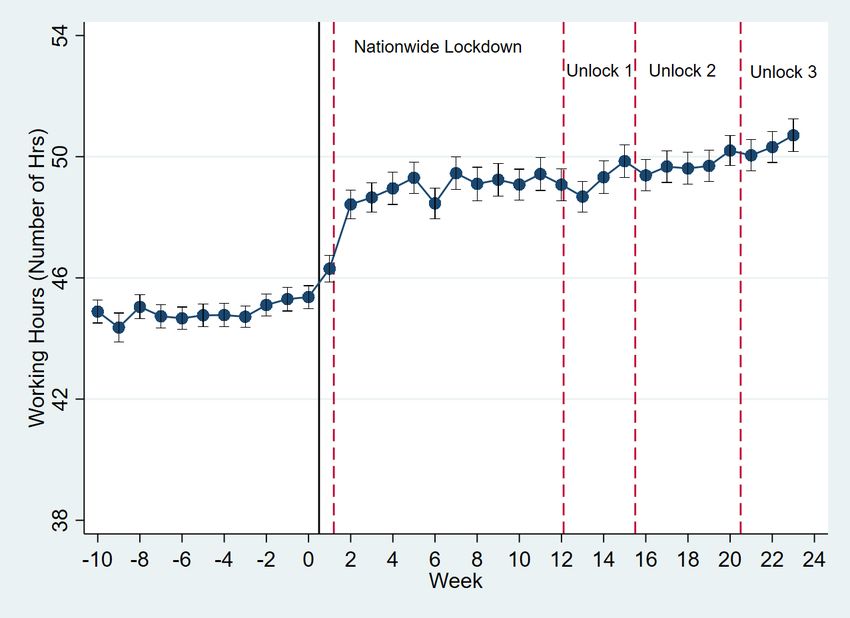
Work from Home & Productivity: Evidence from
        Personnel & Analytics Data on IT Professionals∗

                 Michael Gibbs†            Friederike Mengel‡            Christoph Siemroth§

                                                 July 13, 2021

                                                    Abstract

      We study productivity before and during the working from home [WFH] period of the Covid-19
      pandemic, using personnel and analytics data from over 10,000 skilled professionals at a large Asian
      IT services company. Hours worked increased, including a rise of 18% outside normal business hours.
      Average output declined slightly, thus productivity fell 8-19%. We then analyze determinants
      of changes in productivity. Employees with children at home increased work hours more and
      had a larger decline in productivity than those without children. Women had a larger decline in
      productivity, while those with longer company tenure fared better. An important source of changes
      in WFH productivity is higher communication and coordination costs. Time spent on coordination
      activities and meetings increased, while uninterrupted work hours shrank considerably. Employees
      communicated with fewer individuals and business units, both inside and outside the firm. They
      also received less coaching and 1:1 meetings with supervisors. The findings suggest key issues for
      firms to address in implementing WFH policies.

      Keywords: Collaboration, Coordination, Covid-19 Pandemic, Productivity, Remote Working,
      Telecommuting, Working From Home, Work Hours, Work Time

      JEL Classification: D2, M5.

  ∗
     We are grateful to several employees of the company who spent a great deal of time helping us collect the data
and understand the firm and context, during a difficult period of time. We thank the Tata Center for Development
at the University of Chicago for funding that helped cover the cost of WPA licenses. We appreciate helpful comments
from Sonia Bhalotra, Ron Burt, Matthew Clancy, Hans Peter Grüner, Emma Harrington, Kathryn Ierulli, Alan Kwan,
Duk Gyoo Kim, Michael Lotus, Adam Ozimek, Tim Perri, Paul Smeets and Wim Van der Stede, and from seminar
participants at the University of Mannheim and the University of Essex.
   †
     University of Chicago & IZA. E-mail: gibbs@uchicago.edu.
   ‡
     University of Essex, Department of Economics, Wivenhoe Park, Colchester, CO4 3SQ, UK and Department of
Economics, Lund University, Tycho Brahes vaeg 1, Lund, Sweden. E-mail: fr.mengel@gmail.com.
   §
     University of Essex, Department of Economics, Wivenhoe Park, Colchester, CO4 3SQ, UK. E-mail:
christoph.siemroth@essex.ac.uk.
1    Introduction

Working from Home [WFH] has been rising for years, as more occupations use computers and telecom-
munications, more people have reliable home Internet connections, and more families have both parents
working full time. The Covid-19 pandemic accelerated this process by forcing a large fraction of the
global workforce to switch to WFH at least temporarily. Compared to Working from the Office [WFO],
WFH has the potential to reduce commute time, provide more flexible working hours, increase job
satisfaction, and improve work-life balance. However, little is yet known about some of the more
fundamental consequences of WFH, including its effects on productivity and which factors play a role
in making WFH more or less productive than WFO (WSJ, 2020; Financial Times, 2021b).
    In this paper we provide an analysis of the effects of WFH in a large Asian IT services company.
The company abruptly switched all employees from WFO to WFH in March 2020, in response to the
largely unanticipated pandemic shock. Our study has several novel and interesting features.
    The industry and occupations analyzed here are among those predicted to be most amenable to
WFH. The employees are highly-skilled professionals in an information technology company where a
high degree of work has always been computer driven. At the same time they are some of the most
difficult to analyze. The jobs involve significant cognitive work, collaboration on teams, working with
clients, and innovation. Productivity is hard to measure for such professions. WFH for occupations
with such characteristics has not previously been studied with non-survey data.
    For a panel of over 10,000 employees and a period of 17 months including both WFO and WFH,
we obtained unusually rich data data from the company’s personnel records and workforce analytics
systems. These include each employee’s key output and work hours, which provide a natural measure
of productivity. For a sub-sample, the firm provided data on how employees allocated time between
work tasks. This includes meetings, collaboration and time focused on performing work without
distractions. It also includes information on networking activities (contacts) with colleagues both
inside and outside the firm. We also have employee experience, tenure, age, commute time (for
WFO), gender, and the number of children at home.
    These data provide a unique opportunity to obtain a measure of productivity for this complex
type of work, and to investigate the determinants of productivity during WFH. We analyze how
WFH productivity varied by employee characteristics, whether or not children were at home, and
commute time. We also analyze how it varied with the nature of the work: the extent of collaboration,
networking, supervision and coaching. Our analysis of the productivity differences between WFH and
WHO provide valuable insights about the issues that are likely to be most important when designing
future WFH schemes.
    Our findings are presented in two parts. We first analyze how average work time, output, and
productivity changed during WFH. With that foundation, we then analyze what drives those changes
and which employees are more affected. We consider the role of both employee and job characteristics
and study extensively changes in working patterns induced by WFH.
    We find that employees significantly increased average hours worked during WFH. Much of this
came outside of normal office hours. At the same time, there was a slight decline in output as measured

                                                  2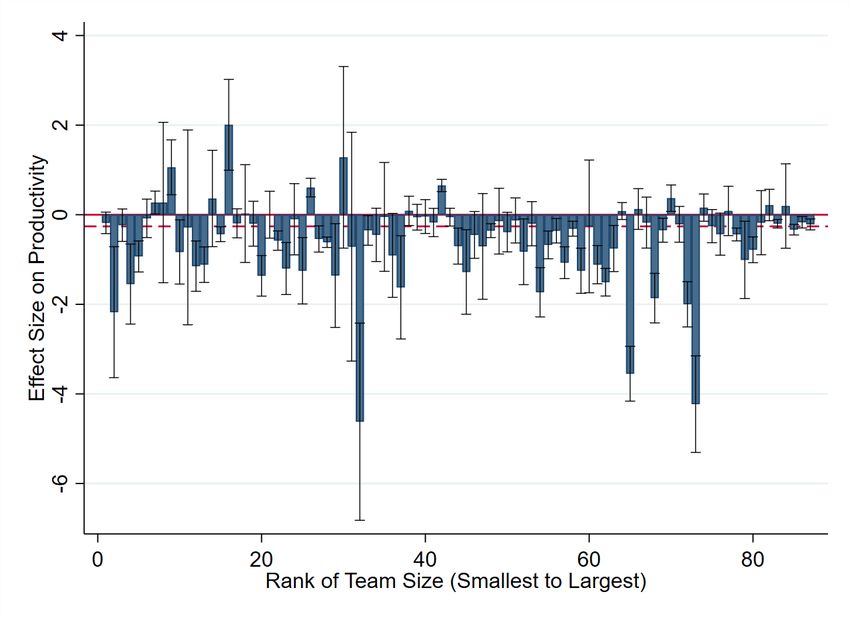
by the employee’s primary performance measure. Combining these, we estimate that productivity
declined by 8-19%. These results are consistent with employees becoming less productive during
WFH, and working longer hours to try to compensate.
       Employees with children at home had a greater decline in productivity than those without, but
even those without suffered productivity losses. Moreover, women were more negatively affected by
WFH than men, but this gender difference was not due to the presence of children in the home. We
conjecture that it might be due to other demands placed on women in the domestic setting while
working from home.1
       Employees with lower company tenure decreased output slightly during WFH, whereas output
remained about the same for those with longer tenure. This is separate from age or experience effects.
This suggests that employees who are more adapted to firm culture and processes are better able to
perform in WFH, where there is no colleague at the next desk for quick help or advice.
       WFH also affected working patterns in substantial ways. Employees spent more time participating
in various types of meetings, but less time in personal meetings with their manager or receiving
coaching. They engaged in fewer contacts with colleagues inside and outside of the firm. At the
same time, they had less “focus time,” i.e., uninterrupted time to perform tasks. All of these factors
were significantly correlated with the productivity changes due to WFH. These were not temporary
adjustments to a switch to WFH, but persisted over time. These findings suggest that increased
coordination costs during WFH at least partially explain the drop in productivity.
       A potential concern is that the pandemic affected estimates of productivity changes during WFH.
However, several pieces of evidence suggest that this is not a major concern. First, the effects on
work time and productivity begin immediately at the move to WFH, not gradually as the pandemic
developed. Second, the decline in productivity is also observed among employees without children at
home, though to a lesser degree, so the detrimental productivity effects are not solely driven by school
closures. Third, changes in work time and productivity do not correlate with the evolution of the
pandemic, such as the rate of infections or easing of lockdown measures. Fourth, there is a decline,
not an increase, in sick days during WFH. Finally, as with many information technology firms, the
company’s economic performance was quite strong throughout the pandemic, so employees were not
at more risk of job loss.
       The evidence presented below provides important insights into how WFH may vary across different
types of occupations and firms employing a blended WFH / WFO approach. Our analyses indicate that
communication, coordination and collaboration are more costly in a virtual work setting. This is likely
to present a significant challenge to WFH in occupations where such aspects are important, especially
for less experienced employees. While WFH is likely to remain a feature of modern workplaces,
some aspects of in-person interactions cannot easily be replicated virtually, including the quality of
   1
     In the Western context it has often been reported that the burden of childcare and home-schooling disproportionately
affected women during the pandemic (Financial Times, 2021a). In the country from which our data are drawn, extended
families often live together, and middle and upper class families often have domestic staff. Having extended family and
staff at home can provide help with childcare, but may place other demands on women at home whether or not children
are present.

                                                           3
collaboration and coaching, and “productive accidents” that arise from spontaneously meeting people
(including those with whom there is not yet a working relationship).
2 Literature
Our research contributes to a broad agenda in economics trying to understand determinants of indi-
vidual productivity. A significant amount of work has focused on incentive pay (e.g., Lazear, 2000;
Hamilton et al., 2003; Shearer, 2004; Babcock et al., 2015; Friebel et al., 2017; Aakvik et al., 2017;
Dohmen and Falk, 2011). Some research looks at effects of other human resource practices, particularly
those aimed at eliciting employee participation in continuous improvement, and on complementarities
between these policies (Ichniowski et al., 1995; Ichniowski and Shaw, 2003; Bartel et al., 2007). There
is limited research in other areas, such as ways to engage employees in innovation (Gibbs et al., 2017).
Some literature studies the effects of supervisors (Lazear et al., 2015) or peers (Bandiera et al., 2005;
Arcidiacono et al., 2017; Song et al., 2018). Presumably peer effects would be weaker during WFH as
there is no face-to-face interaction and probably less overall interaction. Supervisor effects might be
stronger, if managers vary significantly in their ability to lead and coordinate virtual teams.
A growing literature analyzes working from home policies. At the start of the pandemic, a few
papers predicted the likelihood that a job would shift from WFO to WFH, typically using descriptions
of occupations in classifications such as O*NET (e.g., Dingel and Neiman, 2020; Adams-Prassl et al.,
2020). The industry and occupations analyzed here are among those predicted most likely to effectively
switch to WFH.
Several surveys document incidence of WFH, and perceptions of its effects (Bick et al., 2020;
Brynjolfsson et al., 2020; Von Gaudecker et al., 2020; Gottlieb et al., 2021; Hensvik et al., 2020).
Professionals, managers, knowledge workers, those in clerical support or data processing, and those
with higher education or income make more use of WFH. In the UK Household Longitudinal Survey,
employees who work from home state that they are about as productive as in the office (Etheridge
et al., 2020). Those who perceive declines also experience lower levels of well-being from WFH.
Bellmann and Hübler (2020) find that working remotely has no long-run effect on work-life balance,
and that a switch to WFH increases job satisfaction only temporarily. Barrero et al. (2020) estimate
that WFH reduced total commuting time among US workers by more than 60 million hours per work
day at the height of the pandemic, and that about 35% of this time saved was reallocated to work.
We do not find that commute time predicts increases in WFH work hours.
Barrero et al. (2021) provide evidence from waves of a large panel of US employees working from
home. Respondents report benefits from lower commute time, more flexible work hours, and increased
productivity. Employers have made investments in technology, revised practices, and moved up the
learning curve with respect to WFH. They suggest that use of WFH will remain four times more
prevalent than before the pandemic.
DeFilippis et al. (2020) use communication and email meta-data. Their estimate that WFH
employees work 0.8 more hours per day is between estimates from our two time measures. They also
4find that employees attend more meetings, with more attendees. Teevan et al. (2020) present similar
evidence for Microsoft employees. Kwan (2021) analyzes reading of Internet content by employees in
a very large sample of firms in ten countries. He uses IP addresses to identify when employees WFH,
and creates proxies for employee interactions and need for coordination. These proxies are negatively
associated with a shift to WFH.
Survey data on productivity might be biased if employees enjoy WFH and hope to retain the prac-
tice, conflate output with productivity, or refer to individual performance without full consideration
of collaboration with others. Only a few papers have studied WFH using employee data. Bloom et al.
(2015) analyzed call-center employees at a Chinese firm. Output rose for those assigned to WFH,
partly because they worked more hours, and partly because productivity increased. Employee satis-
faction increased, and attrition declined. Emanuel and Harrington (2021) studied call-center workers
at a large US company, including those who abruptly moved to WFH in response to Covid-19. Pro-
ductivity rose in the switch to remote work. However, average productivity was lower for remote
workers than office workers. They conclude that remote work has an adverse selection effect, and
more productive workers prefer to be at the office.
WFH may be relatively effective for call-center workers, who work independently and follow scripts.
Künn et al. (2020) analyze an occupation with extremely high cognitive demands but no collaboration:
professional chess players. They had lower quality performance when playing online during Covid-19,
compared to in-person tournaments. Of course, the highly unusual occupation makes it difficult to
generalize from their findings.
A policy that goes beyond WFH is Working from Anywhere [WFA], in which an employee is
allowed to choose where they live and work. This might provide additional benefits in quality of
life, managing a dual-career couple, or real estate prices. Choudhury et al. (2019) study a natural
experiment in which examiners at the US Patent and Trademark Office were allowed to work from
anywhere. Productivity rose by 4.4%, with no decline in the quality of work. However, they note that
these jobs do not require significant collaboration and coordination.
None of these studies were able to analyze potential mechanisms underlying differences in pro-
ductivity between WFH and WFO. This study is, to our knowledge, the first that is able to provide
evidence on this question.
3 Data and Empirical Strategy
The setting for this study is one of the world’s largest IT services companies, with over 150,000
employees who work with clients across the globe. While it employs workers in many countries, the
group studied here are employed at its corporate campuses in the home country, a rapidly developing
Asian nation. The company provides a wide range of technology consulting and outsourcing services.
That includes outsourced product and process improvement and R&D to develop new products and
services.
5The workforce is highly skilled and educated. Virtually all have at least a bachelor’s degree, often
in a technology field such as computer engineering or electronics. Most work at the company’s large,
modern corporate campuses in several cities of its home country. These campuses look and feel very
similar to what one sees at Microsoft, Apple or Amazon.
We were provided with anonymized employee data of various kinds, and executives spent consider-
able time explaining practices and business conditions. All authors have visited company headquarters.
A brief description of how the employees in our sample are evaluated is helpful. The company has
a semi-annual planning process that culminates in goals for each organizational level from the CEO
down. Ultimately the process leads to goals for each team, based on business unit objectives and
expectations about customer requests during the next 6 months. The team supervisor then sets goals
for each employee.2 Analytics systems (described below) are used to track progress against the plan
throughout the organization. Each manager is provided with reports for his or her unit. For example,
the CEO reviews the corporate-wide report at least once per month. Such a “data-driven” approach
is common in technology firms (Brynjolfsson and McAfee, 2012).
Company executives told us that this process was not changed during the sample period. Most
customers are also information technology firms. That sector tended to perform well during the
pandemic. This firm and its clients largely continued expected business activities. All of this means
goals were not changed. Company financial statements reveal that total workforce size and revenue
both rose by more than 5% in 2020 compared to 2019, and profit margins rose even more. That is
noteworthy, since it also means that employees had no larger concerns about job loss.
These plans and goals form the basis of supervision. Informally, managers monitor employee work
time and performance across key applications and tasks, in order to better supervise and coach them.
This is supported by the analytics platforms described below. Formally, each employee is measured
by performance against the semi-annual goal on a key performance metric, which we will refer to as
“Output.” He or she also receives quarterly supervisor feedback, and bi-annual subjective performance
ratings.
A notable advantage of this study is that the performance measure is relatively rigorous and
objective. The supervisor devises the key metric to reflect the most important aspect of the job, and
this is tracked with the analytics systems. For example, for a software engineer it might be the number
of code segments completed. Importantly, such a measure does not merely reflect quantity (which
would lead to obvious multitask incentive problems). Rather it is Output conditional on adequate
performance on other dimensions of the task, such as quality or customer satisfaction. For example,
code segments will not be counted as complete until they meet company and customer standards
for errors, speed, and functionality. Moreover, since the measure is output-based, it reflects various
employee inputs, including time, effort, skill development, client interactions, drawing upon colleagues
for advice, etc.
The employees in our sample do not receive incentive pay tied directly to this or any other mea-
sure. Compensation is comprised of salary, an annual merit bonus based on overall performance, and
2
If an employee is reassigned, or a project is completed and the team begins a new one, this process is refreshed for
affected employees before the next cycle begins.
6Table 1: Summary statistics for outcome variables
Mean SD 1st Quartile 3rd Quartile N
WFO (pre March 2020)
Input 5.08 2.03 3.78 6.35 47387
Output 100.82 9.00 100.00 100.00 47387
Productivity 1.36 2.99 0.75 1.27 47387
WFH (post March 2020)
Input 7.04 2.75 5.38 8.90 22862
Output 100.30 8.80 100.00 100.00 22862
Productivity 1.11 2.41 0.52 0.88 22862
occasional small rewards for activities such as suggestion of valuable new ideas. That the performance
measure is tied to the company’s business plan suggests employees are motivated to try to meet their
goals, and our evidence confirms this. However, motivation is broader than this, due to supervisor
monitoring, feedback, subjective evaluation, merit pay, and the potential to earn a promotion (as is
true at most companies).
3.1 Main outcome variables
The company uses two systems, Sapience Analytics and IDMS (“Internal Data Management Sys-
tem”), to track employee activity and performance. Our three key outcome variables, Input, Output,
and Productivity, derive from these. Managers use analytics reports based on these data to support
decisions, goal-setting, monitoring, and performance evaluation. Because of its corporate-wide signif-
icance, the company has devoted substantial effort to making sure that the data are meaningful and
reliable.
We obtained data for all employees from the R&D part of the firm who are managed via these
systems. Data cover April 2019 through August 2020, resulting in a panel dataset with 10,384 unique
employees observed over 17 months. The company moved abruptly to WFH in March 2020 as Covid-19
became serious in that country.
Sapience Analytics software is installed on the employee’s computer. Sapience records the time
that an employee is working, by tracking applications or websites used, and whether the employee is
active (i.e., using the keyboard or mouse). If an employee procrastinates on a social media platform,
and this is not part of the job, that would not be recorded as work time. If a program from a pre-
defined list of relevant tools (programming, collaboration, document production, communication, etc.)
is active, that is recorded as work time. It includes meetings entered in the Outlook calendar, which
is used throughout the company, even if these are face-to-face (off the computer). Sapience therefore
records effective work hours. If an employee sits at his or her desk for 8 hours a day, Sapience might
only record 5 hours, because breaks or surfing the web are not effective work time. Employees are
aware that the software is used in this way.
7Based on these data, we calculate the outcome variable Input, equal to average working hours per
working day that month. That is, we take the total time worked that month and divide it by the
number of working days (taking into account weekends and local holidays). In section 3.3 below, we
describe additional input measures that generate similar qualitative results; our findings are robust to
details of the definition of hours worked.
IDMS is a proprietary system by which the company tracks employee performance, including
the primary performance measure. That measure is normalized to make different jobs and roles
comparable.3 For example, key measures might be the number of code segments, code reviews, or
reports delivered per month. In each case, these are divided by the monthly goal, multiplied by 100.
It is possible to complete more tasks than are assigned, so the outcome variable Output can take
values in R+
0 , but is typically between 0 and 100. By far the most common value is 100, meaning
that employees continue working longer hours until they meet their target, but we also see employees
falling short of their targets or even exceeding them.
Finally, our outcome variable Productivity is calculated by dividing Output by Input. Differences
in productivity will often be a consequence of differences in Input needed to reach the goal, but they
can also come from employees falling short of or exceeding targets. Table 1 displays summary statistics
before and during WFH. The number of observations under the two regimes differs, because we have
more pre-WFH months.
3.2 Employee/HR variables
We obtained information on employee characteristics, collected as of March 20, 2020 (roughly the
date on which WFH was implemented). Summary statistics are in Table 2. For some employees some
variables are missing. One reason is that HR data are deleted if an employee leaves the company or
transfers to a branch in a different country.
We have Age, company Tenure, and industry Experience (collected at hiring and updated to the
current date), all measured in years. For each we generate median splits, HighAge, HighTenure and
HighExperience. Mean age is quite young, which is not unusual in the IT sector. Mean tenure is low
at about 4 years, as is expected since employee turnover is high in the IT sector. Male is a dummy
variable representing male employees. As in tech companies around the world, men are a significant
majority.
The variable NumChildren is the number of children up to age 21 who are covered under the
company’s employee health insurance plan. The company believes that the vast majority of employees
who have dependent children insure them via the company, because of its relatively generous health
insurance coverage. However, some might instead be insured through a partner’s employer. Hence, a
zero means that there are either no children at home, or there are but they have not been declared.
A positive number is the actual number of children at home. The dummy Children equals one if and
only if NumChildren is positive.
3
Our analysis does not rely on this normalization, as our fixed effects regressions compare the same employee before
and during WFH.
8Table 2: Summary statistics for employee variables
Mean SD 1st Quartile 3rd Quartile N
Age (in years) 31.91 5.95 27.10 36.03 7969
HighAge 0.50 0.50 0.00 1.00 7969
Tenure (in years) 4.21 3.90 1.11 5.11 7969
HighTenure 0.52 0.50 0.00 1.00 7969
Experience (in years) 8.10 5.22 4.04 11.10 7969
HighExperience 0.50 0.50 0.00 1.00 7969
Male 0.76 0.43 1.00 1.00 7969
NumChildren 0.52 0.73 0.00 1.00 8934
Children 0.39 0.49 0.00 1.00 8934
CommuteTime 0.65 0.33 0.38 0.85 4323
Rating 2.66 0.88 2.00 3.00 5354
CommuteTime is an estimate of the time in hours needed to get from the home address to the
office (during WFO), one-way. The company calculated this based on home and office addresses,
using the Google Maps API to incorporate factors such as traffic and not merely distance. Thus,
it is an estimate of the usual time taken, assuming that the employee commutes by car.4 Address
data are often incomplete, so there are more missing values than for other variables. We discarded
extreme values (larger than 2 hours). According to the company these are cases where commute
time is unreliable; for example, an employee actually worked at a client office closer to home, not the
company office where his or her team is located.
Rating is the supervisor’s subjective evaluation of the employee on an integer scale of 1 to 5, where
1 is the best rating. We have the most recent rating from May/June 2020. The outcome measures
discussed above are predictive of performance ratings: mean input and mean productivity in months
prior to the rating significantly improve that rating (see Table A.1 in the Appendix). Figure B.1 in the
Appendix plots kernel density estimates of subjective ratings for different levels of Output. Ratings
generally rise with Output, but start to decrease once Output substantially exceeds the target. A
possible interpretation is that such an employee gave too much emphasis to meeting the goal, and
the supervisor gives a lower subjective rating to balance multitask incentives. Another is that the
goal was too easy to achieve. Overall, this indicates that the outcome measures introduced above are
meaningful.
3.3 Workplace Analytics Data
Microsoft Workplace Analytics [WPA] is a tool that many companies use to track and analyze various
aspects of their workforces. For example, it can be used to study collaboration or professional net-
working activity by using data on emails, calendar appointments, amount of time spent in meetings,
etc. WPA data have been used in several organizational studies (Brynjolfsson and McAfee, 2012;
Hoffmann et al., 2012; Levenson, 2018).
4
Some employees use public transport, but we have no data about mode of travel.
9The company has been considering adoption of this tool. For the purposes of this study they
purchased 914 licenses to apply to a subset of employees in our full sample. Appendix Table A.2
compares those in the WPA sample to those not in the WPA sample. The WPA group are slightly
younger, have lower tenure and are less productive, but are overall quite similar on average.
Table 3: Summary statistics for WPA variables
Mean SD 1st Quartile 3rd Quartile N
WFO (before March 15th 2020)
Working Hours 44.71 5.16 43 46.46 6755
After Hours 9.64 9.55 2.33 14.04 6755
Focus Hours 34.49 9.02 30 41.25 6755
Collaboration Hours 10.20 9.24 3.55 13.75 6755
Meetings Manager 3.97 4.35 0.5 5 6755
Meetings 1:1 0.18 1.37 0 0.5 6755
Coaching Meets 0.13 1.03 0 0 6755
MS Teams Calls 0.36 1.63 0 0 6755
Internal NW 18.91 14.21 10 24 6755
External NW 2.58 3.61 0 3 6755
NW EXT 0.98 1.04 0 1 6755
NW ORG 0.05 0.22 0 1 6755
Emails 23.61 23.68 9 30 6755
WFH (after March 15th 2020)
Working Hours 49.03 7.58 45.14 52.49 19220
After Hours 12.98 12.70 3.71 18.44 19220
Focus Hours 32.73 9.99 28 40 19220
Collaboration Hours 11.07 9.97 4.08 15 19220
Meetings Manager 5.48 6.57 1 7.33 19220
Meetings 1:1 0.11 1.07 0 0 19220
Coaching Meets 0.09 0.98 0 0 19220
MS Teams Calls 21.46 25.22 3 30 19220
Internal NW 23.44 19.89 11 30 19220
External NW 3.05 4.36 0 4 19220
NW EXT 0.91 0.89 0 1 19220
NW ORG 0.05 0.23 0 0 19220
Emails 25.26 29.89 8 30 19220
Note: “Working hours” are weekly hours worked. After hours are weekly hours worked outside regular work time. “Focus
Hours” are hours with two or more hour blocks not spent in meetings, on calls or writing e-mails. “Collaboration Hours”
are hours spent in meetings or MS Teams calls. “Meetings Manager” is the number of meetings involving the employee’s
manager. “Meetings 1:1” is the number of meetings between the employee and their manager. “Coaching Meets” is the
number of meetings the employee attended with the manager and all of the manager’s direct reports. “MS Teams Calls”
is the number of calls the employee participated in. “Internal NW” is the number of people inside the company with
whom employee had meaningful contact in the last 28 days. “External NW” is the same measure for people outside the
company. “NW ORG” is the number of distinct company organizational units (outside his or her own) with which the
employee had at least two meaningful interactions in the last four weeks. “NW EXT” is the same measure for domains
outside the company. Emails is the weekly number of emails sent by the employee.
Table 3 summarizes variables obtained from WPA. WPA data were collected at the weekly level
(in contract to Sapience data, collected at the monthly level). We have 10 weeks of data before WFH
10(starting January 1, 2020) and 24 weeks of data during WFH (ending September 6, 2020). The switch
to WFH happened in the week starting March 16.
Variables fall into several categories. Working Hours measures overall time worked by the employee.
It is best viewed as capturing time “at work” (at home or in the office), not every minute of which
is necessarily spent working; e.g., it will count small breaks in between emails as work time. It can
detect longer work hours due to additional email traffic, meetings in the calendar or online, and other
activity involving Microsoft services. In contrast, Sapience Input captures time “effectively working,”
excluding breaks or non-work activities. Thus, Input is our preferred measure, as it is specifically
designed to measure work time and has more technical access to employee activities than WPA.
During WFO, employees on average spent 44 Working Hours per week (Table 3), which is close
to the contractual 40 hours per week, so Working Hours is close to the nominal work time. After
Hours measures the number of weekly hours worked outside regular office hours. Despite different
definitions and measurement, the Sapience variable Input and the (monthly mean of) Working Hours
are significantly correlated (ρ = 0.2715∗∗∗ ).5 The correlation between the variable After Hours and the
Sapience variable Input is also positive and statistically significant (ρ = 0.3127∗∗∗ ). Working Hours
and After Hours are mechanically related as the latter is part of the former.
A second group of variables (Focus Hours, Collaboration Hours, Meetings Manager, Meetings 1:1,
Coaching Meets and MS Teams Calls) relate to meetings. Focus Hours is time that is uninterrupted
by meetings, calls or emails. It is thus a measure of the amount of time the employee can concentrate
on tasks. Collaboration Hours is the total time spent in various forms of meetings. The latter four
variables measure time in meetings by structure and purpose. Meetings Manager is the number of
meetings the employee attends that involve their manager, and Meetings 1:1 are personal meetings
between the employee and manager. Coaching Meets is the number of meetings involving the employee,
their manager and all of the manager’s direct reports. MS Teams Calls is the number of calls using
MS Teams (which allows for video meetings similar to Zoom or Skype).
Appendix Table A.3 shows (pre WFH) pairwise correlations between these meeting-related vari-
ables. As expected, all correlate negatively with Focus Hours, especially Collaboration Hours and
Meetings Manager. All pairwise correlations are statistically significant at the 1% level. The different
types of meetings are positively related among each other, but with smaller coefficients. These corre-
lations are positive both across employees – some job roles involve more meetings than others – and
across time – some periods involve more meetings of all types.
The third group of variables (Internal NW, External NW, NW EXT, NW ORG, Emails) relate to
networking with colleagues and clients more explicitly. The first two measure the number of individuals
(inside and outside of the company, respectively) with whom the employee had contact. The latter
two measure the number of business units (e.g., teams) involved in those contacts. These measure
the breadth of the employee’s communications and networking contacts. Appendix Table A.4 shows
5
The correlation is larger when aligning definitions by focusing on components of “Working Hours” measured by both
tools. For example, WPA’s measure of time spent writing emails correlates to Sapience Input with ρ = 0.4099∗∗∗ . The
correlation is still below 1 because it relates WPA’s measure of only one activity with Sapience’s measure of overall
working time.
11the (pre WFH) pairwise correlation between these networking-related variables. All correlations are
positive and highly statistically significant, across employees as well as across time.
3.4 Empirical strategy
As a first step, in Section 4.1 we estimate the average WFH effect, using the data discussed in Sections
3.1 and 3.2. Our main specification exploits differences in outcomes for each employee, when working
from home compared to working in the office during that month in the previous year, controlling for
employee and customer team fixed effects. The unit of observation is the employee-month. Index the
employee by i and the month by t = 1, 2, . . . , 17. For outcome variable yit , we estimate by OLS:
X X
yit = αi + βWFHt + γj CustomerTeamjit + δs Monthst + εit , (1)
j s
where αi is the employee fixed effect, WFH is a dummy variable indicating months working from
home, and CustomerTeamjit is a dummy variable equal to one if and only if employee i in month t
was part of team j. Monthst is a month (not month-year) dummy variable, so that Month1t = 1 if and
only if t is January, Month2t = 1 if and only if t is February, etc. In addition, we report an alternative
specification controlling for a linear rather than seasonal time trend:
X
yit = αi + βWFHt + γj CustomerTeamjit + δt + εit . (2)
j
Once the average WFH effect is established, we analyze variation in this effect. Section 4.2 studies how
effects vary with employee characteristics. We interact the WFH dummy in the previous specifications
with additional explanatory variables X1i , X2i , . . .. Because the Xji variables are employee specific but
time invariant, we do not separately control for them, as that is already achieved by the employee
fixed effects.6
We exclude March 2020 (t = 12) from regressions because our main outcome variables are collected
at the monthly level, and working from home started in mid-March 2020.7 Thus, this month is neither
purely WFO nor WFH. Moreover, it is likely that WFH increased in the days prior to the official WFH
start, so the switch date was not clear-cut. An implication of excluding March 2020 is that teething
problems and short-term adaption effects are not reflected in our estimate.8
Section 4.3 analyzes the effects of mechanisms such as time spent in communication, and focus
time. For these we rely on the WPA data described above. Here our empirical strategy is identical to
the one described in equation (2), except that we control for weekly instead of monthly time trends,
as these data are available weekly. Hence, in these regressions t = 1, ..., 34 represents weeks. For all
analyses we cluster standard errors at the employee level.
6
While age, tenure, and experience are not time invariant, our sample window is only 17 months, so there is no
meaningful variation during that window. Hence, to avoid collinearity issues, we use only employee fixed effects.
7
This month is nevertheless plotted in the graphs.
8
For example, not every employee had suitable hardware at home to work with in the days after the switch. This was
fixed quickly, but can explain some of the noticeable drops in work time and output in March 2020, see Figure 1a.
12103
8
Time worked per working day
102
7
Output by month
101
6
100
5
99
4
−11 −10 −9 −8 −7 −6 −5 −4 −3 −2 −1 0 1 2 3 4 5 −11 −10 −9 −8 −7 −6 −5 −4 −3 −2 −1 0 1 2 3 4 5
Month Month
(a) Input: Time worked per working day (b) Output: Tasks completed relative to target
1.6 1.4
Productivity
1.2 1
−11 −10 −9 −8 −7 −6 −5 −4 −3 −2 −1 0 1 2 3 4 5
Month
(c) Productivity
Figure 1: Average outcomes by month. The vertical line (month 0) indicates the switch to working from home.
4 Results
4.1 Average WFH effect
Before proceeding to the regression analysis, Figure 1 plots the three main outcomes by month to get
an intuitive idea about the WFH effect. This will also help us understand which of the econometric
models (1) or (2) seems most appropriate for controlling for time trends.
According to Figure 1a, Input, employees provide about 5-5.5 hours of daily input; i.e., time in
which they are actively using their software or programming tools, or in meetings or communications.
There is relatively little variation in average input pre-WFH, with a slight upward trend. Hence, a
13Table 4: Average Working-From-Home effect
(1) (2) (3) (4) (5) (6)
Dependent variable Input Input Output Output Productivity Productivity
WFH 2.117*** 1.592*** -0.530*** -0.098 -0.256*** -0.138*
(0.034) (0.038) (0.125) (0.155) (0.031) (0.074)
Linear month trend 0.040*** -0.035** -0.010
(0.003) (0.015) (0.007)
Employee FE Yes Yes Yes Yes Yes Yes
Team FE Yes Yes Yes Yes Yes Yes
Month FE Yes No Yes No Yes No
R2 0.24 0.22 0.02 0.02 0.01 0.01
Observations 70249 70249 70249 70249 70249 70249
Clusters 10312 10312 10312 10312 10312 10312
Note: Input is the time in hours per working day the employee worked in a month. Output is the employee’s normalized
output relative to target in a month. Productivity is output divided by time worked. The unit of observation is the
employee-month. Standard errors are shown in brackets below the point estimates, and are clustered on employee level.
***Significant at the 1% level; **significant at the 5% level; *significant at the 10% level.
linear time trend as in model (2) might be more appropriate for this outcome measure. From the first
month of WFH, there is a large and persistent jump in input by more than 1.5 hours per day.9
For Output, Figure 1b, there is a noticeable spike in May 2019, but no visible monotonic or linear
trend otherwise, so a seasonal time correction might be more appropriate here. Moreover, average
output appears to be roughly comparable to pre-WFH months, with the exception of a dip in March
2020 (this month is neither fully WFO nor WFH). This dip might be due to disruption caused by the
transition from WFO to WFH.
Finally, for Productivity, Figure 1c, the graph is more volatile, which is not surprising for a ratio.
There is no clear linear time trend pre-WFH, but some variation from month to month, so a seasonal
correction might be more appropriate. Productivity drops visibly during WFH.
To quantify the WFH effect, and to control for employee and team time-invariant variables (via
employee and team fixed effects), we now turn to the regression analyses. Informally, the estimates
give us average differences in outcomes pre- and during WFH for the same employee, controlling for
team effects (since employees sometimes switch teams) and time trends.
Table 4 reports WFH effect estimates based on OLS regressions for all three outcome variables,
in each case with linear and seasonal time trend corrections. All estimates are in line with the visible
effects in the raw data in Figure 1.10
According to the estimates, WFH increased the time worked per day by roughly 2.1 hours (based
on a seasonal time trend) or by 1.6 hours (with a linear time trend). Both estimates are economically
9
Note that a national statistical office, which does not have access to these effective work hours, would not pick up
these changes in input at the intensive margin when using nominal work hours (which did not change during WFH) to
compute productivity.
10
Table A.5 in the appendix estimates the same regressions, but truncates the most extreme observations to account
for outliers. The qualitative results of our preferred specifications remain the same.
14very meaningful, and statistically significant at all conventional levels.11 Since both Figure 1a and
the regression indicate a linear time trend, we prefer column (2). The estimate of the WFH effect in
column (1) is larger, because it does not take the pre-WFH time trend into account in the same way.
Columns (3) and (4) estimate that Output changed by -0.5 or -0.1 percentage points, depending on
time controls (recall that fulfilling all monthly tasks implies an output of 100%). Both point estimates
are slightly negative, but only the estimate with the seasonal time trend is significantly different from
zero at all conventional levels. Hence, we conclude that WFH had no or only a small negative effect
on Output. While the regression indicates a significantly negative linear time trend, due to the outlier
in May 2019, we prefer specification (3) since a linear trend does not reflect the raw data very well.
Columns (5) and (6) estimate that Productivity decreased by 0.26 or 0.14 output percentage points
per hour worked, depending on the time controls. Given an average WFO productivity of 1.36, these
effects correspond to a 19% and a 10% drop in productivity. Both are economically significant: if
employees worked a fixed 40 hours per week, this fall in productivity would imply a drop in output of
10.2 or 5.5 output percentage points in a week. In other words, if employees had not increased time
worked during WFH, on average they would have completed only 90-95 of 100 assigned tasks. The
WFH effect in specification (6) is significantly different from zero only at the 10% confidence level,
whereas the effect in specification (5) is statistically significant at all conventional levels. We prefer
specification (5), since both the plot and the linear time trend coefficient indicate that a linear trend
is not as appropriate.12
In summary, this evidence indicates that employees worked longer but less productively, with
output remaining about the same or dropping slightly. Thus, there appear to be two countervailing
effects on output that roughly offset each other. Our interpretation of these patterns is that employees
were less productive during WFH, but still aimed to reach the same output or goals, and hence work
longer until the same output was reached. In the next sections, additional results will suggest that
productivity decreased due to increased distractions and coordination costs.
A potential alternative explanation for the jump in work time during WFH might be that employees
“gamed” the Input numbers. This is unlikely for several reasons. First, Sapience time measurement
is sophisticated and designed to be resilient to manipulation attempts. Merely keeping the computer
on for longer or watching videos instead of working does not increase Input. Rather, it would require
having the relevant work software as the active window, and giving continuous mouse or keyboard
input. Second, gaming time measurement in Sapience would not translate into increases in WPA’s
time measurement.13 WPA time recording is from activity in MS Outlook, MS Teams etc., rather than
programming tools or similar, and is not dependent on mouse / keyboard activity. Yet the WFH effect
we see with this alternative time measurement is also positive, see section 4.3. Third, employees are
not paid by the hour. To impress superiors, time is better spent generating output. Fourth, Sapience
11
For comparison, the contractual working day (pre-WFH) is 9 hours at the company we study, which includes a 1
hour lunch break.
12
We also estimated the productivity regression without time controls. The WFH estimate is -0.2 output percentage
points per hour worked with a t-statistic of -6.8; i.e., a highly significant effect consistent with the other specifications.
13
Unlike Sapience, employees were not aware of the use of WPA analytics. WPA licenses were purchased for the first
time and for this study specifically. Very few people at the company knew about it and had access to these data.
15was in use long before the switch to WFH, so this potential concern cannot explain the WFH effect
well. Fifth, the additional WFH effects we find from WPA activity (section 4.3), such as more time
spent on conference calls and fewer focus hours, cannot be explained by “gaming.”
Another potential concern might be that the increase in Input is due to measurement error, as
spontaneous (unscheduled) face-to-face meetings during WFO might not be counted as working time,
while spontaneous online meetings during WFH are counted. This is not backed up by the data. We
are able to reproduce the findings in this section using other measures of working time, available for
a sub-sample of employees (Section 4.3). We also find adverse effects of WFH on direct measures
of networking and training; in particular the number of some types of meetings decreases during
WFH. Moreover, employees with children, and those working in roles where networking with people
outside the company is more important, are more adversely affected by the switch to WFH. This is
difficult to explain with unscheduled offline meetings, but is consistent with increased disruptions and
coordination costs. Last, we observe when an employee starts and ends their working day. The length
of the workday measured in this way increases from 7.64 hours to 9.17 hours during the WFH period.
Taken together, these results suggest that spontaneous offline meetings explain at most a small part
of our overall results.
If employees used their own devices to work from home, we would not track that activity (in either
period). However, this company did not allow employees to do so, to insure integrity of confidential
client information. Any employees who worked at home in both periods had to use a company-owned
laptop computer and phone, both of which included the tracking software used to collect our variables,
with one small exception. During the transition to WFH, a small percentage of employees who did not
yet have a company-owned laptop computer were briefly allowed to use personal devices to perform
some work. This lasted only until the company could provide them with laptops. In such cases
Sapience would not track their work, so our Input variable has missing values. This affects a very
small percentage of our data.
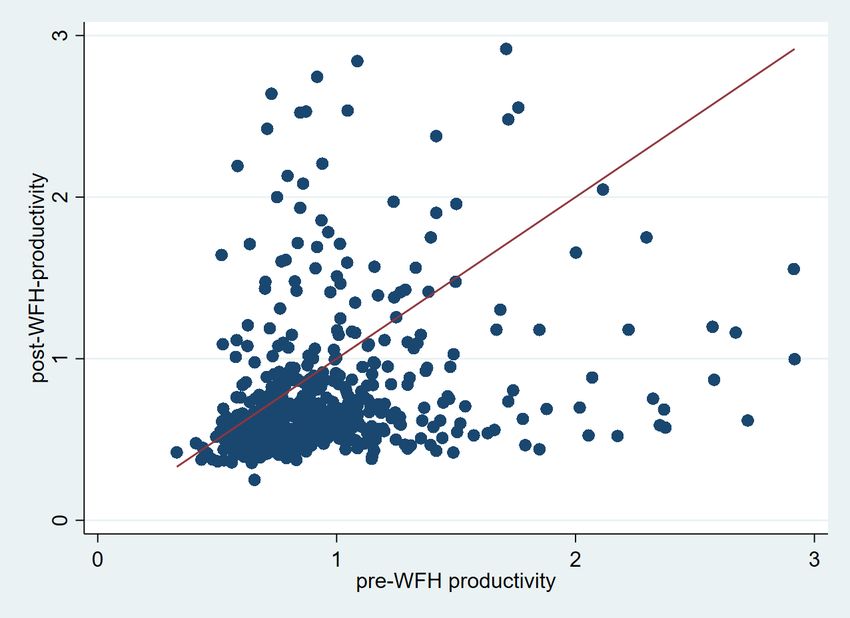
Another possible explanation for the increase in time worked is that pandemic lockdown measures
closed restaurants, cinemas, etc., thereby reducing the value of leisure time. Under this explanation,
however, we would expect Output to increase and Productivity to remain approximately constant,
which is not what we observe. Appendix Figure B.5 shows that while we see a slight dip in working
hours after every stage of lockdown easing, the effect is small and, more importantly, only temporary.
We also do not find evidence that productivity or other outcomes co-vary with national or regional
indicators of the severity of Covid, such as deaths or case rates.
Finally, we are able to measure the number of days the employee worked relative to the number
of work days in a month. According to Table A.6 in the appendix, the number of sick days decreased
significantly. This suggests that absences or sickness were not a driver of the decrease in productivity.
4.2 Who copes better with WFH? Heterogeneous WFH effects
We now explore what drives the WFH effect in more depth, and which subgroups are most affected
by the shift to WFH. Table 5 displays estimates for all outcome variables, separately by whether
16Table 5: Working-From-Home: Children at home and gender differences
(1) (2) (3) (4) (5) (6)
Dependent variable Input Input Output Output Productivity Productivity
WFH 1.416*** 1.599*** -0.528*** -1.176*** -0.206*** -0.361***
(0.046) (0.086) (0.150) (0.267) (0.042) (0.075)
WFH × Children 0.307*** 0.091 0.061 0.673 -0.169*** -0.027
(0.059) (0.128) (0.205) (0.431) (0.058) (0.111)
WFH × Male -0.211** 0.895*** 0.149
(0.094) (0.300) (0.093)
WFH × Male × Children 0.252* -0.822* -0.157
(0.145) (0.495) (0.133)
Employee FE Yes Yes Yes Yes Yes Yes
Team FE Yes Yes Yes Yes Yes Yes
Month FE No No Yes Yes Yes Yes
Linear Month Trend Yes Yes No No No No
R2 0.23 0.25 0.02 0.02 0.01 0.01
Observations 64392 58644 64392 58644 64392 58644
Clusters 8865 7911 8865 7911 8865 7911
Note: Input is the time in hours per working day that the employee worked in a month. Output is the employee’s
normalized output relative to target in a month. Productivity is output divided by time worked. The unit of observation
is the employee-month. Standard errors are shown in brackets below the point estimates, and are clustered on employee
level. ***Significant at the 1% level; **significant at the 5% level; *significant at the 10% level.
employees have children at home and by gender, using our preferred time control from the previous
section. The number of observations is slightly reduced since the additional explanatory variables
are missing for some employees. We converted the explanatory variables (except commute time) into
dummy variables for easier interpretation.
In the country in which the company is located, all schools closed in March 2020 during the Covid-
19 pandemic, so working from home was presumably an even greater challenge for some parents, as
children needed to be supervised and perhaps taught. Hence, we investigate whether having children at
home changed an employee’s WFH effect. An important qualification is that under normal conditions,
children would attend school and any adverse effects of WFH on productivity of parents might be
lower.
Column (1) shows that employees who have at least one child at home (as measured by company
health insurance coverage) increased work time more during WFH than did their counterparts without
children. Possibly, this is due to the fact that employees with children get distracted more often
during WFH and compensate by working longer hours. Employees with children at home work almost
a third of an hour more per working day during WFH than those without children, who themselves
still work 1.4 hours more during WFH. These effects are highly significant. Column (3) reveals no
significant change in the WFH effect on output with children at home. However, column (5) shows
that the increased working time implies a larger drop in productivity when there are children at home.
Consequently, the patterns seen for the average employee are exacerbated for employees with children.
17The even columns in Table 5 investigate whether there was a gender difference in how outcomes
changed during WFH, conditional on whether there were children at home.
The WFH × Male interaction represents the difference in the WFH effect between male and female
employees without children. Male employees without children increased working time by about 0.2
hours less per day than did female employees without children, a significant effect. They also suffered
a smaller decline in output.
The WFH × Children interaction represents the difference in the WFH effect between female
employees with and without children. Female employees with children did not significantly increase
working time during WFH compared to female employees without children, nor did their output or
productivity significantly differ.
Finally, the sum of WFH × Male and WFH × Male × Children is the difference in the WFH effect
between male and female employees with children. This difference is roughly zero for all outcome
measures, so there is no gender difference among employees with children at home.
Thus female employees are more adversely affected by WFH, but this is not due to child care
responsibilities. The latter finding contrasts with much of the narrative in western countries, where
childcare responsibilities are given as a main reason why women are more adversely affected by WFH
(Financial Times, 2021a). We conjecture that this is due to greater expectations placed on women by
parents and parents-in-law in the domestic setting.
Next, we investigate whether employees with more industry experience or company tenure were
affected differently by WFH. One reason this could be the case is that they have greater institutional
knowledge and social capital, and are less reliant on help from colleagues or find it relatively easier to
obtain during WFH. To investigate the effects of age, company tenure, and industry experience (at
the company or elsewhere), we generate dummy variables with a median split. Since these variables
are highly correlated, we estimate their effect on the WFH estimate jointly in Table 6.14
Column (1) shows that work experience has the largest and only significant impact on the WFH
effect for time worked. During WFH, experienced employees worked roughly a quarter hour more
per day compared to less experienced employees, holding age and company tenure constant.15 Our
interpretation is that more experienced employees have more managerial duties. The increased costs of
coordination (also see next section) during WFH are therefore borne by these experienced employees,
who have to put in more time to coordinate their team. Additionally, it is likely that the lion’s share
of managing the WFH transition falls on experienced employees with more responsibility.16
14
Appendix Figure B.3 illustrates individual employee productivity during WFH as a function of productivity before
WFH. Two patterns emerge. First, most employees are more productive in WFO than WFH. Second, those who are
more productive in WFO tend to also be more productive WFH. However, there is considerable heterogeneity.
15
When estimating the regression with one interaction for age, tenure, and experience at a time (not displayed),
all interactions show significantly positive point estimates due to their positive correlation. That is, older employees
increased WFH work hours more compared to younger employees, but this is no longer true when holding tenure and
experience constant, see Table 6.
16
While more experienced employees might be more likely to have children at home, this experience effect is unrelated
to having children. When adding the interaction with Children to regression (1) in Table 6 (not displayed), the interaction
with HighExperience remains significantly positive.
18Table 6: Working-From-Home: Age, experience, tenure, commute times
(1) (2) (3) (4) (5) (6)
Dependent variable Input Input Output Output Productivity Productivity
WFH 1.361*** 1.516*** -0.743*** -0.603* -0.245*** -0.286***
(0.058) (0.095) (0.194) (0.334) (0.048) (0.083)
WFH × HighTenure 0.036 0.519** 0.003
(0.067) (0.229) (0.090)
WFH × HighAge 0.057 0.097 -0.084
(0.092) (0.366) (0.073)
WFH × HighExperience 0.270*** -0.138 -0.038
(0.094) (0.390) (0.084)
WFH × CommuteTime 0.107 0.316 -0.030
(0.122) (0.405) (0.093)
Employee FE Yes Yes Yes Yes Yes Yes
Team FE Yes Yes Yes Yes Yes Yes
Month FE No No Yes Yes Yes Yes
Linear Month Trend Yes Yes No No No No
R2 0.25 0.26 0.02 0.03 0.01 0.01
Observations 58644 31848 58644 31848 58644 31848
Clusters 7911 4295 7911 4295 7911 4295
Note: Input is the time in hours per working day that the employee worked in a month. Output is the employee’s
normalized output relative to target in a month. Productivity is output divided by time worked. The unit of observation
is the employee-month. Standard errors are shown in brackets below the point estimates, and are clustered on employee
level. ***Significant at the 1% level; **significant at the 5% level; *significant at the 10% level.
The change in Output during WFH is roughly 0.5 percentage points larger per hour for employees
with longer company tenure, holding age and experience constant. Thus, while low tenure employees’
Output falls, high tenure employees keep meeting their goals. The other characteristics do not show
a significant effect. It appears that employees who had worked at the company for longer were able
to adapt more effectively to the WFH-shock, and that this was more important than general industry
experience. This finding suggests that greater firm-specific human capital in the form of familiarity
with company procedures, or more fully-developed networks and working relationships with colleagues
and clients, were helpful during WFH. Alternatively, those with greater experience or tenure might
be in positions with more responsibility, and so responded more to the shift to WFH. For the last
outcome measure, productivity, there is no significant difference in the WFH effect among these
employee groups.
The even columns in Table 6 estimate the WFH effect by employee commute time (when working
from the office). The WFH effect does not significantly differ by commute time for any outcome
measure. Hence, the finding that WFH increased hours worked is not merely due to more available
time. Rather, it supports the interpretation that productivity fell during WFH, and employees worked
more to compensate.
Figure 2 shows the mean and 95% confidence intervals of the estimated effect of WFH on produc-
tivity separately for different customer teams. Those are teams of employees who work for the same
19You can also read