The safest time to fly: Pandemic response in the era of Fox News - University of Nottingham
←
→
Page content transcription
If your browser does not render page correctly, please read the page content below

NICEP Working Paper: 2020-03

 The safest time to fly: Pandemic response in
              the era of Fox News

               Maxim Ananyev, Michael Poyker
                      and Yuan Tian

Nottingham Interdisciplinary Centre for Economic and Political Research
https://nicep.nottingham.ac.uk
School of Economics and School of Politics and International Relations,
University Park, Nottingham, NG7 2RD
ISSN 2397-9771
The Safest Time to Fly:
          Pandemic Response in the Era of Fox News∗
                 Maxim Ananyev†                 Michael Poyker‡               Yuan Tian§

                                            October 19, 2020

                                                 Abstract

            We document a causal effect of conservative Fox News Channel in the United
         States on physical distancing during COVID-19 pandemic. We measure county-level
         mobility covering all U.S. states and District of Columbia produced by GPS pings to
         15-17 million smartphones and zip-code-level mobility using Facebook location data.
         Then, using the historical position of Fox News Channel in the cable lineup as the
         source of exogenous variation, we show that increased exposure to Fox News led to a
         smaller reduction in distance traveled and smaller increase in the probability to stay
         home after the national emergency declaration in the United States. Our results show
         that slanted media can have a harmful effect on containment efforts during a pandemic
         by affecting people’s behaviour.

       Keywords: Mobility, Media Bias, Fox News, COVID-19.
       JEL codes: D1, D7, I31, Z13.

   ∗
     First draft: May 15, 2020; Current version: October 19, 2020. This paper was first submitted for review
on May 16, 2020. After completing the paper, we were made aware of a working paper by Simonov et al.
(2020) (posted on SSRN on May 14, 2020) that uses the same idea of identifying variation and a different
dataset for measuring mobility outcomes. Our results were produced independently.
   We thank UNACAST for generously sharing mobility data and Facebook’s Data for Good initiative for
sharing Facebook users’ mobility data. We are grateful to Elliott Ash, Sergei Guriev, Vasily Korovkin, Alexey
Makarin, and Charles Wyplosz, for their thoughtful comments. Poyker is grateful for financial support
from the Institute for New Economic Thinking. All errors are ours. Correspondence at: Columbia Business
School, Uris Hall 126, 3022 Broadway, New York, NY 10027.
   †
     Ananyev: University of Melbourne; e-mail address: maxim.ananyev@unimelb.edu.au
   ‡
     Poyker: University of Nottingham; e-mail address: mikhail.poyker@nottingham.ac.uk
   §
     Tian: University of Nottingham; e-mail address: yuan.tian1@nottingham.ac.uk

                                                     1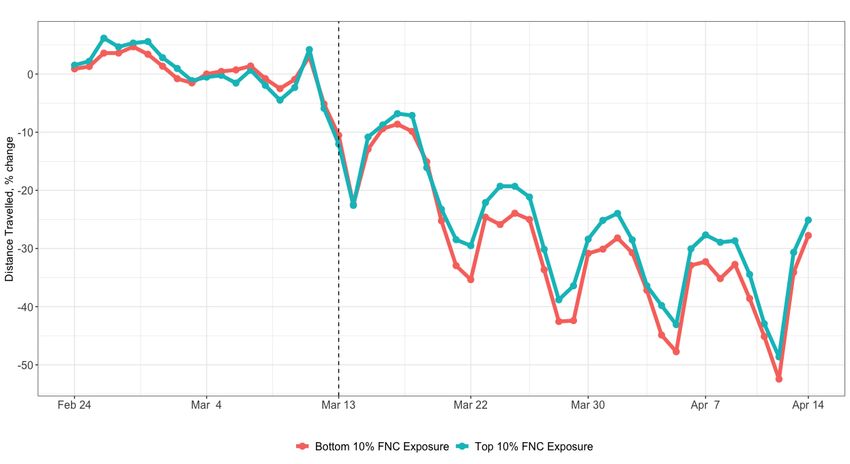
1       Introduction
    Media play many important roles in people’s lives by transmitting information and
shaping beliefs.1 Such beliefs include trust in government, trust in science, and perception
of threat, which can have behavioural implications in many contexts including public
health. In such high-stakes cases as pandemics, the influence on how people comply with
policies that promote safe behaviors and limit spread of a contagious disease are especially
important.
    In this paper, we investigate the causal impact of slanted news media on public be-
haviour during the COVID-19 crisis. COVID-19 is a contagious disease of respiratory sys-
tem that caused a pandemic in the early 2020. One of the measures deemed necessary to
limit the spread of the disease is physical distancing (limiting travel and person-to-person
interactions), because the virus spreads through droplets of infected persons (Hatchett,
Mecher and Lipsitch, 2007; Anderson et al., 2020; Hsiang et al., 2020). Fox News Channel
(hereafter, FNC), the leading cable channel in the United States, has a well-documented
conservative bias in its programming (Martin and Yurukoglu 2017). During the initial
days of the COVID-19 pandemic, FNC’s commentators concentrated on delivering three
messages: (i) emphasizing potential culpability of China and Chinese government in the
pandemic; (ii) downplaying potential dangers of the virus and suggesting untested med-
ical procedures; (iii) alleging that Democrats use the pandemic to undermine President
Trump before the election. These messages could potentially affect people’s evaluation of
the risk and thus their willingness to self-isolate during the crisis.
    Using an exogenous variation in the exposure to Fox News Channel, we document a
statistically significant and economically sizable effect of FNC on physical distancing. Fol-
lowing Martin and Yurukoglu (2017), we exploit the exogeneity of the historical position
of FNC in cable lineup. This variable has been shown to be (i) unrelated to the socio-
demographic and political condition prior to the introduction of FNC, and (ii) strongly
predictive of actual FNC viewership once the channel is introduced. Our effects can come
from three channels. First, FNC viewership directly feeds people with the three aforemen-
tioned messages. Second, the build-up of the conservative ideology can make people less
willing to adopt drastic changes in their behavior and living habits. Third, conservative
population may be more susceptible to FNC’s messages.
    We use internet-based location data to measure social distancing behaviour. It is gen-
    1
    Scholars have shown that slanted media have an impact on voting and political preferences (DellaV-
igna and Kaplan, 2007; Enikolopov, Petrova and Zhuravskaya, 2011; Adena et al., 2015), collective ac-
tions (Zernike, 2010), political polarization (Prior, 2007; Martin and Yurukoglu, 2017), investment decisions
(Friebel and Heinz, 2014), political polarization (Martin and Yurukoglu, 2017), judicial decisions (Ash and
Poyker, 2019), city budgets (Galletta and Ash, 2019), and candidate entry (Arceneaux et al., 2020).

                                                     2
erally hard to directly observe people’s actions. In our case, however, we measure the
county-level changes in distance traveled using location data of 15-17 million smartphones
provided by UNACAST, and zip-code-level measures of mobility using GPS pings of
smartphones of Facebook users.
In our main specification, we regress the change in physical-distancing measures on
FNC exposure — the standardized position of FNC in a cable lineup. Our hypothesis is
that after the declaration of national emergency on March 13, people are likely to adopt
social distancing practices; less so for regions more exposed to FNC. Although states en-
acted different orders in terms of shelter-in-place practices and business operations at dif-
ferent times, the declaration of national emergency is a salient landmark in governments’
campaign against COVID-19 at the national level. We interact time-invariant FNC lineup
position with a dummy for post- and pre-national emergency dates. Consistent with our
hypothesis, we find that before the national emergency, the mobility was similar in the
pre-COVID period in areas with different FNC positions. After national emergency was
announced, a one-standard-deviation increase in FNC exposure led to a 0.5-percentage-
point larger decline in the county-level average of distance traveled relative to pre-COVID
period and 0.1-percentage-point larger decrease in the probability of staying at home.
We conduct various robustness checks. Our results are not driven by a particular set
of states and are not explained by alternative explanations, most notably that high-FNC
exposed locations are less likely to have employment composition favourable for work-
from-home, or be in more rural locations. Controlling for CNN and MSNBC does not
affect the FNC estimates, indicating that our effects are not through crowding out of al-
ternative media. Our result are robust to using county-level and zip-code-level Facebook
data for 14 states. We also provide an event-study specification that allows us to control
for the time path of the effect and estimate weekly coefficients for weeks before and af-
ter the national emergency. We find that the effect of Fox News is constant in the weeks
after the national emergency was pronounced and did not diminish in the four weeks of
the post-emergency period. Finally, we replicate our results using state-specific shelter-
in-place orders. While our results hold for periods after the orders were enacted, we find
that people started to self-isolate even before that. Thus, overall we think that national
emergency was the most salient starting point of social-distancing.
We interpret our result as the combination of the direct information channel and the
indirect effect through the interaction with built-up conservatism. We control for Repub-
lican vote shares in the 2016 election, and it does not affect the magnitude and significant
of the estimate of FNC exposure effect.
To put the magnitude of our results in context, the biggest decrease in distance traveled
3per person after March 13 happened in District of Columbia (59 percent), and the smallest
one — in Nevada (13 percent). According to the estimates of Martin and Yurukoglu (2017),
moving FNC from channel 10 to channel 40 (approximately, two standard deviations) is
associated with a 5-minutes reduction per week per person in time spent watching FNC.
According to our results, when FNC is moved 30 positions higher in the cable lineup, it
decreases social-distancing by one percentage point. This effect can explain 2% and 8%
of the total reduction in population movement in DC and Nevada, respectively. As for
the probability of staying at home, among the 14 states (plus DC) where we have zip-
code-level data, the 30-positions change in FNC increases of the probability of staying at
home by 0.2 percentage point. This explains 2% and 33% of the increase in probability of
staying at home in DC and West Virginia, respectively, which had the biggest and smallest
changes.
We also provide evidence that these differences were consequential for mortality. Specif-
ically, we find that a one-standard-deviation increase in FNC lineup position decreased
the number of COVID-related deaths by 2.2 percent by the end of March. This result is
consistent with Bursztyn et al. (2020).
Our paper contributes to several strands of literature. First is the literature on the im-
pact of media. Several pieces of work have documented the impact of media on voting
outcomes (DellaVigna and Kaplan, 2007; Enikolopov, Petrova and Zhuravskaya, 2011),
conflict (Yanagizawa-Drott, 2014), popularity of extreme parties (Adena et al., 2015), among
others. Following Martin and Yurukoglu (2017), we add to the literature by showing
how biased media can have public health consequences, a usually non-political outcome,
through changing people’s behavior. We demonstrate that in addition to shaping people’s
mindsets in the long run, the information conveyed by the biased media on the interpreta-
tion of scientific advice and policies can be costly to the society, especially when collective
action is needed in the time of public health crises.
Second, we contribute to the literature on using granular real-time individual-level
data to study people’s behavior. Researchers have used cell phone location data to mea-
sure commuting and economic activities (Kreindler and Miyauchi, 2019) and segregation
(Athey et al., 2019), cellphones’ call data to investigate the impact of social networks on
mobility (Büchel et al., 2019; Blumenstock, Chi and Tan, 2019), information transmission
about social distancing practices (Tian, Caballero and Kovak, 2020), and job referrals (Bar-
wick et al., 2019), and Facebook friendship data to measure social connectedness (Bailey
et al., 2018) and study its impact on disease transmission in the case of COVID-19 (Kuch-
ler, Russel and Stroebel, 2020). This type of data is especially useful in our context, since
we can directly observe people’s behavior in terms of complying with the social distanc-
4ing policy and track the real-time changes. In addition to documenting the changes in
mobility before and after the declaration of national emergency and the geographically
distribution of mobility, we investigate the potential determinants of such geographically
variation and highlight the importance of media.
Finally, our paper adds to the rapidly growing literature on the COVID-19 pandemic,
especially on determinants of physical distancing and transmission. Wright et al. (2020)
shows that shelter-in-place ordinances were effective in reducing mobility and that com-
pliance was correlated with both economic conditions and political opinions. Similarly,
Allcott et al. (2020) shows a gap in a physical distancing between places with more Re-
publicans and places with more Democrats and suggests that partisan messaging was one
of the mechanisms. We share the features of these two papers by using cellphone location
data to measure mobility; however by using a plausibly exogenous variation in expo-
sure to FNC, we causally identify the effect of media on social distancing practices. We
emphasize that not only the pre-existing political views but also the flow of information
through (politicized) media can shape people’s view. Bursztyn et al. (2020) identifies the
effect of watching the most popular FNC show, Hannity, on mortality. We instead focus
on behavior responses. By using much finer geographically variation (county-level and
zip-code-level instead of relatively large Designated Market Area level), the timing of the
declaration of national emergency, and direct measures of behavior responses, we show
how exactly FNC viewership can affect efforts in combat with the infectious diseases.
A contemporaneous paper by Simonov et al. (2020) uses the same identifying variation
and the SafeGraph data for social-distancing measures (we use UNACAST and Facebook
data instead). There are several notable differences between our approach and that of Si-
monov et al. (2020). First, we use the earliest available data on the FNC position (from
2005), while Simonov et al. (2020) use the data from 2015. This difference is important
because cable networks are well aware of the influence that channel position has on the
viewership and lobby providers to put their channels “lower on the dial” (Snider and
Hall, 1998). This is especially true for FNC: as early as 2007 the movement of the channel
from position 46 to position 44 in one of the Time Warner Cable markets was seen as a
major win that merited inclusion in a self-congratulatory announcement by FNC.2 Thus,
FNC position in the later years is more likely to be endogenous to the lobbying efforts of
FNC leadership. Second, the effect of FNC exposure on social-distancing can be poten-
tially explained by the two types of channels: conservatism and COVID-19 messaging.
The conservatism can influence social-distancing directly by making people skeptical of
2
BusinessWire. ”FOX Business Network to Launch on Channel 43 on Time Warner Cable. FOX
News Channel Moves to Channel 44”, September 5, 2007. URL: www.businesswire.com/news/home/
20070905006114/en/FOX-Business-Network-Launch-Channel-43-Time.
5governmental interventions and academic experts. Because we use the historical position
of FNC, we are able to control for the built-up conservatism (by including controls for
the 2016 election results), thus isolating the effect of COVID-19 messaging and shedding
light on the mechanisms. These differences from Simonov et al. (2020) are consequential.3
While our results are the same in terms of significance and the sign of the effect, the mag-
nitude of our estimates is smaller, while still being economically and epidemiologically
important.
This paper proceeds as follows. Section 2 introduces background information about
the development of COVID-19 in the United States, policies on social distancing, and its
coverage by Fox News. Section 3 describes our data. Section 4 introduces our empirical
specification, identifying assumptions, and results. Section 5 concludes.
2 Background: COVID-19 and Fox News Channel
2.1 COVID-19 and Social-Distancing
COVID-19 is a disease of the respiratory system caused by a new coronavirus (SARS-
CoV-2). The first case was reported on December 31 in Wuhan, China, and the first death
from the new virus was reported in China on January 7. The virus then rapidly spread to
other countries (the first case outside China was reported on January 13, 2020). The WHO
declared a pandemic on March 11, 2020.4 The first confirmed case in the U.S. happened
on January 21, 2020. As of April 28, 2020, the Center for Disease Control and Prevention
(hereafter, CDC) reported 981,246 total cases in the U.S. and 55,258 deaths related to the
illness.5 Due to its means of transmission, the CDC advised that ”limiting face-to-face
contact with others” was ”the best way to reduce the spread of coronavirus disease.”6
3
There are other notable differences in specification choices (we use a specification with date fixed effects)
and they use 2SLS specification with time-invariant FNC viewership as the treatment variable.
4
WHO COVID-19 Timeline. URL: who.int/news-room/detail/
27-04-2020-who-timeline---covid-19.
5
CDC. URL: cdc.gov/coronavirus/2019-ncov/cases-updates/cases-in-us.html (ac-
cessed on 28/04/2020).
6
CDC. URL: cdc.gov/coronavirus/2019-ncov/prevent-getting-sick/
social-distancing.html (accessed on 28/04/2020).
62.2 Messages of the Fox News Channel
FNC is the leading cable channel in the U.S. with an estimated 3.5 million prime-time
viewers.7 During the initial days of the COVID-19 spread, FNC engaged in three major
discussions on the topic: China’s culpability, COVID-19’s insubstantiality, and Democrats’
partisan interests.
First, when President Trump used the term ”Chinese coronavirus,” some of his critics
suggested that this term would fuel prejudice against Chinese nationals in the U.S. and
Chinese-Americans. Some of the FNC hosts spent a significant amount of time rebutting
this claim. For example, Sean Hannity said on March 12, 2020:
Over there at fake news CNN, you have fake news Jimmy Acosta, well, he’s
most worried about the president’s terminology, thinking the president’s speech
was racist because he said the fire started in China.8
Another issue was on the credibility of Chinese data. On February, 18, Laura Ingra-
ham, the host of ”Ingraham Angle” (the third most-watched FNC show), said:
All right and speaking of China, as the coronavirus spreads, the flow of reliable
information from China is basically trickling to a stop, if it ever existed at all.
Now why is that? And what exactly are they hiding from us?9
FNC personalities also discussed a specific hypothesis about the origin of the virus, sug-
gesting that it might come from Wuhan Institute of Virology. In particular, Tucker Carl-
son, the host of ”Tucker Carlson Tonight” (the second most-watched FNC show), said on
March 12. 2020:
In fact, the outbreak may have begun not in a public meat market, but in a
poorly run Chinese laboratory. Now, that’s not our theory. Anyone who raises
that theory on American television is attacked as a conspiracy monger.10
Second, many of the FNC hosts either were dismissive towards the potential dangers
of the virus or ignored it completely. On March 13 (two days after the WHO had de-
clared a pandemic), “Fox & Friends” host Ainsley Earhardt told the viewers that it was
7
Foxnews.com: “Fox News reaches highest viewership...”, URL: https://www.foxnews.com/
media/highest-viewership-network-history-msnbc-cnn-2020.
8
Fox News Network Fox Hannity 9:00 pm EST March 12, 2020 Thursday. Source: Nexis Uni database.
9
Fox News Network Ingraham Angle 10:00 pm EST February 18, 2020 Tuesday. Source: Nexis Uni
database.
10
Fox News Network Tucker Carlson Tonight 8:00 pm EST March 12, 2020 Thursday. Source: transcripts
of Tucker Carlson Tonight from Nexi Uni database.
7”the safest time to fly” because ”the terminals are dead.”Another FNC personality, Jea-
nine Pirro, the host of ”Justice with Judge Jeanine,” on March 7 said: ”All the talk about
coronavirus being much more deadly [than seasonal flu] does not reflect reality.”11 In ad-
dition, some shows spread misinformation of diagnostics and preventive methods. For
example, Correspondent Geraldo Rivera suggested a simple (but lacking any scientific
merit) diagnostic procedure:
If you can’t hold your breath for 10 seconds. Everyone should do that. Hold
your breath for 10 seconds. If you can hold your breath for 10 seconds then
you don’t have this disease.12
Third, a large amount of air time was devoted to accusation of the Democratic party’s
”politicizing” the virus and using it opportunistically to harm the reputation of President
Trump. On March 9, Fox host Sean Hannity, suggested that opponents of the president
were ”scaring the living hell out of people.”13 Laura Ingraham, the host of “Ingraham
Angle,” said on February 25:
After their politically disastrous impeachment and the fierce intraparty fight-
ing ... Democrats needed to change the subject and fast. So, like the Coron-
avirus itself, Democrats and friends moved to quickly infect the political dis-
cussion with viral recriminations.14
After the declaration of national emergency by President Trump on March 13, 2020, the
messaging of FNC shifted towards more emphasis on the importance of distancing and
other preventive measures, but not entirely.15 In addition, the initial period of partisan
messaging could have influenced the attitudes of FNC viewers in a way that later shifts
could not completely revert due to the confirmation bias (Nickerson, 1998).
The coronavirus coverage by FNC was different from that by other major cable chan-
nels. The most popular host of MSNBC (the second most-watched cable channel in the
U.S.), Rachel Maddow covered the spread of the virus, both internationally and in the
11
Not everyone at Fox was dismissive of the dangers of COVID-19. For example, Tucker Carlson warned
his viewers several times during the early days of the disease and even seemed to criticize his FNC col-
leagues (though he also spent significant time critically discussing state-level lockdown policies). See, for
example, Fox News Network Tucker Carlson Tonight 8:00 pm EST from February 27, 28, and March 11.
Source: Nexis Uni database.
12
Mediaite.com, ”Fox & Friends...” URL:
www.mediaite.com/tv/fox-friends-churns-out-insane-misinformation-on-coronavirus/.
13
Fox News Network Fox Hannity 9:00 pm EST March 9, 2020 Monday, Source: Nexis Uni database.
14
Fox News Network Ingraham Angle 10:00 pm EST, Source: Nexis Uni Database.
15
Washington Post: ”How Fox News has shifted its coronavirus rhetoric,” www.youtube.com/watch?
v=ifKbwDf51bA).
8Figure 1: Fox News Messaging and Social Distancing
Panel A: Word Clouds of COVID-19 Coverage for Fox News and MSNBC
(a) Fox News Channel (b) MSNBC
Panel B: Fox News and Social Distancing
Note: (a) Panel A shows word clouds of COVID-19 coverage from three most-watched FNC shows (Hannity, Tucker Carlson Tonight,
and Ingraham Angle) on the left and MSNBC on the right. Transcripts are from February 1, 2020, to March 12, 2020, downloaded via
LexisNexis. To build the word clouds, we select only paragraphs containing the word ”coronavirus” and remove common English
stop-words as well three most common words in both FNC and MSNBC (”president,” ”Trump,” and ”people”). We also remove non-
informative about the tone of the coverage words like ”united,” ”states,” ”white,” and ”house.” We built word clouds with remaining
words. (b) Panel B shows the changes in daily distance traveled. The red line show changes in counties in bottom 10% of the FOX
News exposure (i.e., higher FOX News Channel number, channel positions 64-to-95). The blue line show changes in counties in top
10% of the FOX News exposure (i.e., lower FOX News Channel number, channel positions 1-to-24). Vertical dashed line represents
announcement of national state of emergency on March 13th.
9U.S., and criticized the Republican administration for lack of testing capacity and other
issues.16 CNN (the third most-watched cable channel) largely focused on reporting facts,
with occasional criticism of some of Trump’s epidemiological claims.17
To illustrate some of the distinct features of FNC coronavirus coverage, Panel A of Fig-
ure 1 plots the word-cloud of paragraphs including the word ”coronavirus” constructed
from LexisNexis transcripts of top-3 FNC shows (”Hannity,” ”Tucker Carlson Tonight,”
and ”Ingraham Angle”) as well as a similar word cloud of MSNBC transcripts from Febru-
ary 1 to March 12. For both networks, we excluded the three most common terms: ”Pres-
ident,” ”Trump,” and ”people.” We see that the most common words in MSNBC cover-
age were ”health” and ”cases,” while for the top FNC commentators, two most common
words were ”China” and ”Chinese.”
2.3 The Effect of Fox News Channel on the Compliance with Social-
Distancing
As a preview of our main result, we present a visual evidence on how exposure to FNC
affected the compliance with social-distancing. Panel B of Figure 1 plots changes in daily
distance traveled for the top 10 percentile of U.S. counties in terms of channel position of
FNC (blue line) and that of the bottom 10 percentile (red line).18 There are three observa-
tions from the graph. First, before national emergency (vertical dashed line), both types
of counties did not change the patterns of mobility compared to the pre-COVID period.
Second, after March 13, both groups reduced mobility. Third, afterwards, counties with
lower channel positions (red) experienced a larger decline in the daily distance traveled
than those in with the higher channel position, highlighting the role of FNC exposure.
3 Data and Measurement: Fox News Exposure and Social
Distancing
3.1 Exogenous Variation in Fox News Exposure
We first construct the measure of exposure to FNC. FNC viewership is correlated with
political preferences, which can potentially bias our estimate of the effect of FNC view-
ership on social distancing. For example, since many of the FNC hosts are conservative,
16
See msnbc.com/transcripts/rachel-maddow-show/2020-03-09.
17
See https://edition.cnn.com/2020/04/13/world/cnn-coronavirus-coverage/index.
html.
18
We describe construction of the main variables in the next Section.
10its viewers might be inherently more likely to view government measures with suspicion,
which might reduce their compliance. Also, given the well-documented urban/rural ide-
ological divide in the U.S., it is likely the people from rural counties watch FNC more and
are more limited in how much travel they can avoid.
Instead of using actual viewership, we use an exogenous variation in exposure to FNC:
the position of FNC in the cable lineup. FNC was launched in 1996 and quickly expanded
its geographic coverage through bilateral negotiations with local cable providers. As a
result of those negotiations, those providers started offering FNC as a part of their pack-
ages, usually replacing one of their channels with the goal to minimize the change in the
existing lineup and not to disrupt the experience of the viewers. This process created
quasi-experimental variation in FNC exposure. When FNC has a larger number in the ca-
ble lineup position, people are less likely to watch it because it takes more efforts to move
to this channel. See detailed discussions in Martin and Yurukoglu (2017).19
We obtain zip-code-level average historical (2005) position of FNC by Nielsen from
Ash and Poyker (2019). FNC became increasingly conservative afterwards and started
to lobby lower channel positions as early as in 2007. County-level measures of exposure
are aggregates of zip-code-level ones using population weights. FNC channel positions
varies from 1 in cable lineup to 95, and its standard deviation is about 15 channels.20 Mar-
tin and Yurukoglu (2017) demonstrate that FNC channel position is not predicted by the
1996 Republican voting share or electoral contributions and is not explained predicted
voting outcomes and viewership using the 2010 demographics. Here, we provide an ar-
ray of balance tests in Appendix Table 1, where we also regress 2010 demographic and
socio-economic variables on FNC position in cable lineup in 2005. All estimates are not
statistically different from zero. On the other hand, FNC exposure is correlated with the
Republican vote share in 2012 and 2016, suggesting that the channel positions in 2005
affect conservatism in later years.
3.2 Smartphones Data on People’s Mobility
The county-level estimates of reductions in mobility come from the New York-based
technology company UNACAST, inc (Unacast, 2020). Using the GPS locations, an identi-
fier (smartphone) is assigned to a county with the largest total duration of stay. There are
15-17 million identifiers for each day in the dataset, from February 24, 2020 to April 14,
19
The first-stage relationship between channel lineup and FNC viewership on the zip-code level is in
Table 2 of Martin and Yurukoglu (2017). County-level relationship can be seen in Appendix Figure 1 of Ash
and Poyker (2019).
20
Appendix Figure 1 shows the distribution of the FNC channel positions on the county-level.
112020, and the total distance traveled per device is then averaged at the county level. To
take into account the baseline differences in mobility across regions, each weekday is as-
signed a baseline distance traveled, using the same weekday during the four weeks before
March 8, 2020 (a date that is coded as the start of COVID-19 outbreak in the U.S.). Then,
the reduction in distance traveled in a day is measured as the percent reduction between
the current date and the baseline weekday. Appendix Figure 2 plots the raw variation in
average changes in daily distance traveled (post-March 13, 2020).
The zip-code-level mobility measure is constructed using data from Facebook’s Data
for Good.21 In contrast to the UNACAST dataset, the Facebook data starts on March 10,
2020 and covers only 327 counties on the east coast and west coast of the United States,
located in District of Columbia and 14 states.22 There are about 4.8 million devices per
day. With information from people using Facebook on their mobile phones with Location
History enabled, a person’s movement between two time windows is measured as tile-
to-tile movements, where a time-window is a 8-hour period and a tile is a 10km by 10km
ground square.23 After assigning tiles to zip codes/counties, we construct two measures
using these movement vectors: (i) the probability of staying in the same tile, which we call
”staying at home,” and (ii) total distance traveled.24 Since there are three time windows
per day, we take the mean of the three observations. Pre-COVID period is defined as
the 45 days prior to March 10, 2020, and both measures are constructed for this baseline
period. Although the baseline data is constant at each tile-to-tile vector, mobility measures
at different dates can still have different baseline values since a vector is only recorded if
more than 10 users made the move. In addition to the mobility information, we also
construct the total Facebook population at the zip code and at the county level.
3.3 Other Factors Affecting Mobility
There are several factors other than media viewership that could potentially affect the
extent of social distancing practices. Importantly, some jobs can be more easily switched
to the online mode than others. Thus, depending on the industry where people work,
a region’s compliance with social distancing policy can vary. We computed county-level
shares of employment in workable-at-home industries using data from Dingel and Neiman
21
https://dataforgood.fb.com/docs/covid19/.
22
The 14 states include Arizona, California, Delaware, Idaho, Maryland, Montana, Nevada, New Jersey,
Oregon, Pennsylvania, Utah, Virginia, Washington, and West Virginia. Some of these states are only partially
in the data. E.g., we only have east of Pennsylvania, from Harrisburg to the border with New Jersey.
23
For details, see https://docs.microsoft.com/en-us/bingmaps/articles/
bing-maps-tile-system.
24
Note that distance traveled is zero if a person stays at the same tile.
12(2020). Other county-level measures include voting outcomes in the Presidential elections
of 2012 and 2016 and socio-economic and demographics variables in 2010. The details of
the data sources and summary of statistics can be found in Appendix Table 1.
4 Empirical Specification and Results
4.1 Empirical Specification
The objective of the empirical exercise is to identify the effect of exposure to FNC on
social distancing after the National Emergency was announced on March 13th. The pre-
March 13th observations are used to test pre-trends. Our main specification is the follow-
ing county-date panel regression:
SDi(s)t = β1 F N CPi(s) × Beforet + β2 F N CPi(s) × Aftert + Xi(s) Γ + µs + λt + i(s)t , (1)
where SDi(s)t is a measure of social-distancing in a county i located in state s on date t,
F N CPi(s) is the 2005 FNC position in channel lineup, and Beforet (Aftert ) is a dummy
equal to one for dates before (after) the national emergency. F N CPi(s) is normalized to
have a mean of zero and a standard deviation of one, and a larger F N CPi(s) is associated
with a smaller exposure to Fox News. We control for state (µs ) and date (λt ) fixed effects.
Vector Xi(s) includes a set of county-level demographic and economic controls such as
population density and poverty rate. Standard errors are clustered at the state level.25
The coefficient of interest β2 captures the effect of FNC on social distancing after na-
tional emergency was announced. We expect it to be negative: counties with larger FNC
lineup positions have a larger decrease in the daily distance traveled relative to their pre-
COVID baseline. β1 represents the effect of FNC on social distancing before national emer-
gency was announced, and we expect it to be zero, indicating that counties with difference
FNC exposure did not exhibit differential social distancing behaviors in the pre-period.26
Since our FNC lineup is measured in 2005, which is earlier than our study period (2020),
we are eventually studying the heterogeneous effect of built-up FNC exposure on people’s
behavioral choices, given that there is a national policy advocate.
25
Results hold if we cluster by county or double-cluster by state and date or county and date. Clustering
by state yield the most conservative standard errors.
26
Note that the dummy for Before and After sum up to one, and our specification is equivalent to includ-
ing the FNC levels and the interaction of FNC with the After dummy. We present the results using our
current specification to show the absence of pre-trends more straightforwardly.
13In addition to the demographic and economic controls mentioned earlier, we take into
account the potential confounding effect of the industrial composition on the relationship
between FNC exposure and social distancing behaviors. Regions with more FNC expo-
sure may have a particular employment mix, and as shown in Dingel and Neiman (2020),
industries and occupations differ in their workability-at-home. We control for it directly
in our regressions.
FNC exposure can affect the degree of conservatism, which can directly affect the so-
cial distancing behavior if conservative population has different preferences or different
constraint, and indirectly, through the interpretation of the COVID-related messages con-
veyed by FNC. These effects are on top of direct information feeds by FNC that may affect
all of its audience, irrespective of their ideology. To separate (1) conservatism, (2) infor-
mation, and (3) the interaction of the two, we also experiment with directly controlling for
the county-level Republican vote shares in the 2012 and 2016 presidential elections and
the 2016 turnout rate, which act as proxies for built-up conservatism. In this case, the re-
maining effect of FNC on social distancing should be either through the information feed
or through the interaction of information and conservatism.27 0 28
One might be concerned that similar as the FNC exposure, other county-level charac-
teristics also affect the social distancing behaviors differentially before and after the decla-
ration of national emergency. If the FNC exposure is correlated with these characteristics,
omitting this differential impact may bias our estimate of the FNC coefficient. To address
this concern, we also consider a specification where we add the interaction of the controls
Xi(s) with the After dummy.
Although we include a wide variety of county characteristics, there might be unob-
served variables that are correlated with FNC exposure and affect the social distancing
outcome. Thus, we also present a specification where instead of the state fixed effects, we
use county fixed effects. Here, both the FNC interaction with the Before dummy and the
levels of county characteristics Xi(s) will be absorbed by the fixed effects.
27
These political economy outcomes are measured after 2005. Thus, they can be affected by the FNC
exposure set in 2005. We use these variables to highlight the mechanism, and we find that adding these
controls does not affect the coefficient estimate of the FNC exposure, pointing towards the importance of
COVID-related direct information transmission.
28
In principle, it could be the case that the conservatism ideology can also have an impact on economic
outcomes, which affect social distancing behaviors. However, we don’t find direct evidence supporting
this hypothesis. As shown in Appendix Table 1, the 2005 FNC positions are not correlated with the 2010
demographic and socio-economic conditions.
144.2 Main Results
Table 1 shows the effect of FNC exposure on social distancing using various speci-
fications. In Panel A Column I, we estimate Equation 1 with only state and date fixed
effects. The estimand βb1 is statistically insignificant, indicating that counties did not have
differential patterns in social distancing before national emergency. The point estimate of
interest βb2 is negative and significant. It indicates that a one-standard-deviation increase
in FNC lineup led to a 0.6-percentage-point larger decline in average distance traveled in
a county.
In Columns II–V, we sequentially add controls for demographic and socio-economic
variables. As documented in various other studies, higher education levels and higher
incomes at the individual and region levels are positively associated with practicing of
social distancing (Brzezinski et al., 2020; Fan, Orhun and Turjeman, 2020; Mongey, Pilos-
soph and Weinberg, 2020; Wright et al., 2020, among others). We control for unemploy-
ment rate, urban dummies, economic-dependence county indicator, poverty rate, median
income, population, share of population with high-school education, county’s land area,
share of nonwhite population, and net domestic migration rate. Column VI further adds
the employment share in workable-at-home jobs.29 . The coefficient estimate for the FNC
effect remains almost identical compared to Column I.
As FNC can affect the general level of conservatism of the local population, it can
potentially affect people’s response towards recommendations for social distancing. Col-
umn VII adds controls for the turnout in 2016 and Republican vote share in the 2012 and
2016 elections. We find that controlling for these conservatism proxies does not affect the
coefficient estimate of FNC exposure. It suggests that our results are not driven by the
accumulated FNC effect but by its immediate reaction to COVID-19, and possible by the
interaction of the two.
We also want to test if the FNC effect come from crowding out viewership of other
media. If people watch less FNC and at the same time watch more of other channels
such as CNN and MSNBC, our coefficient estimates may reflect the positive effect of other
media instead of the negative effect of FNC. Panel B replicates Panel A but adds controls
for the channel positions of CNN and MSNBC. Neither of them appears to be significant
and the coefficient for the FNC position lineup remains unchanged.
We show the robustness of our results using alternative specifications in Panel C and
Panel D. Panel C adds the interaction terms of the controls with the After dummy to take
29
In addition, we show that shares of workable-at-home jobs do not correlate with the FNC channel posi-
tion (see Appendix Table 1). We show robustness to alternative measures of workable-from-home employ-
ment in Appendix Table 2.
15Table 1: Effects of Fox News Channel Position on Reductions in Mobility
I II III IV V VI VII
Dependent variable: Difference in daily distance traveled
Panel A: baseline
Fox News channel position 0.002 0.003 0.003 0.003 0.003 0.003 0.003
x Before National Emergency (0.0019) (0.0018) (0.0019) (0.0021) (0.0021) (0.0021) (0.0021)
Fox News channel position -0.006** -0.005** -0.005** -0.005** -0.005** -0.005** -0.005**
x After National Emergency (0.0027) (0.0025) (0.0024) (0.0023) (0.0023) (0.0024) (0.0023)
R-squared 0.669 0.678 0.681 0.688 0.688 0.689 0.692
Observations 119,876 119,876 119,876 119,876 119,876 119,876 119,876
Panel B: ~ with other channels
Fox News channel position 0.002 0.002 0.002 0.002 0.002 0.002 0.002
x Before National Emergency (0.0020) (0.0019) (0.0019) (0.0022) (0.0022) (0.0022) (0.0021)
Fox News channel position -0.005* -0.005* -0.005** -0.005* -0.005* -0.005** -0.005**
x After National Emergency (0.0028) (0.0026) (0.0024) (0.0023) (0.0023) (0.0024) (0.0023)
CNN channel position -0.003 -0.003 -0.002 -0.002 -0.002 -0.002 -0.001
(0.0019) (0.0017) (0.0016) (0.0017) (0.0017) (0.0017) (0.0017)
MSNBC channel position -0.001 -0.000 0.000 0.001 0.001 0.001 0.001
(0.0018) (0.0016) (0.0015) (0.0014) (0.0014) (0.0014) (0.0013)
R-squared 0.687 0.696 0.699 0.706 0.706 0.707 0.710
Observations 104,400 104,400 104,400 104,400 104,400 104,400 104,400
Panel C: ~ w post-national-emergency controls
Fox News channel position 0.002 0.002 0.002 0.002 0.002 0.002 0.002
x Before National Emergency (0.0019) (0.0016) (0.0016) (0.0015) (0.0015) (0.0015) (0.0015)
Fox News channel position -0.006** -0.005** -0.005** -0.004* -0.004* -0.004* -0.004*
x After National Emergency (0.0027) (0.0024) (0.0023) (0.0023) (0.0023) (0.0023) (0.0023)
R-squared 0.669 0.683 0.685 0.696 0.697 0.698 0.706
Observations 119,876 119,876 119,876 119,876 119,876 119,876 119,876
Panel D: ~ w county FEs & post-national-emergency controls
Fox News channel position - - - - - - -
x Before National Emergency - - - - - - -
Fox News channel position -0.008** -0.008** -0.008** -0.007** -0.006** -0.006** -0.007**
x After National Emergency (0.0033) (0.0030) (0.0030) (0.0027) (0.0026) (0.0026) (0.0027)
FEs: County
R-squared 0.756 0.763 0.763 0.770 0.770 0.771 0.774
Observations 119,876 119,876 119,876 119,876 119,876 119,876 119,876
FEs: State
FEs: Date
Economic controls
Urban
Population controls
Share nonwhite & migrant
Workable-from-home emp.
Repub. vote share controls
Note: (a) The explanatory variable in all Panels is normalized to mean zero and standard deviation of one. (b) The dependent variable
is the difference in daily distance traveled. (c) All regressions include state and date fixed effects. Economic controls include unem-
ployment rate, economic-dependence county indicator, poverty rate, and median income. Urban controls include eight dummies for
urban-rural continuum. Population controls include population, share of population with high-school education, and county’s land
area. Share nonwhite and migration controls include share of nonwhite population and net domestic migration rate. Workable-from-
home employment control includes employment share in workable-from-home industries (according to Dingel and Neiman 2020).
Republican vote share controls include Republican vote share in 2012 and 2016 presidential elections, and 2016 turnout rate. (d) In
parentheses we report standard errors clustered on state level. *** pinto account differential effects of socio-economic and political characteristics on social
distancing. Panel D uses county fixed effects instead of state fixed effects to account for
additional unobserved factors. The results are very similar to Panel A.
We also check if our results are driven by some specific regions. We find that urban
and rural areas did not respond differentially to the FNC exposure (Columns VI–VII of
Appendix Table 2). In addition, it was not driven by some particular state (Figure 2).
Figure 2: Results are Not Driven by a Particular State
Coefficients for Fox News Channel Position
AL AK
AZ AR
CA CO
CT DE
DC FL
GA HI
ID IL
IN IA
KS KY
LA ME
MD MA
MI MN
MS MO
MT NE
NV NH
NJ NM
NY NC
ND OH
OK OR
PA RI
SC SD
TN TX
UT VT
VA WA
WV WI
WY
-.01 -.008 -.006 -.004 -.002 0
Note: This figure reports on the point-estimate and 90th-percent confidence band that results when re-estimating the specification in
Column VII of Panel A of Table 1, dropping one state at a time. The (red) vertical line is the baseline point estimate. The results are
sorted top-to-bottom in alphabetical order, i.e., omit AL, then AK, then AZ, etc. Dropping Montana increases the coefficient the most.
Dropping Tennessee decreases the point-estimate the most.
An alternative way to define the start of people’s awareness of the policy recommen-
dation of social distancing is using states’ shelter-in-place orders rather than the national
emergency. Suppose that states where voters had been more exposed to FNC also voted
for the government that was later in issuing stay-at-home order. In addition, people fol-
low these state-level shelter-in-place orders. Then our effect can be explained by people
with more exposure to FNC decreasing their movement less because of the lagged timing
of shelter-in-place policies. We find similar results of FNC using the shelter-in-place order
17timings, suggesting that people are paying attention to both federal and state recommen-
dations and that the state order timings are not endogenous with respect to FNC channel
positions (Appendix Table 3).
4.3 Event Study Evidence
In the previous Section, we show results for non-dynamic specifications, where there
is only one coefficient estimate for the FNC exposure for all dates after national emer-
gency was announced. Alternatively, we allow separate point-estimates for weeks from
February 24th to April 14th as follows:
−1
X 4
X
SDi(s)t(w) = γl · F N CPi(s) · D(w = l) + γl · F N CPi(s) · D(w = l) +
l=−4
| {z } |l=0 {z } (2)
pre-event period post-event period
+Xi(s) Γ + λt(w) + µs + εi(s)t(w) ,
where SDi(s)t(w) is social-distancing outcome of county i in state s at date t in week w.
Week w = 0 is the week of March 13 to March 20. Week indices run from −4 to 4 and
represent the position of weeks relative to Week w = 0. D(w = l) is a dummy equal to one
if week w = l. Here, λt(w) are date fixed effects and µs are state fixed effects. Coefficients
γl with l ≥ 0 capture the FNC exposure effect in the post national emergency period, and
the ones with l < 0 capture pre-trends.
Figure 3 plots the resulting coefficients of Equation (2) for the specification without
controls (Panel A) and with the full set of controls (Panel B). The first noteworthy feature
is that neither specification exhibits pre-trends. There is an increase in the coefficient for
the week prior to March 13th; however, the point estimate is insignificant. We fail to
reject the joint F-test that the pre-event γl s are zero. This suggests that the exact timing of
the national emergency is not related to trends in social distancing in more-FNC-exposed
counties and that social distancing behaviour did not start to change before the national
emergency was announced.30
The second noteworthy feature is that while we do not observe any effect at the week
zero (γ0 ), four point estimates for four weeks after March 13th have almost the same mag-
nitude as the point estimate of βb2 from the baseline specification in Table 1. Thus the effect
is constant across all weeks and our baseline specification (1) captures the full time path
of the effect. Results also hold if we add county fixed effects (Appendix Figure 4, which is
30
These specifications correspond to Column I and Column VIII of Table 1. Point estimates for Figure 3
are reported in Appendix Table 4.
18Figure 3: Event Study Analysis: No Changes in Distanced Traveled Before Week 0 and
Large Reductions Afterwards
Panel A: Equation (2) with no controls
.015
.01
.005
0
-.005
-.01
-4 -3 -2 -1 0 1 2 3 4
Week
Size of the Coefficients
Panel B: Equation (2) with full set of controls
.02
.01
0
-.01
-.02
-4 -3 -2 -1 0 1 2 3 4
Week
Size of the Coefficients
Note: This Figure graphs the results of estimating equation (2) for specification (in Panel A of Table 1) without controls and with the full
set of controls. The former is corresponding to the specification in Column I of Table 1. The latter is corresponding to the specification
in Column VII of Table 1. Point estimates are reported in Appendix Table 4. P-values for the joint significance of the pre-trend’s
coefficients are equal to 0.4034 for Panel A and 0.4480 for Panel B. Following best practice, we bin the end-points, so that the fourth to
the fifth week before and after March 13th each share a coefficient (Borusyak and Jaravel 2016; Schmidheiny and Siegloch 2019). This
figure reports 90th-percent confidence bands.
19a similar specification to one in Panel D of Table 1), using week t = −1 as the baseline.
We also replicate similar event-study graphs for the shelter-at-home orders (see Ap-
pendix Figure 3). Here, each state had its own relative time as Week 0 started at the date
when the state issued the order. While we see negative effects of the FNC channel po-
sition in the post period, there are evident (while insignificant) downward pre-trends.
This suggests that people might have started to decrease their mobility after the national
emergency was announced but before their state officially ordered them to stay home.
4.4 Zip-Code-Level Results
Thanks to Facebook’s “Data for Good” project, we are able to investigate effect of slant
media on zip-code-level data for the subsample of 14 states and DC. Since the channel
positions are initially on the zip-code level, we decrease potential measurement error.
We first confirm that county-level social distancing measures using Facebook data are
highly correlated with measures using UNACAST data. Appendix Figure 5 shows the
residual plots of the regression of UNACAST’s changes in distance traveled on Facebook’s
distance traveled (Panel A) and Facebook’s probability of staying at home (Panel B). In
both graphs, the measures are strongly correlated. We also show that our baseline results
in Table 1 hold if we use county-level Facebook measures (Appendix Table 5).
Because Facebook’s data start on March 10th, we can’t estimate pre-trends as we did
in the baseline specification. In addition, instead of the changes in mobility, we observe
the levels of mobility in the Facebook data. Thus, we control for the pre-COVID mobility
more flexibly using the following equation:
Mj(s)t = βF N CPj(s) + φMj(s)t−45 + Xj(s) Γ + µs + λt + j(s)t , (3)
where Mj(s)t is the mobility measure of zip code j in state s and date t and Mj(s)t−45 is the
corresponding mobility measure in the 45 days before March 10. F N CPj(s) is the FNC
lineup position in zip-code j in state s. We again control for state and time fixed effects.
Vector Xj(s) now contains zip-code-level controls, including the number of Facebook bing
tiles covered, number of Facebook users, population, population density, number of hous-
ing units, and land area.
Here, we use two measures of mobility: (i) probability of staying at home (Panel A of
Table 2) and (ii) daily distance traveled (Panel B). In Panel A Column I, we only control
for baseline probability of staying at home, number of tiles, Facebook’s population, and
date fixed effects. FNC lineup position has positive effects on staying home: one standard
deviation increase in channel position results in a 0.1-percentage-point larger probability
20of staying at home. Columns II and III add controls for Facebook’s measure of population
density and state fixed effects. Column IV allows for state-and-date fixed effects. Finally,
Columns V–VII add controls for population, number of housing units, and land area. The
coefficient of interest remains unchanged and highly significant throughout all columns.
Table 2: Zip-Code-Level Evidence: More Fox News Exposure, Longer Distance Traveled,
and Smaller Probability of Staying at Home
I II III IV V VI VII
Panel A: Dependent variable: Probability staying at home
Fox News channel position 0.001*** 0.001*** 0.001*** 0.001*** 0.001*** 0.001*** 0.001***
(0.0003) (0.0003) (0.0003) (0.0003) (0.0003) (0.0003) (0.0003)
R-squared 0.909 0.914 0.915 0.924 0.924 0.924 0.925
Observations 85,511 83,004 83,004 83,004 83,004 83,004 83,004
Panel B: Dependent variable: Distance traveled
Fox News channel position -0.005 -0.005* -0.008** -0.007* -0.007* -0.008** -0.008**
(0.0032) (0.0031) (0.0037) (0.0037) (0.0038) (0.0038) (0.0037)
R-squared 0.921 0.924 0.926 0.943 0.943 0.943 0.944
Observations 84,818 82,311 82,311 82,311 82,311 82,311 82,311
Pre-COVID baseline Y
# tiles & Facebook population
FEs: Date
Population density
FEs: State
FEs: Date x state
Population
Housing units
Land area
Note: (a) The explanatory variable in both Panels is normalized to mean zero and standard deviation of one. All regressions include
date fixed effects, the number of tiles used to construct the dependent variable at date t, number of counties’ Facebook users, and the
baseline (pre-COVID) dependent variable constructed using corresponding tiles for date t. (c) In parentheses we report standard errors
clustered on zip-code level. *** pmedia can either help or hinder these practices. In this paper, we estimate the effect of ex-
posure to one popular media source (FNC) — that spread controversial partisan opinions
and some unscientific medical advice during the early days of the COVID-19 pandemic
— on mobility reduction and social distancing.
Using county-level mobility data from smartphone locations and the historical posi-
tion of Fox News Channel in the cable lineup, we show that increased exposure to Fox
News led to a smaller reduction in distance traveled and smaller increase in the probabil-
ity to stay home after the national emergency declaration in the United States. We find
that the results are not driven by the conservatism itself, measures as the Republican vote
share, but come from the COVID-19-related information conveyed by FNC and its poten-
tial interaction with the built-up conservative ideology. We also document that locations
more exposed to FNC experienced larger mortality rates from COVID-19 (Appendix Table
6), consistent with Bursztyn et al. (2020). This suggests that the FNC exposure can have
important public health consequences through behavioral responses.
Our findings are especially important in the era of increasing affective polarization
(Rogowski and Sutherland 2016 and Boxell, Gentzkow and Shapiro 2020). As Iyengar
et al. (2019) write:
Ordinary Americans increasingly dislike and distrust those from the other
party. Democrats and Republicans both say that the other party’s members
are hypocritical, selfish, and closed-minded, and they are unwilling to social-
ize across party lines.
In this highly-charged environment, any criticism of current Republican administra-
tion from their Democratic opponents is often perceived as not being done in good faith
regardless of its merits, triggering a defensive reaction from conservative media. None
other than FNC host Tucker Carlson explained, on March 10, 2020, the logic of some of
conservative politicians and media personalities:
Maybe they’re just not paying attention, or maybe they believe they’re serving
some higher cause by shading reality. ... Best not to say anything that might
help the other side.31
This alleged desire not to say anything that might help the other side may impact politics,
economic growth, and lives, which are all highly interconnected as we have witnessed in
the current COVID-19 pandemic and expect to see in its aftermath.
31
Foxnews.com: ”Tucker Carlson: The Coronavirus Will Get Worse...,” URL: foxnews.com/opinion/
tucker-carlson-the-coronavirus-will-get-worse-our-leaders-need-to-stop-lying-about-that.
22References
Adena, Maja, Ruben Enikolopov, Maria Petrova, Veronica Santarosa, and Ekaterina Zhuravskaya. 2015.
“Radio and the Rise of the Nazis in Prewar Germany.” The Quarterly Journal of Economics, 130(4): 1885–
1939.
Allcott, Hunt, Levi Boxell, Jacob Conway, Matthew Gentzkow, Michael Thaler, and David Y Yang. 2020.
“Polarization and public health: Partisan differences in social distancing during the Coronavirus pan-
demic.” w26946.
Anderson, Roy M, Hans Heesterbeek, Don Klinkenberg, and T Déirdre Hollingsworth. 2020. “How
will country-based mitigation measures influence the course of the COVID-19 epidemic?” The Lancet,
395(10228): 931–934.
Arceneaux, Kevin, Johanna Dunaway, Martin Johnson, and Ryan J Vander Wielen. 2020. “Strategic Can-
didate Entry and Congressional Elections in the Era of Fox News.” American Journal of Political Science,
64(2): 398–415.
Ash, Elliott, and Michael Poyker. 2019. “Conservative News Media and Criminal Justice: Evidence from
Exposure to Fox News Channel.” Columbia Business School Research Paper.
Athey, Susan, Billy Ferguson, Matthew Gentzkow, and Tobias Schmidt. 2019. “Experienced Segregation.”
Technical Report, Stanford University Working Paper.
Bailey, Michael, Rachel Cao, Theresa Kuchler, Johannes Stroebel, and Arlene Wong. 2018. “Social Con-
nectedness: Measurement, Determinants, and Effects.” Journal of Economic Perspectives, 32(3): 259–80.
Barwick, Panle Jia, Yanyan Liu, Eleonora Patacchini, and Qi Wu. 2019. “Information, Mobile Communica-
tion, and Referral Effects.” National Bureau of Economic Research Working Paper 25873.
Blumenstock, Joshua Evan, Guanghua Chi, and Xu Tan. 2019. “Migration and the value of social net-
works.”
Borusyak, Kirill, and Xavier Jaravel. 2016. “Revisiting Event Study Designs.” Working Paper.
Boxell, Levi, Matthew Gentzkow, and Jesse M Shapiro. 2020. “Cross-country trends in affective polariza-
tion.” National Bureau of Economic Research.
Brzezinski, Adam, Guido Deiana, Valentin Kecht, and David Van Dijcke. 2020. “The COVID-19 Pan-
demic: Government vs. Community Action Across the United States.” Covid Economics 7, 115–156.
Büchel, Konstantin, Diego Puga, Elisabet Viladecans-Marsal, and Maximilian von Ehrlich. 2019. “Calling
from the outside: The role of networks in residential mobility.”
Burbidge, John B, Lonnie Magee, and A Leslie Robb. 1988. “Alternative transformations to handle extreme
values of the dependent variable.” Journal of the American Statistical Association, 83(401): 123–127.
Bursztyn, Leonardo, Aakaash Rao, Christopher Roth, and David Yanagizawa-Drott. 2020. “Misinforma-
tion during a pandemic.” 2020-44.
Card, David, and Stefano DellaVigna. 2017. “What do editors maximize? Evidence from four leading
economics journals.” National Bureau of Economic Research.
DellaVigna, Stefano, and Ethan Kaplan. 2007. “The Fox News effect: Media bias and voting.” The Quarterly
Journal of Economics, 122(3): 1187–1234.
Dingel, Jonathan I, and Brent Neiman. 2020. “How many jobs can be done at home?” Covid Economics 1,
16–24.
Enikolopov, Ruben, Maria Petrova, and Ekaterina Zhuravskaya. 2011. “Media and political persuasion:
Evidence from Russia.” American Economic Review, 101(7): 3253–85.
23You can also read