Perils and Challenges of Social Media and Election Manipulation Analysis: The 2018 US Midterms - arXiv
←
→
Page content transcription
If your browser does not render page correctly, please read the page content below
Perils and Challenges of Social Media and Election
                                                             Manipulation Analysis: The 2018 US Midterms
                                                                                Ashok Deb                                                                        Luca Luceri*
                                                                USC Information Sciences Institute                                         University of Applied Sciences and Arts of Southern
                                                                      Marina del Rey, CA                                                           Switzerland, and University of Bern
                                                                         ashok@isi.edu                                                                     Manno, Switzerland
                                                                                                                                                          luca.luceri@supsi.ch

                                                                            Adam Badaway                                                                        Emilio Ferrara
                                                               USC Information Sciences Institute                                                    USC Information Sciences Institute
arXiv:1902.00043v1 [cs.SI] 31 Jan 2019

                                                                     Marina del Rey, CA                                                                    Marina del Rey, CA
                                                                       badawy@isi.edu                                                                       emiliofe@usc.edu
                                         ABSTRACT                                                                                        ACM Reference Format:
                                         One of the hallmarks of a free and fair society is the ability to conduct                       Ashok Deb, Luca Luceri, Adam Badaway, and Emilio Ferrara. 2019. Perils
                                                                                                                                         and Challenges of Social Media and Election Manipulation Analysis: The
                                         a peaceful and seamless transfer of power from one leader to another.
                                                                                                                                         2018 US Midterms. In The Web Conference ’19: Data Science for Social
                                         Democratically, this is measured in a citizen population’s trust in the                         Good Workshop, May 14, 2019, San Francisco, CA. ACM, New York, NY,
                                         electoral system of choosing a representative government. In view of                            USA, 10 pages. https://doi.org/10.1145/1122445.1122456
                                         the well documented issues of the 2016 US Presidential election, we
                                         conducted an in-depth analysis of the 2018 US Midterm elections
                                         looking specifically for voter fraud or suppression. The Midterm                                INTRODUCTION
                                         election occurs in the middle of a 4 year presidential term. For the                            Inherent bias of drawing conclusions from political polls stretch
                                         2018 midterms, 35 Senators and all the 435 seats in the House of                                back to the famous headline of "Dewey Defeats Truman" in the
                                         Representatives were up for re-election, thus, every congressional                              1948 US Presidential election [43]. Confounding factors that led to
                                         district and practically every state had a federal election. In order                           false conclusions in the 1948 election included telephone surveys
                                         to collect election related tweets, we analyzed Twitter during the                              which did not use robust statistical methods and an under-sampling
                                         month prior to, and the two weeks following, the November 6, 2018                               of Truman supporters. Likewise, in 2016, many political pundits
                                         election day. In a targeted analysis to detect statistical anomalies or                         underestimated the likelihood that Donald Trump would be elected
                                         election interference, we identified several biases that can lead to                            as President of the United States. The research community demon-
                                         wrong conclusions. Specifically, we looked for divergence between                               strated a strong interest in studying social media to get a better
                                         actual voting outcomes and instances of the #ivoted hashtag on the                              understanding of how the 2016 events unfolded. Numerous studies
                                         election day. This analysis highlighted three states of concern: New                            concluded that social media can be a vehicle for political manipula-
                                         York, California, and Texas. We repeated our analysis discarding                                tion, citing factors such as the effect of fake news and disinforma-
                                         malicious accounts, such as social bots. Upon further inspection and                            tion [5, 9, 28, 29, 33, 46, 49, 51, 55], bots [7, 8, 41, 50, 53, 58, 59],
                                         against a backdrop of collected general election-related tweets, we                             polarization [3, 6], etc.
                                         identified some confounding factors, such as population bias, or bot                               Research also suggests that social media data comes with sig-
                                         and political ideology inference, that can lead to false conclusions.                           nificant biases that limit the ability to forecast offline events, e.g.,
                                         We conclude by providing an in-depth discussion of the perils and                               the outcomes of political elections [22–26, 38], or public health
                                         challenges of using social media data to explore questions about                                issues [2, 36, 57]. Despite these well documented issues and chal-
                                         election manipulation.                                                                          lenges, social media are frequently relied upon and referred to as a
                                                                                                                                         trusted source of information to speculate about, or try to explain,
                                         KEYWORDS                                                                                        offline events. One such example is the recent 2018 US Midterm
                                         social media, political elections, data science for society                                     elections where widespread claims of voter fraud and voter suppres-
                                                                                                                                         sion appeared in the news, often based on social media reports and
                                         * Also   with USC Information Sciences Institute.                                               accounts.
                                                                                                                                            In this paper, we seek to understand whether it is possible to
                                         Permission to make digital or hard copies of all or part of this work for personal or
                                         classroom use is granted without fee provided that copies are not made or distributed           use Twitter as a sensor to estimate the expected amount of votes
                                         for profit or commercial advantage and that copies bear this notice and the full citation       generated by each state. We propose an undertaking in which we
                                         on the first page. Copyrights for components of this work owned by others than the              use the tweets with the hashtag #ivoted on the election day as a
                                         author(s) must be honored. Abstracting with credit is permitted. To copy otherwise, or
                                         republish, to post on servers or to redistribute to lists, requires prior specific permission   proxy for actual votes. At first, this seemed like a promising research
                                         and/or a fee. Request permissions from permissions@acm.org.                                     direction, as tweet volumes and vote counts correlated well for 47 of
                                         The Web Conference ’19, May 14, 2019, San Francisco, CA                                         the 50 states in America. We also considered if this would be a useful
                                         © 2019 Copyright held by the owner/author(s). Publication rights licensed to ACM.
                                         ACM ISBN 978-1-4503-9999-9/18/06. . . $15.00                                                    approach to detecting voting issues like fraud or suppression, for
                                         https://doi.org/10.1145/1122445.1122456                                                         example by isolating statistical anomalies in estimated and observed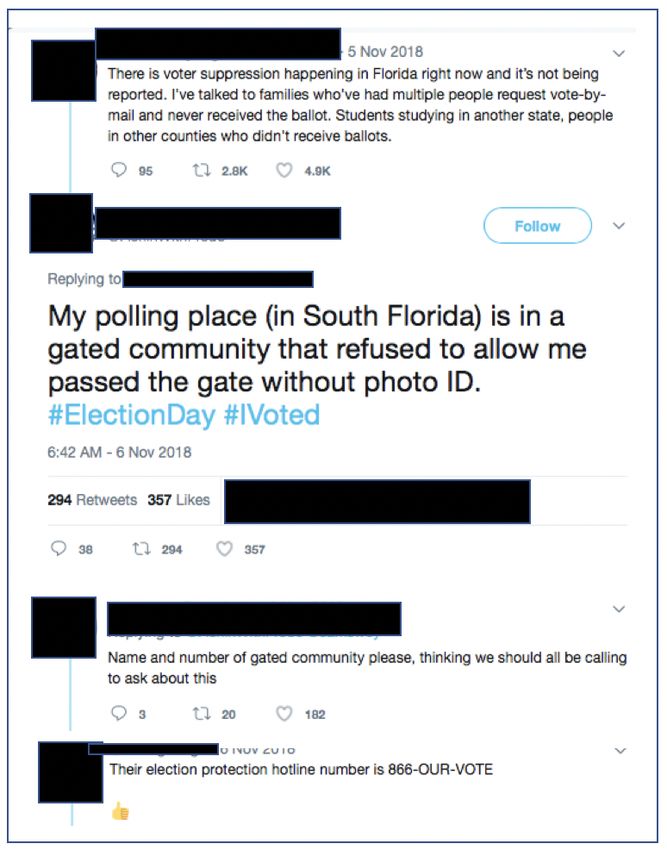
The Web Conference ’19, May 14, 2019, San Francisco, CA                                         A. Deb, L. Luceri, A. Badaway, and E. Ferrara

volumes. To get a sense of expected tweet volume, we carried out                    Table 1: US Senate Seats Up for Election in 2018
the same analysis against general keywords related to the midterm
election from a month before election day through two weeks after                        Incumbent                  State    Party     Status
the election. We also considered how bots may have had an influence                      Tammy Baldwin               WI       D        Contested
on election manipulation narratives by measuring their activity in                       John Barraso               WY        R        Safe
                                                                                         Sherrod Brown               OH       D        Contested
the social media discourse. We finally applied a political ideology
                                                                                         Maria Cantrell             WA        D        Safe
inference technique and tested it to see how well it compared to an
                                                                                         Ben Cardin                 MD        D        Safe
external source of polls data.                                                           Tom Carper                  DE       D        Safe
   The conclusions from our analysis are complex, and this work                          Bob Casey                   PA       D        Safe
is meant as a note of caution about the risks of using social media                      Bob Corker                  TN       R        Retiring
analysis to infer political election manipulation such as voter fraud                    Ted Cruz                    TX       R        Contested
and voter suppression.                                                                   Joe Donnelly                IN       D        Contested
                                                                                         Dianne Feinstein            CA       D        Safe
Contributions of this work                                                               Deb Fischer                 NE       R        Safe
                                                                                         Jeff Flake                  AZ       R        Retiring
After exploring multiple Twitter data sets and two external sources                      Kirsten Gillibrand          NY       D        Safe
(vote counts and Gallup), we came to the following contributions:                        Orrin Hatch                 UT       R        Retiring
    • We explored how social media analysis carries a lot of risks                       Martin Heinrich            NM        D        Safe
      involved mainly with population bias, data collection bias,                        Heidi Heitkamp              ND       D        Contested
                                                                                         Dean Heller                 NV       R        Contested
      lack of location-specific data, separation of bots (and orga-
                                                                                         Mazie Hirono                HI       D        Safe
      nizations) from humans, information verification and fact-
                                                                                         Cindy Hyde-Smith           MS        R        Contested
      checking, and lastly assigning political ideology.                                 Tim Kaine                   VA       D        Safe
    • We saw a significant difference in the removal of retweets in                      Angus King                 ME         I       Safe
      our analysis as compared with including them. However, the                         Amy Klobuchar              MN        D        Safe
      effect was isolated to one particular state, Texas, indicating                     Joe Manchin                WV        D        Contested
      that the sensitivity of this effect could be a factor of location.                 Claire McCaskill           MO        D        Contested
    • There is a significant difference between people’s reported                        Bob Menendez                NJ       D        Contested
      political ideologies using a source like Gallup versus that                        Chris Murphy                CT       D        Safe
      can be inferred on social media. It is not possible to know                        Bill Nelson                 FL       D        Contested
                                                                                         Bernie Sanders              VT        I       Safe
      if this is due to limitations of political inference algorithms,
                                                                                         Tina Smith                 MN        D        Contested
      confounders, population representation biases, or else.
                                                                                         Debbie Stabenow             MI       D        Safe
    • In the two states (NY & TX) where there was a statistically                        Jon Tester                 MT        D        Contested
      significant discrepancy between vote counts and instances                          Elizabeth Warren           MA        D        Safe
      of self-reported voting via #ivoted hashtags, we found only                        Sheldon Whitehouse          RI       D        Safe
      limited anecdotal evidence of tweets reporting issues of voter                     Roger Wicker               MS        R        Safe
      fraud or suppression. The divergence can possibly be ex-
      plained by confounding factors, locality and selection bias, or
      social influence of particular candidates in those states (e.g.,     RELATED WORK
      Alexandria Ocasio-Cortez in NY and Beto O’Rourke in TX).             Since the 2016 US Presidential election, there has been a big spot-
                                                                           light on the sovereignty of the US election system. The Bot Disclo-
BACKGROUND                                                                 sure and Accountability Act of 20181 gave clear guidelines for what
The US Midterm elections were held on 6 November, 2018. They are           has to be disclosed by social media companies. The article The Rise
referred to as mid-term elections because they occur in the middle         of Social Bots [18] brought awareness to the issue of social bots in
of a presidential term. Senators serve for 6 years, thus, every 2 years,   social media platforms. In [7], Bessi & Ferrara focused on social
nearly a third of the Senators are up for re-election. The Senate is       bots detection within the online discussion related to the 2016 presi-
divided into 3 classes, depending on which year they were elected.         dential election. Other than characterizing the behavioral differences
Class I was elected in 2012 and are up for re-election in 2018.            between humans and bots, there was not an in-depth analysis of any
   For 2018, 35 Senators out of a total of 100 senators in the 115th       malicious intent. In this paper, we address the potential malicious
Congress will be up for re-election. Of the 35 senators up for election,   activity in online political discussion along the lines of voter fraud,
33 are in Senate Class I and two are Senators who vacated, whereas         voter suppression, political misinformation, and then report on the
15 are in what is to be considered contentious races. The 33 Class I       biases we found.
are 30 (23 Democrats (D), 5 Republicans (R), 2 Independents (I))
up for re-election and 3 Republicans (R) who are retiring. Details         Voting Issues
on the Senate seats up for re-election are in Table 1. Additionally,       Concerns related to voter fraud took center stage after the 2000
all 535 House of Representative seats are up for re-election every 2       US Presidential election, where it was argued that the candidate
years. Excluded from our analysis are the non-voting delegates for
DC and the US Territories.                                                 1 https://www.congress.gov/bill/115th-congress/senate-bill/3127/text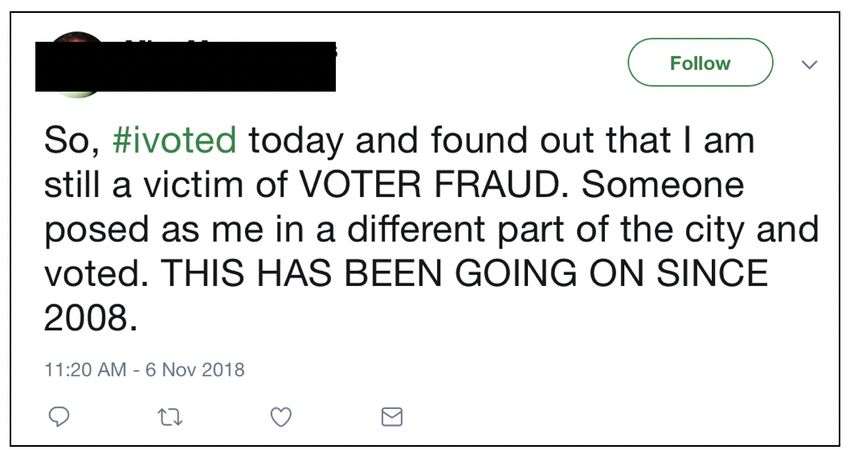
Perils and Challenges of Social Media and Election Manipulation             The Web Conference ’19, May 14, 2019, San Francisco, CA

with the most votes lost and the Supreme Court decided the winner          areas [40]. Biases in the representation of gender [47], ethnicity [11],
[39]. Since then, a host of public debate, congressional testimony,        and other sources of distortions [13] can also potentially affect the
and several new laws passed, such as the Help America Vote Act             inference of political ideology.
[34], which surprisingly needed to happened after the National Voter
Registration Act of 1993 (NVRA).2 The effects of the NVRA were             DATA
researched by Highton and Wolfinger [32], who concluded that               In this study, we examine different data sources to investigate and
provisions in the NVRA would increase voter turnout by 4.7%-8.7%           explore the risk of using social media in the context of political
and that purging voter rolls of those who had not voted in the last        election manipulation.
two years would have a 2% effect. Lastly, they identified the two             We used Twitter as a sensor to estimate the expected amount of
most vulnerable non-voting groups to be those under the age of 30          votes generated by each state. For this purpose, we carried out two
and those who moved within 2 years of an election [32].                    data collections. In the first one, we gathered the tweets with the
   Moreover, it has been argued that the current US voter registra-        hashtag #ivoted on election day. The second collection aimed to
tion has a minimal impact on registration and that there is marginal       enlarge the spectrum to a longer period of time exploiting a variety
value in any updated laws [31]. Therefore, the main concern argued         of general keywords, related to the midterm election, to collect the
by both parties is voter suppression [56]. Specifically, due to re-        tweets. As a basis for comparison, we employ two external sources.
cent voter identification laws, there is an increased chance of voter      The United States Election Project is used to unveil the amount of
suppression [30]. However, in this work we seek to find instances          voters in each state, while Gallup to have an estimate of the political
of voter suppression from an online social media analysis. To our          polarization both at the country level and at the state level. By means
knowledge, this has not been done before.                                  of these three data sources, we assembled five data sets (DS1-DS5),
                                                                           which will be analyzed in turn in the following subsections.
Political Manipulation
Social media serve as convenient platforms for people to connect and       DS1: #ivoted Dataset. The #ivoted Dataset (DS1) gathers the
to exchange ideas. However, social media networks like Twitter and         tweets with the hashtag #ivoted generated on the day of the election,
Facebook can be used for malicious purposes [17]. Especially in the        November 6, 2018. It should be noticed that #ivoted was promoted by
context of political discussion, there is a significant risk of mass ma-   Twitter and Instagram—which typically affects the hashtag spread
nipulation of public opinion. Concerning the ongoing investigation         [19, 54]—to encourage citizens to participate in the midterm elec-
of Russian meddling in the 2016 US Presidential election, Badawy           tions and increase the voter turnout. We used the Python module
et al. [4] studied political manipulation by analyzing the released        Twyton to collect tweets through the Twitter Streaming API3 during
Russian troll accounts on Twitter. After using label propagation to        election day. The data collection time window ranged from 6 a.m.
assign political ideology, they found that Conservatives retweeted         EST on November 6 (when the first polling station opened) to 1 a.m.
Russian trolls over 30 times more than Liberals and produced 36            HST on November 7 (2 hours after the last polling station closed).
times more tweets. More recently, Stella et al. [52] highlighted how       Overall, we collected 249,106 tweets. As a sanity check, we queried
bots can play significant roles in targeting influential humans to         the OSoMe API provided by Indiana University [14]. OSoMe tracks
manipulate online discussion thus increasing in-fighting. Especially       the Twitter Decahose, a pseudo-random 10% sample of the stream,
for the spread of fake news, various studies showed how political          and therefore can provide an estimate of the total volume: OSoME
leaning [1], age [28], and education [49] can greatly affect fake news     contains 29.7K tweets with the #ivoted hashtag posted by 27.2K
spread, alongside with other mechanisms that leverage emotions             users—it is worth noting that trending topics are typically slightly
[20, 21] and cognitive limits [44, 45]. Additionally, Dutt et al. [16]     over-represented in the Twitter Decahose [14, 42]—by extrapolation,
showed how foreign actors can more so than just backing one candi-         this would suggest an estimated upper bound of the total volume at
date or the other, often manipulate social media for the purpose of        around 300K tweets. In addition, on election day, Twitter reported
sowing discord.                                                            that the hashtag #ivoted was trending with over 200K tweets (cf.
                                                                           Fig. 1). Having collected 249K such tweets, we can conclude that
Bias                                                                       we have at our disposal a nearly complete #ivoted sample dataset.
Besides manipulation, other potential problems may affect data             DS2 & DS3: General Midterm Dataset. In the General Midterm
originating from online social systems. Selection bias is one such         Dataset, we collect tweets on a broader set of keywords. Further,
example. Concisely, this bias yields a statistically non-representative    we consider two different time windows for the data collection. The
sample of the true population. A main concern outlined by Ruths            rationale behind these choices is to evaluate the sensitivity of our
and Pfeffer [48], and to a lesser degree by Malik et al. [37], is that     study against a different, but correlated, set of data. In other words,
social media samples are not representative of the whole voting            the main purpose is to detect whether any divergence arose with
population because users self-select to participate on the platform        the #ivoted Dataset analysis or, on the other hand, to inspect the
and in specific online discussions. Each social media platform has         consistency of the results in different settings.
its own set of biases. Mislove et al. [40] looked specifically at the          Tweets were collected by using the following keywords as a
Twitter population from a location, gender, and ethnicity viewpoint.       filter: 2018midtermelections, 2018midterms, elections, midterm, and
From a location perspective, they found underrepresented counties          midtermelections. We distinguish two data sets according to their
in the Mid-West and over-represented counties in highly dense urban
                                                                           3 Please note that we utilize the same approach for every Twitter data collection discussed
2 https://www.justice.gov/crt/about-national-voter-registration-act        in this work.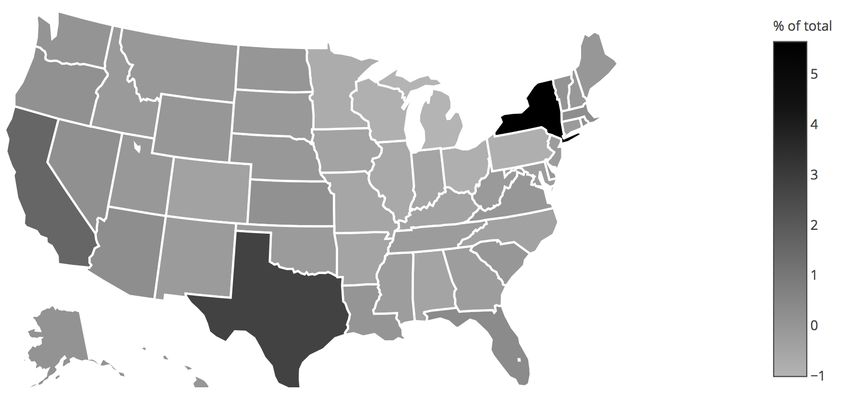
The Web Conference ’19, May 14, 2019, San Francisco, CA                                         A. Deb, L. Luceri, A. Badaway, and E. Ferrara

                                                                                                    Table 2: Datasets Statistics

                                                                                          Statistic           DS1       DS2        DS3
                                                                                          # of Tweets        90,763    20,450    452,288
                                                                                          # of Retweets      146,546   54,866   1,869,313
                                                                                          # of Replies       11,797     6,730    267,973
                                                                                          # of Authors       174,854   72,022    977,996
                                                                                          # of Users         178,503   77,749    997,406
                                                                          have been captured by accidental duplicate queries to the Twitter
                                                                          API. Then, we excluded from our analysis all the tweets not written
                                                                          in English language. Despite the majority of the tweets were in
                                                                          English, and to a very lesser degree in Spanish (3,177 tweets), we
                                                                          identified about 59 languages in the collected tweets. Finally, we
                                                                          inspected tweets from other countries and removed them as they
                                                                          were out of the context of this study. In particular, we filtered out
                                                                          tweets related to the Cameroon election (October 7, 2018), to the
                                                                          Democratic Republic of the Congo presidential election (December
                                                                          23, 2018), to the Biafra call for Independence (#biafra, #IPOB), to
                                                                          democracy in Kenya (#democracyKE), to the two major political
                                                                          parties in India (BJP and UPA), and to college midterm exams.
Figure 1: Screen shot of the United States trends on election day            Overall, we count for almost 3 millions tweets distributed over
showing the #ivoted hashtag trending with 200K tweets.                    the three Twitter data sets (DS1-DS3). In Table 2, we report some
                                                                          aggregate statistics. It should be noticed that the number of authors is
temporal extent. In DS2, we consider only tweets generated on the
                                                                          lower than the number of users, which in turn also includes accounts
election day with exactly the same time window used for DS1. The
                                                                          that got a retweet (or reply) of a tweet that was not captured in our
third data set (DS3) provides a view of the political discussion from
                                                                          collection and, thus, they do not appear as authors.
a wide-angle lens. It includes tweets from the month prior (October
6, 2018) to two weeks after (November 19, 2018) the day of the
                                                                          METHODOLOGY
election. We kept the collection running after the election day as
several races remained unresolved. As a result, DS3 consists of 2.7       State Identification
million tweets, whose IDs are publicly available for download.4           The usage of geo-tagged tweets to assign a state to each user has been
                                                                          shown to not be effective, being the fraction of geo-tagged tweets
DS4: Actual Voting Data. The first external data source used as a
                                                                          around 0.5% [12]. The location of the data is of utmost importance,
basis of comparison is made available by the United States Election
                                                                          especially at the state and local level. However, less than 1% of the
Project. They report on their website5 the expected voter turnout
                                                                          collected tweets have been geo-tagged. Nevertheless, we aim to map
per state, along with the (official or certified) information source
                                                                          as many users as possible to a US state, to conduct a state by state
and other statistics about voters. The data (DS4) we use in this work
                                                                          comparison. For this purpose, we leveraged tweet metadata, which
was assessed on November 18, 2018, and reflects a voter turnout of
                                                                          may include the self-reported user profile location. The location
116,241,100 citizens, which is aligned with other reported counts.
                                                                          entry is a user-generated string (up to 100 characters), and it is
DS5: Party Affiliation Data. To have an assessment of the political       pulled from the user profile metadata for every tweet. From this field,
party affiliation across the country, we make use of an evaluation pro-   we first search for the two-letter capitalized state codes, followed by
vided by Gallup, through the Gallup Daily tracking survey, a system       the full name of the state. Our analysis does not include Washington,
which continuously monitors Americans’ attitudes and behaviors.6          D.C., so we have to ensure anything initially labeled Washington
The data set (DS5), collected on January 22, 2019, depicts the politi-    does not include any variant of DC. Using this string-search method,
cal leaning over a sample size of 180,106 citizens. In particular, the    we managed to assign a state to approximately 50% of the tweets
data shows the percentage of Democratic and Republican population         and 30% of the users. Some users had multiple states over their tweet
in each state and over the entire country. Gallup’s evaluation shows      history, thus, we only used the most common reported state. A few
that, at the national level, there exists a democratic advantage (7%),    users often switched their location from a state name to something
as 45% of the population is assessed as democratic leaning while          else: for example, one user went from New York, NY to Vote Blue!—
38% is estimated as republican.                                           for such users, we kept the valid state location.

Data Pre-processing                                                       Bot Detection
Data pre-processing involved only Twitter data sets and consisted of      Bot detection has received ample attention [18] and increasingly
three main steps. First, we removed any duplicate tweet, which may        sophisticated techniques keep emerging [35]. In this study, we re-
                                                                          strict our bot detection analysis to the use of the widely popular
4 https://github.com/A-Deb/midterms
5 http://www.electproject.org/2018g
                                                                          Botometer,7 developed by Indiana University. The underpinnings of
6 https://www.gallup.com/174155/gallup-daily-tracking-methodology.aspx    7 https://botometer.iuni.iu.edu/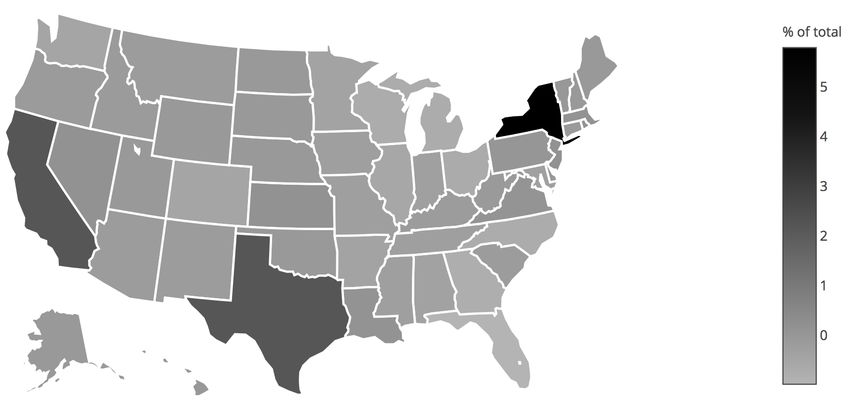
Perils and Challenges of Social Media and Election Manipulation                The Web Conference ’19, May 14, 2019, San Francisco, CA

                                                                                                           no. tweets from State i
                                                                                                ST R(i) = Í50                                     (1)
                                                                                                           j no. tweets from State j
                                                                                 For the actual voter data (DS4), we perform a similar metric to
                                                                              determine the State Vote Rate (SVR) of each state i as

                                                                                                            no. votes from State i
                                                                                                 SV R(i) = Í50                                    (2)
                                                                                                            j no. votes from State j
                                                                                 We then calculate the difference δ (i) for each state i. Here it is
                                                                              important to note that any positive value indicates more tweets than
                                                                              votes, as a percentage, and vice versa:
                                                                                                         δ (i) = ST R(i) − SV R(i)                (3)
                                                                                 Lastly, we convert the difference into standard deviations s(i)
                                                                              (stdevs) by dividing δ (i) by the standard deviation of all differences:
                  Figure 2: Bot Score Distribution                                                                  δ (i)
                                                                                                        s(i) = q Í                                 (4)
the system were first published in [15, 53] and further revised in [59].                                                 (δ (i)−δ )
                                                                                                                           50
Botometer is based on an ensemble classifier [10] fed by over 1,000
features related to the Twitter account under analysis and extracted             being δ the average difference over all states. We then inspect the
through the Twitter API. Botometer aims to provide an indicator,              results for any anomalous state i whose standard deviation |s(i)| ≥ 2.
namely bot score, that is used to classify an account either as a bot or      States beyond two standard deviations are worth further inspection.
as a human. The lower the bot score, the higher the probability that
the user is not an automated and/or controlled account. In this study         Political Ideology Inference
we use version v3 of Botometer, which brings some innovations and             We classify users by their ideology based on the political leaning of
important detailed in [59]—e.g., the bot scores are now rescaled and          the media outlets they share. We use lists of partisan media outlets
not centered around 0.5 anymore.                                              compiled by third-party organizations, such as AllSides8 and Media
   In Figure 2, we depict the bot score distribution of the 1,131,540         Bias/Fact Check.9 We combine liberal and liberal-center media
distinct users in our datasets. The distribution exhibits a right skew:       outlets into one list and conservative and conservative-center into
most of the probability mass is in the range [0, 0.2] and some peaks          another. The combined list includes 641 liberal and 398 conservative
can be noticed around 0.3. Prior studies used the 0.5 threshold to            outlets. However, in order to cross reference these media URLs with
separate humans from bots. However, according to the re-calibration           the URLs in the Twitter dataset, we need to get the expanded URLs
introduced in the latest version of Botometer [59], along with the            for most of the links in the dataset, since most of them are shortened.
emergence of increasingly more sophisticated bots, we here lower              As this process is quite time-consuming, we get the top 5,000 URLs
the bot score threshold to 0.3 (i.e., a user is labeled as a bot if the bot   by popularity and then retrieve the long version for those. These
score is above 0.3). This threshold corresponds to the same level of          top 5,000 URLs account for more than 254K, or more than 1/3 of
sensitivity setting of 0.5 in prior versions of Botometer (cf. Fig 5 in       all the URLs in the dataset. After cross-referencing the 5,000 long
[59]). In both DS1 and DS3, 21.1% of the users have been classified           URLs with the media URLs, we observe that 32,115 tweets in the
as bots, while in DS2 the percentage achieves the 22.9% of the users.         dataset contain a URL that points to one of the liberal media outlets
Finally, 19.5% of the 295,352 users for which a State was identified          and 25,273 tweets with a URL pointing to one of the conservative
have been scored as bots.                                                     media outlets. We use a polarity rule to label Twitter users as liberal
   Overall, Botometer did not return a score for 42,904 accounts,             or conservative depending on the number of tweets they produce
which corresponds to 3.8% of the users. To further examine this               with links to liberal or conservative sources. In other words, if a user
subset of users, we make use of the Twitter API. Interestingly, 99% of        has more tweets with URLs to liberal sources, he/she is labeled as
these accounts were suspended by Twitter, whereas the remaining 1%            liberal and vice versa. Although the overwhelming majority of users
were protected (by privacy settings). For the users with an assigned          include URLs that are either liberal or conservative, we remove any
location, only 1,033 accounts did not get a Botometer score. For              user that has equal number of tweets from each side. Our final set of
those users, we assume that the accounts suspended (1,019) are bots           labeled users includes 38,920 users.
and the private accounts (14) are humans.                                        To classify the remaining accounts as liberal or conservative, we
                                                                              use label propagation, similar to prior work [4]. For this purpose,
Statistical Vote Comparison                                                   we construct a retweet network, containing nodes (Twitter users)
Once the states have been identified and the bots detected, we com-           with a direct link between them if one user retweet a post of another.
pared the distribution of our various Twitter datasets (DS1, DS2, and         To validate results of the label propagation algorithm, we apply
DS3) with our control data in DS4 and DS5. To do this, we start by            stratified cross (5-fold) validation to a set of more than 38,920 seeds.
counting the number of tweets per state and dividing it by the total          We train the algorithm on 4/5 of the seed list and see how it performs
number of tweets across all states. We denote this fractional share in        8 https://www.allsides.com/media-bias/media-bias-ratings

terms of tweets as State Tweet Rate (STR), for each state i as                9 https://mediabiasfactcheck.com/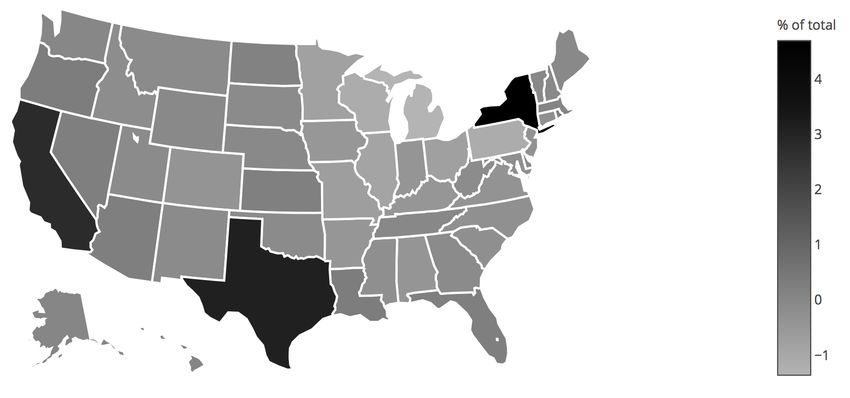
The Web Conference ’19, May 14, 2019, San Francisco, CA                                     A. Deb, L. Luceri, A. Badaway, and E. Ferrara

                                                                           RESULTS
                                                                           #ivoted (DS1) Statistical Analysis
                                                                           There were 249,106 tweets in the #ivoted data set, of those we could
                                                                           map a state location for 78,162 unique authors. Once we remove
                                                                           the 15,856 bots (using a bot threshold score of 0.3), we have 62,306
                                                                           remaining authors of tweets and retweets. After applying the method
                                                                           described in Statistical Vote Comparison section, we see that three
                                                                           states show an anomalous behavior from the remaining 47 states.
                                                                           Figure 4a shows how New York is 5.8 standard deviations greater
                                                                           than the mean difference between the #ivoted percentage and the
                                                                           actual voting percentage. Furthermore, both California and Texas
                                                                           have a stdev 2.2 greater than the mean. This would lead to believe
                                                                           that if there was voter suppression, it would most likely be in these
                                                                           three states, as they exhibit significantly more self-reported voting
                                                                           tweets than vote counts.
                                                                              However, since our data set has both tweets and retweets, to check
                                                                           the sensitivity of our findings, we repeated our analysis without the
                                                                           retweets. Once removed, the 34,754 remaining tweets, again without
                                                                           bots, we noticed something interesting. Not only did Texas drop
                                                                           from 2.2 stdevs to 0.4 stdevs, but New York increased from 5.8
                                                                           stdevs to 6.3 stdevs. This highlights the sensitivity our this type of
                                                                           analysis to location-specific factors such as state, and information
                                                                           dynamic factors such as retweet filtering. Further inspection showed
                                                                           that 62.2% of the tweet activity in Texas (in the #ivoted data set) was
                                                                           based on retweets, highlighting how this class of tweet can produce
                                                                           different results for some populations, and similar ones for others,
                                                                           since the average across the states stayed at 0 (e.g., see Figure 4b).

                                                                           General Midterm (DS2&DS3) Statistical Analysis
                                                                           We carried out the same analysis against the general keywords data
                                                                           set both on election day (DS2) and for a month before to two weeks
                                                                           after the election (DS3).
                                                                              In DS2, we have 72,022 users, from which we filtered out 16,859
                                                                           bots (using a bot threshold of 0.3). From the remaining 55,163
                                                                           authors, we were able to map a state for 26,081 users. Performing
                                                                           the same comparative analysis from before, we found the same
                                                                           anomalies in the same three states: CA (1.6 stdev), TX (2.8 stdev),
                                                                           and NY (5.6 stdev). Visually, this can be appreciated in Figure
                                                                           4c. Expanding the analysis to DS3, we removed 206,831 users, as
                                                                           classified as bots, from the set of 977,966 authors. This left us with
                                                                           771,135 users from which we could identify a state for 295,705 of
                                                                           them. The statistical analysis revealed the same outliers also in this
                                                                           data set: CA (2.8 stdev), TX (3.1 stdev), and NY (4.7 stdev), as can
                                                                           been seen in Figure 4d.

Figure 3: Political ideology difference, in terms of percentage of
                                                                           Bot Sensitivity
liberals vs. conservatives, between DS5 and DS3                            Next, we investigate whether discarding malicious accounts, such
                                                                           as social bots, from the set of users may have affected the findings
on the remaining 1/5. Both precision and recall scores are around          above. Table 4 shows the number (and percentage) of bots and
0.89. Since we combine liberal and liberal-center into one list (same      humans per state in DS3. The list of states is sorted (in descending
for conservatives), we can see that the algorithm is not only labeling     order) according to the percentage of bots, while the horizontal line
the far liberal or conservative correctly, which is a relatively easier    separates the states with a bots percentage above and below the
task, but it is performing well on the liberal/conservative center as      average (20.3%). Note in particular that all the three outliers (in
well. Overall, we find that the liberal users population is almost three   bold) have values below the average. However, the distribution of
times larger the conservative counterpart (73% vs. 27%).                   bot prevalence per state varies greatly and it should be analyzed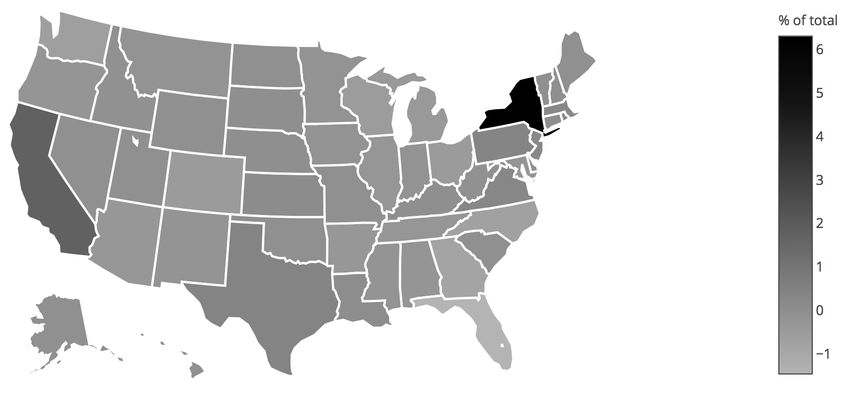
Perils and Challenges of Social Media and Election Manipulation                The Web Conference ’19, May 14, 2019, San Francisco, CA

                      (a) #ivoted vs. Actual Votes                                             (b) #ivoted (w/o RTs) vs. Actual Votes

                   (c) General (election) vs. Actual Votes                                    (d) General (overall) vs. Actual Votes

                                         Figure 4: Various datasets versus Actual Votes (DS4) all without bots
taking into account both the state population size and the number             almost three times larger than the conservative one, as we stated in
of Twitter users per state. Highly populated states like California,          Political Ideology section.
Texas, and New York, have large sheer numbers of bots but low                    Additionally, we took our political ideology labels by state and
proportional bot percentage. This should be taken into account when           compared with DS5, the Gallup poll survey. As mentioned before,
drawing conclusions from this analysis. On the other side, this topic         the political ideology inference assigned 73% liberal labels and
opens the way to further discussions about bots association with a            27% conservative labels to the nation at a whole. That compares
given state. One could make the argument that if the account was              with Gallup reporting of 45% to 38% for the Nation as a whole.
identified as a bot, there is no point to assigning it to a state. However,   At the state level, we ran a comparison to see the difference in
the fact that automated accounts declare a location in their profile          our assessment of political leaning of a state versus Gallup’s. For
can be viewed as a malicious strategy to embed in the social system           example, Alabama is 35% liberal and 50% conservative, according to
thus, it should be prudently examined.                                        Gallup, giving the state a marked Republican advantage. However, in
   For these reasons, we repeated our analysis including social bots          Twitter we observed 42% Liberal and 31% Conservative user labels,
in the users set. Results with or without bots are substantially un-          which may suggest the opposite trend. Figure 3 shows the difference
changed. In the interest of space, we do not duplicate the maps               between the Gallup poll and our analysis. For Alabama going from
shown in Figure 4, but the same anomalies are revealed if bots are            a Republican advantage of 15% (Gallup) to a Democratic advantage
retained. It should be noticed that also for the #ivoted dataset (DS1),       of 11% (Twitter) would imply a shift of 26 percent points toward the
the percentage of bots in the three outlier states are below the average      liberal side. Overall, every state showed movement toward the left, as
(21.0%), NY (16.0%), CA (19.4%) and TX (20.2%), respectively.                 low as a few percent points and as high as over 60% difference. This
                                                                              corroborates the suspect that left-leaning users are over-represented
                                                                              in our data.
Political Ideology Analysis
Next we examine what topics talk about and how they address politi-
cally charged topics. Table 3 shows the top 10 hashtags discussed             Voting Issues
respectively by humans and bots, for both liberal and conservative            New York was the state that exhibited the strongest statistical anom-
ideologies. The hashtags have been colored to show the common                 aly. Thus, we conducted a manual inspection reading all tweets
topics between bots and humans for each political wing. The amount            originating from there. We found no red flags, but we isolated a few
of overlap between bots and humans hashtags is noticeable. This is            tweets of interest. The first one is in Figure 5 and it is from a user
likely the reason why the removal of bots from the analyzed accounts          who was classified as a human and from inspection of the account
did not have any significant impact on our outcome. To carefully              shown to live in New York. The user mentions some important issues:
interpret this table, it should be noticed that the liberal group is          at 11:20 am on the day of the election, they found out they are the
The Web Conference ’19, May 14, 2019, San Francisco, CA A. Deb, L. Luceri, A. Badaway, and E. Ferrara
Top 10 Hashtags
Liberal Conservative
#BlueWave #BrowardCounty
#VoteBlue #MAGA
#MAGA #Broward
#NovemberisComing #RedWave
#TheResistance #VoteRedToSaveAmerica
Bots
#Democrats #StopTheSteal
#Trump #VoteRed
#vote #Democrats
#Florida #Redwavepolls
#GOTV #WednesdayWisdom
#NovemberisComing #BrowardCounty
#VoteBlue #Broward
#BlueWave #MAGA
#vote #IranRegime
#txlege #Tehran
Humans
#electionday #StopTheSteal
#Russia #RedWave
#unhackthevote #PalmBeachCounty
#AMJoy #Redwavepolls
#Trump #Florida
Table 3: Top 10 hashtags: liberals, conservatives, humans, bots
Figure 6: #ivoted tweet from Florida
(3) What we did see in our Twitter collection is early skepticism
that there would be false claims of voter fraud. A user tweeted
"a little over 24 hours from now the Racist in Chief will start
Tweeting about rigged elections, voter fraud and illegal aliens
voting en mass...".
(4) Shortly afterwards, many people started to retweet a user
that stated "Massive voter fraud in Texas Georgia Florida and
others" and also indicating that MSM (main stream media) are
Figure 5: #ivoted tweet from New York putting out fake polls. The Washington Post @washingtonpost
tweeted "without evidence, Trump and Sessions warn of voter
victim of voter fraud. There is no information to suggests this was fraud" which was retweeted throughout election day.
resolved in any meaningful way or if the accusation is substantiated. (5) There was a user who tweeted about voting machine malfunc-
A second example of potential voter issue was found after a tions which mapped to a story/blog from the Atlanta Journal
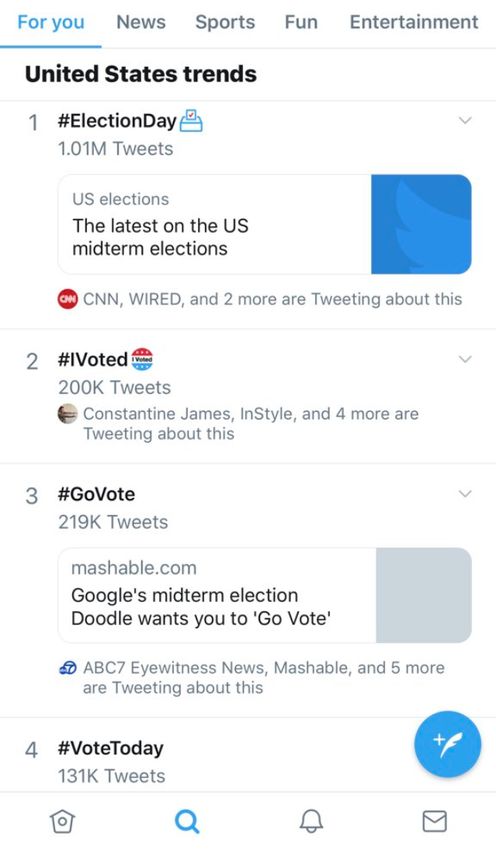
manual inspection of the tweets in New York. The tweet thread in Constitution (https://t.com/riCGdbwQ6R) about machines
Figure 6 is heavily redacted, but it shows an ongoing conversation being down; people left and were encouraged to come back.
through replies and it shows multiple people presenting multiple There was an offer for casting a paper provisional ballot, but
sides. The original tweet was actually posted on 5 November, 2018 many said they did not trust the paper ballot and wanted to
and by the time of our viewing had received a significant number vote on a machine.
of retweets. It is from this original tweet that we see a reply where
the user is complaining that they can not get to the voting booth
without a photo ID. User 3 then asks for the name and number of DISCUSSION & RECOMMENDATIONS
the community and then User 4 provides an election hotline number. Our results have highlighted the challenges of using social media
This indicates that many people today are willing to speculate on in election manipulation analysis. A superficial interpretation of
Twitter, but nothing seems to indicate that they also were going to anomalies in online activity compared to real world data can lead to
the official Department of Justice website to file a complaint. misleading or false conclusions. In our case, we wanted to determine
From our inspection other tweets that are noteworthy include: the feasibility of using social media as a sensor to detect election
manipulation such as widespread voter suppression or voter fraud.
(1) "First time voter in my family registered over a month ago on
While we did not find widespread or systematic manipulation, we
DMV website online not realizing it’s not automated. . . she
learned a few lessons worthy of a discussion:
could not vote. Not right."
(2) "More voter fraud in Ohio. Why is it that all the errors are • Data biases of online platforms can drastically affect the
always the Democrats?? Because the only way they can win feasibility of a study. In our case, we were looking for a
is if they cheat!! This madness needs to stop." representative sample of actual voters who are not bots andPerils and Challenges of Social Media and Election Manipulation The Web Conference ’19, May 14, 2019, San Francisco, CA
Table 4: General Midterms DS3: bot and human population by whose political ideology and location could be known. De-
State (sorted by percent-wise bot prevalence). spite troves of data were collected and analyzed, various
encountered biases could not be adjusted for.
State # of bots # of humans • The second main issue is consistency in the analysis: the
sensitivity to choices made when carrying out data clean-
WY 97 (27.2%) 246 (68.9%)
ing, parameter settings of inference algorithms, etc. yield
ID 258 (23.8%) 791 (73.0%)
a so-called garden of forking paths [27]: some results can
ND 289 (22.9%) 931 (73.9%)
significantly vary in function of such choices (for example,
AZ 1,514 (22.5%) 4,997 (74.2%)
location bias and the removal or retention of retweets played
NV 711 (22.4%) 2,377 (74.8%)
a role in determining whether Texas exhibited a statistical
UT 420 (22.2%) 1,425 (75.4%)
anomaly in terms of expected versus cast votes).
DE 170 (22.1%) 575 (74.9%)
• Political ideologies reported by Gallup significantly vary with
NM 325 (22.1%) 1,100 (74.7%)
respect to that can be inferred on social media. We were un-
NH 283 (22.1%) 968 (75.5%)
able to determine if this is due to limitations of the employed
RI 402 (21.9%) 1,382 (75.3%)
political inference tool, population biases, or other factors.
WV 246 (21.7%) 854 (75.2%)
This is an open problem in social media analysis and a neces-
FL 4,696 (21.5%) 16,583 (75.9%)
sary one to tackle before social media can be used to robustly
MO 932 (21.4%) 3,336 (76.5%)
replace polling.
AL 697 (21.3%) 2,466 (75.4%)
• The actual voting numbers reported by official sources cor-
TN 1,209 (21.3%) 4,369 (76.9%)
related very closely to what we inferred from our analysis
WI 808 (21.3%) 2,900 (76.4%)
on Twitter for 47 of 50 states. As such, the approach seemed
MT 202 (21.0%) 730 (75.9%)
promising to identify voter suppression or fraud. However,
CO 1,144 (20.9%) 4,178 (76.4%)
the results show a more complex picture: no evidence of
NJ 1,311 (20.8%) 4,838 (76.8%)
fraud or suppression beyond anecdotal was found in the three
MS 336 (20.6%) 1,239 (75.9%)
anomalous states under scrutiny. Yet, we suggest that prior
ME 290 (20.6%) 1,093 (77.6%)
and during elections there should be an online social media
CT 571 (20.4%) 2,141 (76.6%)
presence for the Department of Justice to engage with people
SC 769 (20.3%) 2,933 (77.5%)
who have a potential voting issue.
OK 552 (20.2%) 2,098 (76.8%)
KS 661 (20.2%) 2,526 (77.2%) CONCLUSION AND FUTURE WORK
GA 1,962 (20.2%) 7,489 (76.9%)
In this work, we conducted an investigation to analyze social me-
WA 1,561 (19.9%) 6,143 (78.2%)
dia during the 2018 US Midterm election. In addition to studying
NE 323 (19.9%) 1,253 (77.1%)
bots and the political ideology of users, we studied the correlation
AK 160 (19.8%) 622 (77.1%)
between people talking about voting and actual voter data. We then
HI 230 (19.8%) 895 (77.1%)
highlighted a few issues that could lead to inaccurate conclusions. In
PA 1,898 (19.7%) 7,460 (77.6%)
particular, removing or retaining the bots didn’t change the outcome
MI 1,441 (19.6%) 5,714 (77.7%)
of our results. This was not the case in prior studies. However, in our
IA 414 (19.6%) 1,654 (78.2%)
case, removing retweets did make a significant difference for one
VA 1,487 (19.6%) 5,931 (78.1%)
state, Texas, suggesting a dependency, or bias, on location.
MA 1,372 (19.4%) 5,553 (78.4%)
The challenges we faced can all be expanded upon in future work.
NC 1,685 (19.3%) 6,872 (78.5%)
We only mapped a state to 44.7% of DS1 and 30.2% to DS2/DS3. If
IL 1,702 (19.2%) 6,926 (78.0%)
we can evaluate a user timeline to better recognize what state they
IN 885 (19.1%) 3,593 (77.6%)
may be from that would enhance future location based studies. Our
AR 199 (19.1%) 814 (78.0%)
political ideology inference started with the labeling of 38K users
KY 548 (19.0%) 2,270 (78.9%)
leveraging any link they posted, and then labels were propagated on
MN 866 (19.0%) 3,622 (79.6%)
the retweet network. We could potentially identify the users with
OR 1,067 (18.9%) 4,416 (78.3%)
high centrality and evaluate their timeline for party affiliation and
TX 5,550 (18.7%) 23,448 (79.1%)
approach the inference problem from a different angle. We could
OH 1,722 (18.6%) 7,271 (78.7%)
also focus on separating not just human from bot accounts, but
CA 7,073 (18.2%) 30,429 (78.5%)
also human from corporate accounts. Some of the users that were
VT 113 (17.9%) 505 (80.2%)
classified as human could be operating as part of a collective body,
MD 887 (17.8%) 3,963 (79.7%)
that while not necessarily malicious, may insert an inorganic bias.
NY 4,798 (17.5%) 21,896 (79.9%)
Ultimately, one of the goals of this work was to explore the feasi-
LA 708 (15.6%) 3,708 (81.7%)
bility of using social media as a sensor to detect possible election
SD 82 (15.4%) 439 (82.4%)
manipulation at scale: despite our initial effort did not produce the
expected results, we highlighted some useful lessons that will illu-
minate on future endeavors to use such data for social good.The Web Conference ’19, May 14, 2019, San Francisco, CA A. Deb, L. Luceri, A. Badaway, and E. Ferrara
Acknowledgements. The authors gratefully acknowledge support by the Air Force [29] Andrew Guess, Jonathan Nagler, and Joshua Tucker. 2019. Less than you think:
Office of Scientific Research (award #FA9550-17-1-0327). L. Luceri is funded by the Prevalence and predictors of fake news dissemination on Facebook. Science
Swiss National Science Foundation (SNSF) via the CHIST-ERA project UPRISE-IoT. Advances 5, 1 (2019), eaau4586.
[30] Zoltan Hajnal, Nazita Lajevardi, and Lindsay Nielson. 2017. Voter identification
laws and the suppression of minority votes. The Journal of Politics 79, 2 (2017).
REFERENCES [31] Benjamin Highton. 2004. Voter registration and turnout in the United States.
[1] Hunt Allcott and Matthew Gentzkow. 2017. Social media and fake news in the Perspectives on Politics 2, 3 (2004), 507–515.
2016 election. Journal of Economic Perspectives 31, 2 (2017), 211–36. [32] Benjamin Highton and Raymond E Wolfinger. 1998. Estimating the effects of the
[2] Jon-Patrick Allem, Emilio Ferrara, Sree Priyanka Uppu, Tess Boley Cruz, and National Voter Registration Act of 1993. Political Behavior 20, 2 (1998), 79–104.
Jennifer B Unger. 2017. E-cigarette surveillance with social media data: social [33] Philip N Howard, Gillian Bolsover, Bence Kollanyi, Samantha Bradshaw, and
bots, emerging topics, and trends. JMIR public health and surveillance (2017). Lisa-Maria Neudert. 2017. Junk news and bots during the US election: What were
[3] Marina Azzimonti and Marcos Fernandes. 2018. Social media networks, fake news, Michigan voters sharing over Twitter. CompProp, OII, Data Memo (2017).
and polarization. Technical Report. National Bureau of Economic Research. [34] Brian Kim. 2003. Help America Vote Act.
[4] Adam Badawy, Emilio Ferrara, and Kristina Lerman. 2018. Analyzing the Digital [35] Sneha Kudugunta and Emilio Ferrara. 2018. Deep Neural Networks for Bot
Traces of Political Manipulation: The 2016 Russian Interference Twitter Campaign. Detection. Information Sciences 467, October (2018), 312–322.
In Int. Conference on Advances in Social Networks Analysis and Mining. 258–265. [36] David Lazer, Ryan Kennedy, Gary King, and Alessandro Vespignani. 2014. The
[5] Adam Badawy, Kristina Lerman, and Emilio Ferrara. 2018. Who Falls for Online parable of Google Flu: traps in big data analysis. Science 343, 6176 (2014).
Political Manipulation? arXiv preprint arXiv:1808.03281 (2018). [37] Momin M Malik, Hemank Lamba, Constantine Nakos, and Jurgen Pfeffer. 2015.
[6] Christopher A Bail, Lisa P Argyle, Taylor W Brown, John P Bumpus, Haohan Population bias in geotagged tweets. People 1, 3,759.710 (2015), 3–759.
Chen, MB Fallin Hunzaker, Jaemin Lee, Marcus Mann, Friedolin Merhout, and [38] Panagiotis T Metaxas, Eni Mustafaraj, and Dani Gayo-Avello. 2011. How (not) to
Alexander Volfovsky. 2018. Exposure to opposing views on social media can predict elections. In 3rd International Conference on Social Computing. 165–171.
increase political polarization. PNAS 115, 37 (2018), 9216–9221. [39] Lorraine C Minnite. 2017. The myth of voter fraud. Cornell University Press.
[7] Alessandro Bessi and Emilio Ferrara. 2016. Social bots distort the 2016 US [40] Alan Mislove, Sune Lehmann, Yong-Yeol Ahn, Jukka-Pekka Onnela, and J Niels
Presidential election online discussion. First Monday 21, 11 (2016). Rosenquist. 2011. Understanding the Demographics of Twitter Users. ICWSM
[8] Olga Boichak, Sam Jackson, Jeff Hemsley, and Sikana Tanupabrungsun. 2018. (2011).
Automated Diffusion? Bots and Their Influence During the 2016 US Presidential [41] Bjarke Mønsted, Piotr Sapieżyński, Emilio Ferrara, and Sune Lehmann. 2017.
Election. In International Conference on Information. Springer, 17–26. Evidence of Complex Contagion of Information in Social Media: An Experiment
[9] Alexandre Bovet and Hernán A Makse. 2019. Influence of fake news in Twitter Using Twitter Bots. Plos One 12, 9 (2017), e0184148.
during the 2016 US presidential election. Nature communications 10, 1 (2019), 7. [42] Fred Morstatter, Jürgen Pfeffer, Huan Liu, and Kathleen M Carley. 2013. Is
[10] Leo Breiman. 2001. Random forests. Machine learning 45, 1 (2001), 5–32. the Sample Good Enough? Comparing Data from Twitter’s Streaming API with
[11] Jonathan Chang, Itamar Rosenn, Lars Backstrom, and Cameron Marlow. 2010. Twitter’s Firehose. In ICWSM.
ePluribus: Ethnicity on Social Networks. ICWSM 10 (2010), 18–25. [43] Frederick Mosteller and Leonard William Doob. 1949. The pre-election polls of
[12] Zhiyuan Cheng, James Caverlee, and Kyumin Lee. 2010. You are where you 1948. Social Science Research Council.
tweet: a content-based approach to geo-locating twitter users. In CIKM. 759–768. [44] Gordon Pennycook and David G. Rand. 2018. Lazy, not biased: Susceptibility
[13] Aron Culotta. 2014. Reducing sampling bias in social media data for county to partisan fake news is better explained by lack of reasoning than by motivated
health inference. In Joint Statistical Meetings Proceedings. 1–12. reasoning. Cognition (2018).
[14] Clayton A Davis, Giovanni Luca Ciampaglia, Luca Maria Aiello, Keychul Chung, [45] Gordon Pennycook and David G Rand. 2019. Cognitive reflection and the 2016
Michael D Conover, Emilio Ferrara, Alessandro Flammini, Geoffrey C Fox, Xi- US presidential election. Personality and Social Psychology Bulletin 45, 2 (2019).
aoming Gao, Bruno Gonçalves, et al. 2016. OSoMe: the IUNI observatory on [46] Nathaniel Persily. 2017. The 2016 US Election: Can democracy survive the
social media. PeerJ Computer Science 2 (2016), e87. internet? Journal of democracy 28, 2 (2017), 63–76.
[15] Clayton Allen Davis, Onur Varol, Emilio Ferrara, Alessandro Flammini, and [47] Evaggelia Pitoura, Panayiotis Tsaparas, Giorgos Flouris, Irini Fundulaki, Panagio-
Filippo Menczer. 2016. Botornot: A system to evaluate social bots. In Proceedings tis Papadakos, Serge Abiteboul, and Gerhard Weikum. 2018. On Measuring Bias
of the 25th International Conference Companion on World Wide Web. in Online Information. ACM SIGMOD Record 46, 4 (2018), 16–21.
[16] Ritam Dutt, Ashok Deb, and Emilio Ferrara. 2018. “Senator, We Sell Ads”: Anal- [48] Derek Ruths and Jürgen Pfeffer. 2014. Social media for large studies of behavior.
ysis of the 2016 Russian Facebook Ads Campaign. In International Conference Science 346, 6213 (2014), 1063–1064.
on Intelligent Information Technologies. Springer, 151–168. [49] Dietram A Scheufele and Nicole M Krause. 2019. Science audiences, misinfor-
[17] Emilio Ferrara. 2015. Manipulation and abuse on social media. ACM SIGWEB mation, and fake news. PNAS (2019), 201805871.
Newsletter Spring (2015), 4. [50] Chengcheng Shao, Giovanni Luca Ciampaglia, Onur Varol, Kai-Cheng Yang,
[18] Emilio Ferrara, Onur Varol, Clayton Davis, Filippo Menczer, and Alessandro Alessandro Flammini, and Filippo Menczer. 2018. The spread of low-credibility
Flammini. 2016. The rise of social bots. Commun. ACM 59, 7 (2016), 96–104. content by social bots. Nature communications 9, 1 (2018), 4787.
[19] Emilio Ferrara, Onur Varol, Filippo Menczer, and Alessandro Flammini. 2016. [51] Kai Shu, Amy Sliva, Suhang Wang, Jiliang Tang, and Huan Liu. 2017. Fake news
Detection of promoted social media campaigns. In Tenth International AAAI detection on social media: A data mining perspective. ACM SIGKDD Explorations
Conference on Web and Social Media. 563–566. Newsletter 19, 1 (2017), 22–36.
[20] Emilio Ferrara and Zeyao Yang. 2015. Measuring emotional contagion in social [52] Massimo Stella, Emilio Ferrara, and Manlio De Domenico. 2018. Bots increase ex-
media. PloS one 10, 11 (2015), e0142390. posure to negative and inflammatory content in online social systems. Proceedings
[21] Emilio Ferrara and Zeyao Yang. 2015. Quantifying the effect of sentiment on of the National Academy of Sciences 115, 49 (2018), 12435–12440.
information diffusion in social media. PeerJ Computer Science 1 (2015), e26. [53] Onur Varol, Emilio Ferrara, Clayton A Davis, Filippo Menczer, and Alessan-
[22] Daniel Gayo-Avello. 2011. Don’t turn social media into another’Literary Di- dro Flammini. 2017. Online human-bot interactions: Detection, estimation, and
gest’poll. Commun. ACM 54, 10 (2011), 121–128. characterization. In Int. AAAI Conference on Web and Social Media. 280–289.
[23] Daniel Gayo-Avello. 2012. " I Wanted to Predict Elections with Twitter and all [54] Onur Varol, Emilio Ferrara, Filippo Menczer, and Alessandro Flammini. 2017.
I got was this Lousy Paper"–A Balanced Survey on Election Prediction using Early Detection of Promoted Campaigns on Social Media. EPJ Data Science 6,
Twitter Data. arXiv preprint arXiv:1204.6441 (2012). 13 (2017).
[24] Daniel Gayo-Avello. 2012. No, you cannot predict elections with Twitter. IEEE [55] Soroush Vosoughi, Deb Roy, and Sinan Aral. 2018. The spread of true and false
Internet Computing 16, 6 (2012), 91–94. news online. Science 359, 6380 (2018), 1146–1151.
[25] Daniel Gayo-Avello. 2013. A meta-analysis of state-of-the-art electoral prediction [56] Tova Wang. 2012. The politics of voter suppression: Defending and expanding
from Twitter data. Social Science Computer Review 31, 6 (2013), 649–679. Americans’ right to vote. Cornell University Press.
[26] Daniel Gayo Avello, Panagiotis T Metaxas, and Eni Mustafaraj. 2011. Limits of [57] Matthew L Williams, Pete Burnap, and Luke Sloan. 2017. Crime sensing with
electoral predictions using Twitter. In ICWSM. big data: The affordances and limitations of using open-source communications to
[27] Andrew Gelman and Eric Loken. 2013. The garden of forking paths: Why multiple estimate crime patterns. The British Journal of Criminology 57, 2 (2017).
comparisons can be a problem, even when there is no ”fishing expedition” or ”p- [58] Samuel C Woolley and Douglas R Guilbeault. 2017. Computational propaganda
hacking” and the research hypothesis was posited ahead of time. Department of in the United States of America: Manufacturing consensus online. Computational
Statistics, Columbia University (2013). Propaganda Research Project (2017), 22.
[28] Nir Grinberg, Kenneth Joseph, Lisa Friedland, Briony Swire-Thompson, and [59] Kai-Cheng Yang, Onur Varol, Clayton A Davis, Emilio Ferrara, Alessandro Flam-
David Lazer. 2019. Fake news on Twitter during the 2016 U.S. presidential mini, and Filippo Menczer. 2019. Arming the public with AI to counter social
election. Science 363, 6425 (2019), 374–378. bots. Human Behavior and Emerging Technologies 1, 1 (2019).You can also read