THE IMPACT OF COVID-19 MANAGEMENT POLICIES TAILORED TO AIRBORNE SARS-COV-2 TRANSMISSION: POLICY ANALYSIS
←
→
Page content transcription
If your browser does not render page correctly, please read the page content below
JMIR PUBLIC HEALTH AND SURVEILLANCE                                                                                                                 Telles et al

     Original Paper

     The Impact of COVID-19 Management Policies Tailored to
     Airborne SARS-CoV-2 Transmission: Policy Analysis

     Charles Roberto Telles1*, BSc; Archisman Roy2*, BSc; Mohammad Rehan Ajmal3*, PhD; Syed Khalid Mustafa4*,
     PhD; Mohammad Ayaz Ahmad5*, PhD; Juan Moises de la Serna6*, PhD; Elisandro Pires Frigo7*, PhD; Manuel
     Hernández Rosales8*, PhD
     1
      Internal Control Center, Secretary of State for Education and Sport of Paraná, Curitiba, Brazil
     2
      Mathematics Group, Department of Physics, Faculty of Science, Institute of Science, Banaras Hindu University, Varanasi, India
     3
      Department of Biochemistry, Faculty of Science, University of Tabuk, Tabuk, Saudi Arabia
     4
      Department of Chemistry, Faculty of Science, University of Tabuk, Tabuk, Saudi Arabia
     5
      Department of Physics, Faculty of Science, University of Tabuk, Tabuk, Saudi Arabia
     6
      Universidad Internacional de la Rioja, Madrid, Spain
     7
      Federal University of Paraná, Curitiba, Brazil
     8
      Programa Universitario de Estudios Sobre la Ciudad, National Autonomous University of Mexico, Mexico City, Mexico
     *
      all authors contributed equally

     Corresponding Author:
     Charles Roberto Telles, BSc
     Internal Control Center
     Secretary of State for Education and Sport of Paraná
     Av Água Verde, 2140
     Curitiba, 80240-900
     Brazil
     Phone: 55 41996056321
     Email: charlestelles@seed.pr.gov.br

     Related Article:
     This is a corrected version. See correction statement in: https://publichealth.jmir.org/2021/5/e30007

     Abstract
     Background: Daily new COVID-19 cases from January to April 2020 demonstrate varying patterns of SARS-CoV-2 transmission
     across different geographical regions. Constant infection rates were observed in some countries, whereas China and South Korea
     had a very low number of daily new cases. In fact, China and South Korea successfully and quickly flattened their COVID-19
     curve. To understand why this was the case, this paper investigated possible aerosol-forming patterns in the atmosphere and their
     relationship to the policy measures adopted by select countries.
     Objective: The main research objective was to compare the outcomes of policies adopted by countries between January and
     April 2020. Policies included physical distancing measures that in some cases were associated with mask use and city disinfection.
     We investigated whether the type of social distancing framework adopted by some countries (ie, without mask use and city
     disinfection) led to the continual dissemination of SARS-CoV-2 (daily new cases) in the community during the study period.
     Methods: We examined the policies used as a preventive framework for virus community transmission in some countries and
     compared them to the policies adopted by China and South Korea. Countries that used a policy of social distancing by 1-2 m
     were divided into two groups. The first group consisted of countries that implemented social distancing (1-2 m) only, and the
     second comprised China and South Korea, which implemented distancing with additional transmission/isolation measures using
     masks and city disinfection. Global daily case maps from Johns Hopkins University were used to provide time-series data for the
     analysis.
     Results: The results showed that virus transmission was reduced due to policies affecting SARS-CoV-2 propagation over time.
     Remarkably, China and South Korea obtained substantially better results than other countries at the beginning of the epidemic
     due to their adoption of social distancing (1-2 m) with the additional use of masks and sanitization (city disinfection). These
     measures proved to be effective due to the atmosphere carrier potential of SARS-CoV-2 transmission.

     https://publichealth.jmir.org/2021/4/e20699                                                        JMIR Public Health Surveill 2021 | vol. 7 | iss. 4 | e20699 | p. 1
                                                                                                                             (page number not for citation purposes)
XSL• FO
RenderX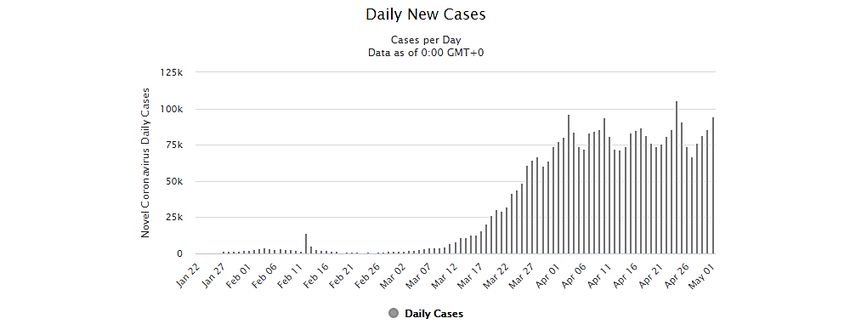
JMIR PUBLIC HEALTH AND SURVEILLANCE                                                                                                    Telles et al

     Conclusions: Our findings confirm that social distancing by 1-2 m with mask use and city disinfection yields positive outcomes.
     These strategies should be incorporated into prevention and control policies and be adopted both globally and by individuals as
     a method to fight the COVID-19 pandemic.

     (JMIR Public Health Surveill 2021;7(4):e20699) doi: 10.2196/20699

     KEYWORDS
     social distancing policies; COVID-19; airborne transmission; convergence and stability properties

                                                                        and policy aspects of managing societal and individual
     Introduction                                                       behaviors.
     Unexpected Forms of Transmission and the Role of                   In this study, geographical regions in Asia, South America,
     Policy                                                             North America, the Middle East, Africa, and Europe were
     The COVID-19 pandemic consistently demonstrated a pattern          analyzed to confirm whether the policies adopted by China and
     of growing community transmission worldwide, even with the         South Korea during the outbreak were the most effective ones
     adoption of social distancing measures (lockdown or voluntarily    in the period of January to April 2020. During this period, only
     shelter in place) in January and early May 2020. The continuing    these two countries had adopted specific policy measures
     transmission of the virus despite the policy measures adopted      addressing the airborne framework of SARS-CoV-2
     in some countries was an important point of debate and             transmission beyond social distancing (mask wearing and city
     investigation in the scientific community and among authorities.   disinfection). These countries also had the lowest daily new
     Unexpected forms of transmission (atmospheric [1-3])               case counts of COVID-19. The relationship between mask
     associated with the social distancing policy became the central    wearing, city disinfection, and the airborne form of transmission
     question for the infectious transmission modeling of               during the period of interest will be used to test the hypothesis
     SARS-CoV-2 and predictive methods.                                 that the virus can be transmitted through the air.

     This research considers the advanced phases of community           Theoretical Analysis of the Nonlinear Properties of
     transmission observed in some countries [4] in a select period.    SARS-CoV-2 Dissemination Patterns
     Due to the increasing numbers of new infections and deaths,        SARS-CoV-2 follows different patterns of transmission among
     monitored by the World Health Organization [4] and Johns           humans [5-7]. These patterns are being investigated not only
     Hopkins University, this research is mainly focused on the         using clinical trials, statistical tools [5-11], and medical
     nonlinear epidemic properties of SARS-CoV-2 transmission.          interviews with patients [9,10], but also from a mathematical
     These nonlinear epidemic properties of transmission can be         point of view, using SIR compartmental models with a high
     understood through the highly random forms of virus                degree of uncertainty. Concerning mathematical predictions of
     transmission associated with human social behavior and with        SARS-CoV-2 reproductive patterns within a complex network
     environmental conditions (physical or aerosol long-range           of human behavior [5], the maximum possible rate of infection
     transmission, airborne transmission). In this research,            with the virus in daily human life [5-8,12,13] consists of a
     nonlinearity refers mainly to the unpredictability of the          community dissemination pattern with an increasing margin of
     epidemiologic framework of the SIR (susceptible, infected,         statistically unpredictable outcomes. The models were still being
     removed) stochastic models used to track the possible rate of      developed due to predictive failures. One specific unpredictable
     infection in the population, even with some policy measures        pattern [14] of the virus spread and dissemination from January
     implemented by countries [5-8]. This limited ability to predict    to April 2020 is visible in the numbers of new infections over
     future rates of contagion was noted during the spread of the       time in countries where the input and output (which is the
     pandemic. It was suggested that the qualitative theory of          number of people who could be infected from an initial number,
     differential equations may be appropriate for identifying the      resulting in maximum and minimum margins of dissemination
     variables, policies, or environmental conditions that influence    of the virus fluctuation) expressed unpredictability. This
     the constant propagation of the virus. The random patterns of      observation was initially and briefly modeled by Koerth et al
     virus reproduction suggest that transmission happens through       [15].
     the air. Other dimensions of research must be considered—the
     social behavior of individuals and the aerosol fluid dynamic       Regarding these nonlinear aspects of infection within countries,
     behavior. This direction of research has yielded unresolved        this study points out that there is evidence for long-range
     mathematical equations that simulate the daily growth of new       airborne transmission [16-18] of SARS-CoV-2. The evidence
     cases. This study defined the aerosol, or biosol, or ground form   consists of the type of policies adopted in China and South
     of transmission as spreading patterns of infection. The policy     Korea from January to April 2020, where a significant reduction
     measure adopted by a country may or may not address these          in infection cases occurred, with distinct patterns found in other
     spreading patterns adequately, which then may sustain (or not)     countries during all epidemic contagion phases. China and South
     dissemination patterns of the virus worldwide. In this way, the    Korea instituted social or physical distancing measures along
     spreading pattern is related to the forms of virus transmission.   with additional methods, such as mask use and city disinfection.
     At the same time, the dissemination of the virus, regardless of    It was one of the main causes of the nontrivial frequency of
     how it can be transmitted, depends on the cultural, personal,      daily new COVID-19 case distribution during the early stage

     https://publichealth.jmir.org/2021/4/e20699                                           JMIR Public Health Surveill 2021 | vol. 7 | iss. 4 | e20699 | p. 2
                                                                                                                (page number not for citation purposes)
XSL• FO
RenderX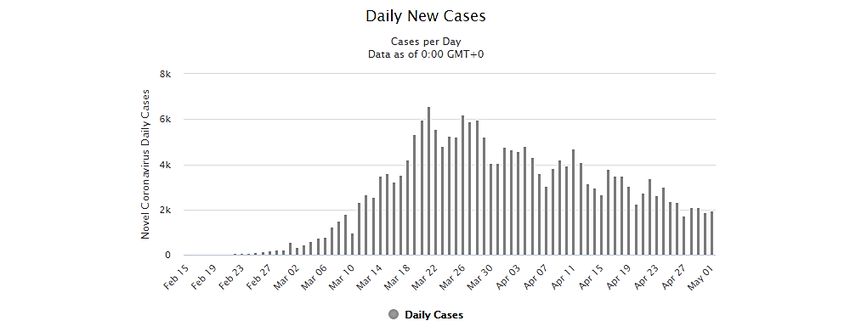
JMIR PUBLIC HEALTH AND SURVEILLANCE                                                                                                       Telles et al

     of the pandemic, up to late April and early May. Physical             between January and April 2020, even with preventive methods
     distancing with an air preventive framework was revealed to           such as social distancing (lockdown or shelter in place) and
     be an urgent need for any country at that time, and, along with       COVID-19 testing.
     social distancing and testing policies, is now one of the main
                                                                           Causes beyond the traditional transmission analysis
     preventive methods used.
                                                                           [5-9,13,24-26] need to be considered to explain the continued
     Recent studies reported that the transmission of SARS-CoV-2           growth of new cases. Other factors for transmission and
     occurs due to proximity to other humans and to social                 modeling patterns should be considered and constructed
     interactions within a set of empirical variables, including the       [12,13,15,27-30] using mathematical counterproof predictions
     most basic forms of human behavior, such as coughing,                 for countries that had already adopted social distancing and had
     sneezing, handshakes, sharing clothes, sharing cups, general          COVID-19 testing available but adopted social physical
     touching, and general object-sharing behaviors [19,20]. This          distancing measures with distinct parameters such as using or
     set of variables influences transmission, together with the           not using masks and city disinfection.
     environmental factors associated with the virus’s possible
     transmission on the ground (surfaces) and in the air (not only
                                                                           Statistical Uncertainty and COVID-19 Prevention
     aerosols in medical facilities but aerosol and biosol formed          Many variables affect virus transmission rates, such as the type
     under atmospheric conditions outdoors). This leads to new             of health policies adopted by each country, public health
     patterns for course epidemiology [12]. Between January and            infrastructure, population genetics, human variance in biological
     April 2020, the World Health Organization confirmed aerosol           resistance, local epidemic outbreaks, globalization aspects,
     transmission only at medical facilities [21], not in outdoor urban    COVID-19 testing availability, virus mutation, and citizens’
     spaces. However, van Doremalen et al [22] stated early on that        adherence to social physical distancing. The influence of these
     human upper and lower respiratory tracts cause the nearby             factors is visible on the Our World in Data webpage [31]. These
     atmosphere to become infected, propagating the virus through          confounding outcomes in each country make it difficult to
     the air. They measured this effect for about 3 hours during an        determine why some countries still have an active virus infection
     experiment and observed low infection reduction over time,            and what would be the best fixed-point orientation (policy
     with infectious titer changing from 103.5 to 102.7 TCID50 (50%        measure) to reduce virus transmission rates. However,
                                                                           worldwide statistical data can provide a relevant confidence
     tissue culture infective dose) for SARS-CoV-2 [22]. An
                                                                           interval analysis if different countries’ policies are compared.
     alternative scientific hypothesis and further probabilistic and
                                                                           This would reveal the best approach for reducing virus
     statistical frameworks were needed to establish new policies
                                                                           infections. At the moment, policy is the most effective way to
     and guide individual preventive actions. Although a scientific
                                                                           reduce COVID-19 cases since no vaccine or drugs have been
     breakthrough occurred early in the pandemic, no policy measure
                                                                           consistently effective for treating the disease or stopping virus
     was announced as definitive, and each country was searching
                                                                           propagation worldwide.
     for preventive methods independently. This is why it is
     worthwhile to compare how some countries reduced                      Research shows that individual behavior and social ties [32-34]
     SARS-CoV-2 transmission with specific social distancing               are still key for controlling the community transmission of the
     measures.                                                             virus through social distancing measures. These measures must
                                                                           consider the dynamics of groups/communities and the
     The analysis of the nonlinear properties of the mathematical
                                                                           community infrastructure (households, buses, shopping malls,
     models and nonpharmaceutical interventions for the COVID-19
                                                                           meetings, markets, daily activities, and human behavior). Note
     epidemiological framework is important not only for medical
                                                                           that the term “social distancing” is used here to describe the
     facilities but also for public policies and health care
                                                                           behavior of an uninfected individual outside medical facilities
     infrastructure. It can help to estimate the disease patterns of
                                                                           and refers only to the population separation patterns based on
     community transmission in a pandemic scenario that affect the
                                                                           ground distances. The term “social physical distancing” refers
     economy and threaten people’s health and survival. This
                                                                           to one of the measures included in the social distancing policies.
     research is also relevant due to the large active workforce trying
     to maintain essential services and sectors necessary for survival,    To explain why the virus continues to be transmitted when social
     such as electrical, water, garbage disposal, energy, food             physical distancing is practiced, it is important to consider that
     supply/production, commerce, and industry.                            social contact might still occur as a human physical connection
                                                                           during environmental socialization; that is, physical ground and
     COVID-19 Transmission Instability                                     atmospheric contact may occur. The policy requires individuals
     Policy that consists of physical distance between individuals         to stay 1 or 2 m apart, assuming that this is enough to prevent
     may fail because the virus may continue to be transmitted in          virus transmission, and has the same effect as sheltering in place
     other unexpected ways. This instability becomes visible when          (mandatory or not). However, with this measure, there are still
     countries that adopt this policy still fail to contain virus spread   many opportunities for social contact within a physical
     due to asymptotic instability between the virus’s potential to        dimension at the ground and atmospheric levels, both indoors
     infect individuals in spite of the policy measures and                or outdoors, as observed in many studies [20,35-39].
     methodology. The unbalancing of this equation is found in a
     wide variety of probability distributions of daily new cases,         We need to theoretically and empirically analyzed two
     with distinct patterns [6-9,12,13,15,19,23] observed in many          parameters, social distancing policy and social transmission
     countries [4]. This may be why new cases continued to occur           isolation, because environmental transmission may play a role

     https://publichealth.jmir.org/2021/4/e20699                                              JMIR Public Health Surveill 2021 | vol. 7 | iss. 4 | e20699 | p. 3
                                                                                                                   (page number not for citation purposes)
XSL• FO
RenderX
JMIR PUBLIC HEALTH AND SURVEILLANCE Telles et al
in recurrent community transmission of SARS-CoV-2. The had required residents to wear masks, and full disinfection had
epidemiological methods of prediction and control (which are been implemented in crowded public spaces [15,53]. There had
needed to estimate the supply of financial, economic, and public been some further concerns from public health professionals,
health resources for the predicted number of infected people) as reported by Li et al [54] and Wong et al [55]. These policy
lose their effectiveness due to certain aspects of social actions converged with the physical distancing criteria and
transmission isolation and SARS-CoV-2’s airborne virulence possible failures, presenting physical transmission isolation
potential [20,35-39]. This new approach diverges from older barriers for airborne transmission (aerosol-biosols and
approaches, such as the one demonstrated by Hellewell et al atmospheric conditions [20,35-39]). Chinazzi et al [56] discussed
[40], since social distancing and social transmission isolation community policy actions regarding airplanes. At this point, a
parameters are different stages under atmospheric conditions, counter effect can be seen despite social physical distancing if
which require further empirical investigation. social activities occur in outdoor spaces without the use of masks
or city disinfection. Therefore, risk continues to be present.
Many recent viral infectious diseases (severe acute respiratory
syndrome [SARS], Middle Eastern respiratory syndrome Social connection might be one of the unobservable factors of
[MERS], H1N1) are transmitted similarly to SARS-CoV-2 [5], transmission if the virus can spread under atmospheric
but they have different rates of exponential growth [41]. conditions [35,36,57-60] and is still active in air fluids
Therefore, it is important to consider not only the causes of [20,35-39]. This would mean that a ground preventive
transmission, such as the chemical and biological properties of framework is insufficient. Most of the recommendations for
transmission and the virus-human biological affinity but also physical distancing issued during that time addressed the virus’s
the emergent virus and human social behavior in the context of potential to spread on the ground and through the air via human
the environment [35-40,42-47]. The nonlinear time series of bodily fluid droplets. Complex air-fluid scenarios without
worldwide policies may present a clue in the form of a high droplets involved (eg, pollution) were not considered.
asymptotic stability (dissemination network) [37] about the type Wickramasinghe et al [57] reported several cases of
of preventive policy measures adopted by each country, as also person-to-person transmission patterns in that period, which
observed previously by Riou and Althaus [48] with the k can be understood as air transmission caused by the lack of
dispersion parameters and the superspreading prediction virus social transmission isolation policies involving additional
possibilities. barriers, such as masks and city disinfection. Similar
observations were made by Cembalest [58], based on a brief
Evidence for Airborne Transmission analysis, and by Pirouz et al [59], based on mathematical
The presence of these epidemiological factors (forms of modeling with a deep analysis of how the atmospheric
transmission, biological-chemical affinities, and emergent social parameters of temperature, humidity, and wind affect the
virus transmission behavior) associated with the preventive population density output for SARS-CoV-2 infection. These
epidemic framework [49], implemented from January to April studies came to the proximal conclusion that atmosphere has a
2020, requires considering any given number of infected strong impact on the patterns of community virus dissemination
individuals as an ongoing pandemic threat, since uncertainty in countries that adopted social physical distancing without
prevails. This led to the conclusion that there was no minimum mask policies and city disinfection. Finally, Poirier et al [60]
range of infected individuals that would classify the local examined the weather conditions capable of generating the full
epidemic as under control. No policy adopted during the period transmission patterns without a social transmission barrier for
of interest was more effective than those of China and South airborne transmission.
Korea. At that time, many authorities thought that the epidemic
would have a natural upper limit and posterior descendant tail Methods
and would end naturally without any human intervention.
However, it has not yet been scientifically proven that the The main goal of this paper is to identify the differences in
pandemic can end naturally or become seasonal. Therefore, this outcomes among countries that adopted physical distancing
theoretical observation should not have been used as a measures in association with mask use and city disinfection
preventive measure at that time. during the period of analysis (January to April 2020). In this
research, the social distancing framework without additional
Concerning the evolution of the pandemic from January to April
measures adopted by some countries represents the main model
2020, one important issue reported in the media is the difference
for the constant reproductive dissemination patterns of
between maintaining social physical distancing and full social
SARS-CoV-2 community transmission.
isolation. Social physical distancing means maintaining physical
distance in restaurants, parks, drugstore lines, household This paper takes an experimental approach to identify limitations
activities, neighborhoods (especially low-income in social distancing policy. Two groups of countries were
neighborhoods), household tree proximity, markets, indoor and selected. The first consisted of countries that adopted social
outdoor social events, windows and balconies, airplanes, ship distancing measures without specifying physical distancing,
balconies, hospital rooms, meetings, delivery or mail activities, mask use, and city disinfection. The second consisted of
prisons, residences, commercial establishments, and industrial countries that adopted all these measures between January and
facilities [50]. Full social transmission isolation, meanwhile, April 2020 (ie, only China and South Korea).
requires ground or atmospheric barriers. News and scientific
reports [51,52] show that most of China and South Korea [51]
https://publichealth.jmir.org/2021/4/e20699 JMIR Public Health Surveill 2021 | vol. 7 | iss. 4 | e20699 | p. 4
(page number not for citation purposes)
XSL• FO
RenderXJMIR PUBLIC HEALTH AND SURVEILLANCE Telles et al
[31]. Countries marked with a superscripted “a” presented the
Results best outcomes for daily new cases during the period investigated.
Empirical Evidence for COVID-19 Transmission The remaining countries in the other group presented
inconsistent outcomes of daily new cases. This constitutes
Instability
empirical evidence of instability in COVID-19 transmission in
Table 1 presents the selected countries and their fluctuations in countries early in the pandemic.
daily confirmed cases in random statistical data samples by date
Table 1. Rolling 3-day average of daily new confirmed cases of COVID-19 among selected countries from March 28-30, April 11-13, and May 1-2,
2020. Source: Our World in Data [31].
Country Rolling 3-day average of new cases
March 28-30 (n=56,337) April 11-13 (n=71,619) May 1-2 (n=60,807)
United States 19,011 32,606↑ 30,399↓
Spain 7536 5054↓ 1149↓
Italy 5717 4283↓ 1974↓
Germany 5003 4092↓ 1354↓
France 3673 3914↑ 1116↓
Iran 2968 1814↓ 1020↓
United Kingdom 2621 6086↑ 5436↓
Turkey 1863 4647↑ 2579↓
Belgium 1534 1538↑ 566↓
Switzerland 1187 703↓ 147↓
Netherlands 1145 1288↑ 458↓
Portugal 806 948↑ 343↓
Canada 746 1342↑ 1682↑
Austria 595 279↓ 72↓
Brazil 447 1600↑ 6567↑
Norway 315 103↓ 51↓
Australia 309 79↓ 9↓
Sweden 298 577↑ 633↑
Denmark 173 198↑ 153↓
Chinaa 110 75↓ 6↓
South Koreaa 110 29↓ 6↓
Finland 87 139↑ 103↓
Singapore 83 225↑ 716↑
Argentina 77 114↑ 135↑
Chile 255 460↑ 881↑
Saudi Arabia 101 367↑ 1340↑
United Arab Emirates 45 359↑ 552↑
Egypt 31 126↑ 284↑
Pakistan 117 238↑ 1076↑
a
Presents the best outcomes of daily new cases during the period investigated.
such as social distancing, COVID-19 testing, and physical
Maximum Exponential Growth and Epidemic Duration distancing criteria, in association with (or without) the use of
in Days masks and city disinfection, from February to May 2020 [61].
The statistical data in Figure 1 show the rise in daily new cases
around the world, along with all policies adopted by countries,
https://publichealth.jmir.org/2021/4/e20699 JMIR Public Health Surveill 2021 | vol. 7 | iss. 4 | e20699 | p. 5
(page number not for citation purposes)
XSL• FO
RenderXJMIR PUBLIC HEALTH AND SURVEILLANCE Telles et al
Many European countries are adopting different measures for in late March and at the start of April. Although many citizens
prevention. However, one specific point beyond social disobeyed institutional orders [63-66], reports indicated a
distancing and COVID-19 testing can be highlighted. As of reduced number of citizens outside their homes. However, daily
April 2020, these countries had still not introduced mask use infection cases were constantly over the population mean of
and/or constant city disinfection, which had been adopted by 30,000 during April for a total of 58 days, from February 28 to
China and South Korea early in the pandemic and continued to April 25, 2020.
be implemented later on. In late March and April [4], the
In Europe [62], and particularly in Italy (Figure 2), where
infection rates in countries such as Italy, Spain, Iran, the United
individuals disobeyed orders to stay at home, these actions could
States, Germany, France, and Brazil were rising, with patterns
have also generated several random transmission outputs. These
different from those of China and South Korea (Table 1). This
specific random aspects contribute to the statistical variance of
was still the case in May 2020.
these countries, including the number of infected people and
In European countries [62], social distancing, COVID-19 testing the mortality rate.
availability, and physical distancing measures were introduced
Figure 1. General overview of all reported cases of COVID-19 worldwide from February to May 2020. Source: Worldometer [61].
Figure 2. New daily cumulative COVID-19 cases in Italy. Note that Italy's mask use policy for the public was introduced by late March and early
April, being this measure carried out until the last date this research was conducted. Source: Worldometer [61].
As shown in Figure 2, in Italy, the number of days of on the virus’ undetected phase of exponential growth; the time
exponential growth represents constant daily infection cases series of these statistical data also show how much time was
with growing patterns, starting from the epidemic outbreak until needed for each country to stabilize its virus infection without
a population mean of 4000 (maximum exponential growth rate the measures adopted by China and South Korea. Observing
for a period of 51 days, from February 22 to April 12, 2020). the preventive measures targeting airborne vectors (masks and
city disinfection) that were adopted as default by China [67]
Many other factors have been discussed to explain why virus
and South Korea [68], the virus social transmission behavior
spread was still rising in these countries, such as availability of
differs from the other analyzed countries.
testing and the date a city first implemented social physical
distancing measures. Besides, it can also have a strong influence
https://publichealth.jmir.org/2021/4/e20699 JMIR Public Health Surveill 2021 | vol. 7 | iss. 4 | e20699 | p. 6
(page number not for citation purposes)
XSL• FO
RenderXJMIR PUBLIC HEALTH AND SURVEILLANCE Telles et al
According to the data provided by Worldometer [67,68], these wave of infection is observed, it will count for this second period
countries had adopted social physical distancing with air with a cumulative time since the outbreak. The second column
preventive measures, with a total of 20 days of maximum t presents how many days the infection presented an exponential
exponential growth rate over a population mean of 250 growth with a maximum mean reached. The third column
(February 19 to March 8, 2020) for South Korea and a total of contains the maximum exponential infection dissemination rate
28 days of maximum exponential growth rate over a population over days, following the theoretical design involving SIR models
mean of 1500 (January 23 to February 18, 2020) for China. and missing gaps of this model for COVID-19.
It is also important to consider exceptions for a possible The approach in the third column has similarities to SIR models,
microdimension of analysis of population biology that can occur but it is based on distinct aspects of analysis of the variables S
in any country, as a local problem [69-71] does not always and R. These variables are removed from the formula, and the
contribute to a high exponential growth rate of virus focus is mainly on variable I, defined by Weibull
transmission. However, although the microdimensions were parameterizations and exponential distributions. This design of
able to produce fluctuations in data, the whole scenario can be analysis has been very relevant due to the instability aspects of
represented by descriptive statistics. SIR analyses done since the disease outbreak, which occur
mainly in the S and R compartments due to infodemics,
One other point concerning China is that its high exponential
uncertainty, the apparent lack of overall topological data
growth was due to the initial conditions of the new disease, and
homology, and other nonlinear aspects of COVID-19. For this
the country needed time to evaluate and adopt policies and
reason, the proposed method of analysis considers only the
scientific measures, as observed by Pan et al [71]. Additionally,
infectious disease aspect of the evolution of cases, rather than
China and South Korea adopted these measures early during
assuming full immunity or using deterministic models for
their local epidemics based on their culture and experience with
population behavior, which in this case is one of the most
past epidemics; other countries were still trying to find
influential factors of propagating the virus.
alternative solutions at that time [63-66].
For this analysis, it was assumed that the observed infected
Compared to other countries, China and South Korea were the
population samples Y=(Y1, …, Yn) experienced the exponential
only true parameter of analysis of these policies. If we were
interested in investigating any of the other numerous policies growth f(Y;λ)=λe–λY, where the samples were taken from zero
adopted by countries for any period of time, a cases to the observed maximum exponential growth mean
country-by-country as well as a policy-by-policy analysis would reached per population ratio for each country, with an unknown
be needed to check the results of each country’s policy. predictive scale of exp λ or maximum likelihood estimator of
However, even without this kind of analysis, China and South λ due to the nonlinear outputs generated for Y with the
Korea clearly presented the best scores for COVID-19 reduction heteroscedasticity form. In this simple form, where the mean
during the period of interest. is defined as y=1/λ, the numerical representation of the ratio
between days and the mean can be obtained by observing the
Maximum Exponential Growth Mean and exponential mean scale until it reaches a form like y=Y, with y
Dissemination Rate Over Time adopted for the calculations with the conditional shape of the
Table 2 shows the exponential growth patterns over time in Weibull parameterization like κJMIR PUBLIC HEALTH AND SURVEILLANCE Telles et al
Table 2. COVID-19 maximum exponential growth patterns per population and time period by country or region from April 7 to May 1, 2020. The y
and t data shown are for May 1, 2020. Data source: Worldometer [61].
Country y t R
April 7 April 13 May 1
Worldwidea 60,000 99 675.67 886.07↑b 606.06↓b
Europea 30,000 91 410.95 379.74↓ 329.67↓
Italy 4000 51 90.90 78.43↓ 78.43=
South Korea 250 20 12.5 12.5=b 12.5=
China 1500 28 53.57 53.57= 53.57=
Iran 2000 46 44.44 43.47↓ 43.47=
Spaina 5000 55 131.57 121.95↓ 90.90↓
France 4000 45 138.88 100↓ 88.88↓
United Statesa 30,000 53 625 540.54↓ 566.03↑
Brazila 5000 51 25 28.57↑ 98.03↑
Germany 4000 41 105.26 100↓ 97.56↓
a 5000 46 15.62 27.02↑ 108.69↑
Russia
United Kingdoma 5000 58 64.51 69.64↑ 86.20↑
Singaporea 500 57 0.96 1.75↑ 8.77↑
Portugal 500 49 15.15 13.15↓ 10.20↓
Indiaa 1000 58 8.33 9.43↑ 17.24↑
Canadaa 1500 48 27.77 24.39↓ 31.25↑
Japana 500 67 3.92 7.14↑ 7.46↑
Swedena 500 58 5.71 0.65↓ 8.62↑
Argentinaa 100 57 1.51 2.56↑ 1.75↓
Chilea 500 52 10 8.33↓ 9.61↑
Saudi Arabiaa 1000 54 3 4.16↑ 18.51↑
United Arab Emiratesa 400 70 4.34 5.76↑ 5.71↓
Egypta 200 62 1.31 2.27↑ 3.22↑
Pakistana 500 53 3.44 5.71↑ 9.43↑
a
Note that at the time of this writing, some countries were at their maximum exponential infection dissemination (different epidemic phases). For these
countries, no final exponential score had been reached yet. However, this does not count for future predictions.
b
↑, ↓, and = denote increase, decrease, and no change, respectively.
Note that in Table 2, some countries present a lower exponential exponential rate was reached before these measures could take
growth rate than China or South Korea. These data need to be effect. In addition, many countries that had adopted measures
considered in the context of when the country’s outbreak started. based on previous experience performed better than the ones
Many countries were also at their maximum exponential growth that were experiencing an epidemic for the first time. However,
at the time the data were collected. For these countries, it is not since they retained active low exponential growth (eg,
possible to judge whether their policies had already helped to Singapore, with a low maximum exponential rate), they did not
flatten the curve of daily new cases, and some of them present reach the same results as China and South Korea with the
active exponential growth; therefore, further future analysis is adoption of additional preventive measures of social
required to compare them to the other countries, as will be distancing/city disinfection and a high reduction of exponential
explained in the following paragraphs. virus spreading patterns. The Singapore scenario has occurred
in many other countries as well. Singapore also presented a rise
China, being the first country to adopt countermeasure policies,
in the maximum exponential growth from 50 (April 7) to 500
experienced some delay, and therefore, the maximum
https://publichealth.jmir.org/2021/4/e20699 JMIR Public Health Surveill 2021 | vol. 7 | iss. 4 | e20699 | p. 8
(page number not for citation purposes)
XSL• FO
RenderXJMIR PUBLIC HEALTH AND SURVEILLANCE Telles et al
(May 2). Germany, Italy, Portugal, Iran, and France presented reach better results by introducing air transmission preventive
a decline in the mean maximum exponential rate reached at the measures.
time the data were retrieved; however, this does not count for
Table 3 clearly displays much of the unpredictability based on
future epidemic behavior to be observed based on a deterministic
nonlinear factors such as the health policies adopted by each
approach.
country, public health infrastructure, population genetics,
Figure 2 and data from reference and news sources [61-68] COVID-19 testing availability, and citizens’ adherence to social
show how long it took for some countries that implemented distancing of any type. These data indicate that further studies
social physical distancing measures plus airborne transmission are still necessary to obtain more accurate numerical results,
preventive methods to flatten the exponential growth of since each country undergoes a period of disease dissemination
community infections. Countries that only applied social with different rates. Although these variances produce large
distancing of any sort without mask use or city disinfection at differences in outcomes, most countries adopted social
the early stages required many more days than other countries distancing as a method of virus spread prevention, with no
that applied airborne transmission prevention measures [63-66]. obligation of social physical distancing, which became a default
Many other scenarios were also observed since policies about pattern for prevention in late February and early March. This
mask use and city disinfection were still in the implementation also contributed to the virus incubation period and caused the
phase in many countries. dissemination rates to increase much more than in China and
South Korea. These results point to the conclusion that while
It is also important to note that in Table 2 the data refer to
many factors influence outcomes, some specific patterns occur
different epidemic phases of data collection for each country.
only in these two countries and in none of the others. By April
These distinct phases are important to consider together because
30, 2020, China and South Korea had shorter epidemic durations
a methodology is needed that can extract the behavior of the
than other countries, stable low disease exponential growth
disease in the nonoptimal (deterministic) evolution of the virus
patterns, and low confirmed case counts per 1 million population
infection and policies adopted by countries. This reveals a
[14].
complex scenario involving the disease dynamics, a confounding
environment, and possible convergence behavior of the policies Table 4 extends this analysis to the period from May 1 to June
adopted to mitigate the disease. 2, 2020.
Maximum Exponential Growth Mean × Time × Cases Between May 1 and June 2, out of the 25 countries analyzed,
per 1 Million Population 11 presented differing infection dissemination patterns, while
14 had a constant evolution of infection that also indicates a
Table 3 compares case counts in the selected countries on May
positive analysis for the predictive statistics, despite the long
1, 2020 [61]. China and South Korea both have low case counts
period of time considered (sensitivity and prediction for 33
per 1 million population, low epidemic duration, and stable
days).
exponential growth. Notably, some countries present lower case
counts per 1 million population, but they all have growing The analysis shows that prediction for a shorter or longer time
patterns of infection propagation, longer epidemic duration, and frame is highly associated with the type of policies adopted by
high exponential growth rate patterns. At the time of the the selected countries as compared to China and South Korea.
analysis, China and South Korea had the best scores for the China and South Korea still had the best results for local
correlation between total cases per 1 million population over epidemic reduction. Notably, Spain and Italy reached a stable
the period of infection and COVID-19 growth pattern stability. point in transmission during the period of analysis through
This is further evidence of the effectiveness of their policies. lockdown measures rather than mask use or city disinfection.
Note that any range of analysis to be performed will have its However, while lockdowns helped them reach the same status
values of time and maximum exponential mean modified as China and South Korea, these policy measures worked
according to the selection taken. The higher the range, the better differently. The first difference is the time it took to reach
the R precision. stability. For China and South Korea, it was approximately 28
and 20 days, respectively. On the other hand, Spain and Italy
Even with good scores, some countries did not have optimal
took 55 and 51, respectively. While the lockdown was active
values for all the columns in Table 3 and presented an
and no mass mask use was mandatory, the time it took to reach
exponential growth rate, as of May 1, 2020. Although many of
the peak and flatten the curve was higher in these countries.
these countries are located close to China and South Korea, they
Resurgences of infection also occurred, and it was difficult to
do not match these countries’ later results; several factors
reach a very low mean of daily new cases after the curve was
influenced the oscillations and differences in the numbers.
flattened [61]. This suggests that lockdown measures alone were
Notably, Argentina had the best score in South America and
not enough to flatten the curve to the level of China and South
was ahead of many other regions worldwide. Voluntarily and
Korea. Gradually, these countries, as well as many others, started
later obligatory mask use and city disinfection took Argentina
to use masks and carry out city disinfection in May, June, and
to the same epidemic scenario as China and South Korea,
July 2020.
leading to successful results. The United Arab Emirates and
Portugal, with their decreasing exponential growth rate, could
https://publichealth.jmir.org/2021/4/e20699 JMIR Public Health Surveill 2021 | vol. 7 | iss. 4 | e20699 | p. 9
(page number not for citation purposes)
XSL• FO
RenderXJMIR PUBLIC HEALTH AND SURVEILLANCE Telles et al
Table 3. Countries with COVID-19 dissemination and total infected cases per 1 million population, as of May 1, 2020. Data source: Worldometer [61].
Country Total cases, N Total cases per 1 million population t R on May 1
United States 1,159,430 3503 53 566.03↑a
Italy 209,328 3462 51 78.43=a
Chinab 82,875 58 28 53.57=
Spain 245,567 5252 55 90.90↓a
Germany 164,967 1969 41 97.56↓
Iran 96,448 1148 46 43.47=c
France 168,396 2580 45 88.88↓
United Kingdom 182,260 2685 58 86.20↑
Sweden 22,082c 2186 58 8.62↑c
India 39,699c 29c 58 17.24↑c
Japan 14,305c 113c 67 7.46↑c
South Koreab 10,780 210 20 12.50=
Russia 124,054 850 46 108.69↑
Singapore 17,548c 2999 57 8.77↑c
Portugal 25,190c 2470 49 10.20↓c
Canada 56,714c 1503 48 31.25↑c
Brazil 96,559 454 51 98.03↑
Argentina 4532c 100c 57 1.75↓c
Chile 18,435c 964 52 9.61↑c
Saudi Arabia 25,459c 731 54 18.51↑c
United Arab Emirates 13,599c 1375 70 5.71↓c
Egypt 6193c 61c 62 3.22↑c
Pakistan 19,022c 86c 53 9.43↑c
a
↑, ↓, and = denote increase, decrease, and no change, respectively.
b
Indicate the best scores reached by China and South Korea.
c
Indicates countries that reached the best score compared to China and South Korea.
https://publichealth.jmir.org/2021/4/e20699 JMIR Public Health Surveill 2021 | vol. 7 | iss. 4 | e20699 | p. 10
(page number not for citation purposes)
XSL• FO
RenderXJMIR PUBLIC HEALTH AND SURVEILLANCE Telles et al
Table 4. COVID-19 maximum exponential growth patterns per population and time period by country or region from May 1 to June 2, 2020. Data
source: Worldometer [61].
Country R
May 1 June 2
Worldwide 606.06↓a 572.51↓
Europe 329.67↓ 162.60↓
Italy 78.43= a 78.43=
South Koreab 12.50= 0.09↓a
China 53.57= 53.57=
Iranb 43.47= 25.64↓
Spain 90.90↓ 90.90=
France 88.88↓ 3.89↓
United Statesb 566.03↑ 235.29↓
Brazil 98.03↑ 180.72↑
Germany 97.56↓ 2.73↓
Russiab 108.69↑ 96.15↓
United Kingdomb 86.20↑ 22.22↓
Singaporeb 8.77↑ 5.61↓
Portugal 10.20↓ 1.85↓
India 17.24↑ 64.44↑
Canadab 31.25↑ 9.37↓
Japanb 7.46↑ 0.30↓
Swedenb 8.62↑ 6.66↓
Argentinab 1.75↓ 6.17↑
Chile 9.61↑ 41.66↑
Saudi Arabiab 18.51↑ 17.44↓
United Arab Emirates 5.71↓ 5.39↓
Egypt 3.22↑ 7,.44↑
Pakistan 9.43↑ 23.52↑
a
↑, ↓, and = denote increase, decrease, and no change, respectively.
b
Countries that presented a different behavior of infection dissemination compared to that observed on May 1, 2020, the start date of the analysis.
aim to produce statistical numerical results involving all these
Discussion variables, due to the likely lack of significance of data
Principal Findings correlation (heteroscedasticity) for demonstrating that the results
presented in this paper are due only to the selected type of policy
The nonlinear aspects and variables of COVID-19 transmission interventions. All the nonlinear aspects mentioned affect
and prevention require multiple factors to be considered, such epidemics in different ways. However, we focused on three
as health infrastructure facilities, new design of aspects: the amount of time that has passed since the infection
workflows/structures to prevent infection in health facilities, has occurred; what the maximum infected population range
type and availability of personal protective equipment, public was; and how many people per million have been infected.
health policies adopted by each country, population genetics, These questions address specific preventive measures, and in
COVID-19 testing availability and rapid response, social this context, the type of policy analyzed can be considered the
distancing, economic activities in some essential and main countermeasure. Therefore, statistical analysis with
nonessential sectors, government policies for supporting the numerical results is unlikely to provide any important
population and survivability, citizens’ collaboration with information about community transmission in terms of
policies, and other public health and social policies. We did not
https://publichealth.jmir.org/2021/4/e20699 JMIR Public Health Surveill 2021 | vol. 7 | iss. 4 | e20699 | p. 11
(page number not for citation purposes)
XSL• FO
RenderXJMIR PUBLIC HEALTH AND SURVEILLANCE Telles et al
seasonality due to the limited time period for which the data However, an overview of the nonparametric data was provided
were available and to the nonlinear properties of the variables to assess the types of policies investigated in this research for
necessary for predicting daily new virus cases in each country. a seasonal forcing behavior with a strong influence on the
For this reason, the influence of policies on daily new cases was overall scenario. While this research did not focus on statistical
roughly described by filtering out other factors that were numerical results for all relevant variables, these inferences
unlikely to accommodate the nonlinear scenario of the disease. were done in terms of the conceptualization of z and P value
The results show that policies directly affected the population; tests, SD, variance analysis, and linear regression analysis of
they can also influence many of the nonlinear sets of variables the policies in selected countries, as shown schematically in
described earlier (a convergence aspect of higher-order Figure 3.
nonautonomous functions).
Figure 3. Representative scheme of SARS-CoV-2 reproductive patterns among countries whose policies might or might not converge toward a very
low maximum exponential rate of infection per population/days. Note that countries with a low maximum exponential rate (Table 2) also present active
infection patterns, with this feature being a nonconvergence of the type of policies adopted and, hence, expressing an exponential probability of infection
constant growth (false null hypothesis).
Figure 3 shows that the nonlinear behavior of COVID-19, with new cases and maximum time for exponential infection growth.
preventive policies as mandatory measures to be adopted. The results show true differences between the policies adopted
Although many policies do not stop virus dissemination entirely and the parameters mentioned earlier; however, future studies
at the minimum rate, the results demonstrate that China’s and from this point of view are needed.
South Korea’s policies might be more successful at keeping the
Furthermore, while the variance observed in daily new cases
virus exponential growth at a low rate.
among countries over the period of interest was produced by
The COVID-19 event was analyzed from a theoretical point of different factors in each country, points of convergence (the
view using the qualitative theory of differential equations policy type fixed-point theoretical approach) are considered
framework to understand how the input of many variables and stable from a policy analysis point of view and have high
output in terms of convergence and stability of the policies stability (COVID-19 reduction) in many solutions obtained
adopted by each country could yield visible differences in daily from the confounding environment. Even with high variance
https://publichealth.jmir.org/2021/4/e20699 JMIR Public Health Surveill 2021 | vol. 7 | iss. 4 | e20699 | p. 12
(page number not for citation purposes)
XSL• FO
RenderXJMIR PUBLIC HEALTH AND SURVEILLANCE Telles et al
produced by other variables that influence COVID-19 Conclusions
transmission, these fixed-point stable parameters can create a This study theoretically and empirically investigated preventive
confidence region of statistical analysis by reducing the measures in different countries; the results show that virus
maximum exponential growth of the virus over time; therefore, transmission patterns are closely linked with human social
it could be more conclusive than many mathematical infectious behavior and the environmental airborne transmission of
disease models (SIR stochastic or deterministic approaches) SARS-CoV-2. Therefore, countries should adopt preventive
developed since the beginning of the epidemic and later policy measures and control individual behavior.
pandemic dissemination. Official, preassumed forms of social
physical distancing measures were adopted to avoid COVID-19 Countries that adopted policy measures based on evidence of
transmission during that time, and the possible new patterns of the atmospheric transmission of COVID-19 reported shorter
atmospheric disease transmission may constitute a previously local epidemic duration, fewer cases per 1 million population,
unobserved, continuous (not discretized) form of transmission a lower maximum exponential growth mean rate per population,
(partially unpredictable) due to airborne instability properties. and a lower rate of the COVID-19 daily new cases over time.
These time-varying, unresolved empirical data have been Looking at policy measures holistically, social physical
presented roughly, since this paper evaluated the entire epidemic distancing and COVID-19 testing availability are mandatory
scenario with aggregated data. for any country’s policy since they are the most reliable and
These results, from January to April 2020 [72], demonstrates convergent ways to reduce community virus transmission and
that even 20 infected individual hosts can constitute a risk of flatten the curve. Concerning the transmission isolation observed
propagating the disease [48]. This was observed by the end of in China and South Korea and the superspreading patterns
March in China and Japan when the policies adopted by observed in other countries from January to April 2020, the
successful countries were eased. Nevertheless, the statistical results show full convergence of nonlinear variables for higher
data presented in this research strongly suggest that social virus infection reduction affecting the input-output of
distancing fails in some countries, but succeeds in others because SARS-CoV-2 propagation over time with the adoption of
of the additional use of masks and city disinfection. COVID-19 testing availability and social physical distancing
by 1- 2 m, along with the additional use of masks and
The asymptotic instability aspect of the statistical data in Figure sanitization (city disinfection). Remarkably, China and South
2, as well as data from internet sources [61-68], yields lower Korea adopted these policy measures early in the pandemic, in
infection rates for some countries (China and South Korea) and contrast to other countries. Due to these measures, China and
exponential infection rates for others. This can be explained as South Korea obtained better results in controlling the local
the virus asymptote transmission behavior of the emergent epidemic.
phenomenon [35-39,73,74] caused by community behavior [75]
based on social distancing failures in most of the countries, The results observed in South Korea are consistent with those
while the use of masks and city disinfection in China and South of China. Other countries that did not follow use masks or
Korea yielded the best results in reducing disease spread and perform city disinfection presented high nonlinear outputs of
dissemination patterns. SARS-CoV-2 transmission; a common feature for these
countries was the constant growth in new infection cases day
While this research was being conducted, the daily new cases by day even with the use of social physical distancing measures.
in European countries started declining (March 31, 2020). This This observation suggests that the virus can be transmitted
can be attributed to the effect of the social physical distancing beyond the recommended distance of 1 or 2 m. This was
policy. However, China and South Korea used different confirmed by Liu et al [15] in April 2020 and by Morawska et
measures based on previous experience. The maximum range al [3] in July 2020. The use of masks and city disinfection
of infection reduction with only social physical distancing is appears to be the best strategy for reducing SARS-CoV-2 spread
limited, since many workforce sectors are still active. Therefore, patterns (forms of transmission) and dissemination patterns
this research suggests that active citizens should use masks [75], early in the worldwide pandemic.
and countries should start to disinfect public spaces, including
public transport vehicles and routes. These measures will require Another important point is that if COVID-19 testing is not fully
the introduction of policies to relax the lockdown in cities by available, social physical distancing measures along with the
strategically and gradually allowing the population outside their use of masks and city disinfection can help prevent spread, since
homes with additional new social distancing preventive methods. they help to isolate undetected infected individuals (including
asymptomatic cases), prevent airborne transmission, and protect
Digital behavior (infodemics) [76,77] was not considered here, uninfected people from environmental transmission.
despite its potentially high influence on virus transmission due
to misinformation and misuse of scientific information. This is While this research was being conducted in April and early
a limitation of this research, since even if a country has adopted May, some European countries analyzed in this study
all the necessary measures, its citizens can undermine it. This implemented city disinfection, mask use, and lockdowns, which
factor should be considered case by case, and it does not likely helped to reduce the airborne transmission of
significantly contradict the results. SARS-CoV-2. In addition, in Brazil, the most basic physical
distancing policy was ignored by many citizens and publicly
ignored by the country’s president. This may be why Brazil had
the third highest number of confirmed COVID-19 cases in the
https://publichealth.jmir.org/2021/4/e20699 JMIR Public Health Surveill 2021 | vol. 7 | iss. 4 | e20699 | p. 13
(page number not for citation purposes)
XSL• FO
RenderXJMIR PUBLIC HEALTH AND SURVEILLANCE Telles et al
world on September 9, 2020, and has, as of March 2021, a mean rate of more than 2500 COVID-19 deaths daily.
Acknowledgments
We would like to thank Henrique Lopes from the Association of Schools of Public Health in the European Region for the insightful
conversations about policies and COVID-19 as well as Vlademir Fazio Santos from the University of Campinas for the motivation
to continue this research. We would like to thank all journals that have made COVID-19 research free to read, responding the
call to action from the US Office of Science and Technology Policy and other governments. The policy action was vital for
researchers around the world to publish new discoveries about the virus.
Conflicts of Interest
None declared.
References
1. Liu Y, Ning Z, Chen Y, Guo M, Liu Y, Gali NK, et al. Aerodynamic analysis of SARS-CoV-2 in two Wuhan hospitals.
Nature 2020 Jun 27;582(7813):557-560. [doi: 10.1038/s41586-020-2271-3] [Medline: 32340022]
2. Lin K, Marr LC. Humidity-Dependent Decay of Viruses, but Not Bacteria, in Aerosols and Droplets Follows Disinfection
Kinetics. Environ Sci Technol 2020 Jan 21;54(2):1024-1032. [doi: 10.1021/acs.est.9b04959] [Medline: 31886650]
3. Morawska L, Milton DK. It Is Time to Address Airborne Transmission of Coronavirus Disease 2019 (COVID-19). Clin
Infect Dis 2020 Dec 03;71(9):2311-2313 [FREE Full text] [doi: 10.1093/cid/ciaa939] [Medline: 32628269]
4. Coronavirus disease 2019 (COVID-19) Situation Report – 68. World Health Organization. 2020 Mar 28. URL: https://www.
who.int/docs/default-source/coronaviruse/situation-reports/20200328-sitrep-68-covid-19.pdf?sfvrsn=384bc74c_8 [accessed
2021-04-08]
5. Wu JT, Leung K, Leung GM. Nowcasting and forecasting the potential domestic and international spread of the 2019-nCoV
outbreak originating in Wuhan, China: a modelling study. The Lancet 2020 Feb;395(10225):689-697. [doi:
10.1016/S0140-6736(20)30260-9] [Medline: 32014]
6. Manzo G. Complex Social Networks are Missing in the Dominant COVID-19 Epidemic Models. Sociologica 2020 May
20;14(1):31-49 [FREE Full text] [doi: 10.6092/issn.1971-8853/10839]
7. Merchant H. CoViD-19 may not end as predicted by the SIR model. The BMJ 2020 Apr 21;369:1-2 [FREE Full text]
8. Adam D. Special report: The simulations driving the world's response to COVID-19. Nature 2020 Apr;580(7803):316-318.
[doi: 10.1038/d41586-020-01003-6] [Medline: 32242115]
9. Chen N, Zhou M, Dong X, Qu J, Gong F, Han Y, et al. Epidemiological and clinical characteristics of 99 cases of 2019
novel coronavirus pneumonia in Wuhan, China: a descriptive study. The Lancet 2020 Feb 15;395(10223):507-513. [doi:
10.1016/S0140-6736(20)30211-7] [Medline: 32007143]
10. Huang C, Wang Y, Li X, Ren L, Zhao J, Hu Y, et al. Clinical features of patients infected with 2019 novel coronavirus in
Wuhan, China. The Lancet 2020 Feb;395(10223):497-506. [doi: 10.1016/s0140-6736(20)30183-5]
11. Liu T, Hu J, Kang M, Lin L, Zhong H, Xiao J, et al. Transmission Dynamics of 2019 Novel Coronavirus (2019-nCoV).
SSRN Journal. Preprint posted online Feb 5, 2020 [FREE Full text] [doi: 10.2139/ssrn.3526307]
12. Jia P, Dong W, Yang S, Zhan Z, Tu L, Lai S. Spatial Lifecourse Epidemiology and Infectious Disease Research. Trends
Parasitol 2020 Mar;36(3):235-238 [FREE Full text] [doi: 10.1016/j.pt.2019.12.012] [Medline: 32044243]
13. Findlater A, Bogoch II. Human Mobility and the Global Spread of Infectious Diseases: A Focus on Air Travel. Trends
Parasitol 2018 Sep;34(9):772-783 [FREE Full text] [doi: 10.1016/j.pt.2018.07.004] [Medline: 30049602]
14. Coronavirus (COVID-19) cases. Our World in Data. URL: https://ourworldindata.org/covid-cases [accessed 2021-04-09]
15. Koerth M, Bronner L, Mithani J. Why it's so freaking hard to make a good COVID-19 model. ABC News: FiveThirtyEight.
2020 Mar 31. URL: https://fivethirtyeight.com/features/why-its-so-freaking-hard-to-make-a-good-covid-19-model/ [accessed
2021-04-08]
16. Cheng VCC, Wong S, Chen JHK, Yip CCY, Chuang VWM, Tsang OTY, et al. Escalating infection control response to
the rapidly evolving epidemiology of the coronavirus disease 2019 (COVID-19) due to SARS-CoV-2 in Hong Kong. Infect
Control Hosp Epidemiol 2020 May 05;41(5):493-498 [FREE Full text] [doi: 10.1017/ice.2020.58] [Medline: 32131908]
17. Wang Q, Yu C. The role of masks and respirator protection against SARS-CoV-2. Infect Control Hosp Epidemiol 2020
Jun 20;41(6):746-747 [FREE Full text] [doi: 10.1017/ice.2020.83] [Medline: 32192550]
18. Chu D, Duda S, Solo K, Yaacoub S, Schunemann H. Physical distancing, face masks, and eye protection to prevent
person-to-person transmission of SARS-CoV-2 and COVID-19: a systematic review and meta-analysis. J Vasc Surg 2020
Oct;72(4):1500. [doi: 10.1016/j.jvs.2020.07.040]
19. Isolation Precautions: Personal Protective Equipment. Elsevier. URL: https://www.elsevier.com/__data/assets/pdf_file/
0004/974623/Isolation-Precautions_Personal-Protective-Equipment.pdf [accessed 2020-02-14]
20. Rational use of personal protective equipment for coronavirus disease (COVID-19): interim guidance, 27 February 2020.
World Health Organization. 2020 Feb 27. URL: https://apps.who.int/iris/handle/10665/331215 [accessed 2021-04-12]
https://publichealth.jmir.org/2021/4/e20699 JMIR Public Health Surveill 2021 | vol. 7 | iss. 4 | e20699 | p. 14
(page number not for citation purposes)
XSL• FO
RenderXYou can also read